
 Submit a Paper
 Propose a Special lssue
 Open Access
ARTICLE

Network Intrusion Traffic Detection Based on Feature Extraction
1 College of Information Science and Engineering, Xinjiang University, Urumqi, 830046, China
2 Network Department, China Mobile Communications Group Xinjiang Co, Ltd. Urumqi, Urumqi, 830011, China
3 Xinjiang Signal Detection and Processing Key Laboratory, Xinjiang University, Urumqi, 830000, China
* Corresponding Author: Zhenhong Jia. Email:
Computers, Materials & Continua 2024, 78(1), 473-492. https://doi.org/10.32604/cmc.2023.044999
Received 14 August 2023; Accepted 08 November 2023; Issue published 30 January 2024
 View Full Text
 Download PDF
Abstract
With the increasing dimensionality of network traffic, extracting effective traffic features and improving the identification accuracy of different intrusion traffic have become critical in intrusion detection systems (IDS). However, both unsupervised and semisupervised anomalous traffic detection methods suffer from the drawback of ignoring potential correlations between features, resulting in an analysis that is not an optimal set. Therefore, in order to extract more representative traffic features as well as to improve the accuracy of traffic identification, this paper proposes a feature dimensionality reduction method combining principal component analysis and Hotelling’s T2 and a multilayer convolutional bidirectional long short-term memory (MSC_BiLSTM) classifier model for network traffic intrusion detection. This method reduces the parameters and redundancy of the model by feature extraction and extracts the dependent features between the data by a bidirectional long short-term memory (BiLSTM) network, which fully considers the influence between the before and after features. The network traffic is first characteristically downscaled by principal component analysis (PCA), and then the downscaled principal components are used as input to Hotelling’s T2 to compare the differences between groups. For datasets with outliers, Hotelling’s T2 can help identify the groups where the outliers are located and quantitatively measure the extent of the outliers. Finally, a multilayer convolutional neural network and a BiLSTM network are used to extract the spatial and temporal features of network traffic data. The empirical consequences exhibit that the suggested approach in this manuscript attains superior outcomes in precision, recall and F1-score juxtaposed with the prevailing techniques. The results show that the intrusion detection accuracy, precision, and F1-score of the proposed MSC_BiLSTM model for the CIC-IDS 2017 dataset are 98.71%, 95.97%, and 90.22%.Keywords
Network traffic intrusion detection is mainly used for detecting network traffic anomalies and preventing malicious requests. With the gradual increase in network data traffic, the dimensionality of the traffic is increasing, which is causing some difficulties in traffic classification. While the traffic becomes more characteristic, we can analyze it in more detail. However, it also poses two problems. The first problem is that the proliferation of relevant features leads to the generation of useless and redundant features and increasingly longer training times. The second issue is that not all features are valuable in describing the flow, which may also lead to bias in the classification step. Therefore, feature extraction holds an important position in network traffic intrusion and network traffic classification.
With the progression of machine learning, the exploration of intrusion detection is also evolving rapidly. Machine learning can be easily embedded in network intrusion detection systems. Modern network intrusion detection systems analyze network traffic based on a number of characteristics, such as the distribution of arrival times, packet sizes, specific TCP/IP flags, and the percentage of backward and forward flows. This information is very helpful for anomalous traffic detection, but in many cases, traditional signature-based identification techniques do not detect these features. The classification methods for feature extraction can be classified as supervised [1], unsupervised and semisupervised [2]. The supervised approach is to select a subset of features using the labeled data and measure the importance of the features by specific criteria. In contrast, unsupervised methods do not require knowledge of the intrinsic structure of the data and do not assume any a priori knowledge to select important features. Semisupervised learning is a hybrid-based approach that improves the results of feature extraction by representing some unlabeled features based on some labeled data.
In unsupervised and semisupervised approaches, Salo et al. [3] proposed a hybrid algorithm that combines information gain and principal component analysis for the analysis of irrelevant features in the dataset. Several integrated classifiers are used, which provide good performance in terms of accuracy and time. Pan et al. [4] introduced an unsupervised end-to-end deep learning system based on the Reuben Software Modeling Tool (RSMT) that automatically monitors and simultaneously describes the behavior of web applications at runtime. However, the results tested using a supervised type of classification method were poor. Yao et al. [5] proposed a multistage semisupervised intrusion detection system to improve the recall rate using the KDDcup99 dataset. This model shows a great improvement in recognition ability and accuracy in unknown cases; however, the flexibility of hyperparameter selection for this model is insufficient. A semisupervised feature grouping method based on the union of the linear correlation value and cuttlefish method was suggested by Mohammadi et al. [6]. The KDDcup99 dataset was used to evaluate the entire system, and despite the fact that the percentage of false positives was substantially lower, the training period was lengthy. A semisupervised anomaly detection system based on the least squares approach and a multivariate statistical network detection algorithm was proposed by Camacho et al. [7]. The system’s experimental findings, which were based on actual traffic data, indicate that the approach has some potential applications. Dong et al. [8] proposed a semi-supervised Double Deep Q-Network (SSDDQN)-based optimization method for network abnormal traffic detection, it has lower model complexity, but it has almost no detection ability to detect the lowest number of U2R abnormal attack traffic. However, both semisupervised and unsupervised methods have the disadvantage of ignoring the correlation between features, which results in nonoptimal analysis.
In the supervised approach, to increase the precision of intrusion detection, Li et al. [9] developed the density peak nearest neighbor (DPNN) classifier based on the fundamental concepts of k-nearest neighbor (KNN) and density peak clustering (DPC). According to experimental findings, DPNN performs better than other classifiers in terms of average precision and effectiveness; however, it is unable to recognize U2R assaults. Xue et al. [10] demonstrated that KNN as an evaluation function can effectively deal with the difficult feature selection problem, and the algorithm is superior in terms of classification accuracy over other algorithms but is not applicable to the multiobjective feature domain. Gu et al. [11] employed support vector machines (SVMs) to construct intrusion detection models that are sturdy in terms of precision, training velocity, and false alarm frequency. Though, the writers of this manuscript only probed the binary categorization instance of the intrusion detection dilemma. In addition, Kabir et al. [12] proposed an optimal assignment-based least squares support vector machine (OA-LSSVM), which can be used for both static and incremental data but has low accuracy in identifying intrusion traffic for the U2R category.
Both unsupervised and semisupervised methods suffer from the disadvantage of ignoring potential associations between features, resulting in an analysis that is not the optimal set. However, this can be crucial when dealing with traffic analysis, as we have to consider not only statistical-based features but also deterministic features. Alternatively, supervised methods can provide optimal results when the data is correctly marked. Additionally, intrusion detection usually occurs in controlled networks, where the type of traffic data passing through can be automatically marked with the help of a network analyzer. On the other hand, the dataset used for most intrusion detection model tests is the old KDDcup99 dataset.
Therefore, to solve the above problems, this paper proposes for the first time a new dimensionality reduction method and a bidirectional long and short-term memory model with multilayer convolution. In the dimensionality reduction method, first, the numerical and normalized dataset is dimensioned down using PCA, after which Hotelling’s T2 test is used to further obtain more representative data, and then the data are input for training into the model presented in this paper. To evaluate the model proposed in this paper, the CIC-IDS2017 dataset is used, which contains benign and up-to-date common attacks, similar to real-world data (PCAPs). Compared to the literature, the main contributions of this paper are as follows:
(1) We proposed a feature extraction model that combines PCA and Hotelling’s T2, which can select features that are more representative with better category differentiation and stronger correlation with category labels.
(2) We proposed an improved algorithm for BiLSTM modeling. A two-layer convolutional network is used, and L2 regularization is used to effectively prevent overfitting of the model, followed by a flattened layer that flattens the two-dimensional tensor of the LSTM output into a one-dimensional vector for the fully connected layer. The detection accuracy is effectively improved.
The rest of the paper is organized as follows: Section 2 describes the work related to this paper, Section 3 focuses on the methodology used in this paper and the structure of the model, Section 4 focuses on the data preprocessing and the results of the data after feature extraction, Section 5 discusses the experimental results and the results of evaluating the model proposed in this paper, and finally, in Section 6, it summarizes the work of this paper and gives the direction of the possible improvements.
Dimensionality reduction-based anomaly detection methods are usually based on the assumption of intercorrelation of normal data features and attempt to find the best description of the normal data subspace and then project the data into that best subspace, and those with large reconstruction errors will be identified as anomalous traffic [13]. Chen et al. [14] introduced PCA-based dimensionality reduction, which was verified to be useful in network intrusion detection, but PCA dimensionality reduction is a linear transformation that often fails to capture the nonlinear correlation between its features when confronted with complex and redundant network traffic data. Therefore, this paper uses a combination of PCA and Hotelling’s T2 for feature extraction, and the extracted features have better discrimination.
Liu et al. [15] proposed the use of an independent component analysis (ICA) algorithm to extract features and eliminate redundant features so that the model has better feature learning ability and more accurate classification ability. Binbusayyis et al. [16] presented an unsupervised deep learning methodology for intrusion detection, integrating autoencoders (1D CAE) and a class of support vector machines (OCSVM) as classifiers in an IDS for the first time. Su et al. [17] proposed a traffic anomaly detection model called BAT. The BAT model combines BiLSTM and an attention mechanism to improve anomaly detection effectively. Nirmala et al. [18] proposed an intrusion detection method based on stacked expansive Convolutional Neural Networks (CNNs), and the proposed method can self-sufficiently learn the important features of a large amount of unlabeled raw traffic data.
Alsulami et al. [19] introduced an automatic labeling algorithm founded on self-augmentation and a consolidated categorization approach that can accurately and efficiently perceive and categorize network traffic assaults, but its running time is long. Saeed et al. [20] proposed a hybrid model for real-time group-based network intrusion detection for streaming data. They evaluated it on the NSL-KDD and KDDcup99 datasets and finally identified 16 features that have significant contributions to anomaly detection. Sabeel et al. [21] proposed a defense AI engine combining dual feature selection techniques and hyperparameter optimization of AI models to perform binary attack stream identification using the proposed system and trained and validated the AI models on the CIC-IDS2017 dataset. Zhang et al. [22] studied the improved LSTM intrusion detection algorithm model, used the particle swarm optimization algorithm to select features to reduce the feature dimension. They finally validated it on the KDDcup99 dataset. The obtained results showed that the improved LSTM network can effectively improve the accuracy and F1 value of intrusion detection. Yang et al. [23] used a deep convolutional generative adversarial network to extract features from the original data and then used an LSTM model to learn features of network intrusion behavior and validated it on the NSL-KDD dataset, achieving 99% accuracy. Halbouni et al. [24] constructed a hybrid model of CNN and LSTM, and the experimental results showed that the model has a high detection rate and accuracy but can exhibit lower performance in detection rate on unbalanced datasets.
Andresini et al. [25] proposed a hybrid deep learning network based on a self-encoder and LSTM for intrusion detection, which first uses a self-encoder for downscaling and feature extraction of network traffic data and then employes an LSTM network to process the order of network traffic data to achieve data classification. Although the above methods have achieved some results in abnormal traffic classification, they do not effectively utilize the difference information between abnormal and normal samples, resulting in low accuracy in recognizing abnormal data.
The research work in this paper differs from the above in that:
(1) PCA is combined with Hotelling’s T2 for the first time for dimensionality reduction and feature extraction in intrusion traffic detection, which can select not only more representative features but also features with better differentiation.
(2) We use an improved BiLSTM, which can make good use of the spatial features as well as temporal features between data and better exploit the different relationships between abnormal and normal samples.
Fig. 1 depicts the main flow chart showing the process steps of the algorithm used in this paper. It contains four main sections:
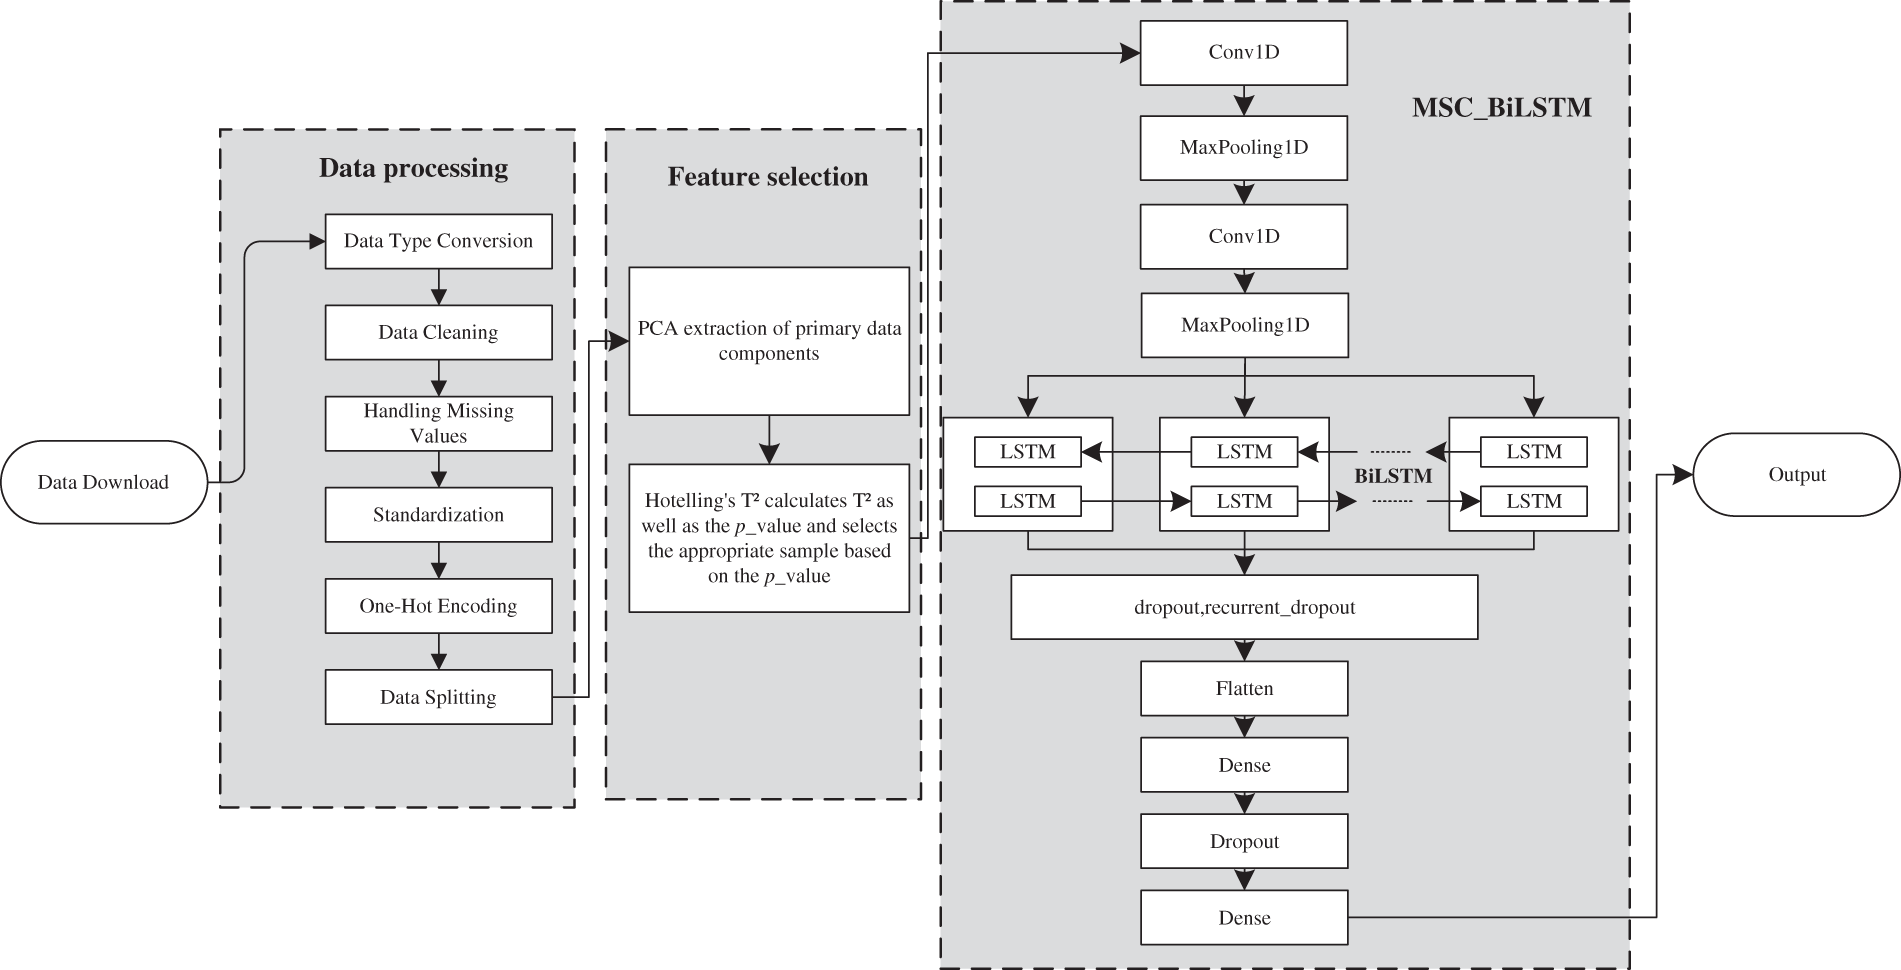
Figure 1: Flow chart of traffic intrusion detection
(1) First, the data part is filtered, and the dataset is divided into a training set and a test set.
(2) Second, the most representative features are extracted from the high-dimensional data, replacing the initial high-dimensional features using a combination of PCA and Hotelling’s T2.
(3) Then, the improved BiLSTM model is used to accurately classify the dataset after feature extraction.
(4) Finally, the final classification result is obtained based on the output.
3.2 Feature Extraction Based on PCA with Hotelling’s T2
There are various methods for extracting features, and this step is critical in classification problems because feature extraction eliminates redundant and irrelevant input features, improving the accuracy of the classifier while reducing the computation time for learning [26]. Principal component analysis is often used on data from diverse fields such as biology, medicine, psychology, chemistry, materials science, computer science, and deep learning [27]. One of the most iconic applications of PCA in the field of computer vision is face recognition, which in general data analysis can be considered a preprocessing step applied to the data before more sophisticated classification or learning methods are employed [28]. In such cases, PCA can be regarded as a feature selection or feature extraction process. The utilization of this method can reduce the size of the input data before employing more complex classification algorithms and can significantly reduce the computational cost of the method while minimizing the loss of accuracy [29].
Hotelling’s T2 is one of the multivariate control charts used to detect multivariate outliers [30]. Hotelling’s T2 index can be applied to identify normal variability in principal components (PCs). Hotelling’s T2 measures the variation in the PCs and is calculated as shown in Eq. (1):
where
In the case of normal data obeying a multivariate normal distribution,
where
After feature extraction using PCA, the principal components extracted by PCA can be used as input variables for Hotelling’s T2. First, the number of samples (n_samples) and the number of features (n_features) of the training data are obtained, and the mean and covariance matrix (cov) of the training data are calculated. Hotelling’s T2 statistic and the corresponding
Hotelling’s T2 statistic (T2) was calculated as shown in Eq. (3):
where
Next,
where
Finally, according to the threshold of
Overall, the feature extraction model, combining PCA and Hotelling’s T2, initially employs PCA to extract the main components of the data. The remaining principal components may contain noise or irrelevant information. The aim of Hotelling’s T2 is to detect observations in the principal component space that deviate from the normal data distribution. Hotelling’s T2 statistic and the chi-square distribution were used to assess the degree of outliers of each sample in the feature space by calculating
3.3 Classification Based on MSC_BiLSTM
The basic unit of LSTM is the storage unit, which is a linear module with constant weight recursive connections. Multiplicative ingress and egress gate components modulate a steady error flow, ensuring that disturbances induced by irrelevant inputs or storage contents do not sway them. The ingress and egress gates ascertain which errors they must rescale or obtain. Employing conventional techniques, the error signal tends to evaporate because errors are gauged founded on the magnitude of the weights. Ingress and egress gates configure a network, and the network’s architecture is established by the operator. Gates can glean entries from other units and utilize these entries to conclude whether to retain information or not [31]. Fig. 2 shows the most typical LSTM unit.
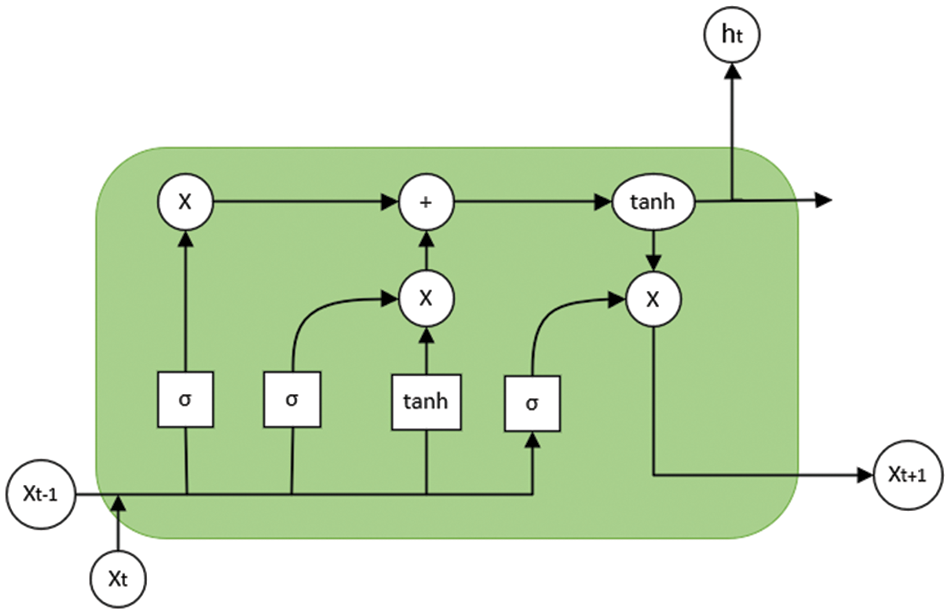
Figure 2: LSTM base unit
Therefore, we propose a method called the MSC_BiLSTM new model for processing sequential data. In contrast to the BILSTM network, this model contains a convolutional neural network (Conv1D) and BiLSTM layers that learn the dependencies between different time steps in the sequential data to better capture the long-term dependencies. Additionally, to avoid model overfitting, we employ the L2 regularization technique and a dropout layer in the model. L2 regularization penalizes the weight parameters in the model, thereby preventing the model from being overly dependent on specific weight values. The dropout layer randomly discards the outputs of some neurons, preventing overfitting.
To convert the multidimensional input data into one-dimensional vectors, a flattened layer is also included in the model so that the multidimensional input data can be converted into one-dimensional vectors for fully connected operations in the dense layer. The last layer uses the softmax activation function, which transform the model’s output into a probability distribution of the categories for multi-categorization tasks. With the combination of these layers, the MSC_BiLSTM model is better equipped to handle sequence data, thus enhancing the model’s performance and generalization ability. The framework diagram of the proposed model is shown in Fig. 3.
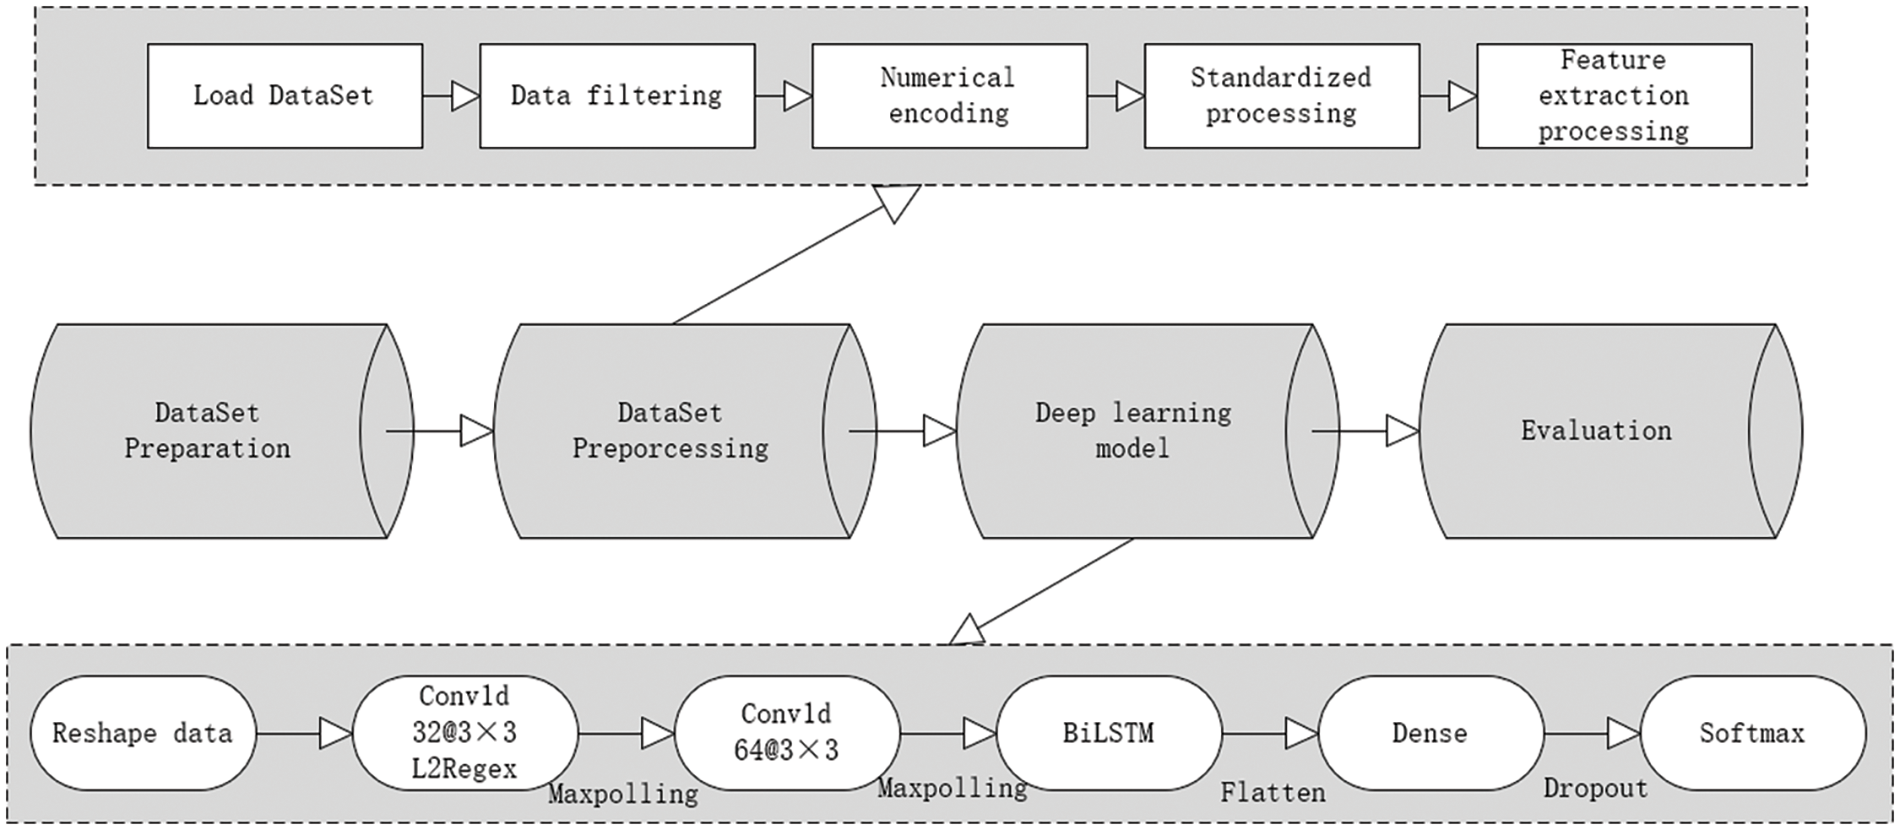
Figure 3: Overall framework of model
The improved modeling algorithm is shown in Table 1.
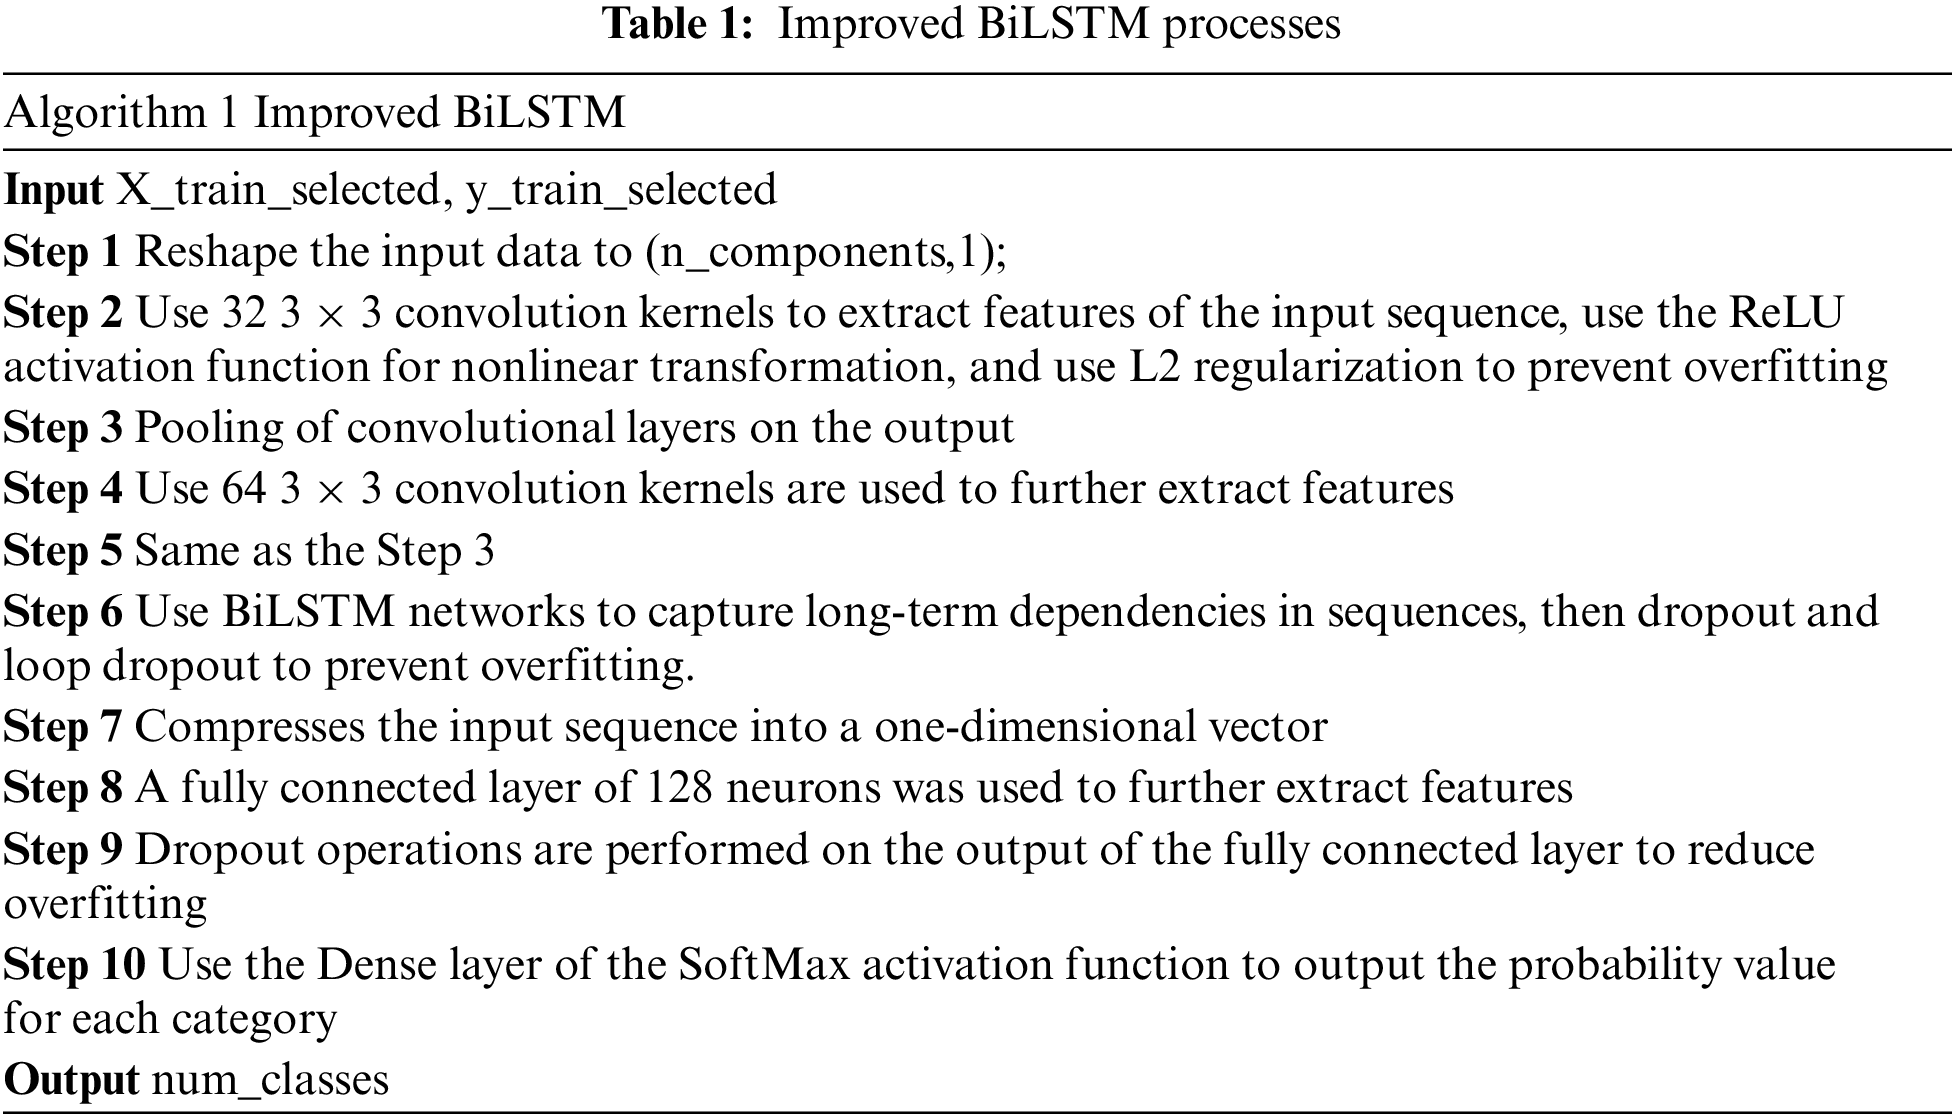
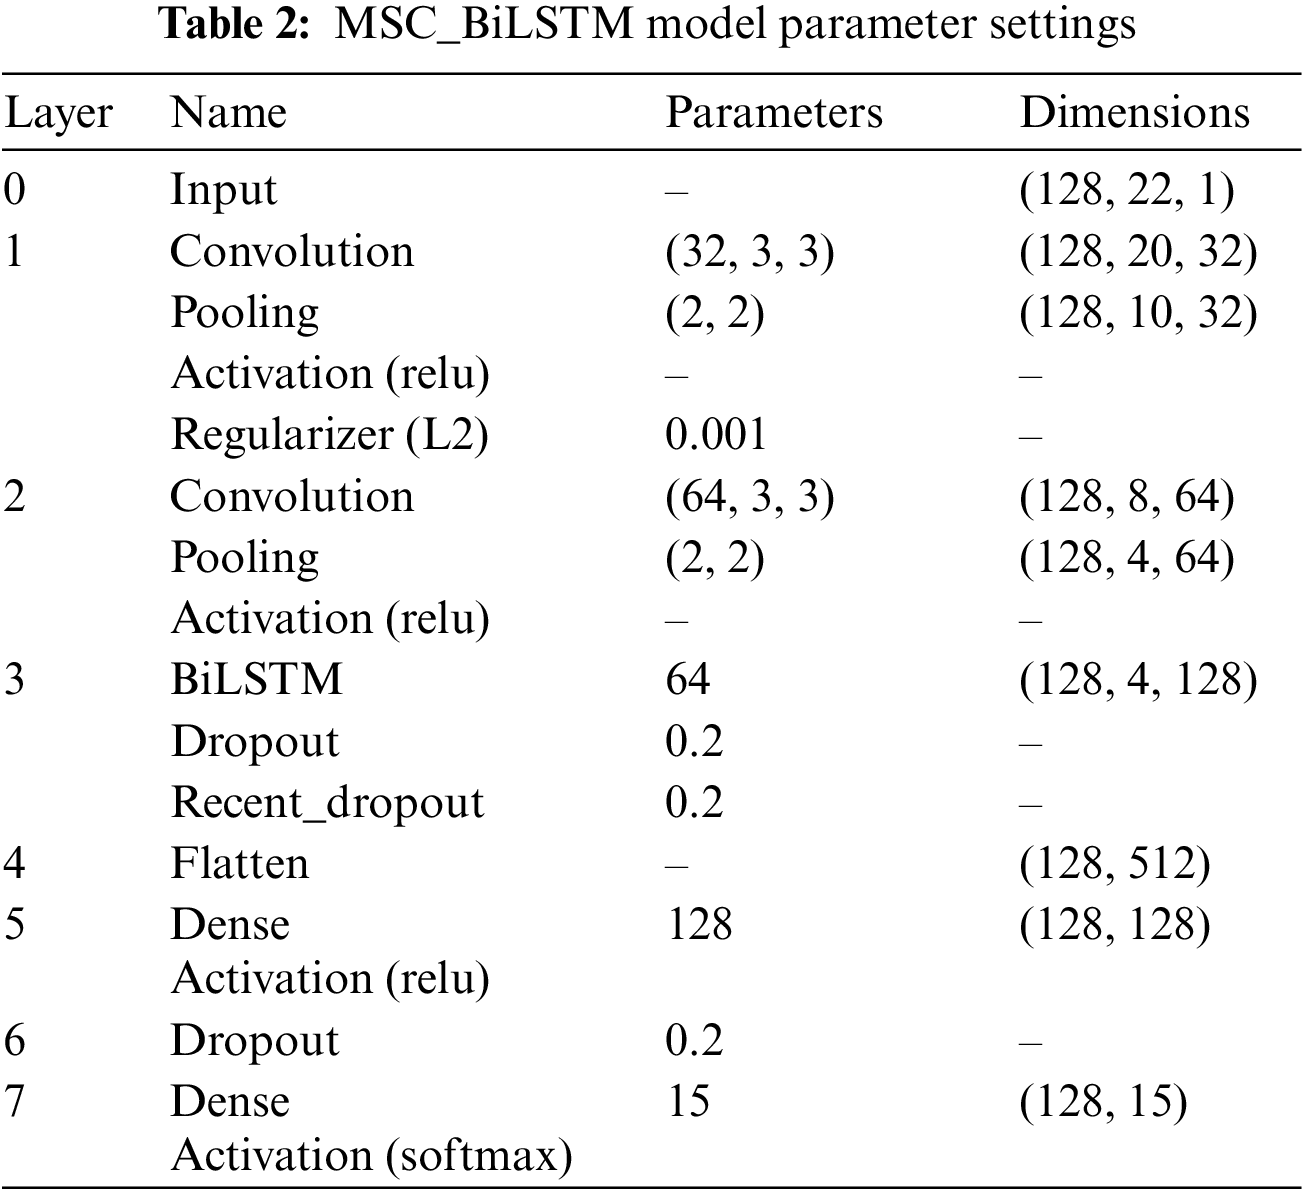
The main flow of the MSC_BiLSTM model is shown in Table 1, as well as the parameter settings for each layer after adjusting the model in Table 2. It employs two layers of convolutional structure and one layer of bi-directional LSTM structure. This design allows the model to learn both deep spatial features through the convolutional layers and better temporal features through the bi-directional LSTM layer. From Table 2, we can see that the input dimension is (128, 22, 1), where 128 means that each batch contains 128 samples, each sample has 22 features and each feature has 1 channel. The convolution layer parameter is given as (32, 3, 3) where 32 filters are present in layer 1 with size (3, 3). In addition, the first layer incorporates L2 regularization, which can be a good solution to the overfitting problem. In the following sections, we will evaluate the performance of this classifier on the CIC-IDS 2017 dataset.
4 Data Preprocessing and Feature Extraction
In this section, the dataset used is presented along with the preprocessing of the data and the main features extracted.
There are many datasets used for traffic intrusion detection systems, such as KDDcup99, NSL-KDD, and CIC-IDS2017. However, based on the evaluation of existing datasets, it has been shown that the majority of the datasets are obsolete and undependable. Certain of these datasets are deficient in traffic diversity and volume, while others do not encompass a variety of known attacks, and some lack feature sets and metadata [32]. To overcome these shortcomings and meet the needs of modern attacks and network traffic, Sharafaldin et al. [33] at the Canadian Institute for Cybersecurity developed a dataset, CIC-IDS2017, which contains benign and up-to-date common attacks, similar to real-world data (PCAPs).
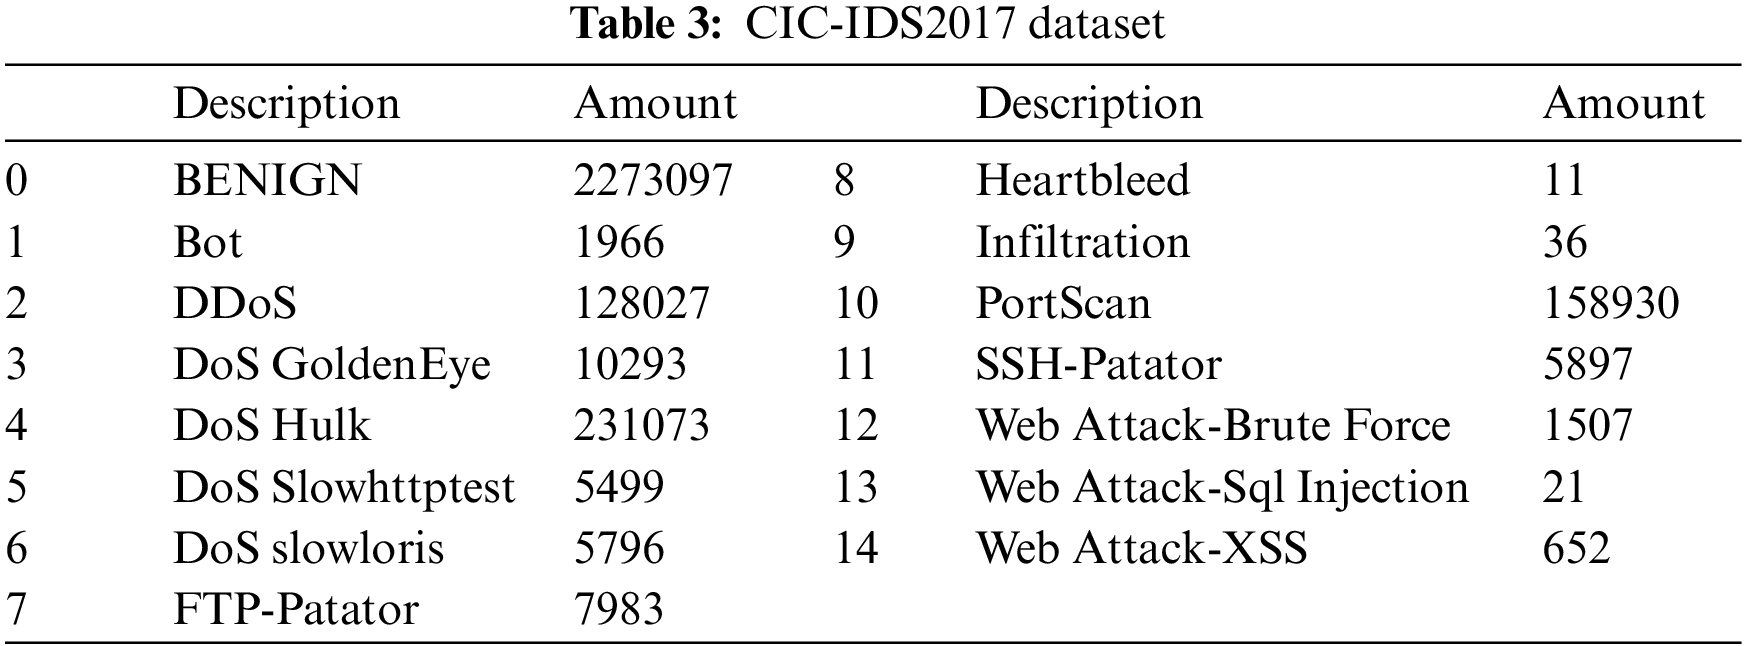
The dataset contains 80 multidimensional features, plus a total of 15 categories of normal traffic. Traffic data are collected from Monday to Friday. Monday is all normal traffic. Tuesday to Friday includes normal traffic and various types of intrusion traffic such as brute force File Transfer Protocol (FTP), brute force Secure Shell Protocol (SSH), Disk Operating System (DoS), Heartbleed, Web attacks, infiltration, botnets, and Distributed Denial of Service (DDoS). The details are shown in Table 3.
Data preprocessing, which includes encoding, standardization and normalization of discontinuous variables, is an important stage in determining classification performance. Although this stage plays an important role in preprocessing, little attention has been given to it [34]. As stated earlier, the CIC-IDS2017-based dataset comprises over 80 features, but some of these features play a minimal role in classification. Therefore, in addition to numerical processing the nonnumerical data in the dataset, as well as normalization and standardization it, this paper also performs feature dimensionality reduction and extraction on the dataset.
For the numerical processing of data, this paper uses the label encoder coding technique, which converts categorical variables into numerical variables. It maps each different categorical variable label to an integer value. Specifically, for each categorical variable label
This approach enables the conversion of categorical variable labels into corresponding integer values through the label encoder, facilitating the processing of these categorical variables by machine learning algorithms. It should be noted that when using label encoder, care should be taken not to interpret the integer values of the categorical variables as having any natural mathematical meaning, as these values are simply a way of encoding.
Prior to the normalization process, it is necessary to handle infinite values and null values within the dataset. The approach employed for addressing infinite and null values involves mean replacement. For standardization, the StandardScaler function is utilized. This technique performs feature scaling, normalizing each attribute in the data to follow a standard Gaussian distribution with a mean of 0 and a standard deviation of 1. Specifically, for each feature, StandardScaler calculates their mean and standard deviation, then subtracts the feature values from their mean and divides them by their standard deviation, ensuring that the values of each feature conform to a standard normal distribution.
4.3 Feature Extraction Processing
The above processed dataset was subjected to feature extraction and discrimination using PCA and Hotelling’s T2. The data are first processed using PCA, i.e., the number of dimensions d of the data is obtained first, and the mean vector of each dimension is calculated. After that, the covariance matrix as well as the eigenvectors and eigenvalues are calculated for the whole dataset. Finally, by selecting the first n larger eigenvalues, a d * n matrix is obtained, and the new matrix obtained is the new sample space. Then, Hotelling’s T2 mentioned in Section 2 is used to discriminate, and finally, the K-dimensional dataset is derived. In this paper, for the CIC-IDS2017 dataset, the features whose principal component contribution ratio is 95% are extracted. After processing, the dataset is downscaled to 22 dimensions from the original 80+ dimensional data, with the principal component ratio of each dimension shown in Fig. 4.

Figure 4: Number of components accounting for 95% of variance: 22
The relationship between each principal component is shown in Fig. 5, where each cell shows a scatterplot between the two principal components and a histogram or density plot of each principal component is shown on the diagonal. This chart has 22 rows and 22 columns, with each row and column representing a principal component. In each cell, you can see the distribution of data points on the plane corresponding to the two principal components. On the diagonal, one can see the distribution of data for each principal component itself. From Fig. 5, we can clearly see the range of the main distribution of each principal component, as well as the linear and proportional relationship between different principal components.

Figure 5: Plot of relationships between principal components
5 Experimental Results and Discussion
The classification method employed in this paper utilizes the proposed MSC_BiLSTM model. The preprocessed dataset is randomly extracted at a ratio of 80% for the training set and 20% for the test set. In addition, the confusion matrix is utilized to gauge the effectiveness of the intrusion detection system, and the accuracy and error rate measures the accuracy of the intrusion classification. The accuracy metrics in network anomaly detection are classified into two categories: True Positive (TP) signifies the quantity of examples in which the genuine positives are correctly positive and anticipated as positive; and True Negative (TN) denotes the number of instances where the actual negatives are accurately forecasted as negative and the number of specimens anticipated to be negative. Additionally, false detections are categorized into two categories: False Positive (FP) denotes the quantity of instances that are truly negative but forecasted as positive, while False Negative (FN) signifies the number of examples that are genuinely positive but anticipated to be negative.
There are two ways to algorithmize the accuracy rate in multicategorical tasks. One is the macro average, which signifies that each class possesses identical weight when computing the mean, resulting in the arithmetic average of the metrics for each class. The other is the micro average, which involves computing multicategorical indicators by allocating identical significance to each exemplar across all classes and integrating all specimens together to calculate each metric. If the number of examples in each class is approximately equivalent, then there is negligible discrepancy between macro averaging and micro averaging. However, if the number of illustrations in each class diverges substantially, micro averaging is used when focusing on classes with an abundant quantity of exemplars, while macro averaging is used when focusing on classes with a limited number of specimens.
Recall denotes the ratio of the genuine positive specimens anticipated as positive to the total authentic positive examples. It mirrors the model’s capability to identify positive specimens; the superior the recall, the stronger the model’s aptitude to recognize positive examples. The F1-score can be construed as the harmonized mean of precision and recall, constituting an amalgamation of precision and recall; the superior the F1-score, the more robust the model.
5.1 Comparative Analysis of Experiments
All experiments were performed on a Windows 10 PC with an Intel (R) Core (TM) i5-9400 CPU @ 2.90 GHz and 16.0 GB of memory. The deep learning model uses the TensorFlow, pandas, and Keras libraries. We have evaluated our model using fine-grained classification, as shown in Table 2. The normal traffic is BENIGN, and the remainder is intrusion traffic.
In this section, the OCSVM [16], K-Nearest Neighbor (KNN) [20], Deep Neural Networks (DNN) [21], LSTM [23], and CNN_LSTM [24] models are used in our comparison experiments.
Fig. 6 gives the identification results of each model for several common intrusion traffic types including Bot, DDoS, PortScan, and SSH. Fig. 6a shows the comparison graph of the detection results of different models for Bot, in which we can see that the model in this paper achieves a certain advantage in terms of precision, recall, and F1-score, while the OCSVM performs the worst. From Fig. 6b, we can see that KNN, DNN, CNN_LSTM and the model in this paper achieve better recognition results in the detection of DDoS attacks. Fig. 6c shows the detection results for PortScan, and it can be seen that only OCSVM is slightly less effective in detecting it. Fig. 6d is a comparison chart of the results of detecting SSH, and it can be seen that the model in this paper is more stable compared with other models.
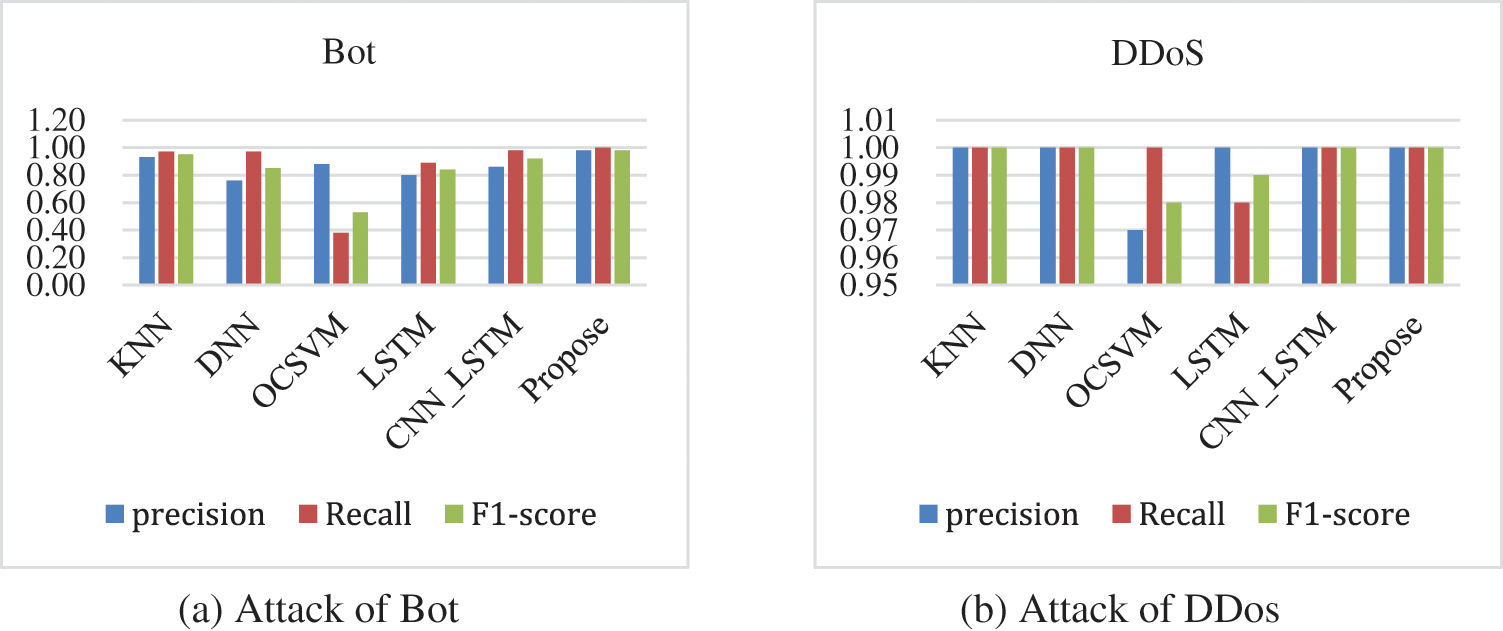
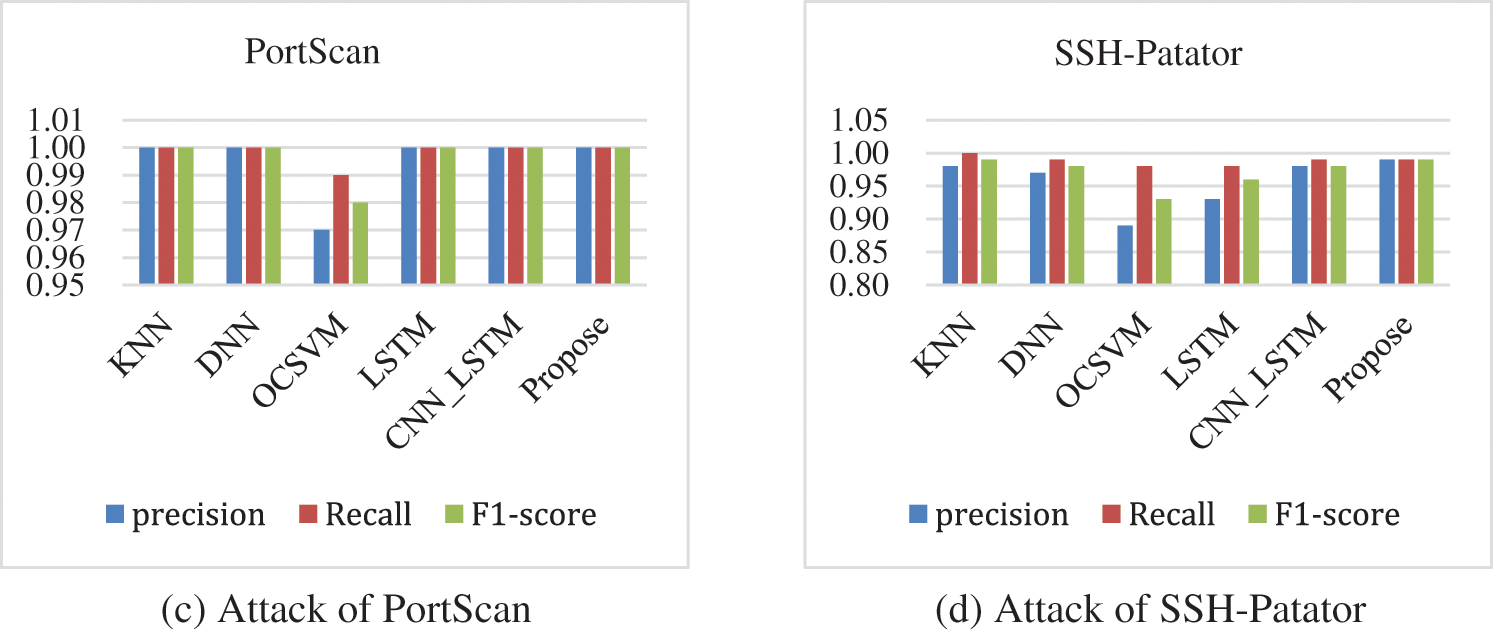
Figure 6: Different intrusion traffic detection results
Fig. 7 shows the detection results of different models for different kinds of intrusion traffic of DoS. Fig. 7a shows the graph of detection results for DoS GoldenEye, and we can see that the model proposed in this paper is more balanced compared to other models. Fig. 7b shows the graph of the recognition results for DoS Hulk, and it can be seen that except for the LSTM model, the precision, recall, and F1-score of the other models is all above 0.98. For the identification and detection of DoS Slowhttptest (Fig. 7c) and DoS slowloris (Fig. 7d), it can be seen that only KNN’s detection results are slightly lower than the other models, i.e., the models in this paper, as well as DNN, OCSVM, LSTM, and CNN_LSTM, have an accuracy of more than 0.99 for the identification of these two types of anomalous traffic.
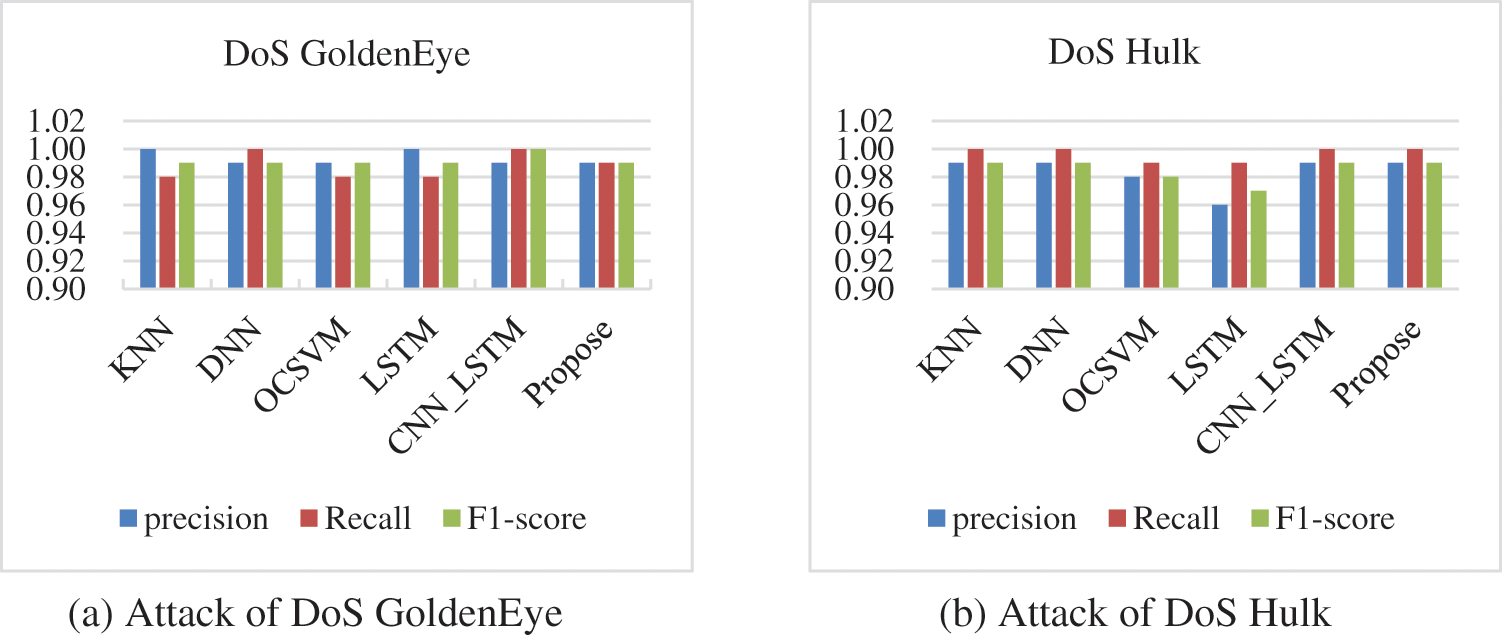
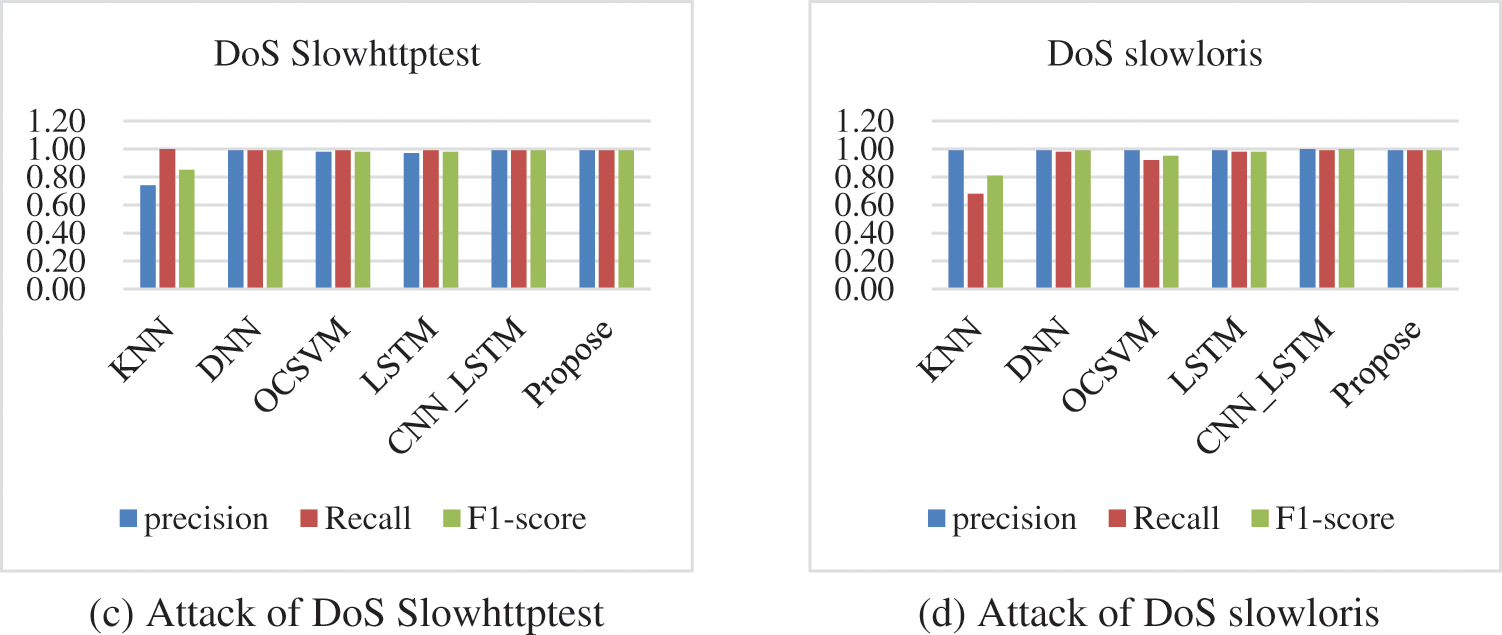
Figure 7: Comparison of the detection results of each model for various types of DoS attacks
In Fig. 8, we can see the detection results of different models for web attacks and FTP attacks. In Fig. 8a, we can see that the detection of brute force in web attacks has considerable detection results, in which the model in this paper reaches 0.96 in recall, but in Figs. 8b and 8c, we can see that the detection of SQL injection and XSS in web attacks is not very effective, as OCSVM, LSTM, and CNN_LSTM cannot recognize these two types of anomalous traffic at all, and our proposed model can detect them, but the detection effect is also not satisfactory. In Fig. 8d, we can see the detection results of different models for the anomalous traffic of the FTP type, and we can see that except for the LSTM model with a slightly lower detection recall and F1-score, all the other models can achieve better results, i.e., the detection accuracies are all above 0.99.

Figure 8: Comparison of the detection results of each model for various types of web attacks and FTP attacks
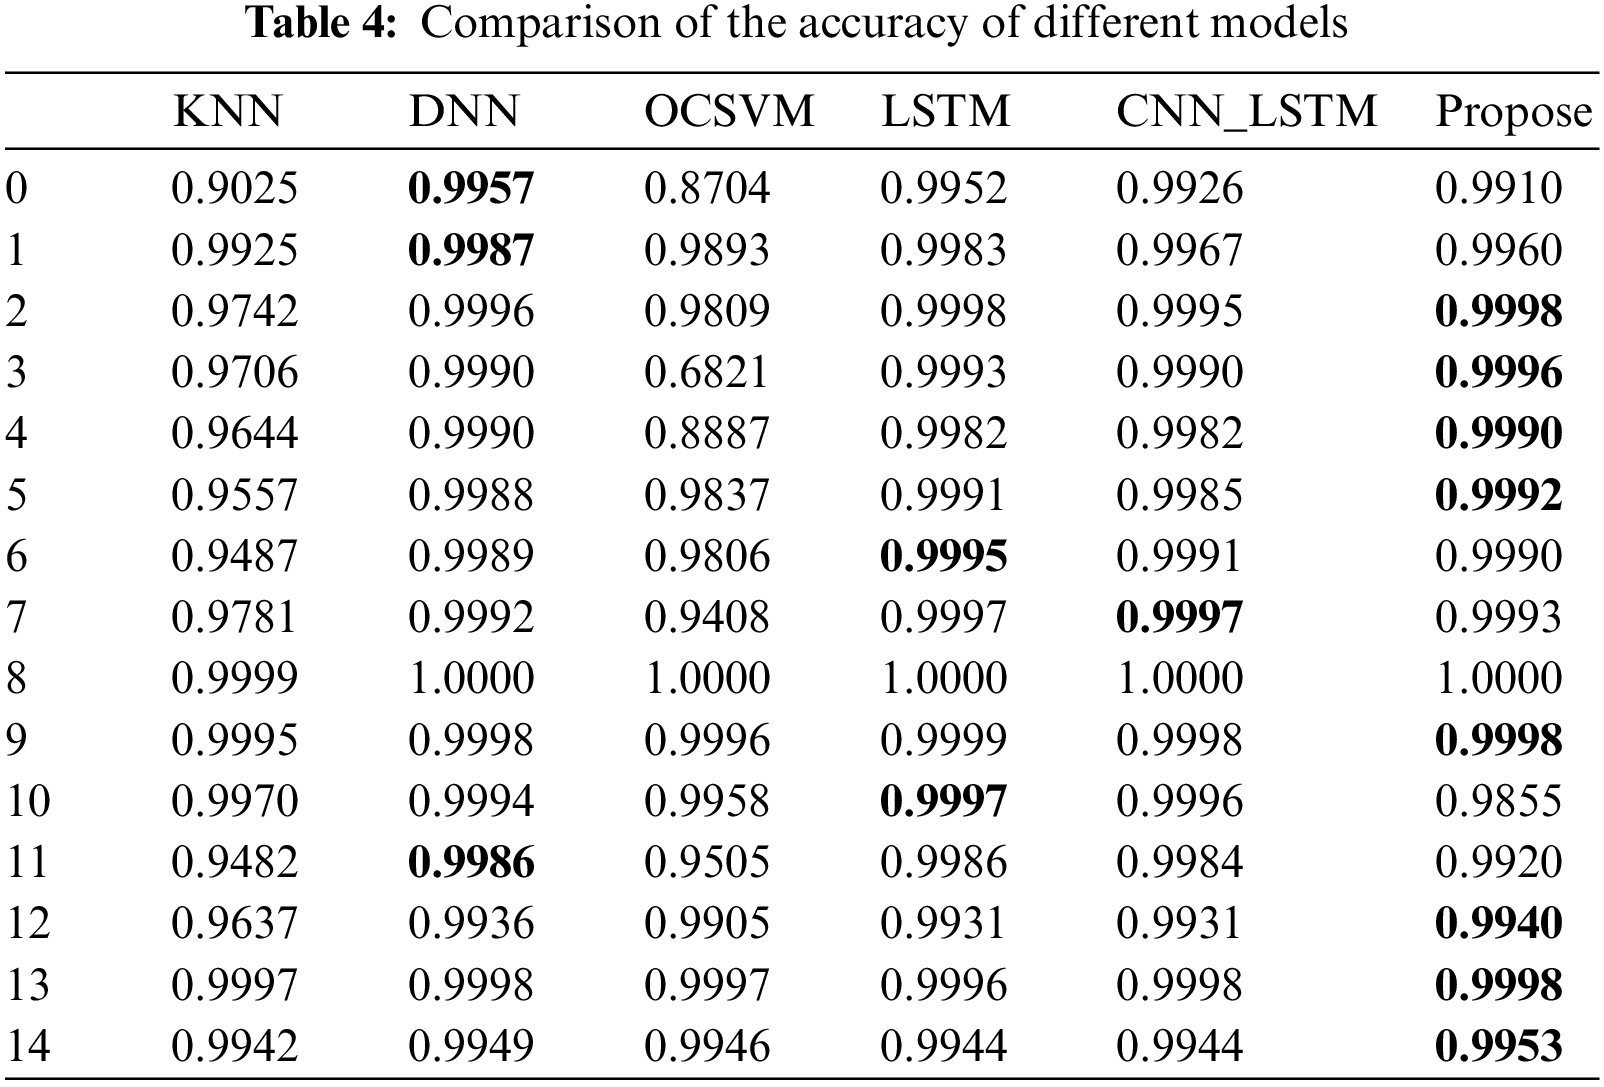
The identification results of different models for each class of traffic accuracy are shown in Table 4. The numbers 0–14 in Table 4 correspond to each traffic class in Table 2. That is, 0: BENIGN, 1: Bot, 2: DDoS, 3: DoS GoldenEye, 4: DoS Hulk, 5: DoS Slowhttptest, 6: DoS slowloris, 7: FTP-Patator, 8: Heartbleed, 9: Infiltration, 10. PortScan, 11: SSH-Patator, 12: Web Attack-Brute Force, 13: Web Attack-Sql Injection, 14: Web Attack-XSS. In Table 4, we can discern that the proposed model in this manuscript surpasses the other models in the majority of the traffic categories, and there is still some traffic whose recognition accuracy is lower than other models, but for each category of traffic recognition the accuracy is above 99%.
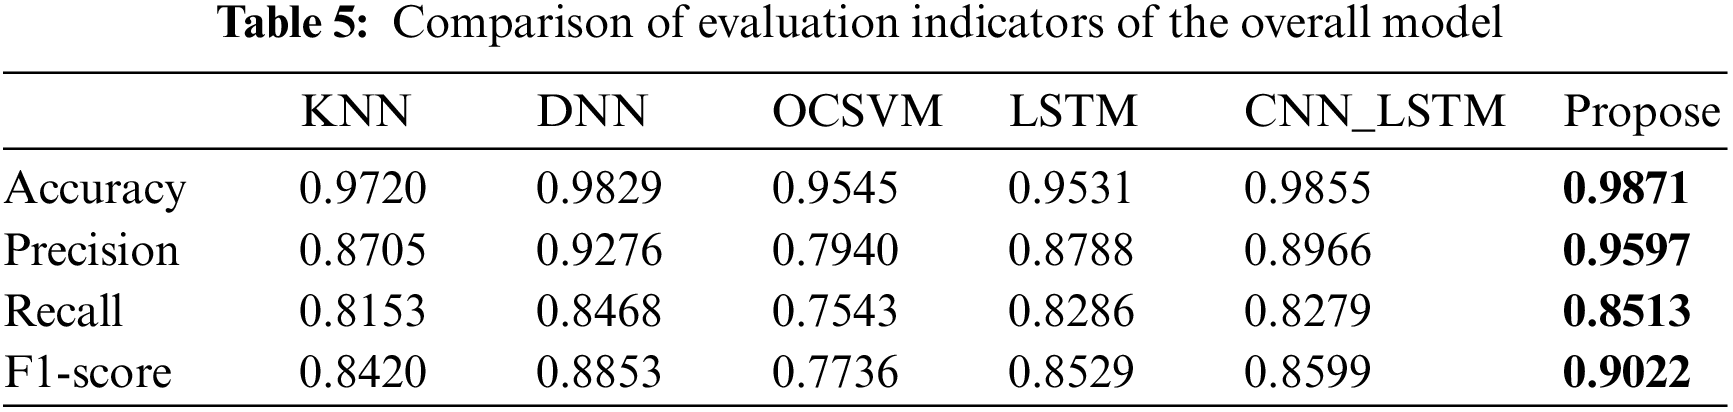
Finally, in Table 5, we give the average results of the evaluation metrics for all the model test results. From Table 5, we can clearly see the advantages of this paper’s model compared to other models. The precision is improved by approximately 3%–16% compared to the other models, the recall is improved by 1%–10%, and the F1-score is improved by approximately 4%–13%, which shows that the model proposed in this paper is more stable and applicable for the identification of abnormal traffic.
5.2 Ablation Experiment Analysis
In addition, we performed ablation experiments to compare the improved model in this paper with the unimproved BiLSTM, and the comparison results are shown in Table 6.
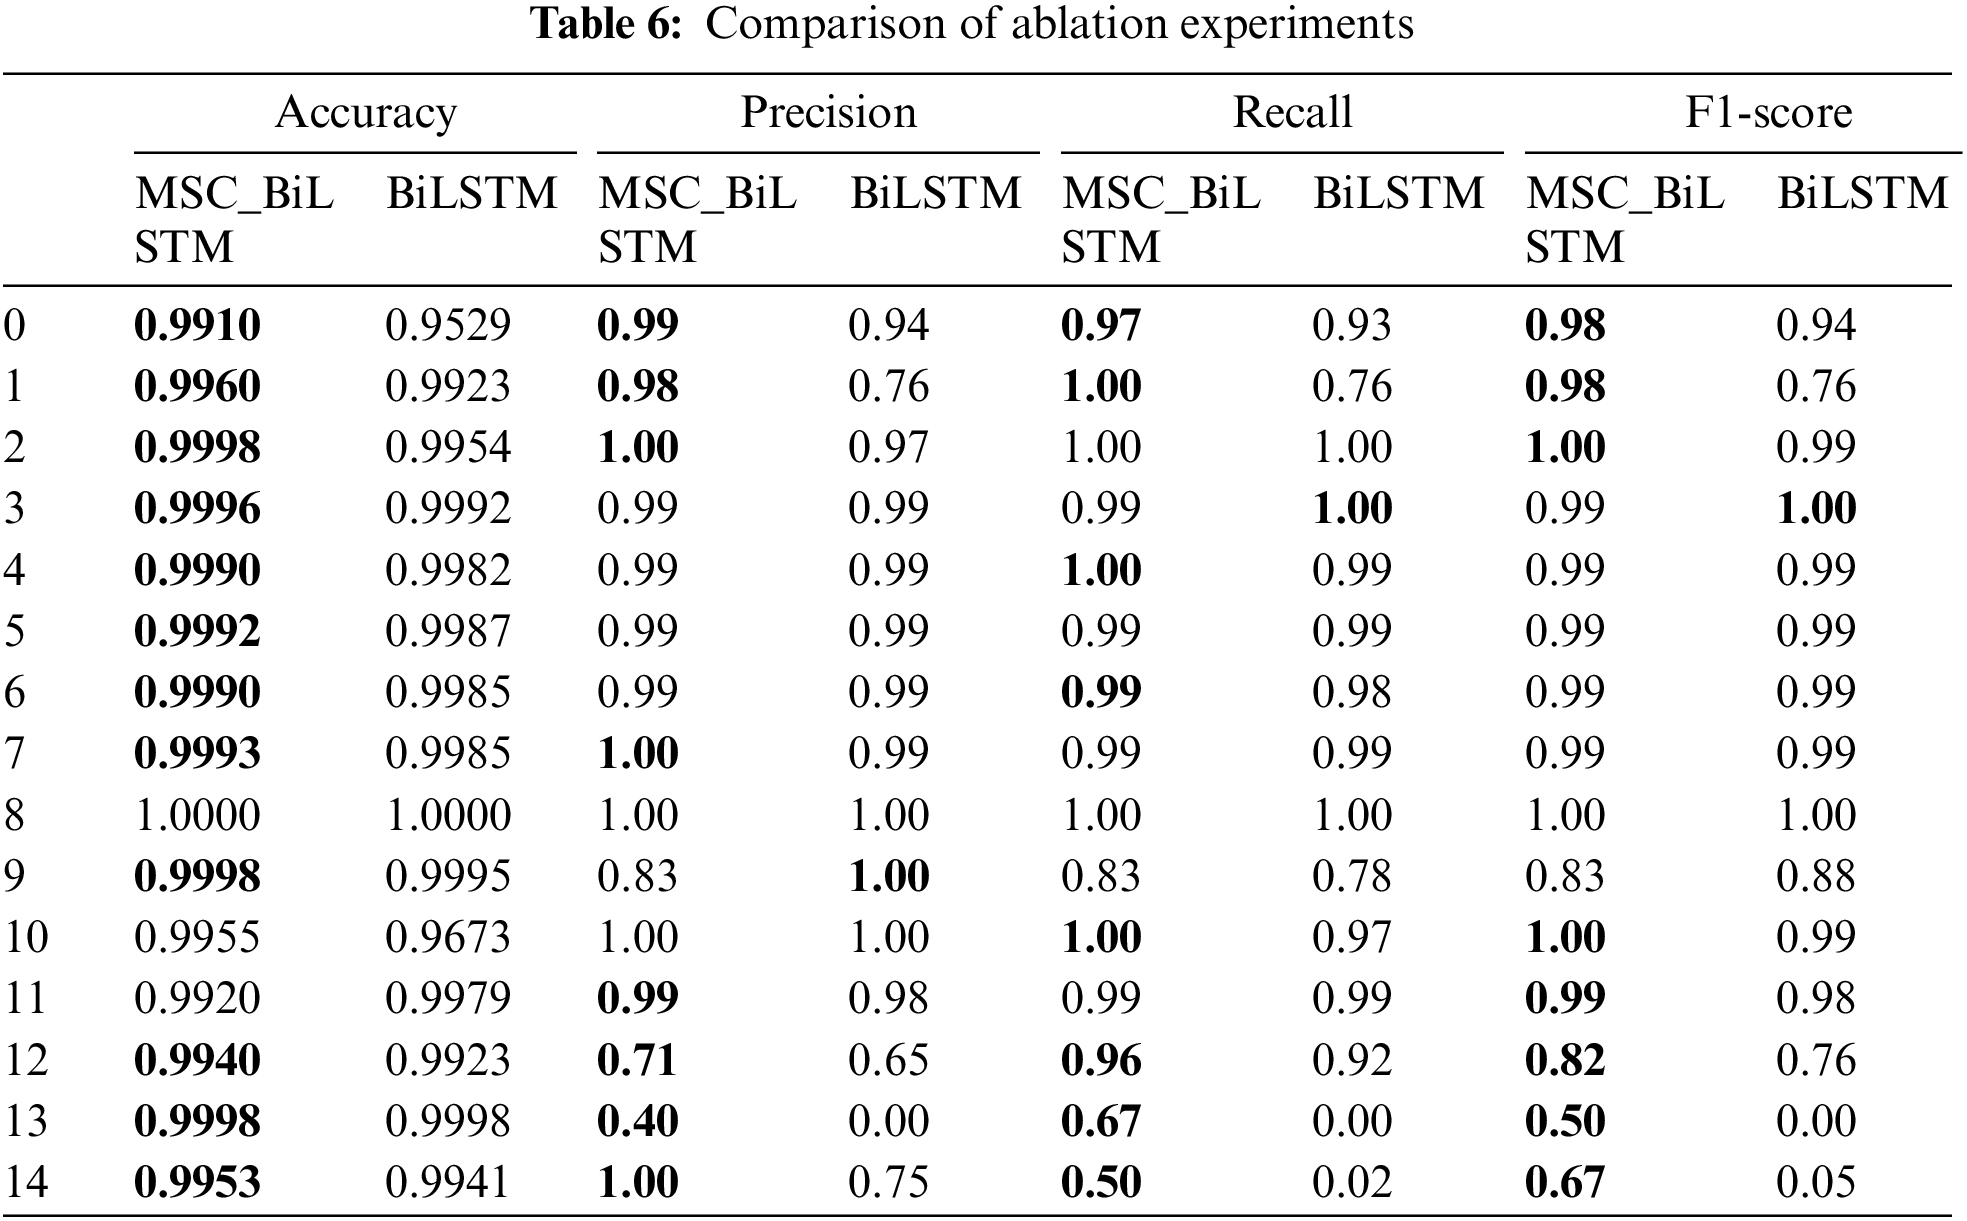
From Table 6, we can clearly see that for most types of traffic recognition, both in terms of precision and recall, our model outperforms the unimproved BiLSTM model.
Fig. 9 gives a comparison chart of the combined mean values of the evaluation metrics of this paper’s model and the BiLSTM model for each class of traffic identification results, and the improvement in the effectiveness of this paper’s model can be clearly seen in the chart.

Figure 9: Comparison of model means
In Fig. 9, we can see that the accuracy of the model proposed in this paper is 98.71%, which is an improvement of 1.81% over the unimproved BiLSTM model, and the corresponding precision is 95.97%, the recall is 85.13%, and the F1 value is 90.22%, which is an improvement of 9.31%, 2.99%, and 5.88%, respectively.
In this manuscript, we propose a feature extraction approach that combines PCA and Hotelling’s T2 for intrusion detection of network traffic. The high-dimensional traffic data is first downscaled, of which main features are extracted using the integrated PCA and Hotelling’s statistics. These extracted features replace the original data traffic, facilitating subsequent intrusion detection. This method results in better category differentiation and more relevant and representative features for the category labels.
Next, we employ a neural network prototype containing Conv1D and BiLSTM layers to detect and classify the data. The Conv1D layer captures the sequential patterns in the data, while the BiLSTM layer handles the long-term dependencies. To prevent overfitting, we incorporate L2 regularization and dropout layers. In the final stage of the framework, a softmax activation function transforms the model’s output into a probability distribution for multi-class classification.
During training, a flattened layer is utilized to convert the multidimensional input data into one-dimensional vectors for fully connected operations in the dense layer. This combination of layers enables the framework to effectively learn information from sequential data and enhance its generalization capability, making it more adept at solving real-world problems.
After applying these processing steps, the intrusion detection results surpass those achieved by existing machine learning models, exhibiting improved precision, recall, and F1-scores. However, there is still room for improvement in detecting specific types of anomalous traffic. The limited data available contributes to the low accuracy in recognizing individual traffic. Therefore, future work could focus on balancing the dataset to improve recognition results for traffic categories with lower accuracy.
Acknowledgement: We thank our families and colleagues who provided us with moral support.
Funding Statement: This work was supported by Tianshan Talent Training Project-Xinjiang Science and Technology Innovation Team Program (2023TSYCTD).
Author Contributions: Study conception and design: Xuecheng Yu; data collection: Xuecheng Yu, Yu Zhang; analysis and interpretation of results: Xuecheng Yu, Mingyang Song, Zhenhong Jia; draft manuscript preparation: Mingyang Song, Yan Huang, Zhenhong Jia. All authors reviewed the results and approved the final version of the manuscript.
Availability of Data and Materials: The dataset used in this paper is the public dataset CIC-IDS2017 dataset, accessed as follows: https://www.unb.ca/cic/datasets/ids-2017.html.
Conflicts of Interest: The authors declare that they have no conflicts of interest to report regarding the present study.
References
1. B. Hallajian, H. Motameni and E. Akbari, “Ensemble feature selection using distance-based supervised and unsupervised methods in binary classification,” Expert Systems with Applications, vol. 200, no. 3, pp. 116794, 2022. [Google Scholar]
2. J. C. Ang, A. Mirzal, H. Haron and H. N. Abdull Hamed, “Supervised, unsupervised, and semi-supervised feature selection: A review on gene selection,” IEEE/ACM Transactions on Computational Biology and Bioinformatics, vol. 13, no. 4, pp. 971–989, 2016. [Google Scholar] [PubMed]
3. F. Salo, A. B. Nassif and A. Essex, “Dimensionality reduction with IG-PCA and ensemble classifier for network intrusion detection,” Computer Networks, vol. 148, no. 5, pp. 164–175, 2019. [Google Scholar]
4. Y. Pan, F. Sun, Z. Teng, J. White, D. C. Schmidt et al., “Detecting web attacks with end-to-end deep learning,” Journal of Internet Services and Applications, vol. 10, no. 6, pp. 1–22, 2019. [Google Scholar]
5. H. Yao, D. Fu, P. Zhang, M. Li and Y. Liu, “MSML: A novel multi-level semi-supervised machine learning framework for intrusion detection system,” IEEE Internet of Things Journal, vol. 6, no. 7, pp. 1949–1959, 2018. [Google Scholar]
6. S. Mohammadi, H. Mirvaziri, M. Ghazizadeh-Ahsaeea and H. Karimipour, “Cyber intrusion detection by combined feature selection algorithm,” Journal of Information Security and Applications, vol. 44, no. 8, pp. 80–88, 2019. [Google Scholar]
7. J. Camacho, G. Maciá-Fernández, N. M. Fuentes-García and E. Saccenti, “Semi-supervised multivariate statistical network monitoring for learning security threats,” IEEE Transactions on Information Forensics and Security, vol. 14, no. 9, pp. 2179–2189, 2019. [Google Scholar]
8. S. Dong, Y. Xia and T. Peng, “Network abnormal traffic detection model based on semi-supervised deep reinforcement learning,” IEEE Transactions on Network and Service Management, vol. 18, no. 10, pp. 4197–4212, 2021. [Google Scholar]
9. L. Li, H. Zhang, H. Peng and Y. Yang, “Nearest neighbors-based density peaks approach to intrusion detection,” Chaos, Solitons & Fractals, vol. 110, no. 11, pp. 33–40, 2018. [Google Scholar]
10. Y. Xue, W. Jia, X. Zhao and W. Pang, “An evolutionary computation based feature selection method for intrusion detection,” Security and Communication Networks, vol. 2018, no. 12, pp. 1–10, 2018. [Google Scholar]
11. J. Gu, L. Wang, H. Wang and S. Wang, “A novel approach to intrusion detection using SVM ensemble with feature augmentation,” Computers & Security, vol. 86, no. 13, pp. 53–62, 2019. [Google Scholar]
12. E. Kabir, J. Hu, H. Wang and G. Zhuo, “A novel statistical technique for intrusion detection systems,” Future Generation Computer Systems, vol. 79, no. 14, pp. 303–318, 2018. [Google Scholar]
13. S. K. Gautam and H. Om, “Computational neural network regression model for host based intrusion detection system,” Perspectives in Science, vol. 8, no. 15, pp. 93–95, 2016. [Google Scholar]
14. Z. Chen, C. K. Yeo, B. S. Lee and C. T. Lau, “Autoencoder-based network anomaly detection,” in 2018 Wireless Telecommunications Symp. (WTS), New York, NY, USA, pp. 1–5, 2018. [Google Scholar]
15. J. H. Liu, S. P. Mao and X. M. Fu, “Intrusion detection model based on ICA algorithm and deep neural network,” Netinfo Security, vol. 19, no. 17, pp. 1–10, 2019. [Google Scholar]
16. A. Binbusayyis and T. Vaiyapuri, “Unsupervised deep learning approach for network intrusion detection combining convolutional autoencoder and one-class SVM,” Applied Intelligence, vol. 51, no. 18, pp. 7094–7108, 2021. [Google Scholar]
17. T. Su, H. Sun, J. Zhu, S. Wang and Y. Li, “BAT: Deep learning methods on network intrusion detection using NSL-KDD dataset,” IEEE Access, vol. 8, no. 19, pp. 29575–29585, 2020. [Google Scholar]
18. P. Nirmala, T. Manimegalai, J. R. Arunkumar, S. Imala, G. Vinoth Rajkumar et al., “A mechanism for detecting the intruder in the network through a stacking dilated CNN model,” Wireless Communications and Mobile Computing, vol. 2022, no. 20, pp. 1–13, 2022. [Google Scholar]
19. B. Alsulami, A. Almalawi and A. Fahad, “Toward an efficient automatic self-augmentation labeling tool for intrusion detection based on a semi-supervised approach,” Applied Sciences, vol. 12, no. 21, pp. 7189, 2022. [Google Scholar]
20. M. M. Saeed, “A real-time adaptive network intrusion detection for streaming data: A hybrid approach,” Neural Computing and Applications, vol. 34, no. 22, pp. 6227–6240, 2022. [Google Scholar]
21. U. Sabeel, S. S. Heydari, K. Elgazzar and K. EL-Khatib, “Building an intrusion detection system to detect atypical cyberattack flows,” IEEE Access, vol. 9, no. 23, pp. 94352–94370, 2021. [Google Scholar]
22. L. Zhang, H. Yan and Q. Zhu, “An improved LSTM network intrusion detection method,” in 2020 IEEE 6th Int. Conf. on Computer and Communications (ICCC), Chengdu, China, pp. 1765–1769, 2020. [Google Scholar]
23. J. Yang, T. Li, G. Liang, W. He and Y. Zhao, “A simple recurrent unit model based intrusion detection system with DCGAN,” IEEE Access, vol. 7, no. 25, pp. 83286–83296, 2019. [Google Scholar]
24. A. Halbouni, T. S. Gunawan, M. H. Habaebi, M. Halbouni, M. Kartiwi et al., “CNN-LSTM: Hybrid deep neural network for network intrusion detection system,” IEEE Access, vol. 10, no. 26, pp. 99837–99849, 2022. [Google Scholar]
25. G. Andresini, A. Appice, N. Di Mauro, C. Loglisci and D. Malerba, “Exploiting the auto-encoder residual error for intrusion detection,” in 2019 IEEE European Symp. on Security and Privacy Workshops (EuroS&PW), San Francisco, CA, USA, pp. 281–290, 2019. [Google Scholar]
26. S. Ramakrishnan and S. Devaraju, “Attack’s feature selection-based network intrusion detection system using fuzzy control language,” International Journal of Fuzzy Systems, vol. 19, no. 28, pp. 316–328, 2016. [Google Scholar]
27. F. L. Gewers, G. R. Ferreira, H. F. de Arruda, F. N. Silva, C. H. Comin et al., “Principal component analysis: A natural approach to data exploration,” ACM Computing Surveys, vol. 54, no. 29, pp. 1–34, 2021. [Google Scholar]
28. S. Sukhvinder, “Poly logarithmic naive bayes intrusion detection system using linear stable PCA feature extraction,” Wireless Personal Communications, vol. 125, no. 30, pp. 3117–3132, 2022. [Google Scholar]
29. Z. Xia, Y. Chen and C. Xu, “Multiview PCA: A methodology of feature extraction and dimension reduction for high-order data,” IEEE Transactions on Cybernetics, vol. 52, no. 31, pp. 11068–11080, 2022. [Google Scholar] [PubMed]
30. D. K. Shepherd and S. E. Rigdon, “Are principal components with estimated parameters feasible in multivariate process control?,” Quality and Reliability Engineering International, vol. 38, no. 32, pp. 4141–4156, 2022. [Google Scholar]
31. C. Avci, B. Tekinerdogan and C. Catal, “Analyzing the performance of long short-term memory architectures for malware detection models,” Concurrency and Computation: Practice and Experience, vol. 33, no. 33, pp. 1–1, 2023. [Google Scholar]
32. A. Thakkar and R. Lohiya, “A review of the advancement in intrusion detection datasets,” Procedia Computer Science, vol. 167, no. 34, pp. 636–645, 2020. [Google Scholar]
33. I. Sharafaldin, A. H. Lashkari and A. A. Ghorbani, “Toward generating a new intrusion detection dataset and intrusion traffic characterization,” Proceedings of the 4th International Conference on Information Systems Security and Privacy, vol. 1, no. 35, pp. 108–116, 2018. [Google Scholar]
34. T. T. Jui, N. Hoq, S. Majumdar and S. Hossain, “Feature reduction through data preprocessing for intrusion detection in IoT networks,” in 2021 Third IEEE Int. Conf. on Trust, Privacy and Security in Intelligent Systems and Applications (TPS-ISA), New York, NY, USA, pp. 41–50, 2021. [Google Scholar]
Cite This Article
 Copyright © 2024 The Author(s). Published by Tech Science Press.
This work is licensed under a Creative Commons Attribution 4.0 International License , which permits unrestricted use, distribution, and reproduction in any medium, provided the original work is properly cited.
 Downloads
 Citation Tools