
 Submit a Paper
 Propose a Special lssue
 Open Access
ARTICLE
A Novel Eccentric Intrusion Detection Model Based on Recurrent Neural Networks with Leveraging LSTM
1 Department of Computer Applications, Karpagam College of Engineering, Coimbatore, 641032, India
2 Department of Computer Science and Engineering, Karpagam College of Engineering, Coimbatore, 641032, India
3 Department of Data Science and Business Systems, College of Engineering and Technology, SRM Institute of Science and Technology, Kattankulathur, 603203, India
4 Department of Computer Science and Engineering, Sathyabama Institute of Science and Technology, Jeppiaar Nagar, Rajiv Gandhi Salai, Chennai, 600119, India
5 Department of AI Convergence Network, Ajou University, Suwon, 16499, Korea
* Corresponding Author: Jehad Ali. Email:
Computers, Materials & Continua 2024, 78(3), 3089-3127. https://doi.org/10.32604/cmc.2023.043172
Received 24 June 2023; Accepted 15 December 2023; Issue published 26 March 2024
 View Full Text
 Download PDF
Abstract
The extensive utilization of the Internet in everyday life can be attributed to the substantial accessibility of online services and the growing significance of the data transmitted via the Internet. Regrettably, this development has expanded the potential targets that hackers might exploit. Without adequate safeguards, data transmitted on the internet is significantly more susceptible to unauthorized access, theft, or alteration. The identification of unauthorised access attempts is a critical component of cybersecurity as it aids in the detection and prevention of malicious attacks. This research paper introduces a novel intrusion detection framework that utilizes Recurrent Neural Networks (RNN) integrated with Long Short-Term Memory (LSTM) units. The proposed model can identify various types of cyberattacks, including conventional and distinctive forms. Recurrent networks, a specific kind of feedforward neural networks, possess an intrinsic memory component. Recurrent Neural Networks (RNNs) incorporating Long Short-Term Memory (LSTM) mechanisms have demonstrated greater capabilities in retaining and utilizing data dependencies over extended periods. Metrics such as data types, training duration, accuracy, number of false positives, and number of false negatives are among the parameters employed to assess the effectiveness of these models in identifying both common and unusual cyberattacks. RNNs are utilised in conjunction with LSTM to support human analysts in identifying possible intrusion events, hence enhancing their decision-making capabilities. A potential solution to address the limitations of Shallow learning is the introduction of the Eccentric Intrusion Detection Model. This model utilises Recurrent Neural Networks, specifically exploiting LSTM techniques. The proposed model achieves detection accuracy (99.5%), generalisation (99%), and false-positive rate (0.72%), the parameters findings reveal that it is superior to state-of-the-art techniques.Keywords
In the dynamic realm of cybersecurity, the persistent escalation of cyber threats compels the ongoing development of resilient intrusion detection systems (IDS). The adoption of powerful machine learning techniques has significantly contributed to strengthening these defense mechanisms, leading to a paradigm change in this area. Among the several methodologies available, Recurrent Neural Networks (RNNs) have exhibited exceptional proficiency in representing sequential data, rendering them highly suitable for the intricate and dynamic characteristics of network traffic. The Eccentric Intrusion Detection Model (EIDM) that leverages the computational capabilities of Recurrent Neural Networks (RNNs), particularly emphasizing the use of Long Short-Term Memory (LSTM) networks. LSTMs, a specialized variation of RNNs, excel at collecting long-range relationships within sequential data, a critical feature in discerning sophisticated patterns of cyber threats. The effectiveness of conventional intrusion detection techniques is sometimes hindered by the dynamic strategies adopted by cyber adversaries, resulting in a growing need for adaptable and intelligent solutions.
The integration of many components not only improves the model’s capability to identify established attack patterns but also enables it to recognise subtle and abnormal behaviours that may indicate emerging threats. The research holds importance due to its dedication to enhancing the current level of intrusion detection through a unique combination of established principles. Our objective is to give a resilient and adaptive solution to the continuously expanding cybersecurity landscape by building an Eccentric Intrusion Detection Model. This model is based on the principles of Recurrent Neural Networks and incorporates the sophisticated memory management of LSTM. The following sections will explore the architecture, training technique, and assessment metrics utilised in this innovative approach, providing insights into its effectiveness and its ramifications for enhancing network security.
Temporal Pattern Recognition of LSTM networks is well-suited for capturing temporal dependencies and long-range dependencies in sequential data. In the context of intrusion detection, this is crucial for recognizing patterns of malicious activity that may unfold over time. Handling Time-Series Data for Intrusion detection often involves analyzing time-series data, where the order of events matters. RNNs, and especially LSTMs, excel at handling such sequential data by maintaining a memory of past inputs and selectively updating this memory. Learning Complex Relationships of LSTMs can learn complex relationships within the data, enabling the model to discern subtle and sophisticated intrusion patterns that may be challenging for traditional methods to detect. Feature Extraction of LSTMs inherently perform feature extraction during the learning process, eliminating the need for manual feature engineering. This can be particularly beneficial in intrusion detection, where identifying relevant features can be challenging.
Adaptability to Varied Input Sizes LSTMs can handle input sequences of varying lengths, which is advantageous in scenarios where the amount of data per intrusion event may differ. This adaptability is useful for handling diverse network traffic patterns. Reduced False Positives by leveraging the ability of LSTMs to capture context and temporal dependencies, the model may be able to reduce false positives compared to traditional methods. This is crucial for intrusion detection systems to avoid unnecessary alerts and disruptions. Continuous Learning of LSTMs can be designed for online learning, allowing the intrusion detection system to adapt to evolving attack strategies over time. This is essential in cybersecurity, where threats are constantly changing. Anomaly Detection using LSTMs can naturally detect anomalies in sequences by learning the normal behavior of the system. This is particularly beneficial in identifying novel and previously unseen intrusion patterns. Scalability of RNNs, including LSTMs, can be scaled to handle large datasets and can benefit from parallelization in training. This scalability is crucial in handling the vast amounts of data generated in network environments. End-to-End Learning model can learn end-to-end from raw data, which means it can potentially discover hierarchical representations and dependencies without relying on predefined rules or features.
As the use of application streaming has grown, so has the volume of requests that can be fulfilled. As the service’s applications are stored on the provider’s cloud servers, the user’s end is not required to do any heavy lifting; rather, the service’s data is streamed over the internet. Because of the obvious benefits of catering to clients who lack access to high-end technology, several corporations have begun building their own exclusive streaming services. For example, Google Stadia is a fun service that makes formerly hardware-intensive games accessible on any mobile device with reliable internet access. Gameplay data is sent to a Google Cloud server, where it is processed and rendered in real-time before being sent back to the user’s terminal in the form of an online movie. Nonetheless, most of the new attacks target servers to either access their stored data or steal private information. If these attacks are to be halted, the development of a reliable and effective IDS for cybersecurity is a challenge that must be tackled. The essential role of an IDS model, particularly when integrated with LSTM neural networks for intrusion detection, is to identify and alert to potentially harmful or unauthorised activities within a computer network or system. By combining an IDS with an LSTM neural network, the system can benefit from the LSTM’s ability to learn and detect complex temporal patterns in network traffic data. The LSTM model can process sequences of events, identifying deviations from normal behaviour that might indicate a cyberattack or intrusion attempt. This enhances the overall accuracy of intrusion detection by considering the context and order of events.
Shallow learning, also known as traditional machine learning, has various real-time applications. These include tasks like image classification, spam email detection, credit card fraud detection, sentiment analysis, recommendation systems, and more. These applications benefit from algorithms like decision trees, support vector machines, and logistic regression to make predictions and classifications based on given data. “Leveraging LSTM” refers to utilising the capabilities of Long Short-Term Memory (LSTM) networks, which are a type of Recurrent Neural Network (RNN) architecture. LSTMs are particularly effective in handling sequences and time-series data due to their ability to capture long-term dependencies and relationships within the data. In this model, leveraging LSTMs takes advantage of their strengths to solve various machine learning tasks that involve sequential data. This could include tasks like speech recognition, language translation, sentiment analysis, time-series prediction, and more. LSTMs excel in scenarios where the order and timing of data points matter, and they can make accurate predictions or classifications based on historical information.
Machine learning approaches for speech recognition and time series forecasting have transformed the interaction with technology and the estimation of future trends. Speech recognition has enabled voice assistants such as Siri and Alexa to exist, allowing us to conduct tasks and obtain information using only our voice. Time-series forecasting, on the other hand, has enabled organisations to make accurate predictions about future patterns and make informed decisions based on those predictions. Machine learning developments have substantially enhanced the efficiency and accuracy of numerous applications in various industries. Furthermore, machine learning has transformed the transportation industry by enabling the creation of self-driving automobiles that can foresee and react to changing road conditions. Overall, technological improvements and predictive analytics have altered many businesses, making them more efficient and data-driven. The integration of machine learning and predictive analytics has revolutionised many industries, allowing businesses to make better decisions and deliver better results.
The software quality prediction system is enhanced by combining software fault prevention approaches based on machine learning. This method enables the system to analyse previous data and uncover trends that can aid in the detection of potential software flaws before they arise. The system may continuously learn and adapt to new software development practises by utilising machine learning algorithms, resulting in improved quality software products. This enhancement to the software quality prediction system has the potential to greatly reduce the amount of time and effort necessary for software testing and debugging. It also contributes to increased customer satisfaction by delivering more reliable and resilient software. Furthermore, the incorporation of machine learning techniques enables proactive efforts to be taken to prevent software flaws rather than reactive measures to be taken to address them after they have occurred. This method, in general, fosters a more efficient and effective software development process. The novelty of the model is that it uses an intrusion detection model employing RNN with LSTM units, which can detect both common and unique forms of cyberattack. The LSTM model is used as a tool to assist human analysts by highlighting potential intrusion events, thereby augmenting their decision-making process.
The notion of “isolated defeat syndrome” is not new. In 1980 [1], James P. Anderson described a type of “security program” whose purpose is to monitor network traffic and notify administrators of any suspicious activities or violations of system rules. System administrators can investigate suspicious activity with the use of audit logs. In order to identify intrusions, traditional IDSs use a database of attack signatures collected from expert knowledge in conjunction with some in-built decision criteria [2]. If the author is right and the network behaviour of the target anomalies is understood, then implementing and understanding a signature-based IDS should be straightforward. Cyberattacks, especially those aimed at systems that store or modify private data, have grown increasingly sophisticated in recent years. If an intrusion is detected, and to prevent the attack before any significant harm is done, making intrusion detection a crucial component of cyber-security. Approaches have their limitations and may miss some dangers [3]. Fig. 1 shows the IDS’s primary purpose was to provide tools for analysing network traffic records for IT managers.
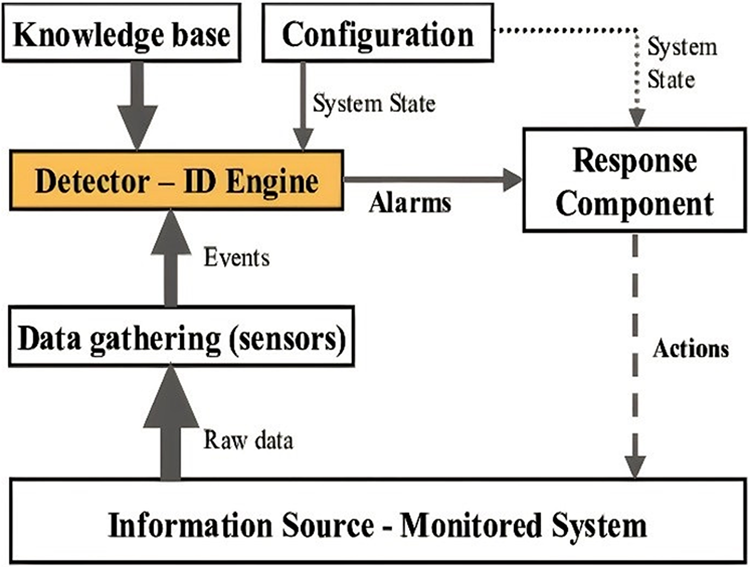
Figure 1: Architecture of the IDS model
Without regular updates, the carefully designed attack database would be rendered obsolete. Another important drawback of signature-based IDS is its inability to identify new types of attacks whose signatures have not yet been established. Because it must include the signatures of all known attacks, the database is time-consuming to develop and disseminate. Yet, there is also the potential for high processing costs when comparing the incoming data flow to the fingerprints stored in the dataset.
Now the commonplace is the application of an Artificial Neural Networks (ANN) architecture for use in forecasting and categorizing data. ANN has many uses, but intrusion detection on a network is one of its sweet spots [4]. In the first place, ANN excels at dealing with a wide variety of input characteristics simultaneously, as is the case with network packets. Second, once an ANN is trained, it can make predictions at light speed via forward propagation. If the IDS model is adjusted to correspond with the transmitted and received data, the network’s performance will significantly increase. As a result, an ANN may be trained on a large dataset to provide a reliable and generalizable solution to a problem. In contrast, IDS rely on criteria that can be understood by humans. To optimise the perfect [5,6], the ANN approach employs the descent process, which necessitates a strong mathematical foundation. In addition, a predetermined set of guidelines is unnecessary for the ANN’s training process. Thus, cybersecurity specialists are not necessarily required to train an ANN-based IDS [7]. Moreover, ANN-based IDS may recognise novel attacks that share properties with previous assaults, as its decision-making processes are generalised from the characteristics of all known attacks. Nevertheless, signature-based IDS will not pick up on novel threats since it cannot learn to recognise them [8,9].
Because of their efficiency in recognising patterns of activity, RNNs fitted with LSTM units may be useful in intrusion detection systems. In this study, a new RNN-LSTM-based intrusion detection model is proposed capable of detecting both common and uncommon cyberattacks in the CICIDS 2019 dataset. The proposed method may detect patterns in network traffic and predict the likelihood of an attack. Feature extraction and classification are the two main pillars of the proposed model’s design. In the feature extraction phase, three RNN-LSTM layers oversee filtering out various sorts of abstract features. Each layer of the RNN-LSTM consists of 128 LSTM units, and the output of the previous layer is used to train the current layer. During classification, a fully linked layer is utilised to link the collected characteristics with the correct category (attack or benign). One node in the fully linked layer is responsible for outputting the attack probability. Fig. 2 shows the Adam optimizer is used to fine-tune the model’s parameters; it is a stochastic optimization approach that dynamically modifies the training speed to maximise the model’s presentation.
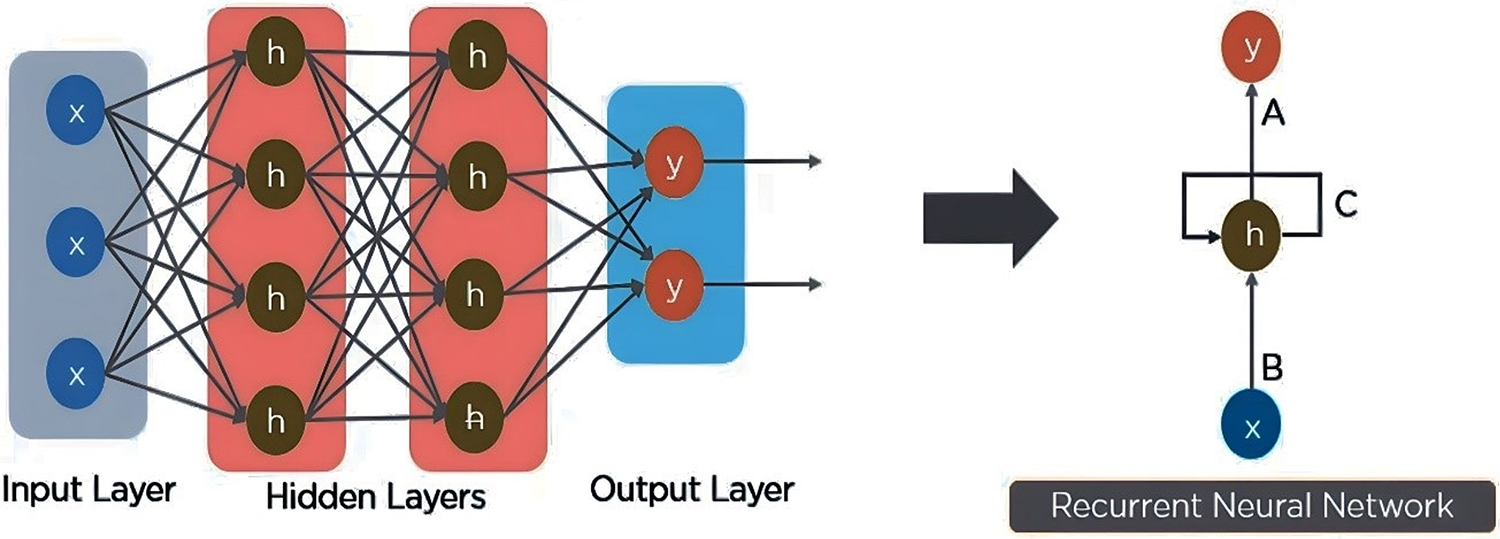
Figure 2: RNN working model
During the training phase, the backpropagation over time method is used to change the parameters of the RNN-LSTM layers of the model. A binary function is utilised during model training to minimise discrepancies between predicted and observed results.
The main contributions of this paper are:
• To create a new intrusion detection model employing Recurrent Neural Networks (RNN) with Long Short-Term Memory (LSTM) units, that can detect both common and unique forms of cyberattack.
• To use the LSTM model to improve accuracy in speech recognition systems by effectively capturing long-range dependencies in audio signals.
• To use the model as a tool to assist human analysts by highlighting potential intrusion events, thereby augmenting their decision-making process.
• To overcome the inability of Shallow learning, The Eccentric Intrusion Detection Model based on Recurrent Neural Networks with leveraging LSTM was proposed.
The rest of the paper is organized from Sections 2 to 6 such as literature review, proposed model, simulation results, conclusion and future work.
Intrusion detection systems (IDS) used to rely significantly on the expertise of network experts about probable assaults before the introduction of machine learning and deep learning. Several IDS models were categorised by Salih et al. based on their detection methods. In essence, the IDS employs statistical methods to flag low-probability events as potential attacks. In contrast, knowledge-based IDSs build a knowledge base that represents the actual traffic profile. Following that, any out-of-the-ordinary behaviour is marked as suspicious. Finally, machine learning-based intrusion detection systems offer protection. These models classify data transfers based on the characteristics of various attacks. In addition, the authors gave an overview of intrusion detection system datasets [10]. Network Security Laboratory Knowledge Discovery in Databases (NSL-KDD), and Community Integrated Cyber Intelligence Data Sharing (CICIDS2017) are public datasets with the features of cyberattacks represented by various IDS datasets. The authors reported categorization results from their previous work on the chosen datasets. The combined Multi-Layer Perceptron (MLP) neural network and payload classifier in their model resulted in 95.2% accuracy on (CICIDS2017).
Machine learning has gained popularity as a means of resolving classification tasks due to its relatively straightforward architecture and low processing costs. Various studies [11–13] have been presented to classify attacks on the CICIDS2017 dataset using machine learning methods. Several of them, for instance, have proven to be accurate in spotting Distributed Denial-of-Service (DDoS) attacks in the dataset. Nonetheless, it has been predicted that using different data pre-processing procedures will improve the model’s performance. They also came up with a hybrid feature selection method to filter out extraneous data before it was fed into the model. Input features are used in their feature assortment approach. Data standardization, feature ranking, and feature subset discovery are all pre-processing activities that take place before the features are processed. The procedure filters the processed features and returns a subset of them. They improved the detection rate to 96.50% while decreasing the false positive rate to 30.50% with their proposed feature assortment approach.
In recent years, deep learning systems like neural networks have improved as solutions for classification challenges due to their capacity to generalise more complicated patterns of task information. The authors of [14] investigated anomaly analysis for intrusion detection with Deep Neural Networks (DNN) to compare how well machine learning and deep learning models work for classification. Simulations of the model’s performance on the CICIDS2017 database were utilised to make the findings in the study [15–18]. DNN was shown to be much more efficient than K-Nearest Neighbor (KNN). Whereas the KNN obtains an accuracy of 90.913%, the DNN can attain a rate of 96.427%. The additional time needed to compute each model was also compared. DNN’s CPU time of 110 s demonstrates less overhead than KNN’s CPU time of 130 s. Researchers, Roopak et al. [7] recommended more research into the usage of deep learning models for this purpose to guarantee the security of IoT networks. Utilizing data from CICIDS2017, the authors evaluate MLP, LSTM, Convolutional Neural Network (CNN), and a hybrid model that combines LSTM and CNN to detect DDoS assaults. As compared to the CNN model (98.14%) and the hybrid model (97.11%), the LSTM model performed the best. The MLP model’s ultimate simulation accuracy was 88.47%. The authors also made comparisons to other machine learning techniques. All the deep learning models tested outperformed MLP in the simulation, even when compared to other common machine-learning methods, including support vector machines (SVM), Bayesian networks (BayesNet), and random forests (Random Forest).
Sungwoog Yeom and Kyungbeak Kim used the CICIDS2017 dataset to compare the performance of Naive Bayes classifiers, support vector machines, and convolutional neural networks. The major purpose of this study was to assess the performance of the model in binary classification across all attack categories in the dataset. Daily network traffic sub-datasets from the raw CICIDS2017 dataset were utilised to train the models. Each sub-dataset, which often only had 1–3 assault types, was used to train, and test a CNN-based classifier. Accuracy, precision, and recall were recorded along with the measure. The assessors concluded that SVM and CNN generally provided great detection rates based on their findings. In addition, CNN has superior computational performance over SVM. They did, however, note that CNN was only truly effective with well-labelled datasets. In other words, when there were several labels to be recognized, the CNN prototypes faltered.
Protecting network systems from intrusion is a crucial element of cybersecurity, and this is where intrusion detection comes in. Rule- and signature-based algorithms, which are used in traditional intrusion detection approaches, may miss some types of threats. In recent years, machine learning methods have become increasingly popular in the security sector, particularly for improving the effectiveness of intrusion detection systems. The LSTM layer’s ability to detect anomalies in sequence data has been demonstrated. Several studies have demonstrated the RNN-efficacy of LSTMs in detecting intrusions, both the more common ones and the more innovative ones. In [19], Sequential data within a predetermined time period as a malicious traffic record to implement DL models like CNN, LSTM, RNN, and GRU in order to develop the IDS. Network activity records that are innocuous or attack-related are categorized, and the supervised-learning technique is assigned a label [19]. A distributed architecture that finds the bots that make up a botnet and recognizes early indicators of a potential DDoS attack. The hostile actors (bots) taking part in the attack are recognized by the architecture. The early signs that support the DDoS prediction set off the bot detection approach [20].
The efficacy of a wide range of network traffic attributes and machine learning methods in order to identify the optimal feature set for detecting specific attack categories [21]. Examining the specific attributes of the CICIDS2017 dataset highlights the inherent challenges associated with it. Ultimately, the study also provides a consolidated dataset that addresses these concerns, hence enhancing the accuracy of classification and detection capabilities in future intrusion detection systems [22]. The framework is based on several existing projects, including Lua Torch, Chainer, and HIPS Autograd. It offers a high-performance environment that facilitates automatic differentiation of models executed on various devices, such as the CPU and GPU [23]. The models in each experiment undergo up to 1000 epochs, with a learning rate ranging from 0.01 to 0.05. The performance of CNN and its many architectures has demonstrated notable superiority when compared to traditional machine learning classifiers [24].
The approach employs a consistent binary encoding methodology to convert multivariable data inside the real number domain into binary patterns that serve as the input for WiSARD. The primary contribution of this study is a comprehensive empirical assessment of WiSARD’s classification efficacy in contrast to contemporary methodologies in the current research landscape [25]. To foster robust diversity, the algorithm under consideration applies penalties (in the form of unfavourable weights) to qualities that were involved in the most recent tree, with the aim of generating subsequent trees [26]. The objective is to facilitate users in the seamless implementation of Support Vector Machines (SVM) in their respective applications. LIBSVM has garnered significant acclaim in the field of machine learning as well as various other domains [27]. The suggested framework has been subjected to a comparative analysis with existing deep learning models, utilizing three authentic datasets. These datasets include a novel dataset named NBC, as well as a merged dataset comprising UNSW-NB15 and CICIDS2017, encompassing a total of 101 distinct classes [28].
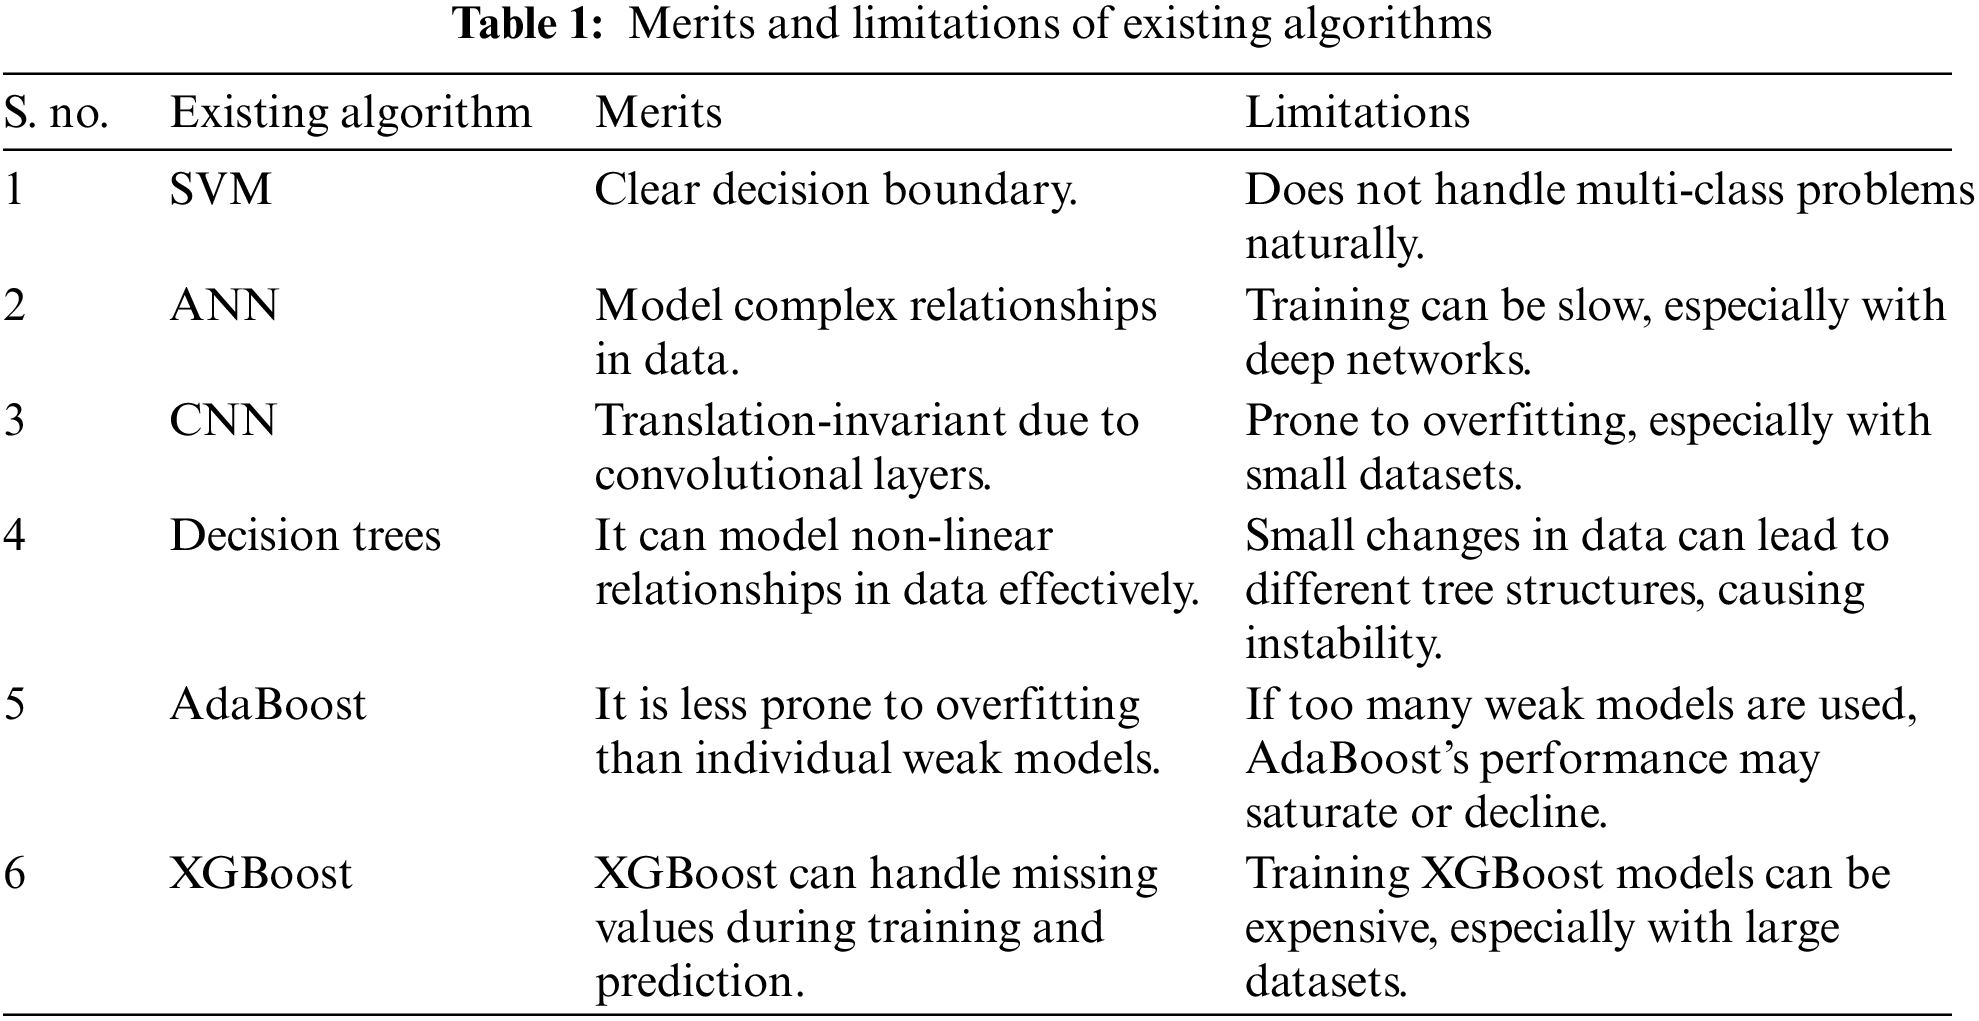
As the CICIDS2019 dataset is the gold standard for intrusion detection research, several studies have utilised it to evaluate the performance of intrusion detection algorithms. Singh et al. proposed a deep learning-based intrusion detection model that makes use of convolutional (CNN) and LSTM layers. The proposed model achieved state-of-the-art levels of accuracy and detection rate on the CI-CIDS2019 dataset. In recent work by Yang et al. [29], a hybrid model combining RNN-LSTM and the Attention Mechanism was proposed to enhance intrusion detection. The proposed model achieved higher accuracy and an improved F1-score than prior state-of-the-art approaches on the CICIDS2019 dataset. Literature reviews showed that RNN-LSTM is useful for intrusion detection and can enhance intrusion detection systems’ ability to identify both known and undiscovered breaches. Discovering new cyberattacks inside the CICIDS2019 dataset [30] is one of the goals of the RNN-LLSTM-based technique used in this paper. Table 1 shows the merits and limitations of existing algorithms.
The RNN-LSTM algorithm is a machine learning method for sequential data processing, such as time series. Recurrent Neural Networks (RNN) and Long Short-Term Memory (LSTM) are acronyms commonly used in the literature. Traditional neural networks do not have a feedback loop in their processing, moving straight from input to output. Nonetheless, RNNs are well-suited to time-series data analysis because their output may be fed back into the input through a feedback loop [31,32]. The network learns from its mistakes and may better anticipate the future because of the feedback loop. Various dimensionality reduction approaches are employed to eliminate redundant and irrelevant features present in the network traffic data [33]. Traditional RNNs have the vanishing gradient problem, which hinders long-term learning, while LSTM provides a solution. dependencies. Long-Short-Term Memory (LSTM) units consist of a memory cell that can store data for extended periods and gates that regulate how data enters and exits the cell. The LSTM algorithm processes a series of inputs sequentially with the use of a feedback loop that conveys data from one stage to the next. The LSTM unit processes each input by first adding new information to the memory cell via the input gate, then choosing which information to output via the output gate [34,35]. Fig. 3 illustrates the process by which the cell state (Ct-1) is determined from the input content (Xt) and the prior state (ht-1).
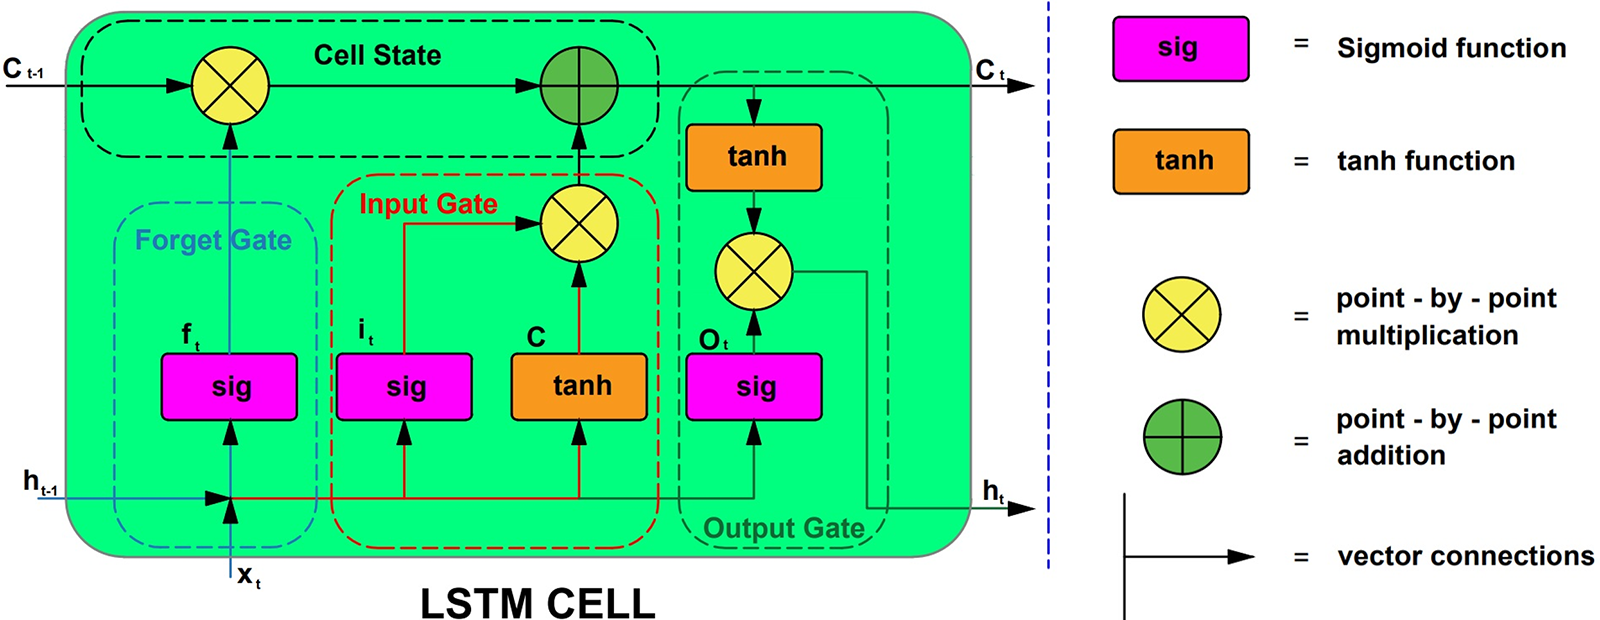
Figure 3: Architecture of LSTM works
It identifies all the files that need to be wiped from the hard drive. A sigmoid function is used to find the solution. The process by which the cell state (Ct-1) is determined from the input content (Xt) and the prior state (ht-1).
It determines which of several possible input values will be used to make changes to the storage space in question. The sigmoid function is used to determine whether to allow 0 or 1 data through. The tanh function also gives the inputted data an emphasis of −1 to 1 on a scale of significance that is presented in Fig. 3.
The sigmoid function is employed to make that decision. Using the tanh function, determine the numbers that are evenly divisible by both zero and one. By using the tanh function, the input values are multiplied by the sigmoid output to produce a significance value between −1 and 1.
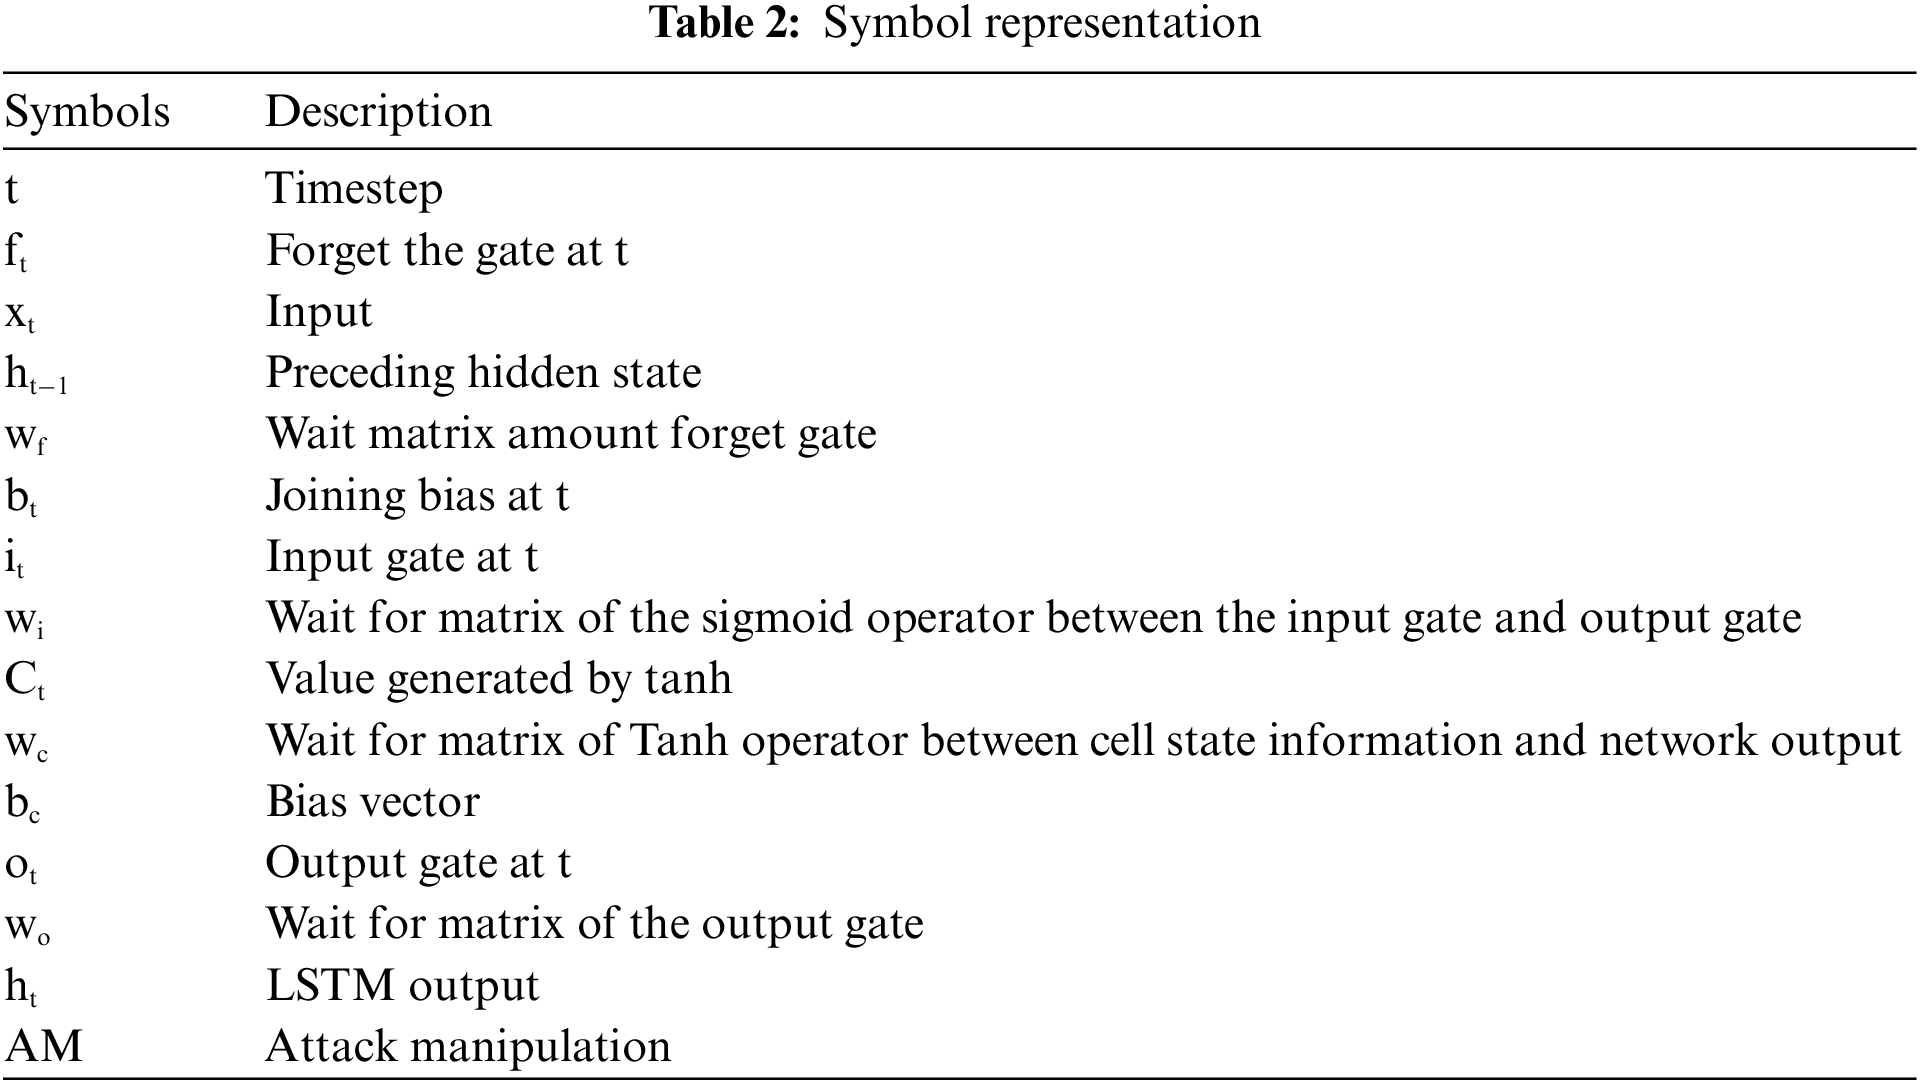
Table 2 shows a comprehensive representation of a cell in a recurrent neural network, which processes the current input sequence (xi) to generate the hidden state (hi) and passes it on to the next recurrent neural network cell in the input sequence. The “internal layer” of an LSTM cell is far more complex than the “internal layer” of a conventional RNN cell, which merely processes the input and current state (ht-1) (xt). As RNN-LSTM is an effective method for processing sequential data in general, it may be used for a wide variety of tasks, including speech forecasting. To create a state-of-the-art intrusion model using RNN-LSTM, one must first gather and organise relevant data. The CICIDS2019 dataset has to be pre-processed to eliminate extraneous features and labels before it can be used for the intrusion detection challenge. It is possible to take actions like label encoding, feature engineering, and data cleaning. The operational scale, number of states, and manner of their activation must be specified. When the architecture is determined, the model is built using the appropriate loss and optimization methods, and evaluation metrics are developed. The developer must create a loss function and optimizer before the model can be trained. Here, the following serves as the overarching strategy, but the specifics of its implementation will depend on the circumstances at hand.
When the model has been trained, its efficacy is determined by measuring its performance on the testing set in terms of accuracy, precision, recall, and F1-score. Model performance may be improved by hyperparameter tuning, architectural redesign, or the addition of new features and capabilities. The proposed model relies heavily on feature extraction and categorization. Three RNN-LSTM layers are used to extract high-level features from the input data, and a fully connected layer is used to map those features to the output class (attack or benign). The CICIDS2019 dataset, which is used as a benchmark in intrusion detection research, is based on data on network traffic collected in a simulated environment. The collection includes both beneficial and detrimental forms of traffic. The network traffic data is then submitted to the model after standardisation and one-hot encoding have been performed. Upon receiving the cleaned and prepared data, the three RNN-LSTM layer feature extraction techniques are depicted in each RNN-LSTM layer has 128 LSTM units that produce output that is used to train subsequent layers. The classification module receives the output of the third RNN-LSTM layer and uses a fully connected layer with a single output node and a sigmoid activation function to make a classification. The value of the output node indicates how likely an assault is to occur. Adam is an optimizer, and a binary cross-entropy loss function is used to train the suggested model. The model is trained over 50 iterations with a batch size of 128. Fig. 4 shows the flow of RNN-Leveraging LSTM. Fit the model to the training data while keeping an eye on how well it does on the validation data.
Figure 4: Flow of RNN-leveraging LSTM
Measures of the model’s performance include accuracy, the F1-score, and the area under the receiver operating characteristic (ROC) curve (AUC-ROC). Experimental results reveal that the proposed model is effective in recognising both common and uncommon forms of cyberattacks by achieving high accuracy and an F1-score on the CICIDS2019 dataset. Accuracy and F1-score metrics show that the proposed approach is effective at spotting both widespread and niche instances of cybercrime. Because of its simple architecture and training technique, the model may be easily implemented and used for training across datasets. Attention processes and other kinds of deep learning can be explored in future studies to further improve the model’s performance.
3.2 CICIDS2019 Security Dataset
The CICIDS2019 dataset is a free and open-source security benchmark for testing IDSs. It is a large dataset that takes into account many different aspects of network traffic and accounts for many different kinds of assaults, both common and uncommon. The dataset is a record of network activity in a simulated setting, with both good and bad traffic contributing. The data was collected using a hybrid method that used both a real and a simulated network to capture the traffic. Basic elements like protocol types, packet lengths, and port numbers are present in the dataset, alongside more complex aspects like flow statistics and payload information. Many types of assaults, such as Denial-of-Service (DoS), DDoS, port scanning, brute force, and web attacks, are represented in the CICIDS 2019 dataset. Metasploit, Hping3, and Nmap were only some of the tools and methods that were used to generate the assaults.
The dataset offers a thorough reference point for testing and comparing the efficacy of intrusion detection systems. It may be used to train and evaluate machine learning models for intrusion detection, and it is compatible with both supervised and unsupervised learning methods. The CICIDS2019 dataset includes 2,484,578 samples collected over seven days in a simulated network. There are two primary types of traffic included in the dataset: safe and harmful. There are 1,803,621 instances that fall under the benign traffic category and indicate data that should be travelling over the network due to users and apps. There are a total of 680,957 cases that fall under the “malicious traffic” category, each of which represents a unique attack type created by an attacker employing a unique set of tools and methods. The malicious traffic subcategory is further broken down into 15 distinct attack scenarios. Table 3 shows possible attacks and the number of occurrences.

Shallow learning has the disadvantage of focusing on rote repetition and surface-level knowledge. This can make it difficult to apply knowledge in real-world circumstances and to think critically. Furthermore, shallow learning may not inspire a genuine curiosity and passion for learning since students may be more concerned with attaining high grades than truly understanding the content. Furthermore, because superficial learning is not profoundly imprinted in the brain, it can impede long-term retention of information.
These are some real time applications where shallow learning was used.
• Shallow learning algorithms, such as Naive Bayes and Support Vector Machines, have been employed to classify emails as spam or legitimate based on features like keywords, sender information, and email content.
• Used to identify fraudulent credit card transactions by analysing transaction patterns, spending behavior, and other attributes to distinguish between genuine and fraudulent activities.
• Shallow learning algorithms like Decision Tree and Random Forest are used to classify images into categories, such as recognising different objects in photographs or medical images.
• Banks and financial institutions use shallow learning to assess loan applications, considering factors like income, credit history, and loan amount to determine whether to approve or reject a loan request.
• Applied to assist medical professionals in diagnosing diseases based on patient data. For example, decision trees can help diagnose certain medical conditions by considering symptoms and test results.
Table 4 shows the simulation setup of Long Short-Term Memory enabled Recurrent Neural Networks.

3.4 Design of the Training and Test Dataset
For LSTM models specifically, data cleansing and noise removal help ensure that the patterns and dependencies within sequential data are accurately learned and predicted. This can lead to improved model performance and more accurate predictions, as the model is better able to focus on relevant information without being misled by irrelevant or erroneous data points. These are the techniques followed for cleansing and noise removal of the data samples from the Canadian Institute for Cybersecurity website. It includes a collection of various kinds of network traffic data kinds, including both regular traffic and various sorts of assaults.
Remove Outliers: Identify and remove outliers that might introduce noise into your data. Missing Value Imputation: Handle missing values using techniques like mean imputation, forward/backward filling, or interpolation. Smoothing: Apply smoothing techniques like moving averages to reduce noise in the data. Normalization/Standardization: Scale your data to a common range to make it easier for the LSTM to learn patterns. Feature Selection: Remove irrelevant or redundant features that could introduce noise. Text Data Cleaning: For text data, remove punctuation, convert to lowercase, and remove stop words to reduce noise. Time Series Data Resampling: Resample time series data at a consistent frequency to handle irregularities. Dimensionality Reduction: Use techniques like PCA or t-SNE to reduce high-dimensional data while retaining important information. Data Augmentation: Create additional training samples by applying small transformations or perturbations to your data. Filtering: Apply filters to remove high-frequency noise in time series data.
CICIDS2019 has a total sample count of 2,484,578, with benign samples having the highest value in the database at 1,803,621. The infiltration samples, on the other hand, only show very low values of 36. An in-class sample size imbalance this high frequently produces biased categorization results. To prevent a decline in overall performance, it needs to be avoided in the suggested model. Before normalising the remaining features, the dataset is first preprocessed to remove unnecessary features. This phase is crucial for preventing model bias towards any certain feature or trait. Fig. 5 shows the data selection involved in selecting specific types of attacks or a particular time for training and testing.
Figure 5: Data selection
Once the data has been pre-processed, the next step is to select the relevant subset of data for training and testing the RNN model. Fig. 6 shows the data preprocessing. The raw network traffic data needs to be pre-processed to extract the relevant features and transform them into a suitable format for training the RNN model.
Figure 6: Data pre-processing
This could involve tasks such as data cleaning, feature engineering, and normalization. Fig. 7 shows the data label encoding process.
Figure 7: Data label encoding
Label encoding is the process of converting categorical data into a numerical format so that learning models.
Categorical features are a kind of data that stands in for qualitative variables; instead of taking on numerical values, they take on values that stand in for categories or groups. Whether or not the categories have a natural hierarchy determines whether the properties of the categories are nominal or ordinal. Colors and city names are examples of nominal categorical features because there is no innate hierarchy or ranking in such data. A dataset containing information about automobiles, for instance, would have a “color” feature, which is a type of categorical data that might be populated with values like “red,” “blue,” and “green.” Ordinal categorical features describe data that lends itself to a natural ordering or ranking, such as education or income level. In a dataset describing humans, for instance, a feature labelled “education level” might be present. This feature might be subdivided into three subcategories: “high school,” “college,” and “graduate school,” with the three subcategories arranged in a natural hierarchy. Categorical features are frequently used as inputs in machine learning models, but they need to be encoded in a unique way for the algorithms to understand them. One-hot encoding, label encoding, and target encoding are all examples of popular encoding strategies. Features that convey data in categories are called “categorical features,” and examples include “attack type” and “protocol type,” respectively. Determine where these factors are located in the data set.
When two collections of things or data points are connected, a mapping is created such that each item or data point in one collection has an exact match in the other collection. Create a mapping that converts the unique categories into unique integers for each characteristic of the categories. It is possible to assign values of 0, 1, and 2 to the TCP, UDP, and ICMP subcategories of the protocol type feature. A map is a connection between a source and a destination.
The goal of regression analysis is to establish a connection between a set of continuous predictors and a set of continuous outcomes. For instance, in real estate, machine learning may be used to predict a home’s value based on its size, location, and other factors. The goal of classification is to learn a mapping between input and output variables that is discrete in nature. You may use machine learning to determine if an email is spam or not by analysing its content and other attributes. The goal of object recognition is to train a system to automatically identify different types of objects based on input photographs. The visual qualities of photographed animals, for instance, may be used by machine learning to classify them as cats, dogs, or birds. Natural Language Processing (NLP) is the process by which one or more texts are processed to produce a desired result, such as a sentiment analysis or a translated document. Product suggestion systems Learning a map between users and things to recommend is the goal of recommender systems. You might use machine learning to recommend movies and books to clients based on their viewing habits and interests.
When dealing with data that has both categories and quantitative components, label encoding is the method of choice. Label encoding involves assigning a distinct integer code, starting with 0 for the first category, 1 for the second category, and so on, to each category or value of a categorical characteristic. Take the feature “fruit,” which might define the categories “apple,” “banana,” and “orange.” For example, in label encoding, “apple” could be given the digit zero, “banana” the number one, and “orange” the number two. Although the label encoding process maintains the natural ordering of the categorical values in the numerical codes, it is frequently utilised in such cases. It is worth noting, nonetheless, that the categories’ placement in this list may not reflect any meaningful numerical relationship. Since there is no natural numerical link between the categories, label encoding can generate unexpected biases in the study. Labeling the categorical feature “gender” with “male” as 0 and “female” as 1, for instance, may imply a numerical relationship between the two categories that is not there. One-hot encoding is ideal in these circumstances since it converts categories into binary vectors. Convert the categorical values in the dataset to their corresponding integer values using the mappings generated in the previous step.
It might imply different things in different circumstances, but generally speaking, “save the mapping” refers to preserving or recording the connection between two items. The act of linking one group of items or data to another is referred to as “mapping,” and it is frequently done for analytical, modeling, or visual purposes. Save the mapping for each category feature so that, during testing and deployment, the same mapping may be used with fresh data. Here are some examples of saving a map in machine learning: Model serialization: Serializing the learned model is a typical technique for preserving a mapping. This entails writing the model’s structure and parameters to a file. To make predictions on fresh data, the stored model may be imported and used later. Pickling: Pickling is an additional Python way of storing a mapping. This entails saving the Python object to a file after serialising it to a byte stream. Predictions may then be made using the stored object, which can be loaded later. Database saving: Another choice is to store the mapping in a database. This might be helpful in scenarios where numerous people or apps need to access the mapping. Exporting to a file format: You may also export the mapping in a format that other programmes can read. For instance, in the case of object recognition, the mapping may be converted to a format that can be used on mobile devices, such as TensorFlow Lite.
Scaling data is the process of transforming numerical data to fit within a specific range or distribution. Scaling is often used in machine learning to improve the accuracy and performance of models, especially when features have different ranges or units. Two common methods for scaling data are: Min-max scaling: The goal of min-max scaling is to make the data fit within a narrower interval, typically between 0 and 1. To calculate min-max scaling, you would use this formula:
where X is the unique data, X_min is the least value of X, X_max is the supreme value of X, and X_scaled is the scaled data.
Standardization: Standardization transforms data to have a mean of 0 and a standard deviation of 1. The formula for standardization is:
where X represents the unscaled data set, X mean represents the mean of X, X_std represents the standard deviation of X, and X_scaled represents the scaled data set. It is common practise to scale the data in the dataset independently for each feature or column. If you are going to scale some numbers, be sure you are using a strategy that works well with your data and the issue you are trying to solve. Data leakage can be avoided and generalizability can be ensured by just scaling the training data and then applying the same scaling to the validation and test data. Scaling the data can ensure that all the characteristic ranges are comparable. This can be done with methods like min-max scaling or standardizing.
The training set is used to teach the model, while the test set is used to assess its presentation. The most common approach for splitting the dataset into training and test sets is to use stratified sampling, which guarantees that each set has a balanced distribution of classes. If, for instance, the dataset has 60% benign traffic and 40% malicious traffic, the stratified sampling technique will ensure that the training set and the test set have the same ratio of benign and harmful traffic samples. After the dataset is split into training and test sets, the model is trained on the former and its accuracy is evaluated on the latter. Evaluation metrics for intrusion detection models include precision, recall, F1-score, and accuracy. The model’s efficiency can be increased, and overfitting can be mitigated through the use of cross-validation techniques. To do cross-validation, a dataset is first partitioned into multiple subsets; afterward, a model is trained on each subset and its performance is evaluated on the other subsets. This approach can help improve the model’s performance by identifying over- and under-fitting.
The cost analysis of an eccentric intrusion detection model based on recurrent neural networks with leveraging LSTM architecture necessitates the consideration of multiple aspects. Labelled data is a prerequisite for training intrusion detection models. Expenses can be incurred because of the procurement, cleansing, and upkeep of this data. The process of assessing the performance and effectiveness of a predictive model is commonly referred to as model evaluation. Cost evaluation entails the execution of the model on a designated test dataset, as well as the allocation of supplementary human resources for the purpose of monitoring and analysis. The optimisation of the model’s performance is contingent upon the tuning of hyperparameters. The process of doing a grid search or random search to identify the optimal combination of hyperparameters can be a laborious and resource-intensive task. The evaluation of the model entails the utilisation of suitable measures such as accuracy, precision, recall, and F1-score. These metrics are computed on either the validation or test set. Gaining comprehension of false positives, false negatives, true positives, and true negatives can offer valuable insights into the behaviour of the model and aid in its refinement. The occurrence of false positives can give rise to superfluous investigations, while false negatives can lead to unnoticed intrusions, both of which carry expensive ramifications. In certain instances, the process of manually examining false positives or false negatives can be both time-intensive and beneficial for enhancing the model. The comprehension and measurement of these expenses are crucial for making well-informed choices for the distribution of resources and guaranteeing the efficacy of the model in identifying intrusions while mitigating financial consequences.
It breaks down the simulation data and several benchmarks used to evaluate the effectiveness of the proposed IDS model. These are the metrics used as yardsticks. The proposed model is compared to nine more widely used classifiers. The effectiveness of the proposed methodology is further validated in the face of imaginative challenges. The CICIDS2019 dataset was designed for use in network intrusion detection and includes both benign and malicious network traffic. Over 80 features are present in the dataset, representing aspects of network flows such as IP addresses, port numbers, protocol types, and traffic volumes. Class-wise evaluation of RNN-LSTM on this dataset requires conducting feature selection, normalization, and data partitioning as pre-processing steps. Once the data has been cleaned and organized, the RNN-LSTM model may be trained using the data, and its results can be analysed using the test data.
Precision, recall, F1-score, and accuracy are only a few of the presentation measures that may be calculated for each class individually and used to assess class-wise performance. This can be done by contrasting the test data’s actual class labels with the projected ones. When a model correctly predicts that an instance belongs to the positive class (in this case, an attack), the prediction is “true positive” (TP). A prediction that turns out to be wrong, in this case, because the instance in question does not belong to the positive class (an attack), as the model had anticipated. To make a negative prediction that turns out to be true, called a “true negative” (TN), the model must first correctly forecast that the instance belongs to the negative class (i.e., not an attack). The term “false negative” (FN) refers to a situation in which the model incorrectly predicts that an instance does not belong to the negative class (i.e., an attack).
In statistics, accuracy is defined as the ratio of examples properly classified to the total number of instances. The proficiency of a classifier is referred to as its accuracy. It accurately predicts the class label, and “predictor accuracy” is the degree to which a specific predictor successfully predicts the value of the predicted characteristic for novel data.
In the context of a classification problem, accuracy is often used to evaluate the overall performance of a model. However, accuracy alone may not be sufficient to evaluate the performance of a model in all scenarios. For example, in a highly imbalanced dataset where one class is much more frequent than the other, accuracy may be high due to the high number of correct predictions for the majority class, but the performance for the minority class may be poor. Therefore, it is important to also consider other metrics, such as the F1-score, depending on the specific problem and the goals of the model. The accuracy of the model can be calculated by dividing the total number of correct predictions (i.e., TP and TN) by the total number of forecasts (i.e., TP + FP + TN + FN). For example, if the model correctly predicts 80 instances out of 100, then the accuracy would be 80%.
Deep learning models, such as (CNNs) and recurrent networks (LSTMs), have shown encouraging results in the intrusion detection sector because of their ability to extract complex properties from temporal data and learn from it. Simple variants of the mean (SVMs) and decision trees, on the other hand, are examples of simpler models that may be easier to understand and implement computationally. However, model performance might vary based on factors like the dataset and application used for training and testing, as well as the parameters and hyperparameters chosen for each. Cross-validation and tuning of model parameters are essential parts of a comprehensive comparison study that will yield the best-performing model for the task at hand.
Many researchers have compared the presentation of several machine learning replicas for intrusion detection. For the NSL-KDD dataset, for instance, a study comparing the accuracy of CNN, RNN-LSTM, and SVM found that the CNN and RNN-LSTM models performed better than the SVM model. The CNN model achieved the highest accuracy, at 98.24%. For the CICIDS2017 dataset, a comparison of the performance of CNN, ANN, and decision tree models indicated that the CNN model had the highest accuracy (99.33%) compared to the other two. The general level of accuracy may change from model to model, dataset to dataset, application to application, and training to evaluation, depending on the parameters and hyperparameters employed. As a result, a comprehensive comparative study is required to identify the top-performing model for the given task. On the other hand, SVM, CNN, DECISION TREE, and ANN models may struggle to detect attacks that have different patterns from what they were trained on. Here are some of the attacks compared with different classifiers. Fig. 8 shows that the accuracy of a brute-force algorithm is contingent on the problem being solved and the size of the input.
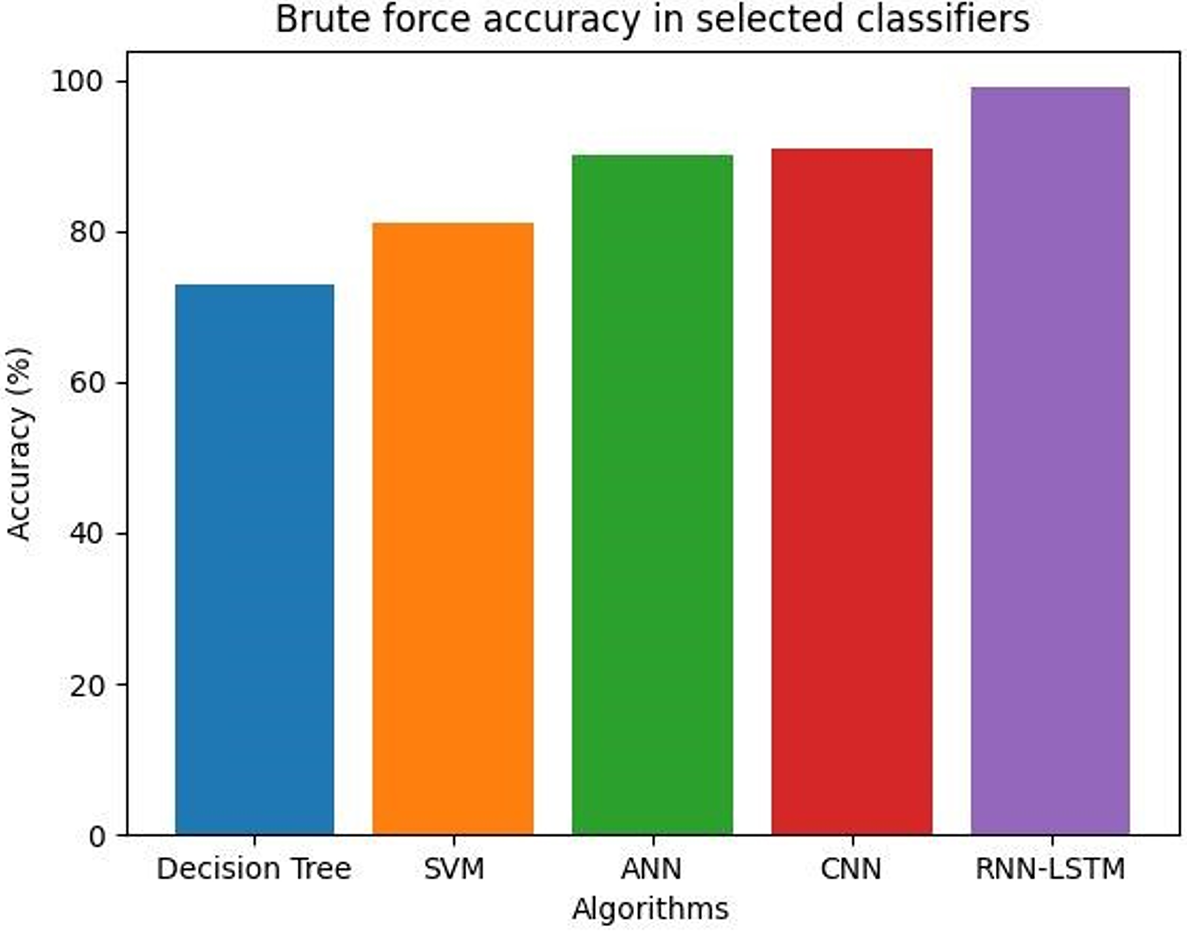
Figure 8: Brute force accuracy of selected classifiers
Table 5 shows the average accuracy values of selected classifiers.

In a brute-force attack, the attacker often uses automated software tools that produce a huge number of potential passwords or encryption keys and iteratively attempts each one until the right one is discovered. This procedure can be time and resource-consuming, but if the attacker is persistent and has sufficient processing power, it may be successful. Fig. 9 shows that the accuracy of a DoS attack detection model designed to detect GoldenEye attacks can vary widely depending on the dataset used, the machine learning algorithm employed, and the evaluation metrics used.
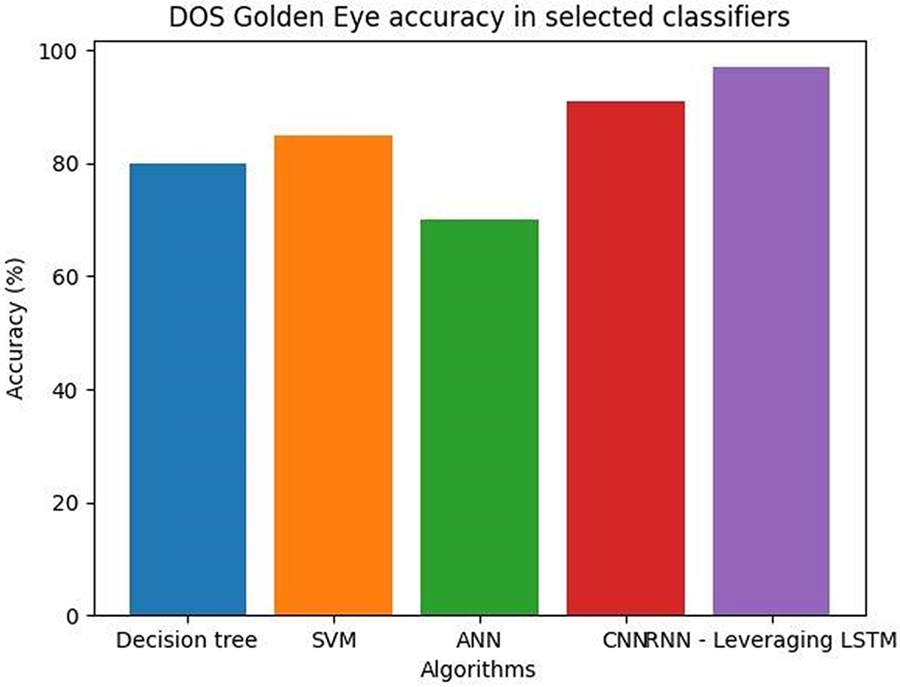
Figure 9: DOS GoldenEye accuracy in selected classifiers
In some cases, a brute force algorithm can achieve perfect accuracy, meaning it always finds the correct solution. In other cases, the accuracy may be lower because the algorithm may miss some possible solutions or return incorrect solutions. Table 6 shows DOS GoldenEye average accuracy values for selected classifiers.
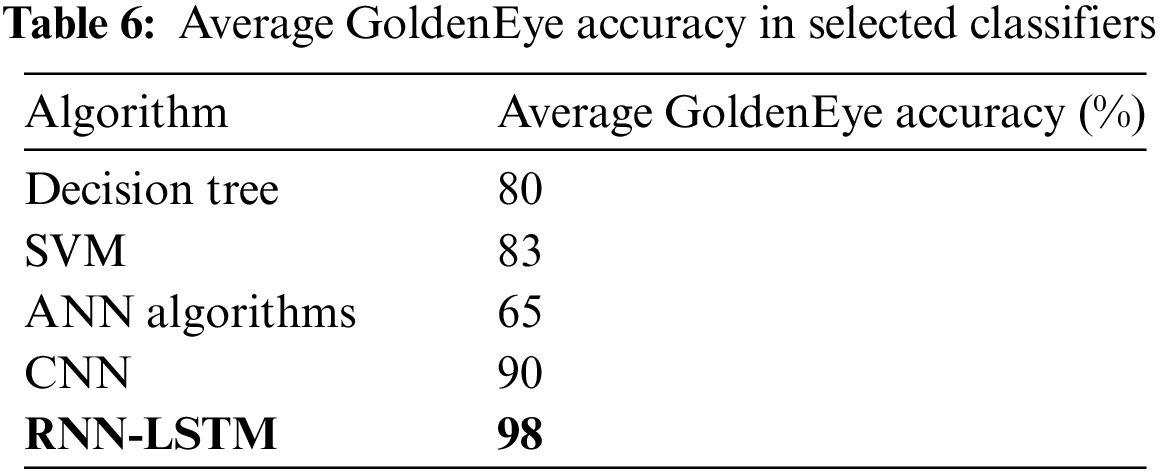
Denial-of-Service (DoS) attacks like GoldenEye can be used to take down a specific network or system. It takes its name from a satellite weapon used to similarly damage electronics in the James Bond movie of the same name. A GoldenEye attack involves the attacker saturating the target network or system with a lot of traffic, which makes it unable to respond to incoming requests [36,37]. This kind of attack can be very successful if the attacker combines several attack channels to send as much traffic as possible, such as HTTP, TCP, and UDP flooding. A high accuracy value can be achieved by using a diverse dataset, a suitable machine learning algorithm, and appropriate evaluation metrics [38]. Fig. 10 shows the DOS HULK accuracy in selected classifiers.
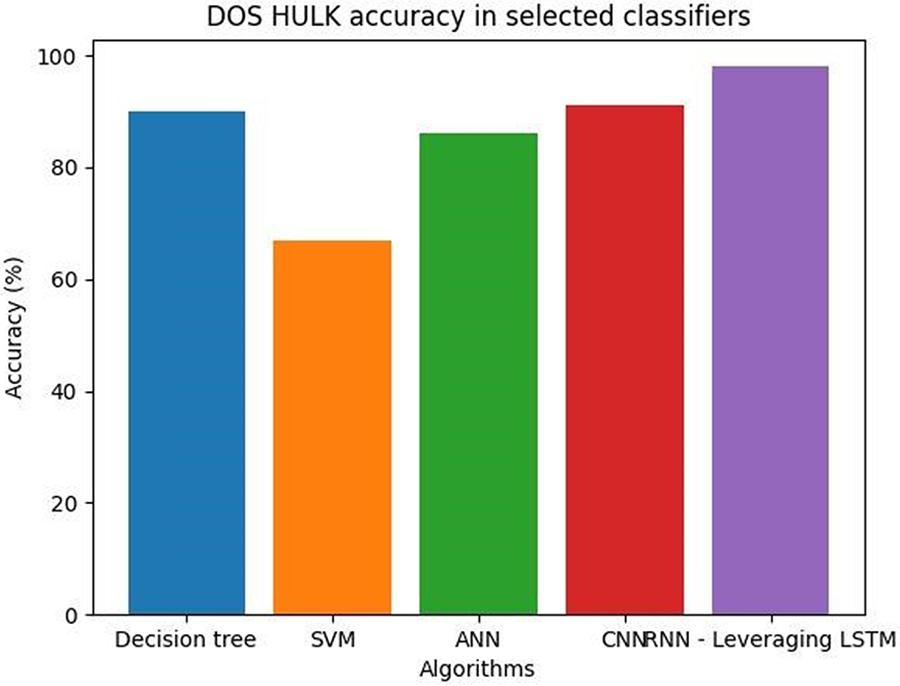
Figure 10: DOS HULK accuracy in selected classifiers
Table 7 shows DOS HULK average accuracy values in selected classifiers.

A port scan attack involves the use of software tools by the attacker to search through a variety of IP addresses and network ports to find those that are open and waiting for connections [39]. The attacker can utilise the knowledge of open ports to execute additional attacks to obtain unauthorised access or try to exploit any known vulnerabilities related to those services. Fig. 11 shows both viable options for a port scan detection system. One method of detecting port scans is called signature-based detection, and it relies on identifying recognisable characteristics of the scanning process itself. Network traffic is compared to a regular range, and an alert is triggered if there is any major deviation from the average.
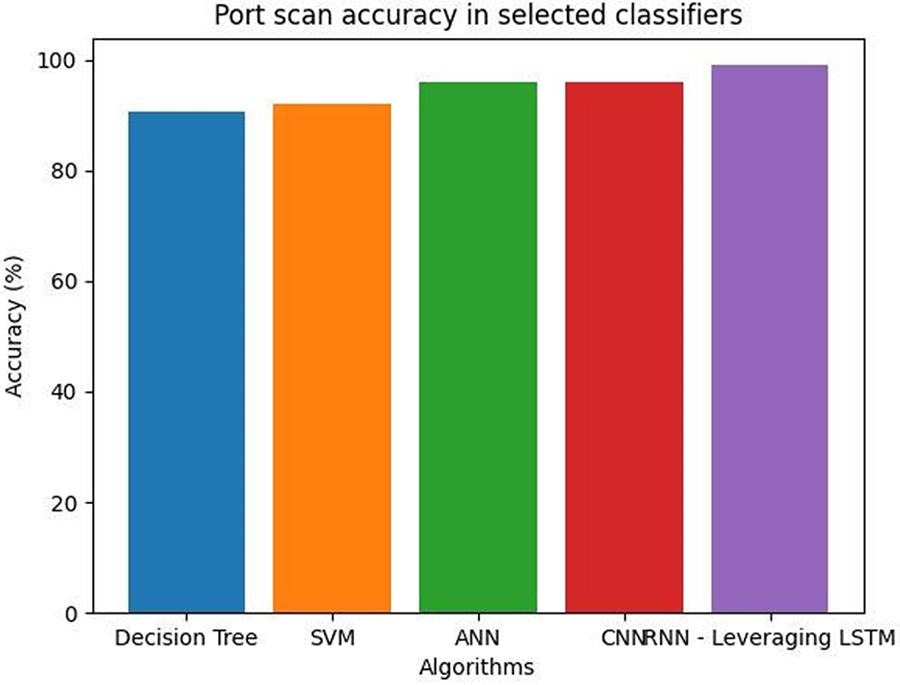
Figure 11: Port scan accuracy in selected classifiers
Table 8 shows the port scan average accuracy values in selected classifiers.
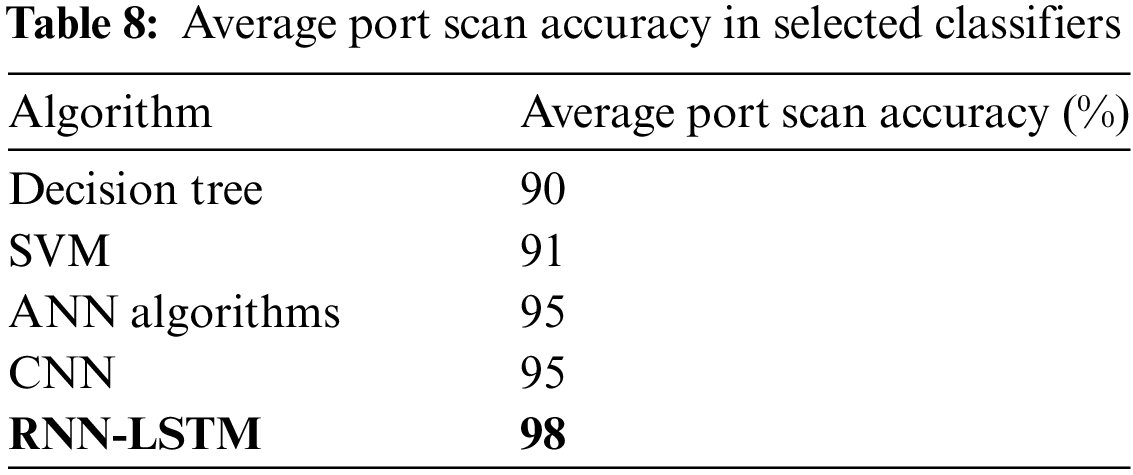
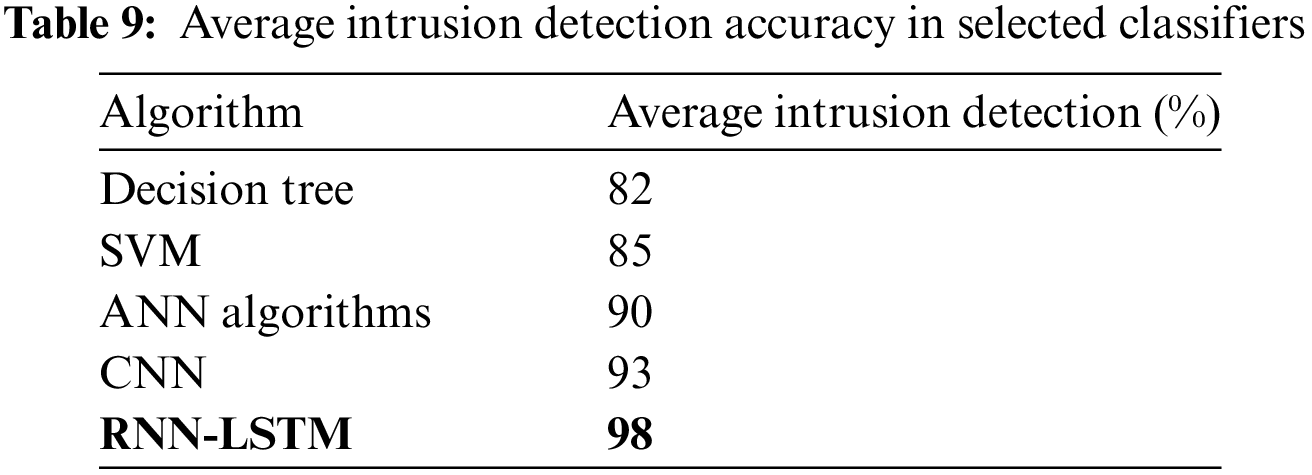
Fig. 12 shows that RNN-LSTM models are better at generalising to new and unseen attacks due to their ability to learn and remember past network traffic patterns.
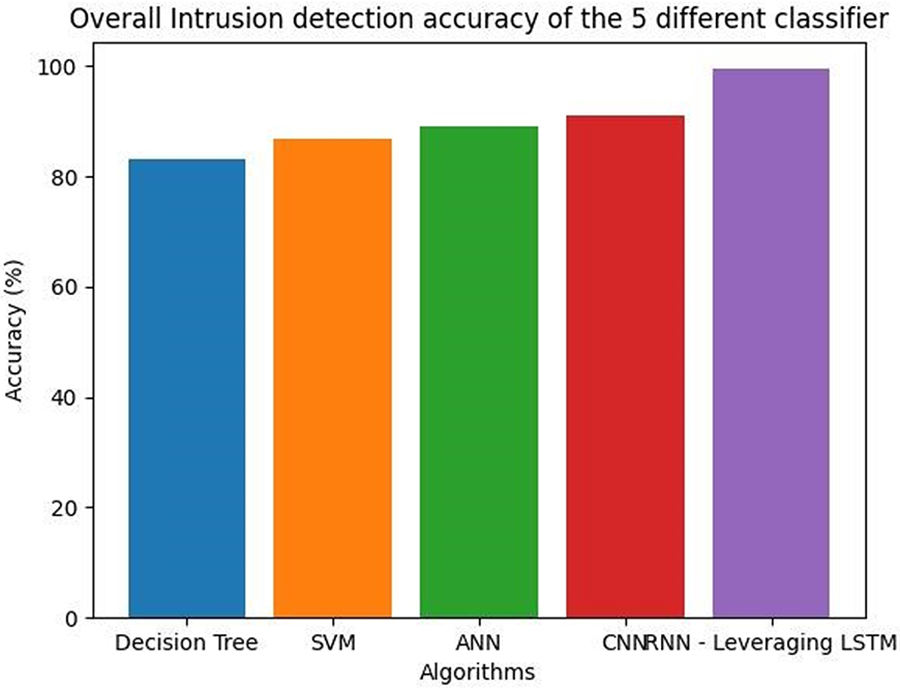
Figure 12: Overall intrusion detection accuracy of the 5 different classifiers
Table 9 shows overall intrusion detection accuracy of the 5 different classifiers.
Precision is defined as the number of true positives divided by the number of true positives plus the number of false positives.
Fig. 13 shows RNN models are better at predicting correctly identifying the positive instances.
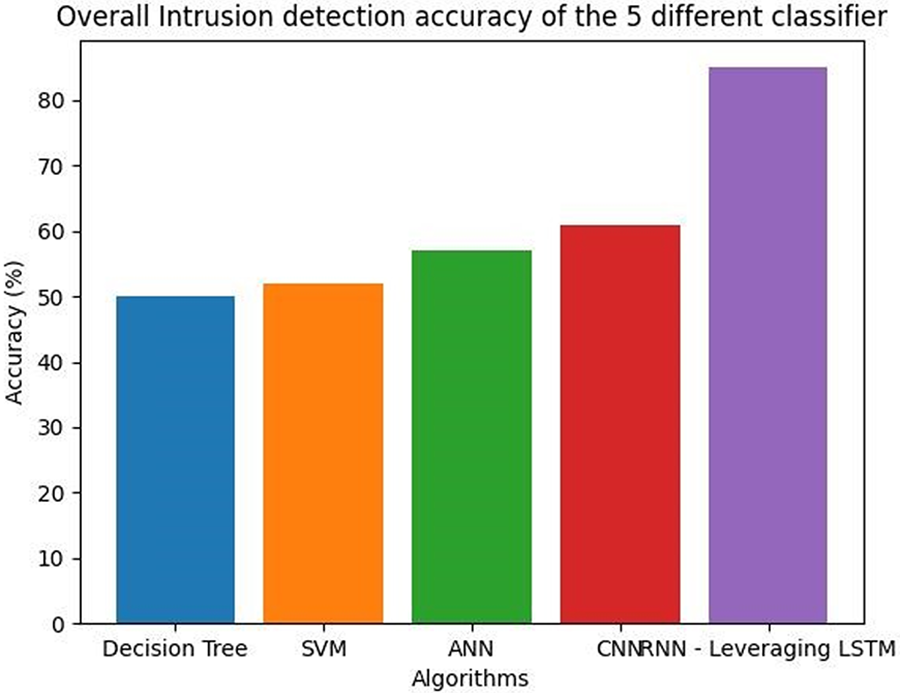
Figure 13: Positive predictive value of five different classifiers
It is a measure of the model’s ability to correctly identify positive instances. Precision is particularly useful when the cost of false positives is high, as it ensures that the instances classified as positive are indeed positive. For example, in a medical diagnosis problem, the cost of a false positive (i.e., diagnosing a healthy patient as having a disease) may be high, as it could lead to unnecessary treatments or procedures [40,41]. In this case, high precision is desirable to minimise the number of false positives. Table 10 shows the positive predictive value of five different classifiers.
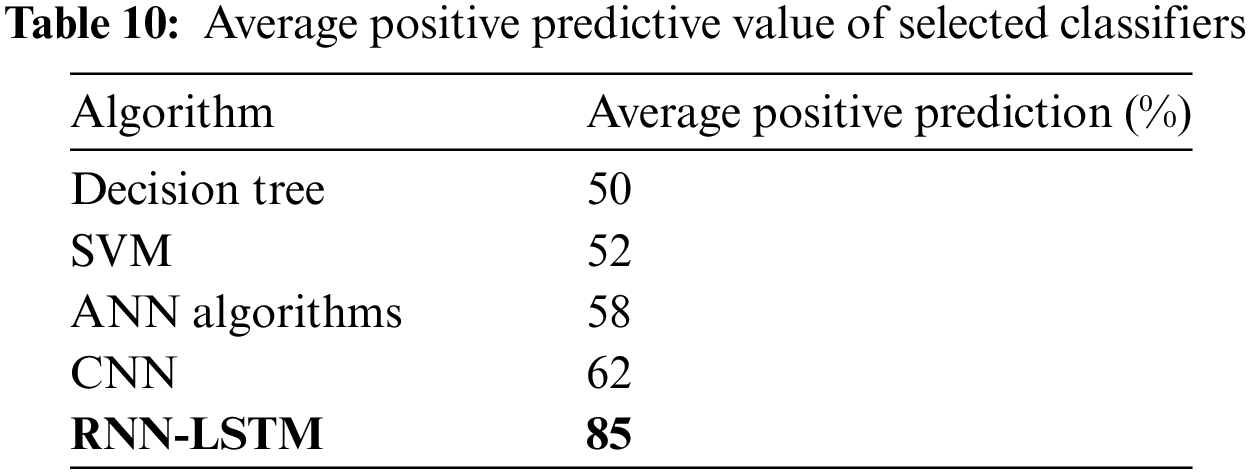
On the other hand, a low degree of precision means that many instances predicted as positive were negative, which can lead to unnecessary actions or investigations. Therefore, in Fig. 13, precision should be considered along with other metrics such as recall and F1-score to evaluate the overall performance of a model. The precision of the model can be calculated by dividing the number of true positives (TP) by the total number of instances predicted as positive (i.e., TP + FP). For example, if the model predicts 50 instances as positive and 40 of them are positive, then the precision would be 42.5/50 = 85%.
In statistics, recall measures how many correct answers were given out of a total number of possible answers. In the context of a binary classification system, the term “recall” is replaced with “sensitivity.” You might think of it as the likelihood that your query will provide a relevant result.
It is a measure of the model’s ability to correctly identify all positive instances, regardless of whether some of them are incorrectly classified as negative. The recall is particularly useful when the cost of false negatives is high, as it ensures that all positive instances are identified. For example, in a fraud detection problem, the cost of a false negative (i.e., failing to detect a fraudulent transaction) may be high, as it could lead to financial losses or reputational damage. In this case, a high recall is desirable to minimise the number of false negatives.
Fig. 14 shows sensitivity graph of five different classifiers.
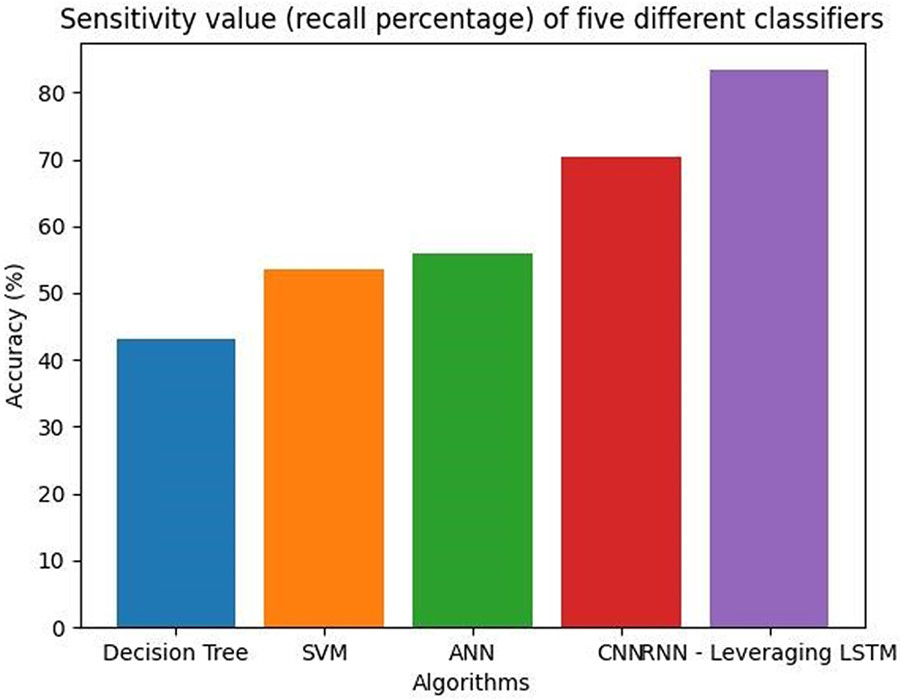
Figure 14: Sensitivity value (recall percentage) of five different classifiers
Table 11 shows average sensitivity table values of five different classifiers.

If the number of positive occurrences is limited, then there will be fewer opportunities and threats detected. Consequently, in addition to precision and F1-score, recall is an important parameter to consider when judging a model’s efficacy. The recall is defined as the ratio of true positives to all positive cases (TP + FN). Suppose there are 60 positive examples and the model predicts 50 of them accurately; in this case, the recall would be 50/60, or 83.33%.
A single measure of a classification model’s efficacy, the F1-score incorporates both precision and recall. A perfect score of 1 indicates flawless precision and recall, whereas a score of 0 indicates poor performance. When the classes are not evenly matched, or when the cost of false positives and false negatives differs, the F1-score becomes especially helpful. It is a good way to evaluate the model’s performance in classifying positive and negative data. A formula for determining the F1-score is as follows:
where Precision = TP/(TP + FP) and Recall = TP/(TP + FN).
Fig. 15 shows the detection of cyberattacks.
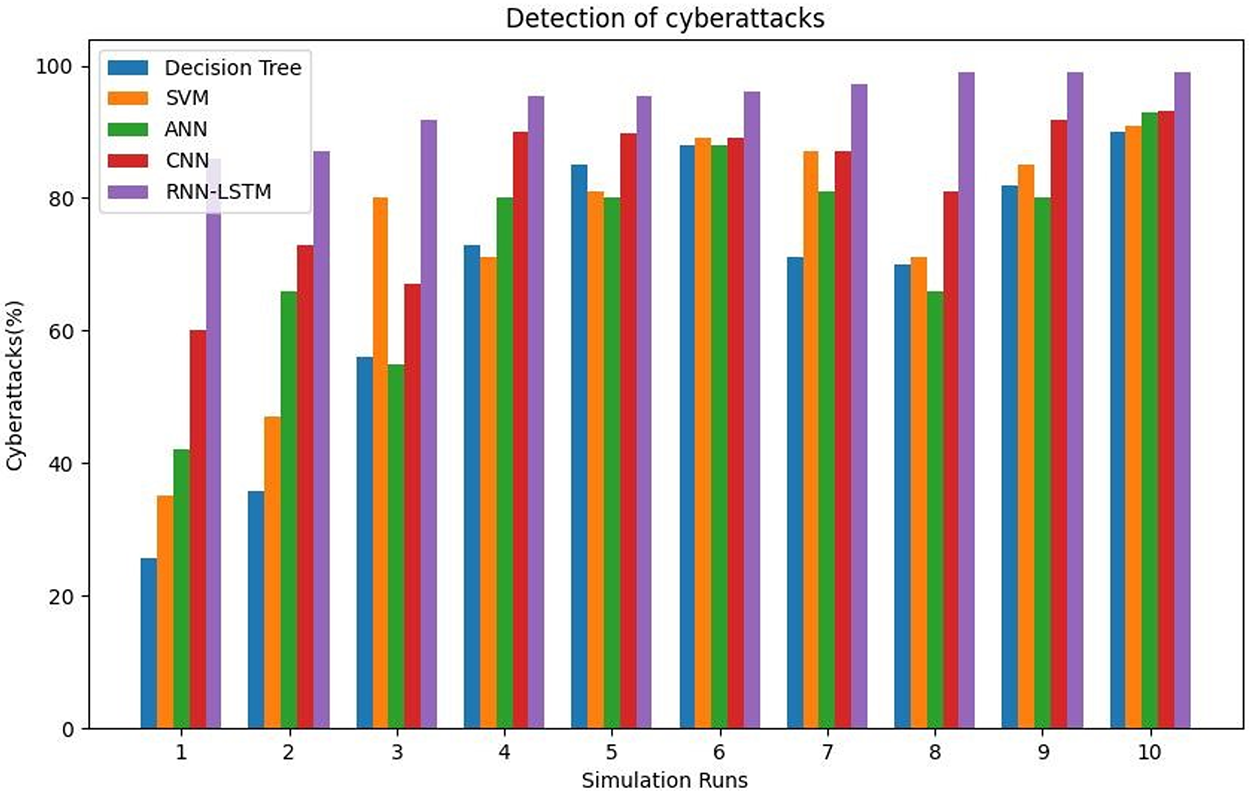
Figure 15: Detection of cyberattacks
When both precision and recall are equally significant, the F1-score is a helpful indicator for evaluating the performance of classification algorithms. It is vital to keep in mind that the relative weight of precision and recall can shift depending on the nature of the task at hand or the topic being studied. Such situations require a disaggregated assessment of precision, recall, and any other relevant measures. A graphical representation of the performance of a binary classifier system as the acumen threshold is changed is shown by the ROC curve. By contrasting the true positive rate (TPR) with the false positive rate (FPR) at various cutoff points, the ROC curve may be generated. The true positive rate (TPR), also known as sensitivity, is the percentage of true positive examples that were accurately classified as such by the classifier. The sum of true positives is divided by the total number of positive and negative results (TP/(TP + FN)). Table 12 shows the detection values of cyber-attacks.

XGBoost, short for Extreme Gradient Boosting, is a sophisticated machine learning algorithm that has gained prominence for its exceptional performance in supervised learning tasks. Falling under the gradient boosting framework, XGBoost constructs a powerful predictive model by iteratively combining the outputs of multiple weak models, typically decision trees. It effectively addresses the bias-variance trade-off by minimising both bias and variance, leading to robust and accurate predictions. In the context of intrusion detection on neural networks, XGBoost serves as a valuable augmentation strategy to enhance the capabilities of neural network-based intrusion detection systems (IDS). Intrusion detection involves identifying unauthorised or malicious activities within a computer network. While neural networks excel at capturing intricate patterns in data, they might not always perform optimally in specific aspects of intrusion detection. This is where XGBoost comes into play.
Utilizing XGBoost in conjunction with neural networks offers several advantages. First, it enables the extraction of features from the neural network’s outputs, or an additional layer of decision-making based on both neural network predictions and supplementary features. This fusion of models can mitigate the limitations of each approach, leading to improved detection accuracy and overall robustness. AdaBoost, or adaptive boosting, is a powerful ensemble learning technique that enhances the performance of weak learners by iteratively combining their predictions. It assigns higher weights to instances that are misclassified in each iteration, making subsequent weak models focus on those instances. The final prediction is formed by aggregating the weighted outputs of these models. AdaBoost is effective at improving classification accuracy and handling complex data distributions, making it a versatile tool in machine learning.
In the realm of intrusion detection with neural networks, AdaBoost can play a strategic role. by integrating AdaBoost with neural network-based intrusion detection systems (IDS), leveraging the strengths of both approaches. Neural networks excel at capturing intricate patterns in network data, while AdaBoost can further refine its predictions by identifying and focusing on challenging instances. This combined approach enhances the detection capabilities of the IDS, making it more adept at identifying unauthorised activities and anomalies in the network traffic. By integrating AdaBoost with neural networks, organisations can achieve a robust and adaptive intrusion detection system that offers improved accuracy and resilience against evolving cybersecurity threats.
Fig. 16 shows accuracy comparison on XGBoost and AdaBoost with RNN-LSTM.
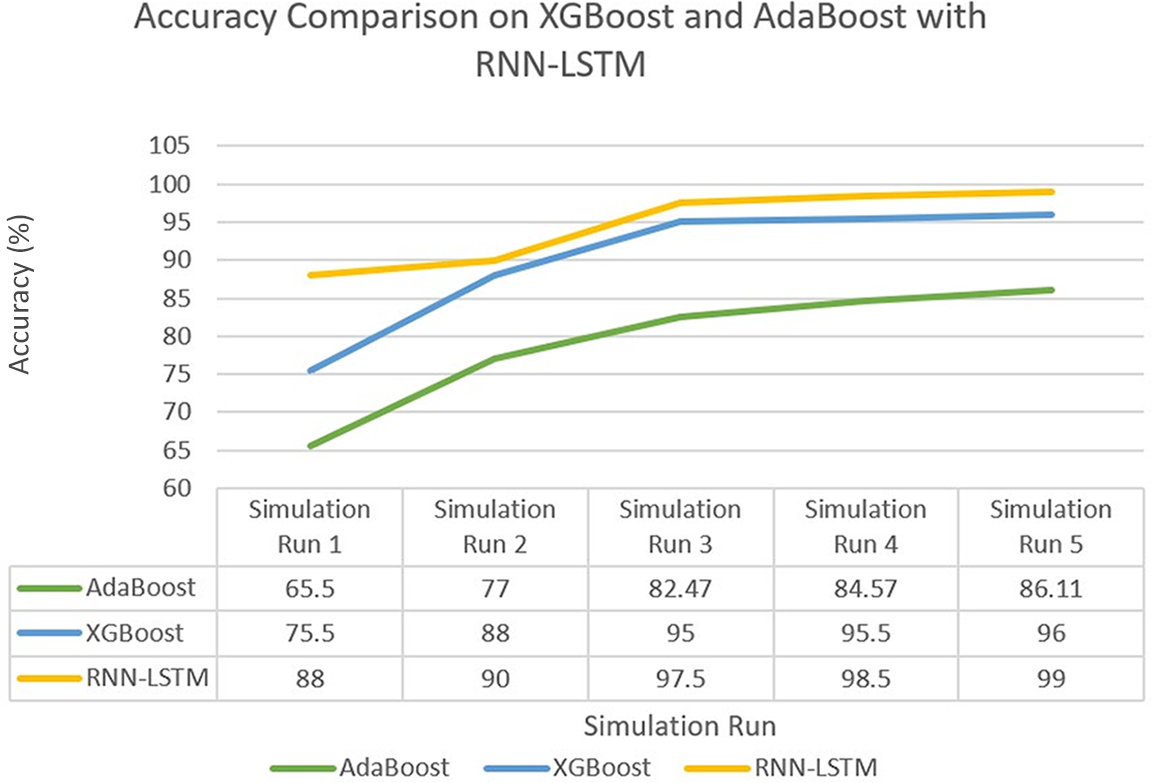
Figure 16: Accuracy comparison on XGBoost and AdaBoost with RNN_LSTM
Intruder detection systems have a serious problem with false positives. A low false positive rate implies that the model is accurately recognising genuine incursions while limiting false alarms, making it a significant indicator for comparing the performance of various models. Fig. 17 shows the FPR values of the five selected classifiers using brute force.
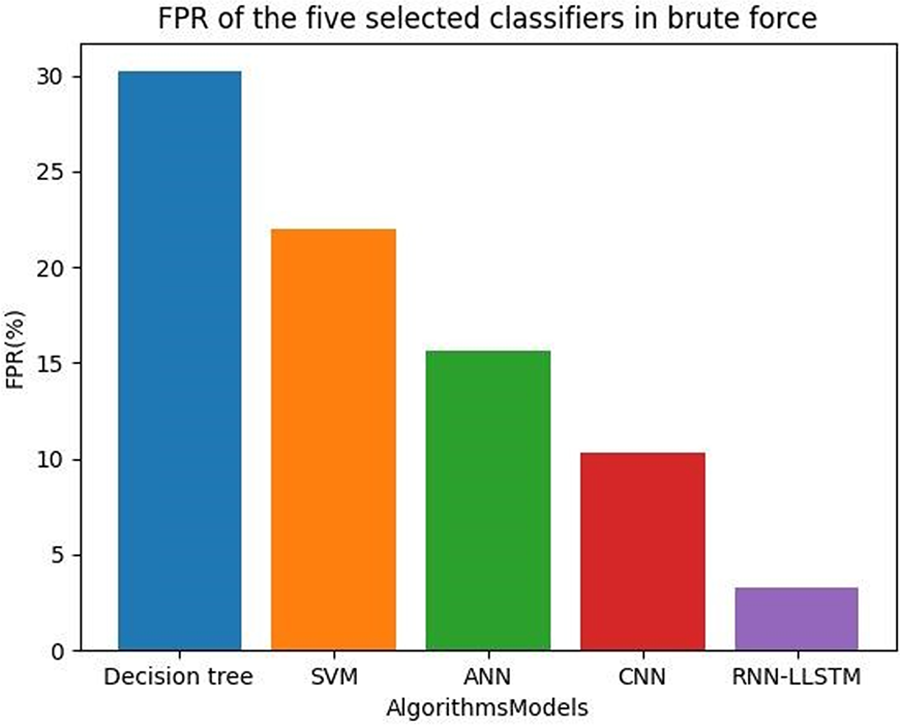
Figure 17: FPR of the five selected classifiers in brute force
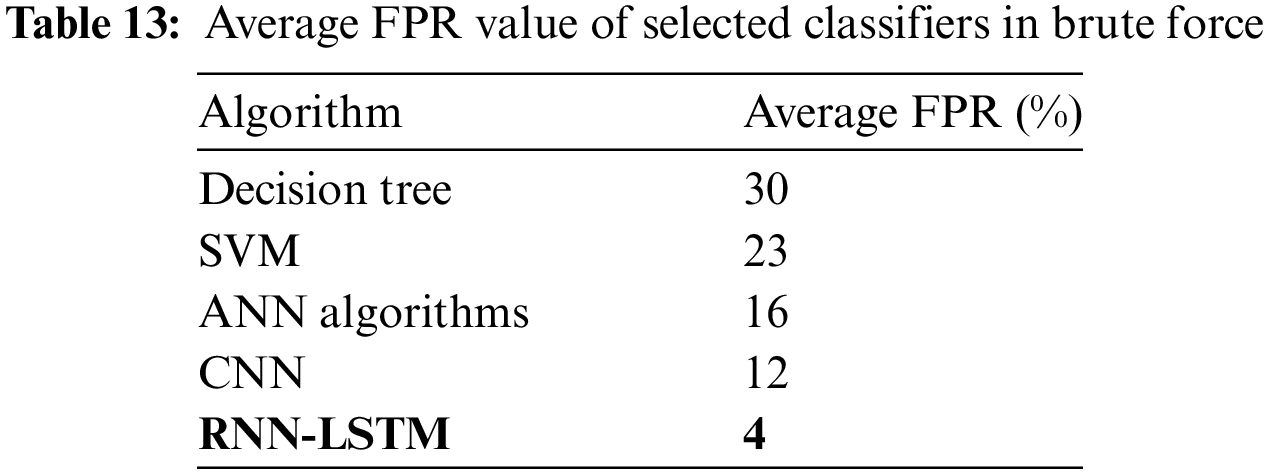
The brute force algorithms that are typically used for exhaustive searches or enumerations of all possible solutions to a problem. Table 13 shows the FPR values of the five selected classifiers in brute force.
Research has examined the efficacy of several machine learning models, such as networks with long detecting intrusions in other datasets. A study that tested these models’ efficacy on the NSL-KDD dataset indicated that the SVM model had the lowest false positive rate, followed by the RNN-LSTM and the CNN models. Researchers looked at how well CNN, ANN, and decision tree models performed on the CICIDS2017 dataset and found that the CNN model had the lowest false positive rate. Though, that the models’ efficacy may change based on the details of the dataset and the task at hand, as well as the assessment and training settings. This means that to find the model that performs best in terms of false positive rates in CICIDS2019, a complete comparative analysis, including cross-validation and parameter adjustment, must be performed. They are not typically used for classification or identification tasks where false positives are a concern. Instead, classification algorithms such as decision trees, logistic regression, or neural systems are used, which may have false positive rates depending on the specific algorithm and application. Fig. 18 shows the FPR of a GoldenEye attack detection model can be influenced by various factors, including the dataset used, the machine learning algorithm employed, and the threshold value set for the model.
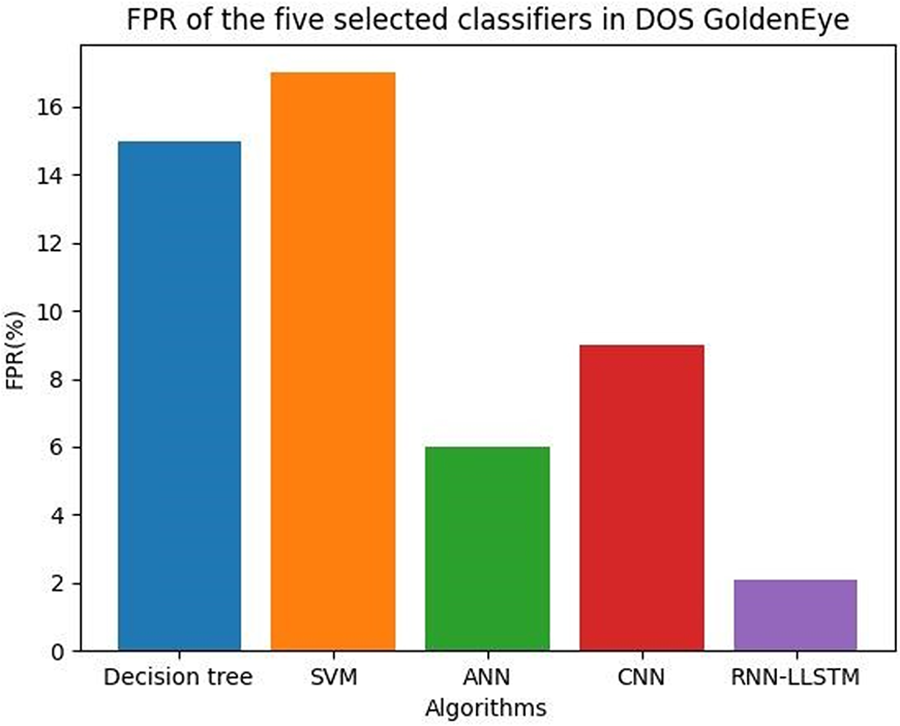
Figure 18: FPR of the five selected classifiers in DOS GoldenEye
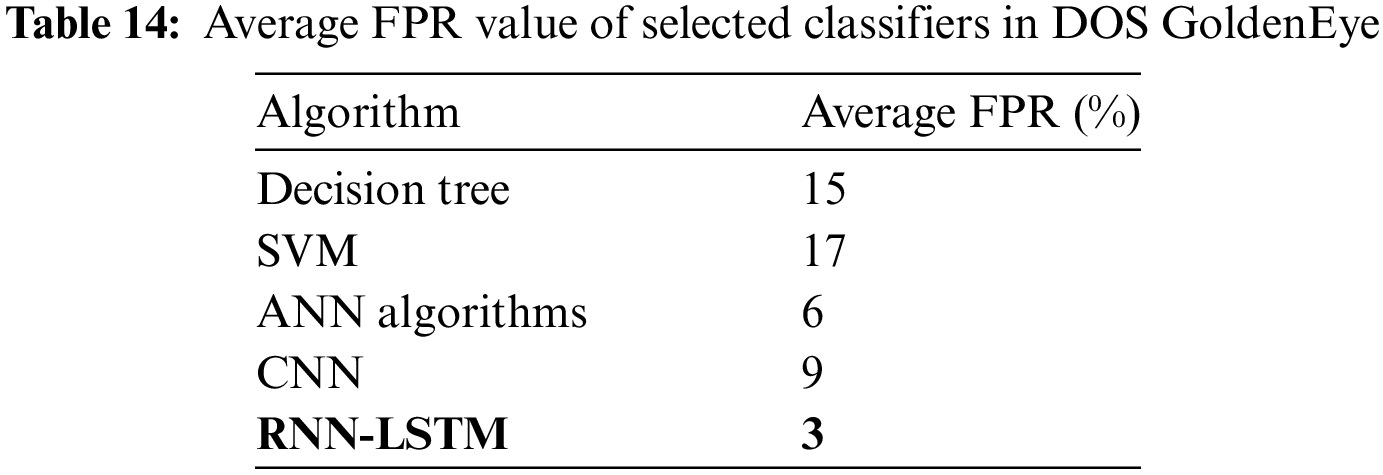
Table 14 shows the FPR values of the five selected classifiers in DOS GoldenEye.
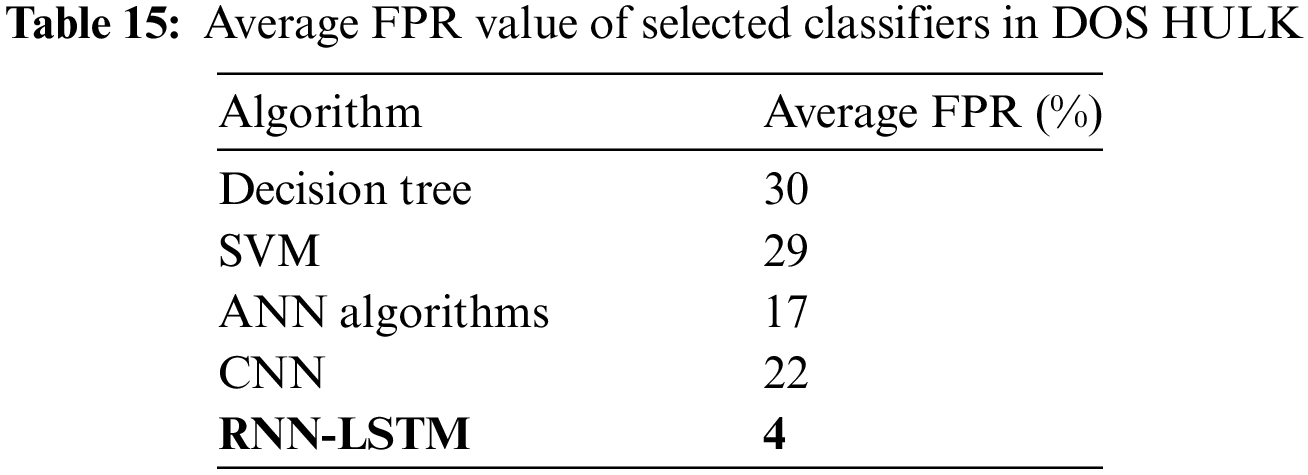
Typically, the FPR value is a function of the threshold value; the lower the threshold value, the higher the FPR, and vice versa. Fig. 19 shows the FPR of a HULK attack detection model can be influenced by various factors, including the dataset used, the machine learning algorithm employed, and the threshold value set for the model.
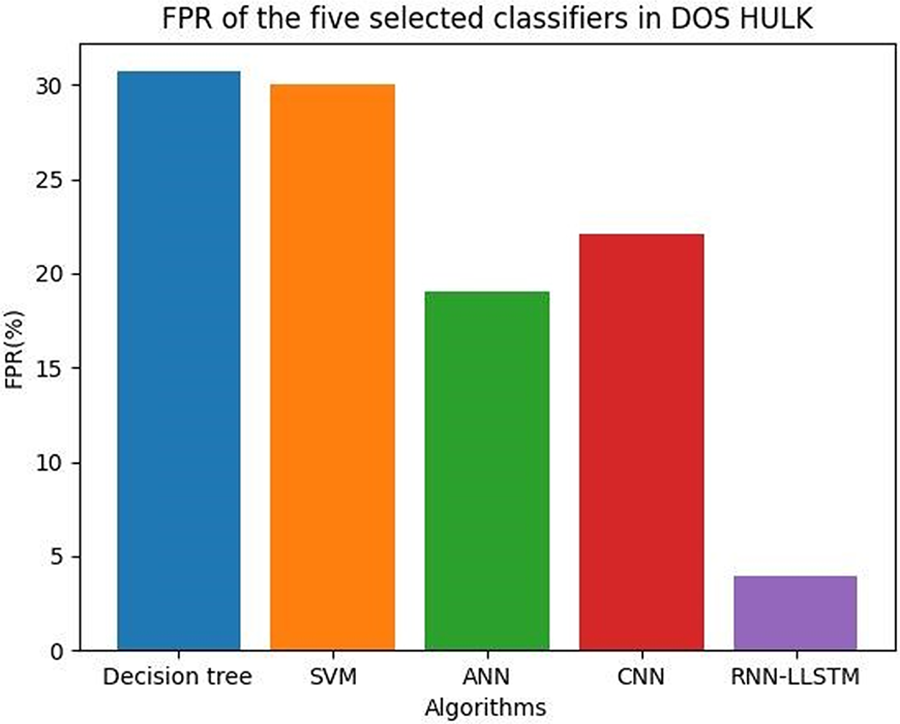
Figure 19: FPR of the five selected classifiers in DOS HULK
Table 15 shows the FPR values of the five selected classifiers in DOS HULK.
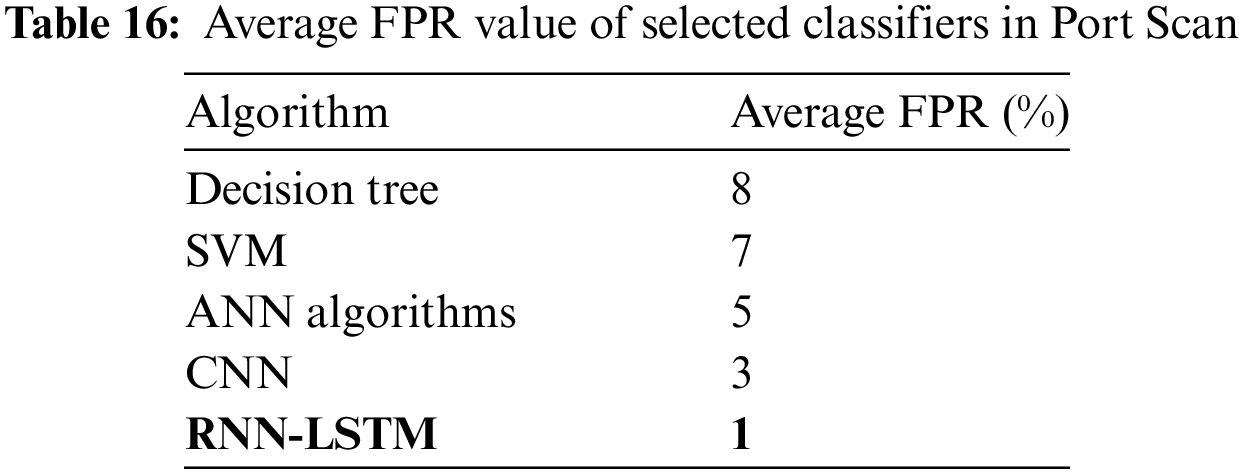
Typically, the FPR value is a function of the threshold value; the lower the threshold value, the higher the FPR, and vice versa. Fig. 20 shows FPR of the five selected classifiers in the Port scan.
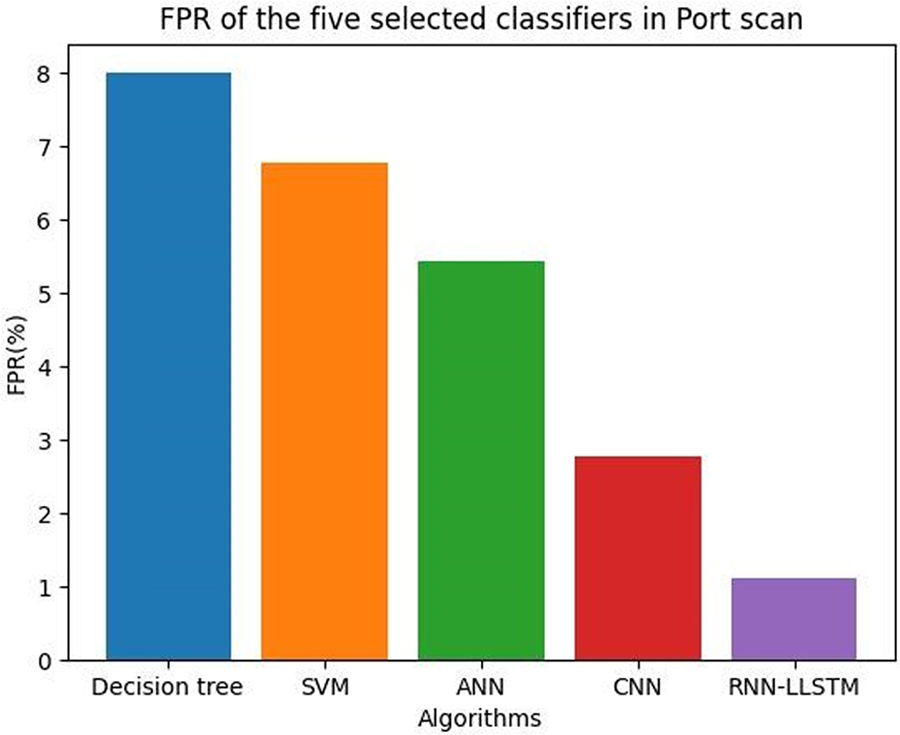
Figure 20: FPR of the five selected classifiers in the Port scan
Table 16 shows the FPR values of the five selected classifiers in the Port scan.
Several things can affect the false positive rate (FPR) of a port scan detection system; bringing it down calls for thoughtful feature selection, fine-tuning of the threshold, and the application of ensemble learning methods. Because of the negative effects that false alarms have on a system, it is preferable to have a low FPR. This implies that the system can successfully differentiate between benign activity, such as regular traffic, and malicious activity, such as port scans. However, Fig. 21 indicates that the accuracy of different models varies depending on things like the dataset employed, the quality of the feature engineering, the values of the hyperparameters, and so on.
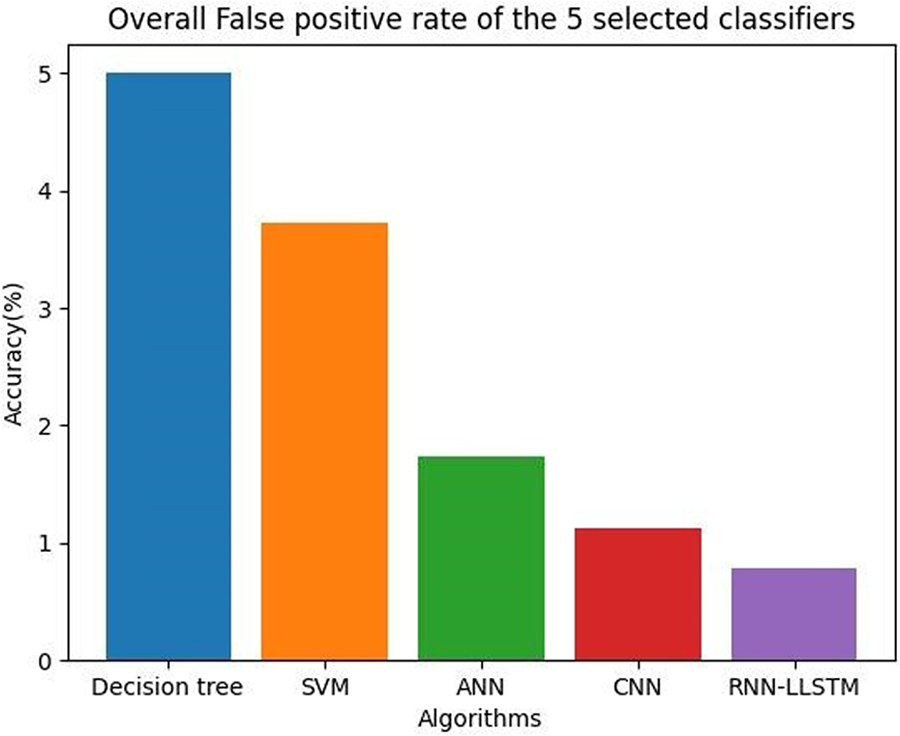
Figure 21: Overall false positive rate of the 5 selected classifiers
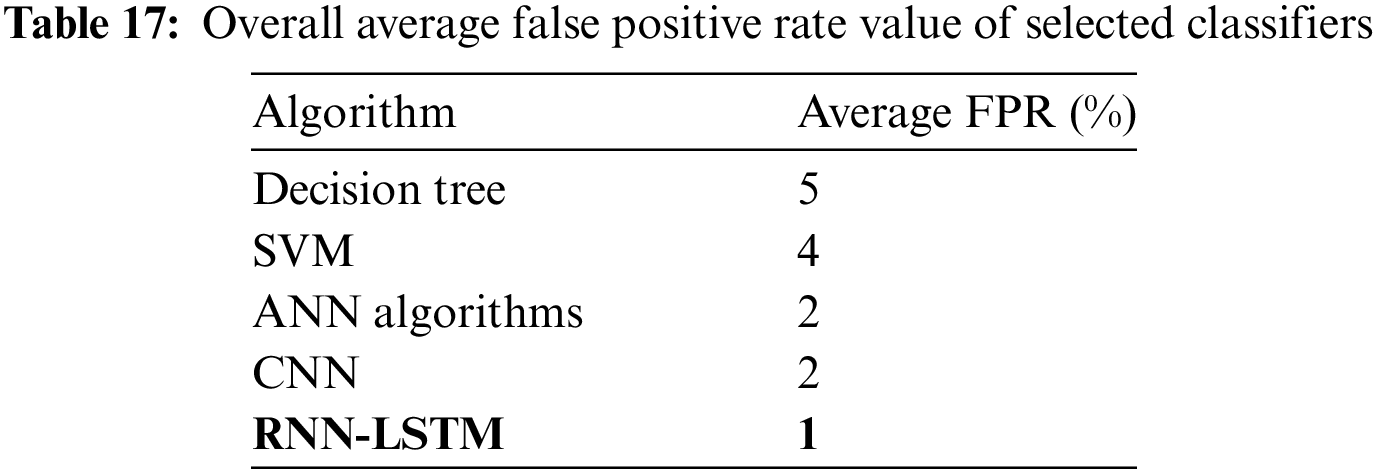
Table 17 shows the overall false positive rate values of the 5 selected classifiers.
These findings are contingent on the details of the experiments performed. It is important to consider both the pace at which attacks are detected and the number of attacks that go undetected. To compare the performance of different models for intrusion detection, you need to look at both the task-specific criteria and the characteristics of the dataset. To evaluate the relative merits of different models, it is recommended that you consult with knowledgeable professionals and conduct rigorous experiments.
When a classifier incorrectly labels some real negative samples as positive, this is called a false positive rate (FPR) or a fall-out rate. The false positive rate is calculated. Adjusting the threshold for recognising instances as positive or negative leads to various TPR and FPR values, which lead to varied positions on the ROC curve. A perfect classifier system, then, would sit in the upper left corner of the ROC curve, with a TPR of 1 and an FPR of 0. The area under the AUC for a purely random categorization system would be slanted to the right.
The trade-off between true positive and false positive rates at different categorization levels is visually represented by the ROC curve. A classifier system with a ROC curve that is closer to the top left corner is preferred since it indicates higher TPR at lower FPR values, which in turn suggests better performance. Another common technique for evaluating a binary classifier’s accuracy is the area under the curve (AUC). If a classifier system were efficient, its area under the curve (AUC) would be 1, but if it were fully random, it would be 0.5. The AUC provides a single metric that sums up the classifier’s efficacy over all possible thresholds.
When the correct answers to a dataset are available, the performance of the “classifier” may be measured using a confusion matrix. Despite the simplicity of the confusion matrix idea, its name might be difficult to remember. Fig. 22 shows the confusion matrix.
Figure 22: Confusion matrix
When evaluating the accuracy of a classification model, the confusion matrix provides a more thorough assessment because it considers not only the number of correct predictions but also the number of incorrect ones. It shines in cases where the classes are unbalanced or where the cost of false positives and false negatives differs. Fig. 23 shows the data reading process.
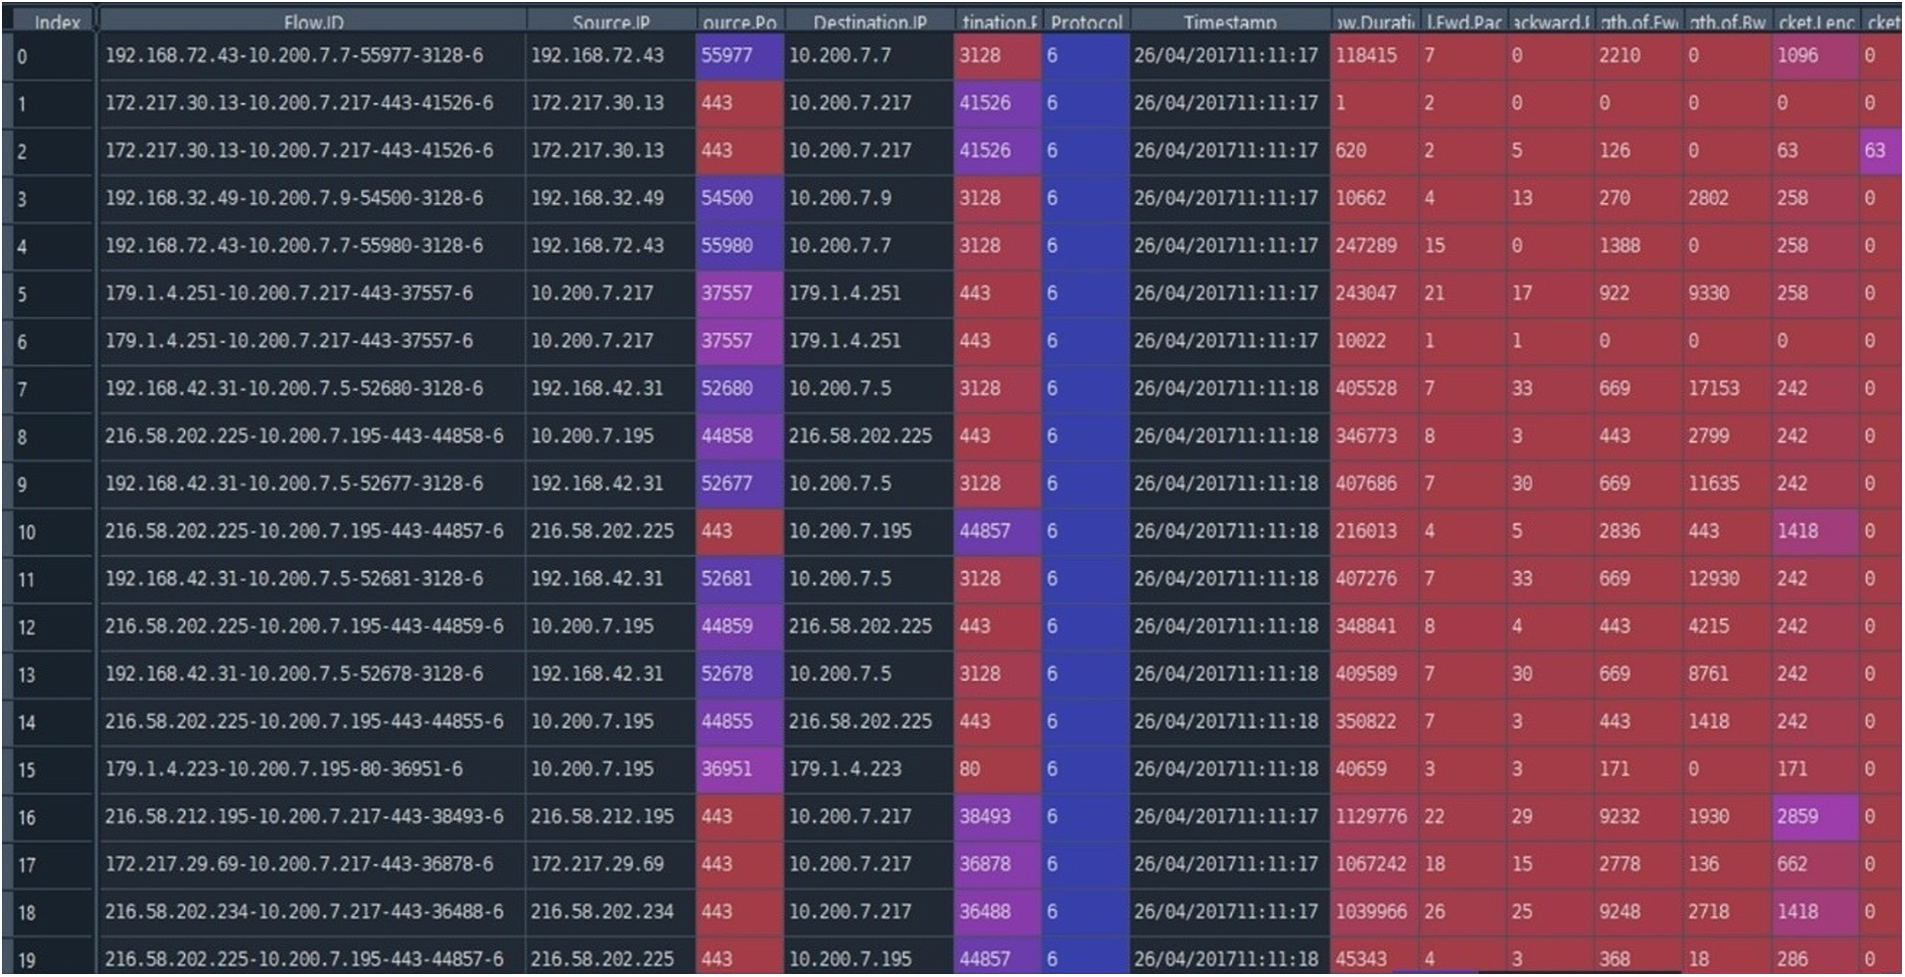
Figure 23: Reading dataset
The dataset is provided in a compressed format, and after downloading, you need to extract it to a local directory on your computer. Once the dataset is extracted, you can read the individual files using a programming language such as Python or R. The dataset consists of various CSV files containing network traffic data, including flow-level features and payload data. You can use standard file input/output methods in Python or R to read the CSV files, or you can use specialised libraries such as pandas in Python or a data table in R to read and manipulate the data [42]. Fig. 24 shows the accuracy of cyberattack classes and epoch.
Figure 24: Accuracy of cyberattack classes and epoch
The feature selection techniques employed in this study include Principal Component Analysis (PCA) and Ensemble Feature Selection (EFS). These methods are utilized to identify and choose significant attributes from the newly acquired information [43]. The process of prediction involves the identification of early indicators of network attacks prior to their progression into more advanced stages. The metastability theory offers a framework for unsupervised statistical learning and the detection of imminent DDoS attacks [44]. The datasets employed in the investigations are delineated, followed by an analysis of the precision of the outcomes derived from the scrutinized research [45]. Python was employed as the simulation tool. Upon the use of machine learning models, a confusion matrix was constructed to assess the efficacy of the model in accurately identifying and classifying data [46,47]. Fig. 25 shows the accuracy achieved and its average values.
Figure 25: Accuracy achieved
The system under consideration demonstrates a high level of effectiveness in accurately categorizing network flow events as either benign or hostile. The evaluation of the algorithm’s performance is conducted by assessing precision, false positive rate, F1-score, and recall, which have demonstrated potential for implementation on operational network infrastructure [48,49]. Spatial features are extracted through the application of a convolutional neural network, followed by the incorporation of average pooling and max pooling to extract further features [50]. The determination of tuning parameters for matching networks necessitates the consideration of both the real and imaginary components of the antenna impedance, a process that entails the utilization of costly measurement apparatus [51]. Traditional network threat intelligence data is used to train machine learning algorithms to find likely attack targets and potentially dangerous linkages. A massive dataset from nine honeypot servers contained 451 k login attempts from 178 different countries, with over 70 k source IP addresses and 40 k source port addresses logged [52].
This article discusses the prominent methodologies employed in malware prediction, which encompass a diverse range of machine learning techniques. Machine learning (ML) methodologies are very suitable for the development of intrusion detection systems (IDS) because of their ability to quickly adapt to novel scenarios, their exceptional prediction capabilities, and the minimal occurrence of false positive results. RNN-LLSTM has demonstrated its efficacy in various domains, including speech recognition and time-series forecasting. Upon assessing our suggested model against five distinct selective classifiers, it was determined that the RNN-LLSTM approach attained a remarkable accuracy rate of 99.5%, accompanied by just a 0.72% occurrence of false positives. By employing this approach, one can enhance the level of detection sensitivity while simultaneously mitigating the occurrence of false positives.
In subsequent research, the enhancement of the model’s performance could be pursued through the investigation of more advanced iterations of recurrent neural networks (RNNs) that surpass the capabilities of long-short-term memory (LSTM) networks. The integration of multi-modal input sources into the model has the potential to boost its capability for detecting intricate infiltration scenarios. It is imperative to evaluate the model’s ability to generalize across various network setups, sectors, and applications. In summary, the model provides a robust framework for improving network security. By exploring the mentioned fields of future research, scholars and professionals have the potential to enhance the efficacy, flexibility, comprehensibility, and scalability of the model, thereby making significant contributions to the development of more efficient and dependable intrusion detection systems.
Acknowledgement: The authors are thankful to all the editors and reviewers for their valuable work during the review process.
Funding Statement: This work was supported partially by the MSIT (Ministry of Science and ICT), Korea, under the ITRC (Information Technology Research Center) Support Program (IITP-2024-2018-0-01431) supervised by the IITP (Institute for Information & Communications Technology Planning & Evaluation).
Author Contributions: The authors confirm contribution to the paper as follows: Balasubramanian Prabhu Kavin: Methodology, Investigation, Software, Writing, Funding. Senthil Prabakaran: Investigation, Writing-Original Draft, Writing-Review and Editing. Navaneetha Krishnan Muthunambu, Kavitha Chinnadurai, Kishore Senthil Siruvangur and Jehad Ali: Resources, Validation, Writing-Review and Editing. All authors reviewed the results and approved the final version of the manuscript.
Availability of Data and Materials: Available upon request.
Conflicts of Interest: The authors declare that they have no conflicts of interest to report regarding the present study.
References
1. J. P. Anderson, “Computer security threat monitoring and surveillance,” Technical Report, J. P. Anderson Company, Fort Washington, USA, 1980. [Google Scholar]
2. W. Lee, S. J. Stolfo, P. K. Chan, E. Eskin, W. Fan et al., “Real time data mining-based intrusion detection,” in Proc. of DARPA Information Survivability Conf. and Exposition II. DISCEX’01, Anaheim, CA, USA, pp. 89–100, 2001. [Google Scholar]
3. V. Jyothsna, R. Prasad and K. M. Prasad, “A review of anomaly based intrusion detection systems,” International Journal of Computer Applications, vol. 28, no. 7, pp. 26–35, 2011. [Google Scholar]
4. G. Ciaburro and B. Venkateswaran, Neural networks with R: Smart models using CNN, RNN, deep learning, and artificial intelligence principles, 1st ed., vol. 1. Birmingham, UK: Packt Publishing Ltd., pp. 67–264, 2017. [Google Scholar]
5. J. Kiefer and J. Wolfowitz, “Stochastic estimation of the maximum of a regression function,” The Annals of Mathematical Statistics, vol. 23, no. 3, pp. 462–466, 1952. [Google Scholar]
6. L. Bottou, F. E. Curtis and J. Nocedal, “Optimization methods for large-scale machine learning,” SIAM Review, vol. 60, no. 2, pp. 223–311, 2018. [Google Scholar]
7. M. Roopak, G. Yun Tian and J. Chambers, “Deep learning models for cyber security in IoT net-works,” in Proc. of IEEE 9th Annual Computing and Communication Workshop and Conf., Las Vegas, NV, USA, pp. 452–457, 2019. [Google Scholar]
8. S. Yeom and K. Kim, “Detail analysis on machine learning based malicious network traffic classification,” in Proc. of the Int. Conf. on Smart Media & Applications, Jeju, Korea, pp. 49–53, 2019. [Google Scholar]
9. J. Kim, Y. Shin and E. Choi, “An intrusion detection model based on a convolutional neural network,” Journal of Multimedia Information System, vol. 6, no. 4, pp. 165–172, 2019. [Google Scholar]
10. A. A. Salih, S. Y. Ameen, S. R. M. Zeebaree and M. A. M. Sadeeq, “Deep learning approaches for intrusion detection,” Asian Journal of Research in Computer Science, vol. 9, no. 4, pp. 50–64, 2021. [Google Scholar]
11. Y. Gu, K. Li, Z. Guo and Y. Wang, “Semi-supervised K-means DDoS detection method using hybrid feature selection algorithm,” IEEE Access, vol. 7, no. 17, pp. 64351–64365, 2019. [Google Scholar]
12. O. Faker and E. Dogdu, “Intrusion detection using big data and deep learning techniques,” in Proc. of the ACM Southeast Conf., Kennesaw, Georgia, USA, pp. 86–93, 2019. [Google Scholar]
13. J. Hühn and E. Hüllermeier, “FURIA: An algorithm for unordered fuzzy rule induction,” Data Mining and Knowledge Discovery, vol. 19, no. 3, pp. 293–319, 2009. [Google Scholar]
14. K. Atefi, H. Hashim and M. Kassim, “Anomaly analysis for the classification purpose of intrusion detection system with K-nearest neighbors and deep neural network,” in Proc. of IEEE 7th Conf. on Systems, Process and Control, Malaca, Malaysia, pp. 269–274, 2019. [Google Scholar]
15. A. Ahmim, L. Maglaras, M. A. Ferrag, M. Derdour and H. Janicke, “A novel hierarchical intrusion detection system based on decision tree and rules-based models,” in Proc. of IEEE 15th Int. Conf. on Distributed Computing in Sensor Systems, Santorini Island, Greece, pp. 228–233, 2019. [Google Scholar]
16. N. B. Anuar, M. Othman, N. A. Zakaria and N. Z. A. Hamid, “LSTM-based deep learning approach for botnet detection,” International Journal of Advances in Soft Computing and its Applications, vol. 8, no. 3, pp. 31–52, 2016. [Google Scholar]
17. A. Gandomi, H. Javaheri and R. Parvizi, “A comprehensive review on the application of recurrent neural networks in intrusion detection systems,” Journal of Network and Computer Applications (JNCA), vol. 83, pp. 98–122, 2017. [Google Scholar]
18. P. C. Sunagar and A. Kanavalli, “Intrusion detection system using deep learning,” in Deep Learning Applications for Cyber-Physical Systems, 1st ed., vol. 1, Hershey, Pennsylvania, USA: IGI Global, pp. 160–181, 2022. [Google Scholar]
19. A. Meliboev, J. Alikhanov and W. Kim, “Performance evaluation of deep learning based network intrusion detection system across multiple balanced and imbalanced datasets,” Electronics, vol. 11, no. 4, pp. 515, 2022. [Google Scholar]
20. B. M. Rahal, A. Santos and M. Nogueira, “A distributed architecture for DDoS prediction and bot detection,” IEEE Access, vol. 8, no. 1, pp. 159756–159772, 2020. [Google Scholar]
21. I. Sharafaldin, A. H. Lashkari and A. A. Ghorbani, “Toward generating a new intrusion detection dataset and intrusion traffic characterization,” in Proc. of the 4th Int. Conf. on Information Systems Security and Privacy, Funchak, Madeira, Portugal, pp. 108–116, 2018. [Google Scholar]
22. R. Panigrahi and S. Borah, “A detailed analysis of CICIDS2017 dataset for designing intrusion detection systems,” International Journal of Engineering & Technology, vol. 7, no. 24, pp. 479–482, 2018. [Google Scholar]
23. A. Paszke, S. Gross, S. Chintala, G. Chanan, E. Yang et al., “Automatic differentiation in pytorch,” in Proc. of 31st Conf. on Neural Information Processing Systems, Long Beach, CA, USA, pp. 1–4, 2017. [Google Scholar]
24. R. Vinayakumar, K. P. Soman and P. Poornachandran, “Applying convolutional neural network for network intrusion detection,” in Proc. of Int. Conf. on Advances in Computing, Communications and Informatics, Manipal, India, pp. 1222–1228, 2017. [Google Scholar]
25. M. D. Gregorio and M. Giordano, “An experimental evaluation of weightless neural networks for multi-class classification,” Applied Soft Computing, vol. 72, no. 1, pp. 338–354, 2018. [Google Scholar]
26. M. N. Adnan and M. Z. Islam, “Forest PA: Constructing a decision forest by penalizing attributes used in previous trees,” Expert Systems with Applications, vol. 89, no. 1, pp. 389–403, 2017. [Google Scholar]
27. C. C. Chang and C. J. Lin, “LIBSVM: A library for support vector machines,” ACM Transactions on Intelligent Systems and Technology, vol. 2, no. 3, pp. 1–27, 2011. [Google Scholar]
28. X. Zhang, J. Chen, Y. Zhou, L. Han and J. Lin, “A multiple-layer representation learning model for network-based attack detection,” IEEE Access, vol. 7, no. 1, pp. 91992– 92008, 2019. [Google Scholar]
29. F. E. Laghrissi, S. Douzi, K. Douzi and B. Hssina, “Intrusion detection systems using long short-term memory (LSTM),” Journal of Big Data, vol. 8, no. 65, pp. 1–16, 2021. [Google Scholar]
30. S. Selvin, R. Vinayakumar, E. A. Gopalakrishnan, V. K. Menon and K. P. Soman, “Stock price prediction using LSTM, RNN and CNN-sliding window model,” in Proc. of the 2017 Int. Conf. on Advances in Computing, Communications and Informatics (ICACCI), Udupi, India, pp. 1643–1647, 2017. [Google Scholar]
31. A. Shewalkar, D. Nyavanandi and S. A. Ludwig, “Performance evaluation of deep neural networks applied to speech recognition: RNN, LSTM and GRU,” Journal of Artificial Intelligence and Soft Computing Research, vol. 9, no. 4, pp. 235–245, 2019. [Google Scholar]
32. N. Gao, L. Gao, Q. Gao and H. Wang, “An intrusion detection model based on deep belief networks,” in Proc. of the Second Int. Conf. on Advanced Cloud and Big Data, Huangshan, China, pp. 247–252, 2014. [Google Scholar]
33. Y. Xiao, C. Xing, T. Zhang and Z. Zhao, “An intrusion detection model based on feature reduction and convolutional neural networks,” IEEE Access, vol. 7, no. 1, pp. 42210–42219, 2019. [Google Scholar]
34. M. Al-shalabi, B. Pradhan, L. Billa, S. Mansor and O. F. Althuwaynee, “Manifestation of remote sensing data in modeling urban sprawl using the SLEUTH model and brute force calibration: A case study of Sana’a City, Yemen,” Journal of Indian Society of Remote Sensing, vol. 41, no. 2, pp. 405–416, 2013. [Google Scholar]
35. V. Sze, Y. H. Chen, T. J. Yang and J. S. Emer, “Efficient processing of deep neural networks: A tutorial and survey,” Proceedings of the IEEE, vol. 105, no. 12, pp. 2295–2329, 2017. [Google Scholar]
36. Y. Chen, X. Ma and X. Wu, “DDoS detection algorithm based on preprocessing network traffic predicted method and chaos theory,” IEEE Communications Letters, vol. 17, no. 5, pp. 1052–1054, 2013. [Google Scholar]
37. E. A. Asonye, I. Anwuna and S. M. Musa, “Securing ZigBee IoT network against HULK distributed denial of service attack,” in Proc. of the IEEE 17th Int. Conf. on Smart Communities: Improving Quality of Life Using ICT, IoT and AI (HONET), Charlotte, NC, USA, pp. 156–162, 2020. [Google Scholar]
38. A. Ghorbani, R. Cooper, R. Lu, S. Ray, K. Mandal et al., “IDS 2017 research and datasets, UNB, Fredericton, Canada: Canadian institute for cybersecurity,” 2017. [Online]. Available: https://www.unb.ca/cic/datasets/ids-2017.html (accessed on 01/12/2023). [Google Scholar]
39. N. Moustafa and J. Slay, “The evaluation of network anomaly detection systems: Statistical analysis of the UNSW-NB15 data set and the comparison with the KDD99 data set,” Information Security Journal: Global Perspective, vol. 25, no. 1–3, pp. 18–31, 2016. [Google Scholar]
40. L. Ashiku and C. Dagli, “Network intrusion detection system using deep learning,” Procedia Computer Science, vol. 185, no. 1, pp. 239–247, 2021. [Google Scholar]
41. S. T. Ikram, A. K. Cherukuri, B. Poorva, P. S. Ushashree, C. Zhang et al., “Anomaly detection using XGBoost ensemble of deep neural networks models,” Cybernetics and Information Technologies, vol. 21, no. 3, pp. 175–188, 2021. [Google Scholar]
42. A. Yulianto, P. Sukarno and N. A. Suwastika, “Improving AdaBoost-based intrusion detection system (IDS) performance on CIC IDS, 2017 dataset,” in Proc. of the 2nd Int. Conf. on Data and Information Science, Bandung, Indonesia, 2018. [Google Scholar]
43. Swati, S. Roy, J. Singh and J. Mathew, “Design and analysis of DDoS mitigating network architecture,” International Journal of Information Security, vol. 22, no. 1, pp. 333–345, 2023. [Google Scholar] [PubMed]
44. P. Vanin, T. Newe, L. L. Dhirani, E. O’Connell, D. O’Shea et al., “A study of network intrusion detection systems using artificial intelligence/machine learning,” Applied Sciences, vol. 12, no. 22, pp. 1–27, 2022. [Google Scholar]
45. D. M. Brandão Lent, M. P. Novaes, L. F. Carvalho, J. Lloret, J. J. P. C. Rodrigues et al., “A gated recurrent unit deep learning model to detect and mitigate distributed denial of service and Portscan attacks,” IEEE Access, vol. 10, no. 1, pp. 73229–73242, 2022. [Google Scholar]
46. M. I. M. Ismail, H. Hussain, A. A. Khan and U. Ullah, “A machine learning-based classification and prediction technique for DDoS attacks,” IEEE Access, vol. 10, no. 1, pp. 21443–21454, 2022. [Google Scholar]
47. A. Aldallal, “Toward efficient intrusion detection system using hybrid deep learning approach,” Deep Learning and Symmetry, vol. 14, no. 9, pp. 1–22, 2022. [Google Scholar]
48. M. Ahsan and K. E. Nygard, “Convolutional neural networks with LSTM for intrusion detection,” in Proc. of 35th Int. Conf. on Computers and their Applications, San Francisco, California, USA, pp. 69–79, 2020. [Google Scholar]
49. B. Cao, C. Li, Y. Song and X. Fan, “Network intrusion detection technology based on convolutional neural network and BigRu,” Computational Intelligence and Neuroscience, vol. 2022, no. 1, pp. 1–20, 2022. [Google Scholar]
50. M. M. Hasan and M. Cheffena, “Adaptive antenna impedance matching using low-complexity shallow learning model,” “IEEE Access, vol. 11, no. 1, pp. 74101–74111, 2023. [Google Scholar]
51. H. Attou, A. Guezzaz, S. Benkirane, M. Azrour and Y. Farhaoui, “Cloud-based intrusion detection approach using machine learning techniques,” Big Data Mining and Analytics, vol. 6, no. 3, pp. 311–320, 2023. [Google Scholar]
52. P. Senthil, R. Ramalakshmi, I. Hussain, B. P. Kavin, S. Alshamrani et al., “Predicting attack pattern via machine learning by exploiting stateful firewall as virtual network function in an SDN network,” Sensors, vol. 22, no. 3, pp. 1–24, 2022. [Google Scholar]
Cite This Article
 Copyright © 2024 The Author(s). Published by Tech Science Press.
This work is licensed under a Creative Commons Attribution 4.0 International License , which permits unrestricted use, distribution, and reproduction in any medium, provided the original work is properly cited.
 Downloads
 Citation Tools