
 Submit a Paper
 Propose a Special lssue
 Open Access
ARTICLE
Machine-Learning Based Packet Switching Method for Providing Stable High-Quality Video Streaming in Multi-Stream Transmission
1 Major in Software Fusion, Department of Computer, Seoul Women’s University, Seoul, 01797, South Korea
2 Department of Software Convergence, Seoul Women’s University, Seoul, 01797, South Korea
* Corresponding Author: Jongho Paik. Email:
(This article belongs to the Special Issue: Intelligent Computing Techniques and Their Real Life Applications)
Computers, Materials & Continua 2024, 78(3), 4153-4176. https://doi.org/10.32604/cmc.2024.047046
Received 23 October 2023; Accepted 06 February 2024; Issue published 26 March 2024
 View Full Text
 Download PDF
Abstract
Broadcasting gateway equipment generally uses a method of simply switching to a spare input stream when a failure occurs in a main input stream. However, when the transmission environment is unstable, problems such as reduction in the lifespan of equipment due to frequent switching and interruption, delay, and stoppage of services may occur. Therefore, applying a machine learning (ML) method, which is possible to automatically judge and classify network-related service anomaly, and switch multi-input signals without dropping or changing signals by predicting or quickly determining the time of error occurrence for smooth stream switching when there are problems such as transmission errors, is required. In this paper, we propose an intelligent packet switching method based on the ML method of classification, which is one of the supervised learning methods, that presents the risk level of abnormal multi-stream occurring in broadcasting gateway equipment based on data. Furthermore, we subdivide the risk levels obtained from classification techniques into probabilities and then derive vectorized representative values for each attribute value of the collected input data and continuously update them. The obtained reference vector value is used for switching judgment through the cosine similarity value between input data obtained when a dangerous situation occurs. In the broadcasting gateway equipment to which the proposed method is applied, it is possible to perform more stable and smarter switching than before by solving problems of reliability and broadcasting accidents of the equipment and can maintain stable video streaming as well.Keywords
Broadcasting and communication technologies have developed rapidly and as a result, large-capacity and high-quality videos are provided to users in various forms. With the advancement of network processes, data in switched systems is transmitted over the network frequently. While bringing convenience, it should have a significant impact on the system performance, especially for not timely and imprecise data transmission [1]. Therefore, in particular, the demand for seamless and stable services for immersive media content such as 4K/8K ultra-high definition (UHD) content is increasing. To satisfy these users’ requirements, various technologies such as streaming video with high-quality and large-capacity and high-quality content such as 8K-UHD have already been applied or optimized to provide various services [2]. However, when providing content with large capacity and high quality only through a terrestrial broadcasting network, there is a certain level of limitation in satisfying users’ requirements due to insufficient transmission bandwidth and number of channels. To overcome these limitations, it is essential to research transmission technology that combines wired/wireless communication networks with high-speed and terrestrial broadcasting networks [3,4]. In particular, to provide broadcasting and communication convergence services, large-capacity and high-quality content needs to be transmitted based on internet protocol (IP) [5]. It is based on moving picture experts group (MPEG) media transport (MMT) or real-time object delivery over unidirectional transport (ROUTE) format to provide converged broadcasting services using the HTTP/TCP/IP protocol when transmitting the data through the network [6–10]. As mentioned above, the broadcasting gateway equipment is used to provide high-quality and large-capacity contents of 4K-UHD level or higher stably and seamlessly. However, problems such as transmission failure may occur during this process and as IP-based data transmission technology is used, it may inevitably cause a packet loss during transmission depending on the network environment [11]. When this occurs in the main input stream, the method used currently is simply to switch it to the preliminary input stream. In other words, the broadcasting gateway equipment only measures packet loss of the input stream and compares it to its threshold set by a service provider. If it reaches its threshold, that input stream immediately is switched to other input streams. When the transmission environment is unstable and the packet loss threshold is frequently reached, not only the lifespan of the equipment is reduced due to frequent switching, but also problems such as interruption, delay, and suspension of large-capacity and high-quality services inevitably occur. Therefore, as one of the methods for solving these problems, providing ultra-low latency response using 5G networks as well as the technology of multi-stream changer, linked with mobile edge computing (MEC), which can reduce the traffic of backbone network, has emerged. In addition, when transmission errors occur in the system device while providing streaming services of 4K-UHD level or higher, to ensure switching stream smoothly, a multi-stream changer platform based on AI that can predict or quickly determine the time of error occurrence and then automatically judge to switch multi-input signals without signal dropping or changing is required.
Thus, in this paper, we propose an intelligent packet switching method based on the classification of the ML method using data in various problem situations in broadcasting gateway equipment used simultaneously in terrestrial broadcasting networks and high-speed wired/wireless networks and a platform that can verify this. The intelligent packet switching method proposed in this paper applies a machine learning method to automatically detect abnormal conditions and classify network-related service anomalies. It uses various log data that continuously output from broadcasting gateway equipment to recognize abnormal problems and detect these based on various data. In addition, the proposed method is verified through an independently distributed platform rather than the existing broadcasting gateway system to prevent server and system loading. In broadcasting gateway equipment to which the proposed abnormal multi-stream detection technique is applied, problems such as reliability and broadcasting accidents of the equipment are resolved through analysis of input data from equipment, enabling more stable and smarter switching than before.
2.1 Multi-Stream Technology Based on Broadcast Communication
As the transmission and reception of broadcasting signals based on analog ends, various technologies for transmitting and receiving broadcasting signals based on digital are being developed. Compared to existing analog broadcasting signals, digital broadcasting signals can include high-quality video/audio data and additional data [12]. Therefore, the broadcasting system transmits higher-capacity and higher-quality content than before, builds redundancy to prevent broadcasting accidents, and uses a switch to transfer broadcasting signals when an error occurs. Switches in existing broadcasting systems were configured based on MPEG-2 Transport System, but since the advent of advanced television systems committee standard 3.0 (ATSC 3.0), which is a digital broadcasting method, it is essential to develop and build an IP-based switch to which ATSC 3.0 broadcasting technology is applied. ATSC 3.0 is a suite of voluntary technical Standards and Recommended Practices that is fundamentally different from predecessor ATSC systems. With higher capacity to deliver UHD services, robust reception on a wide range of devices, improved efficiency, IP transport, advanced emergency alerting, personalization features and interactive capability, the ATSC 3.0 Standard provides much more capability than previous generations of terrestrial broadcasting. The ATSC 3.0 System is designed with a layered architecture due to the many advantages of such a system, particularly pertaining to upgradability and extensibility [13]. The overall structure diagram of the ATSC 3.0 switch is shown in Fig. 1 and the structure diagram of the transmission system with the ATSC 3.0 switch is shown in Fig. 2.
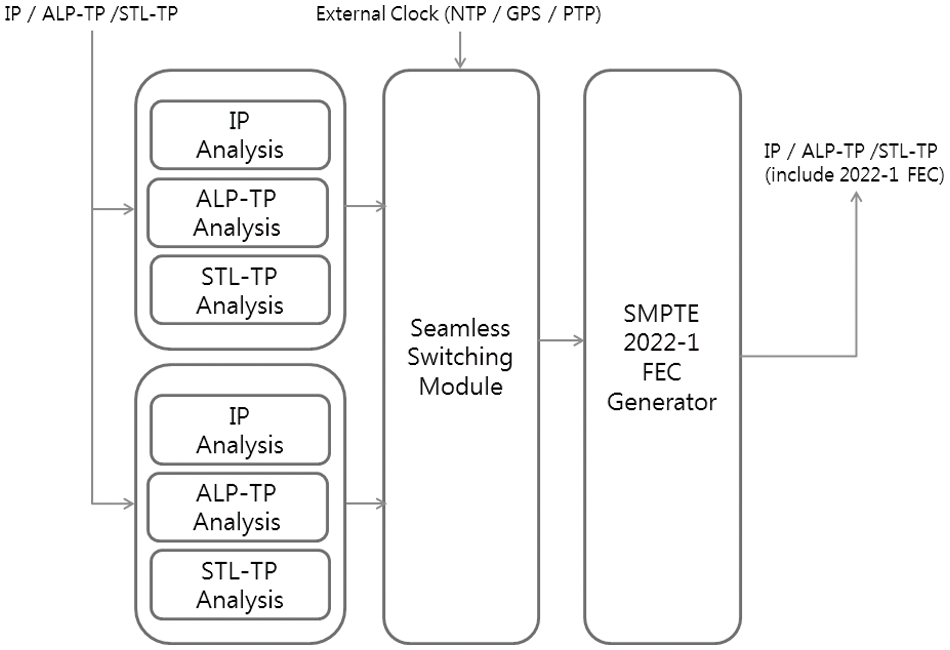
Figure 1: Overall structure diagram of ATSC 3.0 switch
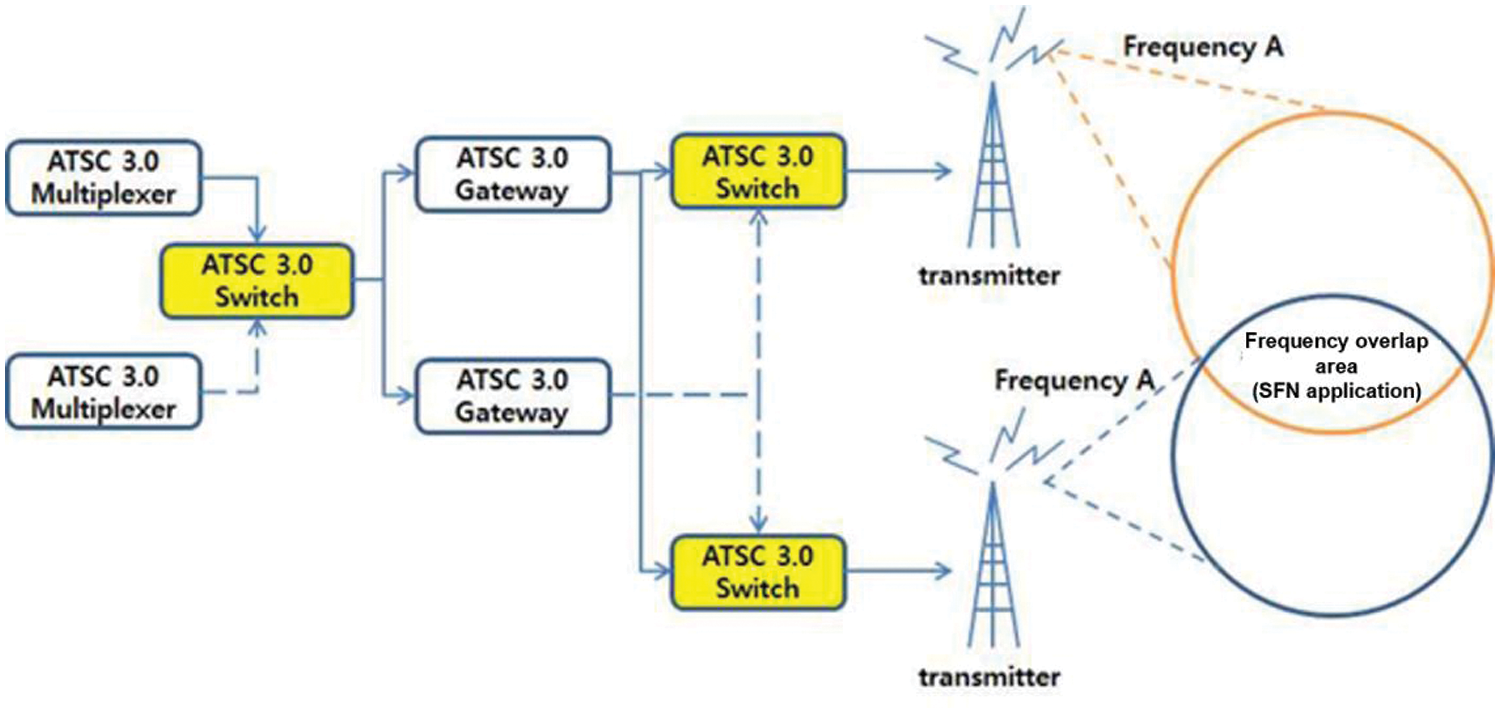
Figure 2: Structure diagram of transmission system with ATSC 3.0 switch
Compared to digital video broadcasting—second generation terrestrial (DVB-T2), ATSC 3.0 includes the layered division multiplexing (LDM), which is the latest multiplexing technology, to transmit mobile HD broadcasting and fixed UHD broadcasting simultaneously without any problems. In addition, as it is a system designed based on IP, it is possible to interwork with a communication network and has the characteristic of providing more enhanced quality of media to various devices.
A 4K-UHD video is transmitted by 3840 × 2160 resolution video with high-quality audio data through terrestrial broadcasting networks. According to the domestic UHD TV standard, high-efficiency video coding (HEVC) is adopted as a compression technology for video data and MPEG-H is adopted as a compression technology for audio data. While the digital television (DTV) method provides a bandwidth of 19.4 Mbps at 6 MHz, UHD broadcasting based on ATSC 3.0 can provide 25 Mbps, which is more than 30% higher than that of DTV. Before UHD broadcasting was provided, fixed FHD video service was provided through DTV. UHD broadcasting can simultaneously transmit not only 4K-UHD video but also one or more HD videos in the same 6 MHz band [14].
4K-UHD transmits 3840 × 2160 resolution video and high-quality audio data through terrestrial broadcasting networks. According to the domestic UHD TV standard, high-efficiency video coding (HEVC) is adopted as a compression technology for video data and MPEG-H is adopted as a compression technology for audio data. While the DTV method provides a transmission capacity of 19.4 Mbps bandwidth at 6 MHz, ATSC 3.0-based UHD broadcasting can provide a transmission capacity of 25 Mbps, which is more than 30% higher than that of DTV. Before UHD broadcasting was provided, fixed FHD video service was provided through DTV. UHD broadcasting can simultaneously transmit not only 4K-UHD video but also one or more HD videos in the same 6 MHz band.
Transmission technology based on ATSC 3.0 is used based on broadcasting gateway equipment and transmitters. It is built in the form of a single frequency network (SFN) in which several transmitters are connected to the broadcasting gateway equipment. The broadcasting gateway equipment receives ATSC 3.0 link-layer protocol (ALP) packets through the Studio Interface and outputs baseband packet (BBP) through studio to-transmitter link (STL) interface [15]. This process is shown in Fig. 3. Also, it uses a delivery format, which is a standard internet protocol, in the form of RTP/UDP/IP to enable input and output through an Ethernet cable. The ALP stream analysis module and the STL stream analysis module are required to detect an error of a packet stream incoming through the network. The IP stream analysis module can analyze and verify the service list table (SLT) data and the system time data, which are bootstrap information for describing information on the signaling transmission protocol. The ALP stream analysis module can analyze the ALP-TP, ALP packet, and IP packet. The STL stream analysis module can analyze the preamble data, time management data, and BBP data. It is confirmed through the respective analysis modules that the stream input is normally performed.
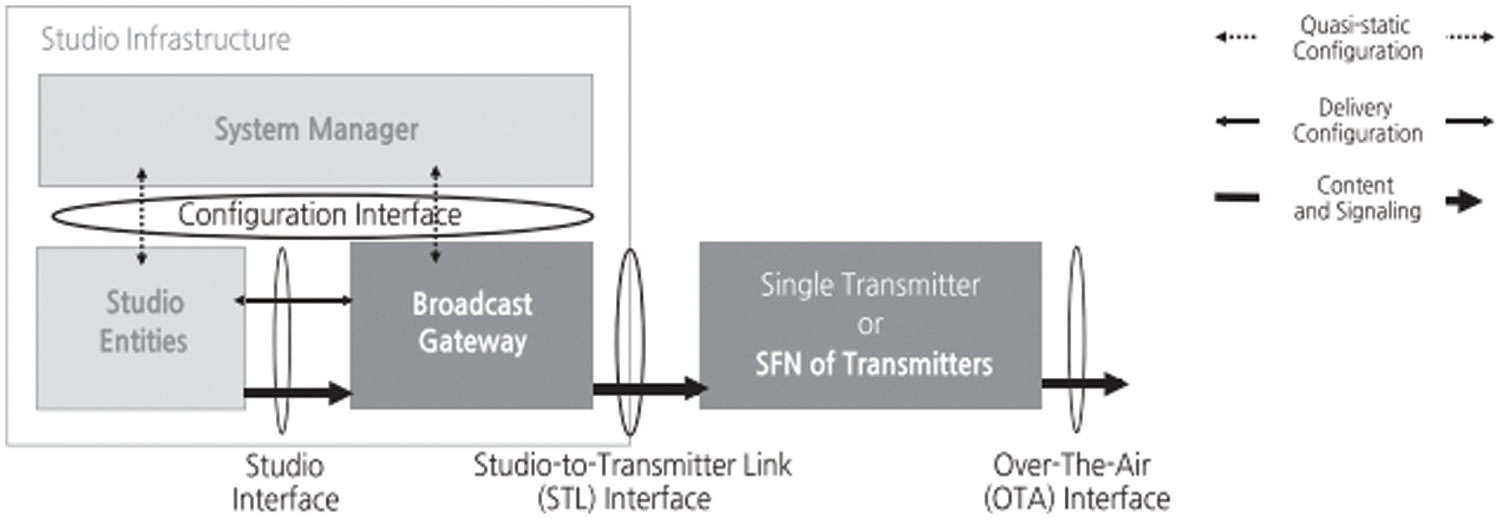
Figure 3: Configuration diagram of ATSC 3.0-based system
If the input stream is corrupted, the seamless switching module can perform a switchover to the multiplexer that outputs the stable stream. After performing the switchover, it adds the forward error correction (FEC) packet through the FEC encoding generator so that recovery is possible in case of possible damage of the data transmitted through the gateway. In addition, through the FEC decoder, a decoding algorithm can be applied to anerroneous input stream to output a normally reconstructed stream. At this time, the FEC encoding and decoding algorithm conforms to the society of motion picture and television engineers (SMPTE) 2022-1 standard [16].
After that, the broadcasting gateway equipment delivers the stream to the transmitter. The broadcasting gateway device transmits a timing data packet based on port number 30065 to the transmitter to control the emission time of the physical layer frame. Each transmitter compares the input time information with its time standard to determine when to transmit a signal. In addition, the broadcasting gateway equipment transmits physical layer parameters to the transmitter through a preamble data packet composed of L1-Basic Signaling and L1-Detail Signaling. The transmitter receives the input stream based on the value set through the preamble parser and configures each part of the transmitter. In addition, the ALP stream for each physical layer pipe (PLP) received from the broadcasting gateway equipment is processed into a BBP form and transmitted to the transmitter. In this process, only one multicast IP address is used, but different PLPs are assigned by port number, up to a maximum of four per service, up to a total of sixty-four [17–21].
2.2 Machine Learning Technology Based on Data Learning
Machine learning refers to the process of improving performance for a specific goal based on experience learned from data. Machine learning uses large amounts of data to make inductive reasoning and derives new knowledge as a result on its own. Among machine learning methodologies, supervised learning refers to a method of inferring a function by learning data including an input vector and a target value for each object attribute, and then inferring a target value for a new input vector. It is divided into classification and regression according to the shape of the target value [22].
One of the representative classification methods is logistic regression. Logistic regression is a regression method derived from linear regression. Linear regression is a model that trains a regression line, which is a straight line that can represent data, by training a given dependent variable (Y) and independent variable (X). A regression line means a straight line in which the sum of errors, which is the distance between each point and the straight line, and it is minimized by representing data as X coordinates and Y coordinates.
Among logistic regression, it classifies data into one of two categories. Assuming that the Y value to be predicted during model training is a probability of A, if the value of Y is greater than 0.5, it is classified as A, and if it is less than 0.5, it is classified as B. Therefore, the independent variable has an infinite value, and the dependent variable has a probability value between the numbers 0 and 1. To compress the dependent variable into a probability value between 0 and 1, the expression
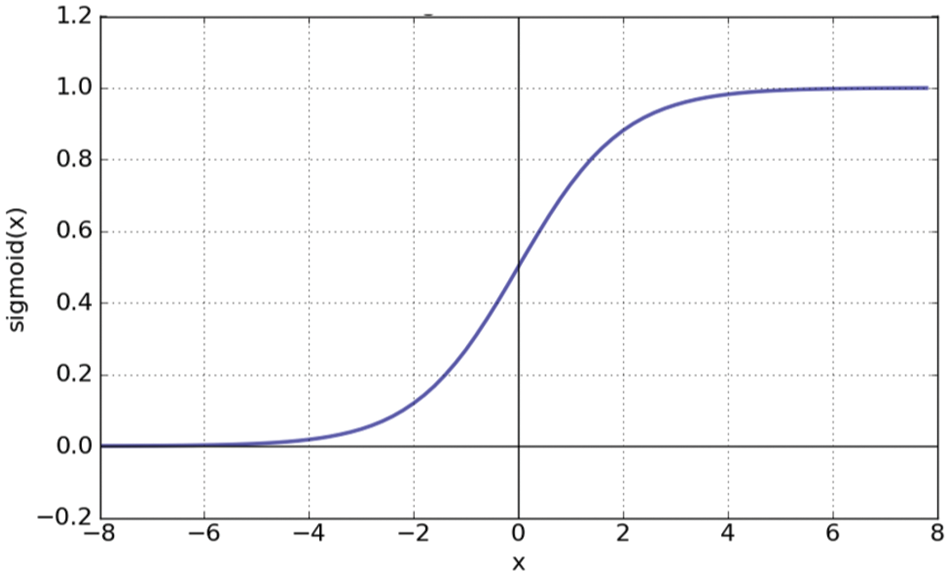
Figure 4: Graph of sigmoid function
The logistic regression model is simple and easy to implement and does not require a lot of computation. In addition, since it learns simple linear data, it has good performance and outputs high prediction probability even without preprocessing or adjusting input features.
Another representative classification technique is the decision tree. The decision tree algorithm branches by checking one condition at each branch point of the tree. The leaf node at which all branches end contains the result value. The decision tree algorithm provides the basis for classification or prediction, and the generated patterns are easy to understand. Additionally, among numerous attributes, attributes that do not affect classification are automatically excluded when forming a model. This has the advantage of being able to easily identify attributes that have a decisive influence. Also, the time required to form a model is short by processing continuous or discontinuous data values without data preprocessing.
Random forest is also a representative classification technique. Random Forest refers to a bagging technique that uses a decision tree as a classifier. Bagging is a method of creating multiple learning data sets using bootstrapping, creating a classifier for each learning data set, and then determining the weights and making a final decision. The random forest algorithm creates a decision tree using multiple training data sets through bootstrapping. When determining splitting properties during the process of creating a decision tree, splitting attribute candidates are randomly selected from all splitting attributes, and information gain is calculated to determine splitting attributes and criteria. In other words, the random forest algorithm is a subspace method that uses bootstrapping [23].
3 Intelligent Packet Switching Method Using Machine Learning and Cosine Similarity
In this chapter, we present a method for detecting abnormal multi-stream based on data learning generated by the multi-stream changer. This method is implemented based on data science methodology through the process of setting the goal of research, collecting the data, preparing the data, exploring the data, modeling, and presenting the result of research [24]. In this paper, we propose a decision criterion for switching that can determine various cases of abnormal multi-streams according to the network environment generated in multi-stream changes, thereby preventing frequent switching and maintaining the normal operation of multi-stream changers.
3.1 Collecting the Broadcast Communication Multi-Stream Data
When multi-stream is transmitted from the broadcasting gateway equipment, various abnormal situations occur depending on the network environment and its surrounding environment. As mentioned before, in this paper, we define the assumed conditions for abnormal situations as shown in Table 1, to solve problems that may occur due to frequent switching.
ATBiS ATSC 3.0 Smart Changer is used as a broadcasting gateway device that collects multi-stream log data in abnormal situations defined in Table 1. ATSC 3.0 Smart Changer is a device that monitors and displays the status of various broadcasting input signals between the ATSC 3.0 transmitting station and transmitter and switches to backup signals by automatically or manually detecting abnormal conditions according to a set priority. It provides four IP packet signals as input and two IP packet signals as output. In addition, it supports SMPTE 2022-1 FEC, SFN seamless switching, and source routing transparent (SRT) receiver.
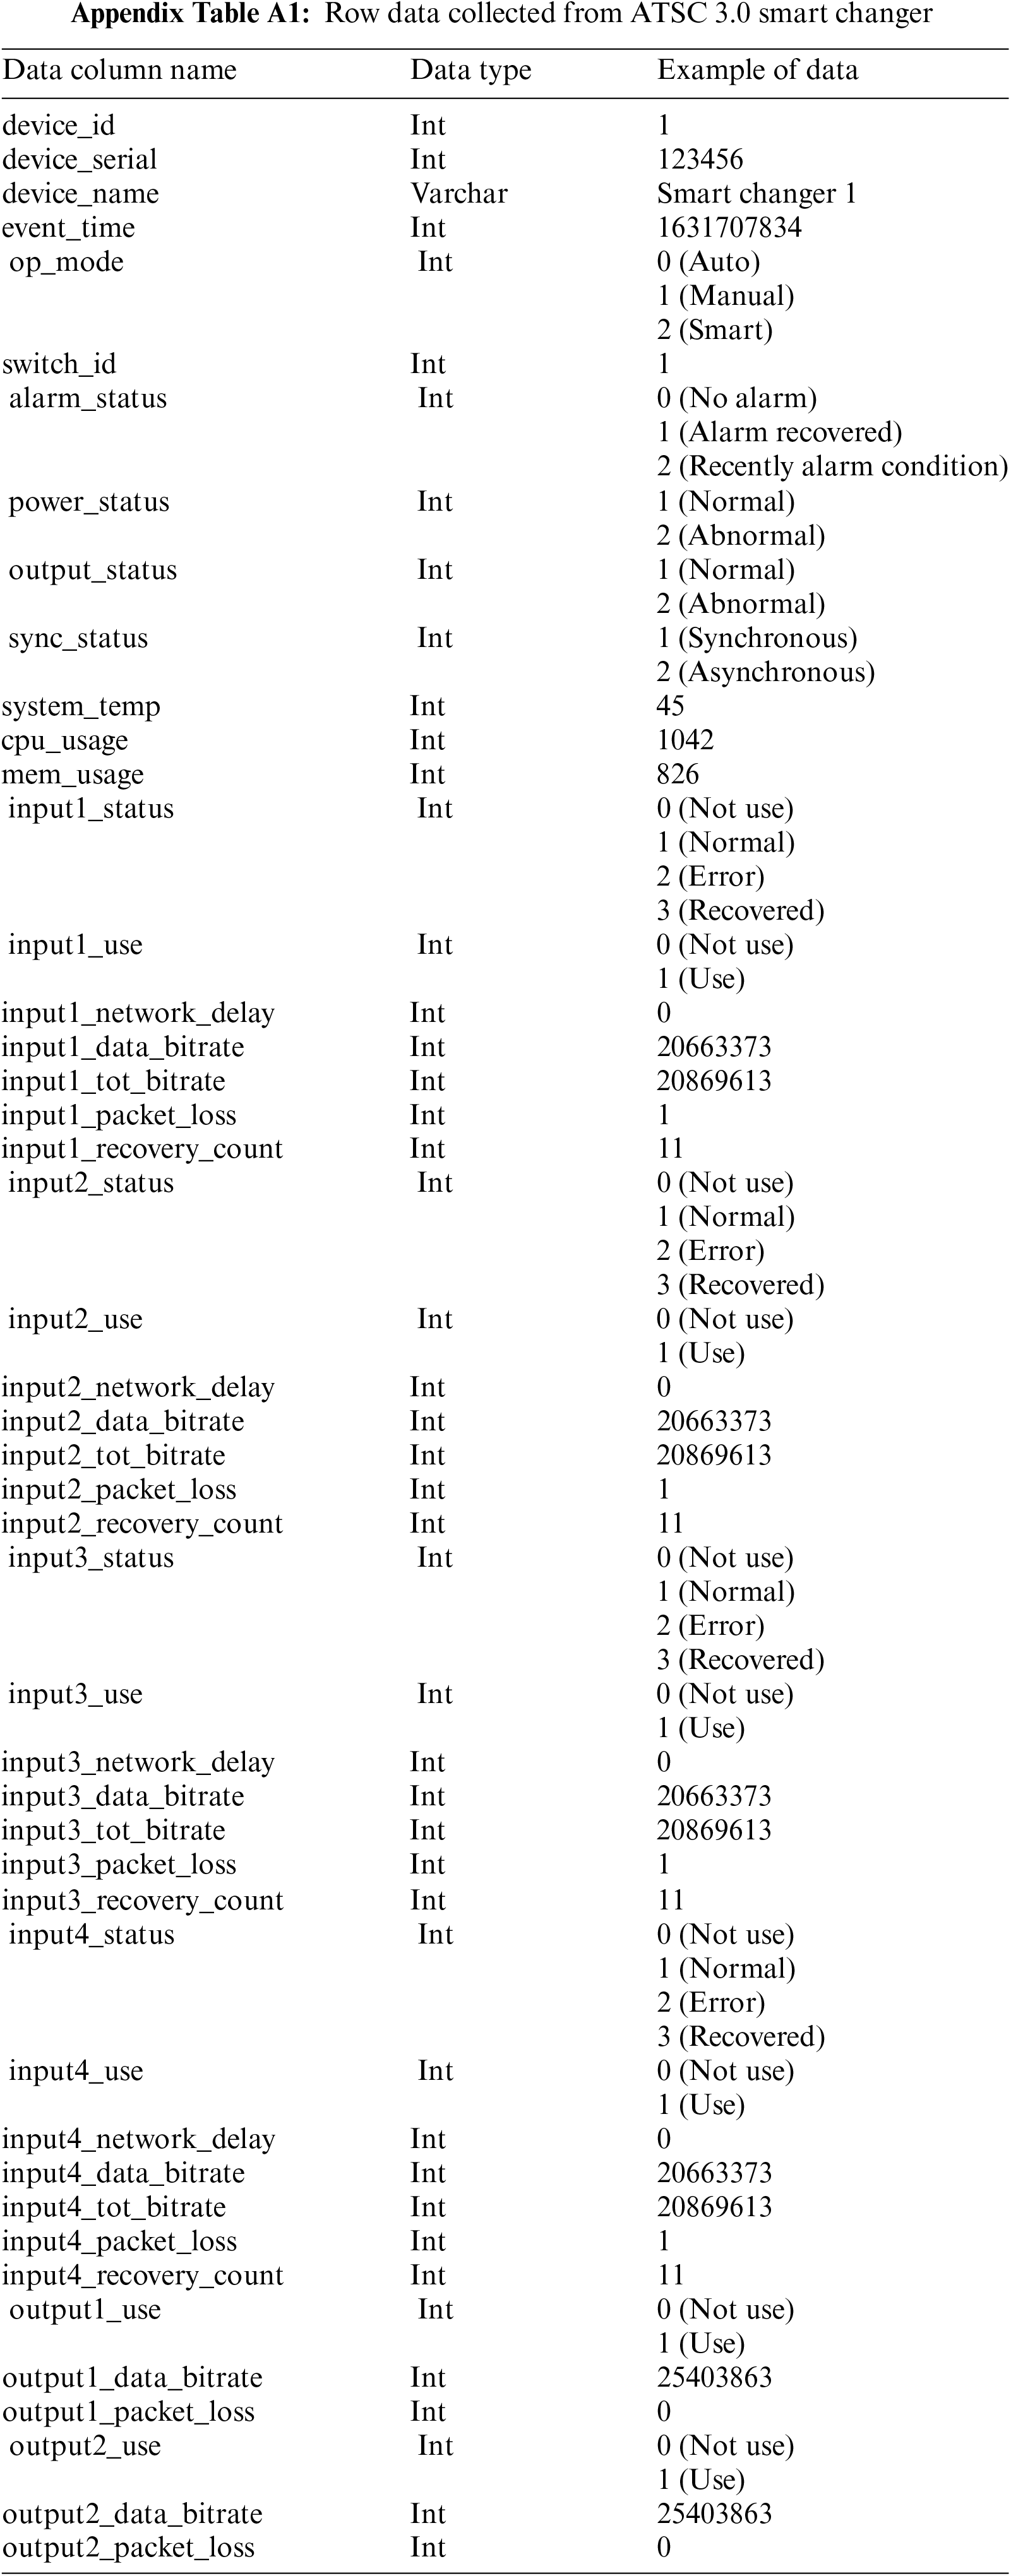
Data generated from the ATSC 3.0 Smart Changer equipment is periodically accumulated and stored in its database, and even if it is not the period and an abnormal event occurs, it is also immediately updated in the database. Through the logging process, all raw data stored in the database are converted into csv files and we can get this file. The abnormal multi-stream detection method proposed in this paper is implemented based on Python which is easy to use csv files. The main attributes of raw data collected from Smart Changer are shown in Appendix A.
As shown in Appendix A, the main attributes of raw data collected from ATSC 3.0 Smart Changer consist of a total of 47 items. It contains not only basic information about the device such as serial number, name, system temperature, and CPU usage for each device, but also basic information about each input network and output network, separately.
3.2 Preparing the Broadcast Communication Multi-Stream Data
Data preparation refers to the step of processing the collected raw data into a usable form after going through a refinement process to improve the quality. The refinement process is the process of filtering or correcting errors to refine them and integrating or transforming the data as needed. Based on the raw data collected earlier, in this paper, data inconsistency was corrected by removing missing values and outliers after checking for data duplication. In addition, normalization is performed on each data to identify the relationship between data with different distributions. Data normalization, in general, is applied to numerical data when the range of raw data has a variance. This variance in the data can decrease the performance of machine learning algorithms [25]. In this paper, the format of the data representing the time when the event occurred was “yyyy-mm-dd h: mm” before refinement but was converted to “yyyy-mm-dd h:mm: ss” form after refinement. We also removed missing values and outliers from each data column.
3.3 Exploring the Broadcast Communication Multi-Stream Data
Data exploration is a step to figure out the relationship or interaction between data and variables. It is also called exploratory data analysis (EDA), because it checks the relationship between variables, data distribution, deviation, and whether there is a pattern. Based on the previously refined data, the analysis steps through EDA are shown in Table 2.
First, as mentioned above, normal and abnormal multi-stream data are classified from the collected and refined data. In this paper, the normal situation is set as level 1, and the abnormal situation is classified into level 2 and level 3 according to the degree of risk. The existing methods classified as normal or abnormal simply switch when the packet loss threshold is reached. This method has a limitation in that, if the service provider sets the packet loss threshold high, only streams belonging to extreme cases are switched. That is, when switching is needed soon or switching is required, a situation in which switching cannot be performed may occur. In addition, when the packet loss threshold is low, switching occurs frequently, which causes problems such as disconnection, delay, and stoppage in provided services as well as the reduction in the lifespan of equipment. Therefore, to solve these problems, we propose to classify abnormal situations into two levels. Even if some abnormal situations occur, the step of monitoring the situation first is set to level 2, and the step requiring immediate switching is set to level 3. Then, the basic statistics, including average variance, and distribution are identified for each column of the previously collected and refined data. Fig. 5 shows a graph to understand the distribution of cpu_usage among various attributions. As shown in Fig. 5, the cpu_usage attribution can be regarded as the most meaningful attribution when detecting an abnormal multi-stream. In Fig. 5, the part shown in orange is the case of level 3 of the abnormal multi-stream situation, and the part shown in blue is the case of level 2. Through Fig. 5 as mentioned below, level 2 belongs to the level 3 category, and it is necessary to further subdivide it by section.
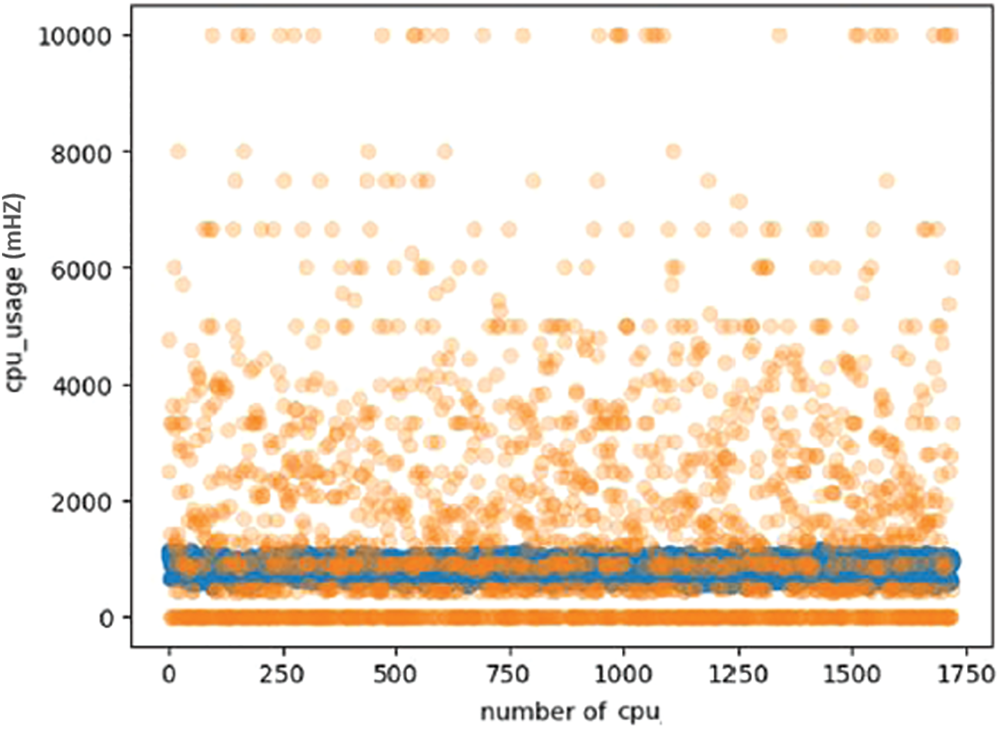
Figure 5: Distribution graph of cpu_usage attribution
The histogram graph showing the distribution of level 2 and level 3 for each section after standardization of the usage attribution is shown in Fig. 6. From here on, all data in Section 3.3 has been standardized. The reason is that when comparing each feature, it is difficult to make a comparison if the units and ranges of each feature are different. In addition, because scaling can be performed before machine learning, data labeling was performed using the StandardScaler module of python’s scikit-learn in this paper. As shown in Fig. 6, the distributions of level 2 and level 3 overlap within the normalized range from −1 to 2, and only level 2 is indicated in the interval of 2 or more, and level 3 is indicated only in the interval below −1.
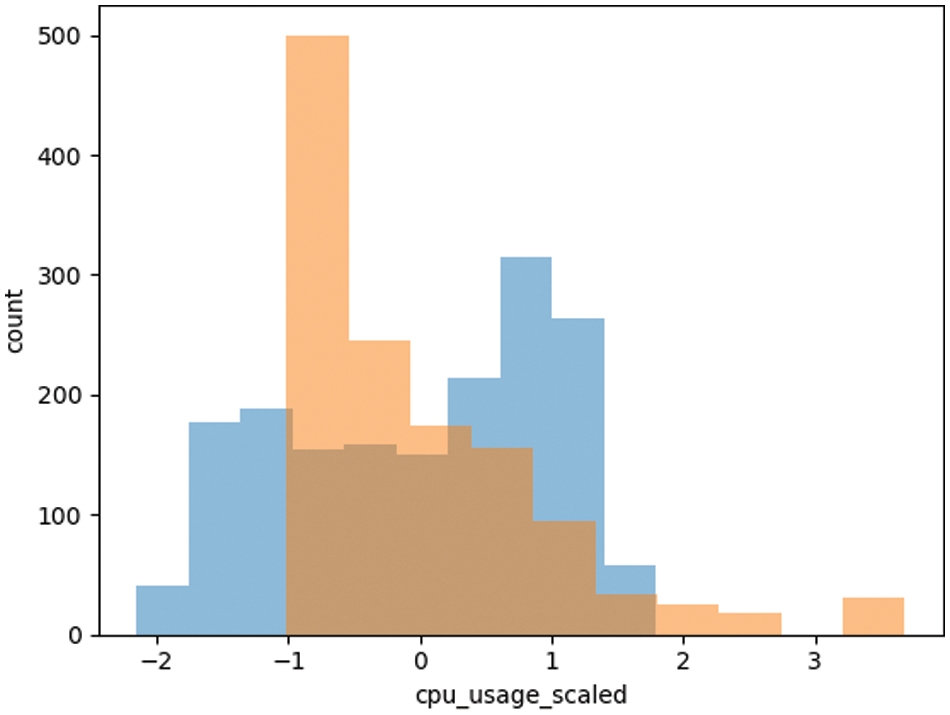
Figure 6: Histogram graphs representing level 2 and level 3 of abnormal multi-stream
The second most significant data after the cpu_usage attribute in abnormal multi-stream detection can be determined by the data_bitrate attribute. A graph to find out the relationship between the data_bitrate attribute and the cpu_usage attribute and whether each feature has an independent relationship is shown in Fig. 7.
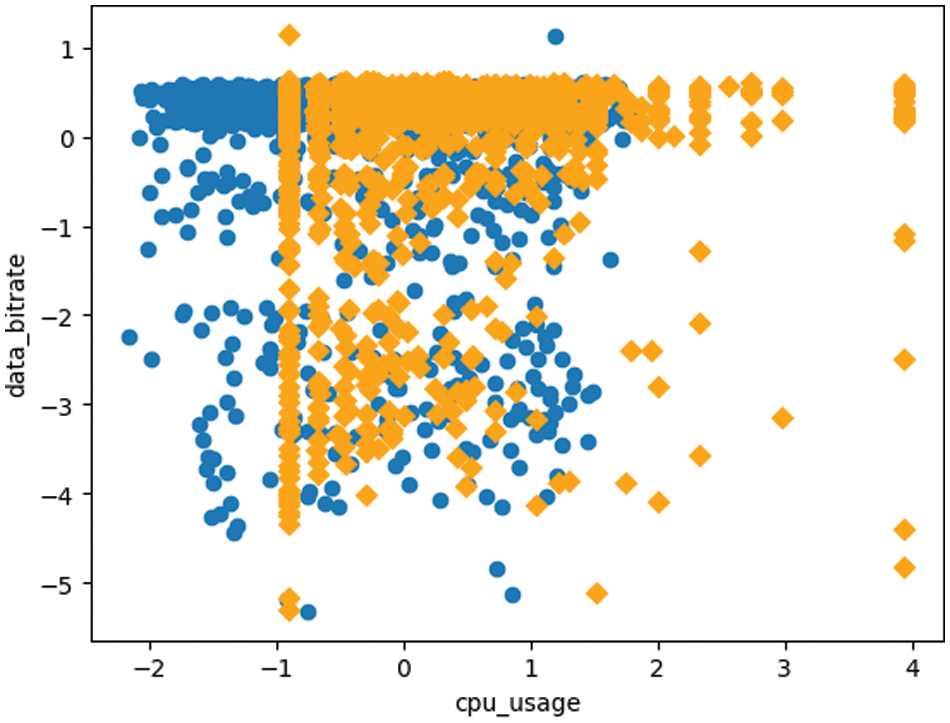
Figure 7: Correlation graph between cpu_usage and data_bitrate properties
As described above, in the graph shown in Fig. 7, orange means level 3, and blue means level 2. Since the distribution of the cpu_usage attribute and the data_bitrate attribute is different, the corresponding graph is derived with standardized data. Similar to the cpu_usage property described above, there is an overlap between level 2 and level 3.
In abnormal multi-stream detection, data that can be judged to be the third most significant after the cpu_usage and data_bitrate attributes can be seen as the memory_usage attribute. To understand the independent relationship and relevance between these three data, each data is standardized, and the graph shown in Fig. 8 is derived. The x-axis represents the cpu_usage attribute, the y-axis represents the data_bitrate attribute, and the z-axis represents the memory_usage attribute.
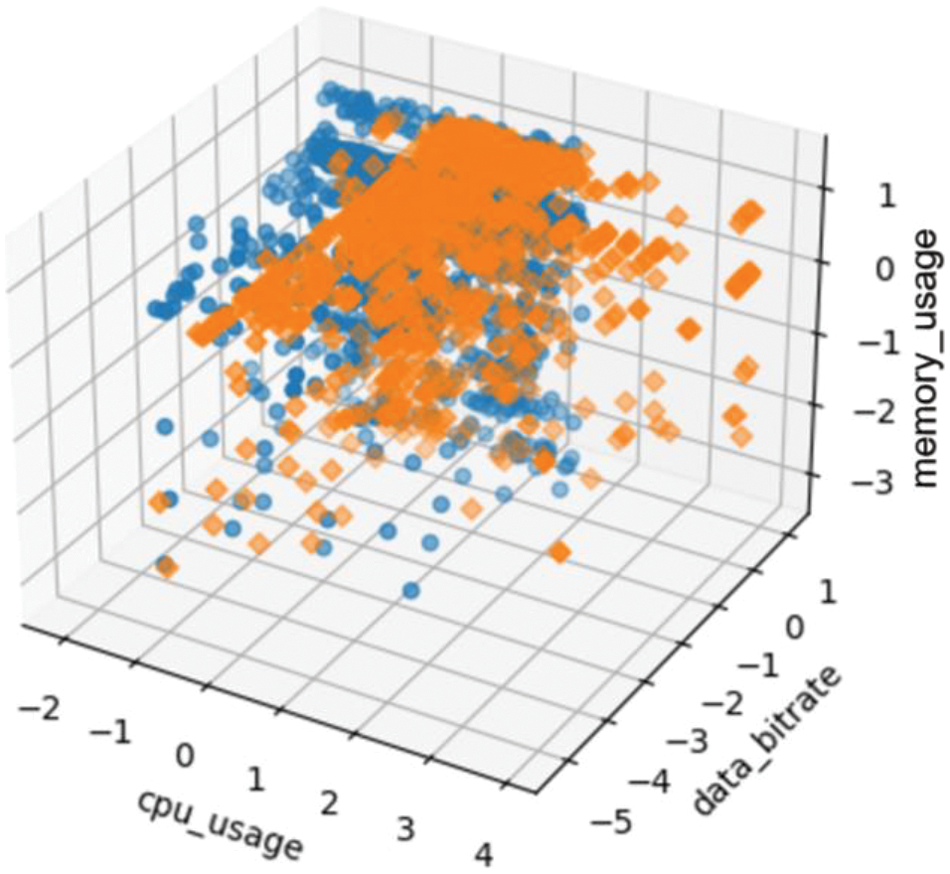
Figure 8: Correlation graph of cpu_usage, data_bitrate, and memory_usage properties
As shown in Fig. 8, level 3 is displayed in orange, and level 2 is displayed in blue. This graph also shows level 2 and level 3 are overlapped even when the memory_usage property is included. Through the preceding processes, it can be seen that a data model that classifies level 2 and level 3 by utilizing all of the cpu_usage property, data_bitrate property, and memory_usage property is necessary for the data modeling process to determine the abnormal multi-stream to be performed later.
3.4 Modeling the Method for Maintaining Stable High-Quality Video Streaming in Multi-Stream Transmission Environments
As mentioned in Section 3.2 above, there are the following limitations in distinguishing abnormal multi-streams simply with the packet loss threshold. When the threshold is high, switching is performed only in extreme cases where switching is required, and when the threshold is low, frequent switching occurs. Therefore, we propose to classify the abnormal multi-stream into level 2 and level 3 according to the degree of risk. Level 2 and level 3 are classified through representative classification models such as logistic regression, decision tree, and random forest. In addition, the data to be applied to each classification technique is divided into two parts: The partial data set where level 2 and level 3 overlap, and the entire data set. In the accuracy part, it can be seen that the partial data set with a dense distribution is more dominant. Table 3 shows the accuracy of each classification model for each data set.
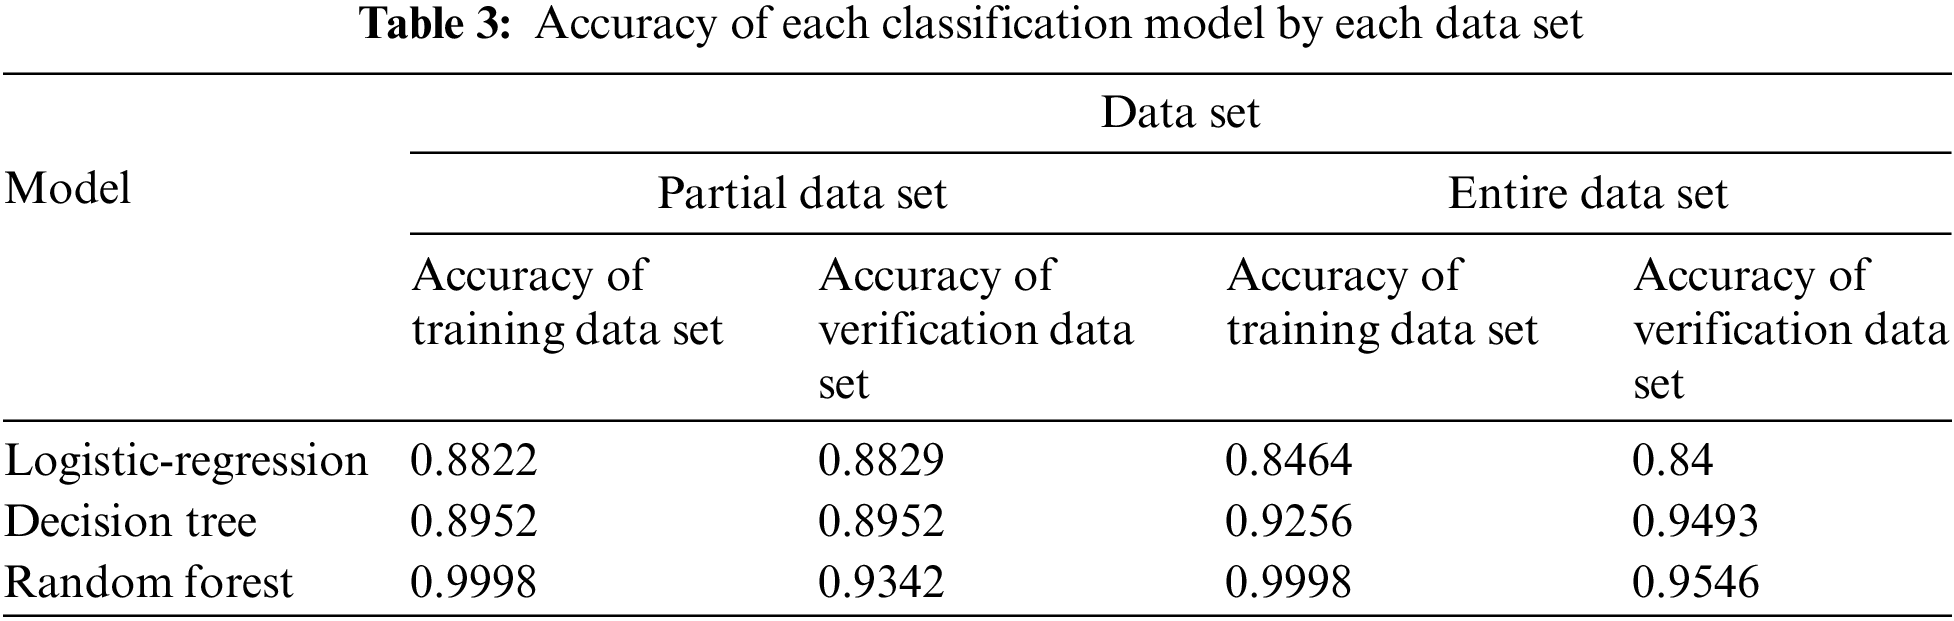
As shown in Table 3, all models show an accuracy of at least 84% or higher. It can be seen that the random forest model based on the partial data set and the entire data set is over-fitting, and the decision tree model based on the entire data set is under-fitting. Therefore, in this paper, we classify the abnormal multi-stream into level 2 and level 3 according to the risk level determined above through the logistic regression model based on the entire data set. This does not require a large amount of calculation, enabling faster classification.
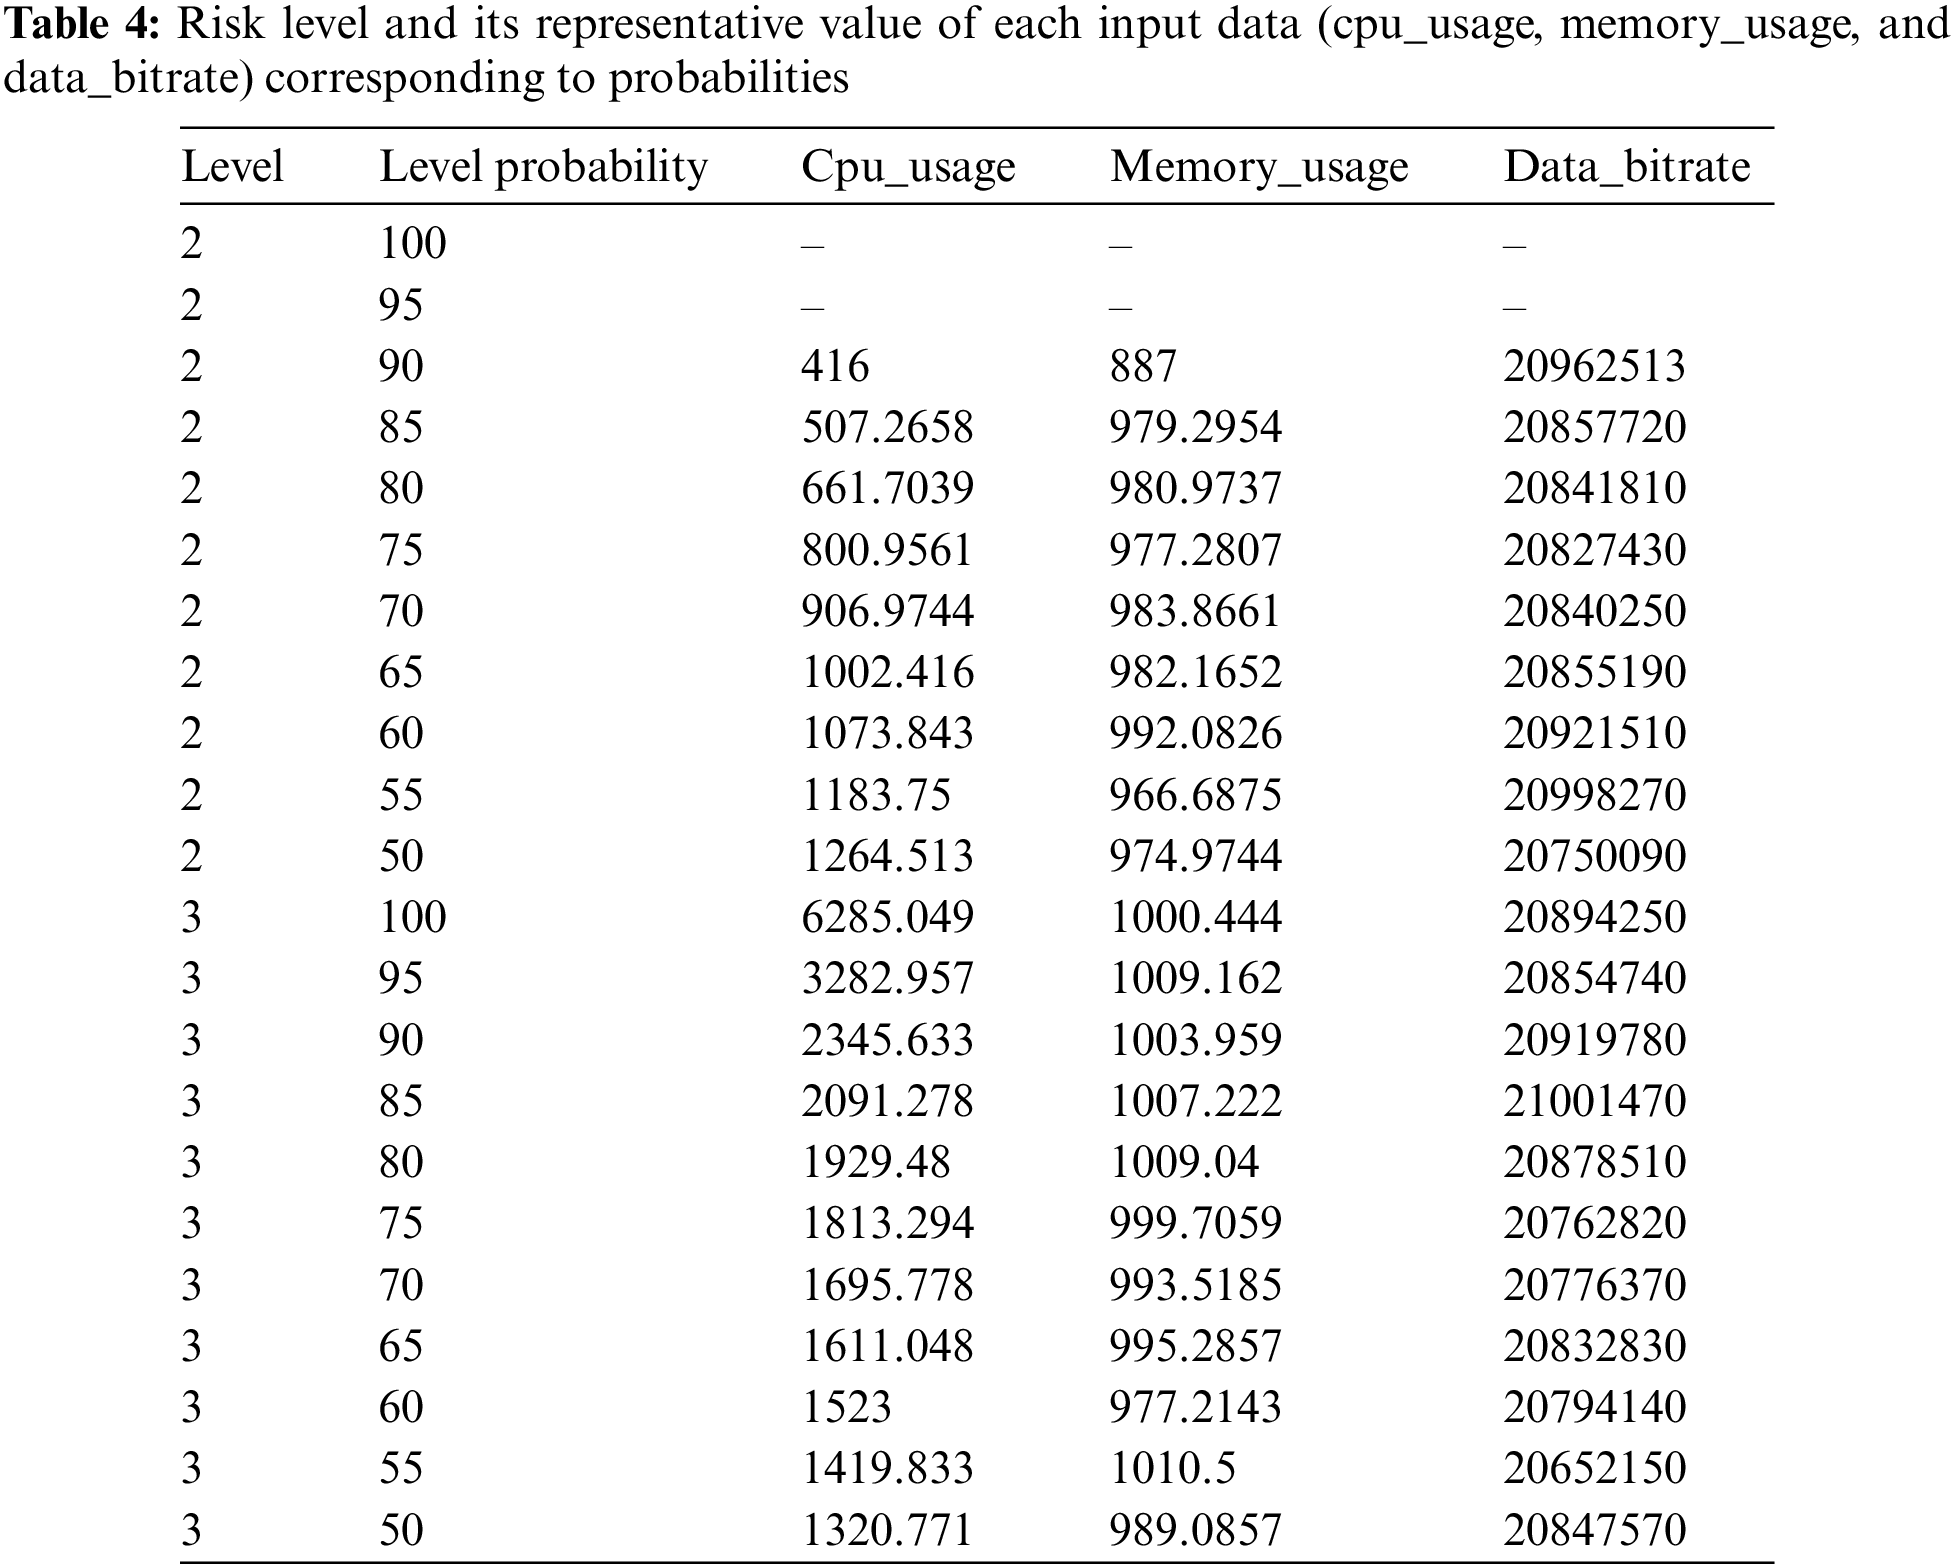
In the broadcasting communication network, multi-streams are transmitted in real-time from the Smart Changer at high speed. That is, a quick decision about switching is essential and it is directly related to service quality. Due to this characteristic, it is impossible to judge in real time because it takes a lot of time to classify all multi-stream data transmitted from the Smart Changer every second, not only whether normal or abnormal multi-stream but also should discriminate the risk level in case of abnormality through the logistic regression model presented above. Therefore, we use the multi-stream data continuously transmitted from the Smart Changer and vectorize the representative value of each input data corresponding to each probability from 100% to 0% at 5% intervals for each risk level based on the logistic regression model and constantly update it. Based on the reference value obtained through this process, among the data collected from Smart Changer, ‘cpu_usage’, ‘memory_usage’, and ‘data_bitrate’ values are vectorized to determine switching through the dot product with the reference vector. Table 4 shows a reference table describing the representative values of each input data for each risk level and probability obtained through the logistic regression model based on the data generated from the Smart Changer.
Because the distributions of cpu_usage, memory_usage, and data_bitrate are different, a normalization process is necessary, and the normalized values are shown in Table 5. As mentioned above, switching is determined through a comparison between each input data collected from the Smart Changer in real-time and the representative values of each input data obtained through Tables 4 and 5. At this time, for faster comparison, the normalized value is vectorized and the dot product between the vectors is calculated to determine switching.
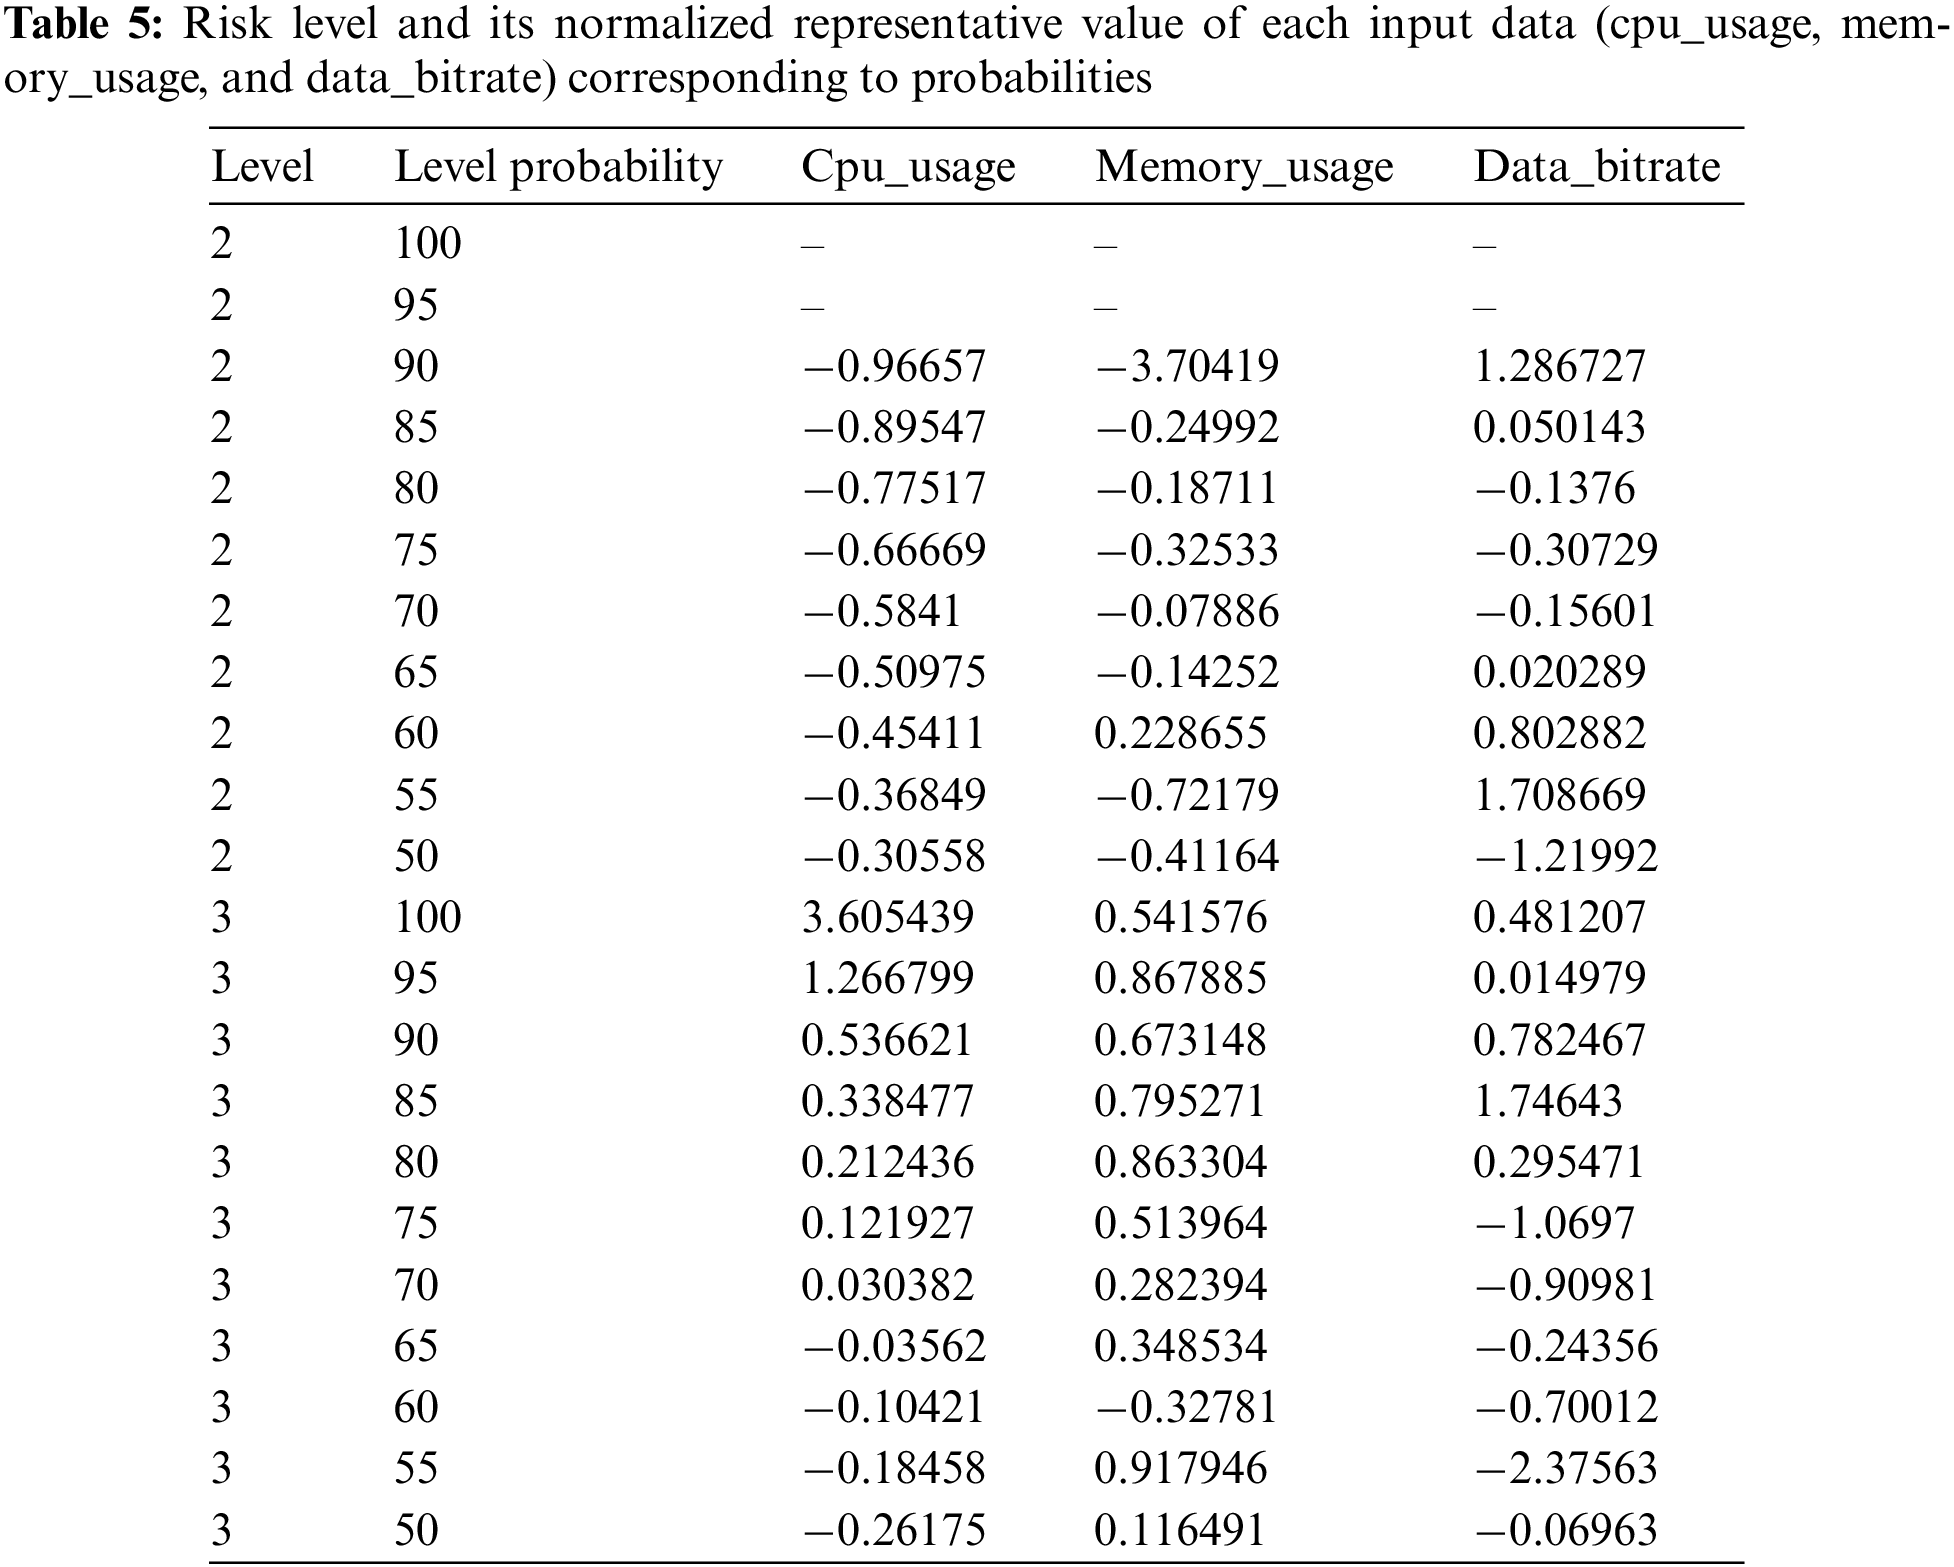
In addition, as shown in Tables 4 and 5 presented above, it can be seen that the values affecting the switching determination are different for each input data attribute.
The feature importance ratio between cpu_usage:Memory_usage:Data_bitrate is 3:3:2 and it is shown in Fig. 9. Each vector obtained through normalization is multiplied by the corresponding ratio value. For the switching decision and each risk level value, the cpu_usage, memory_usage, and data_bitate values are normalized from the data received from ATSC 3.0 Smart Changer, and the cosine similarity value between the created vector and each vector in Table 5 is presented as the switching decision criterion table is calculated. Among them, the risk level and probability of the column whose cosine similarity value is closest to 1 are obtained and applied to the switching decision. The cosine similarity expression is equal to
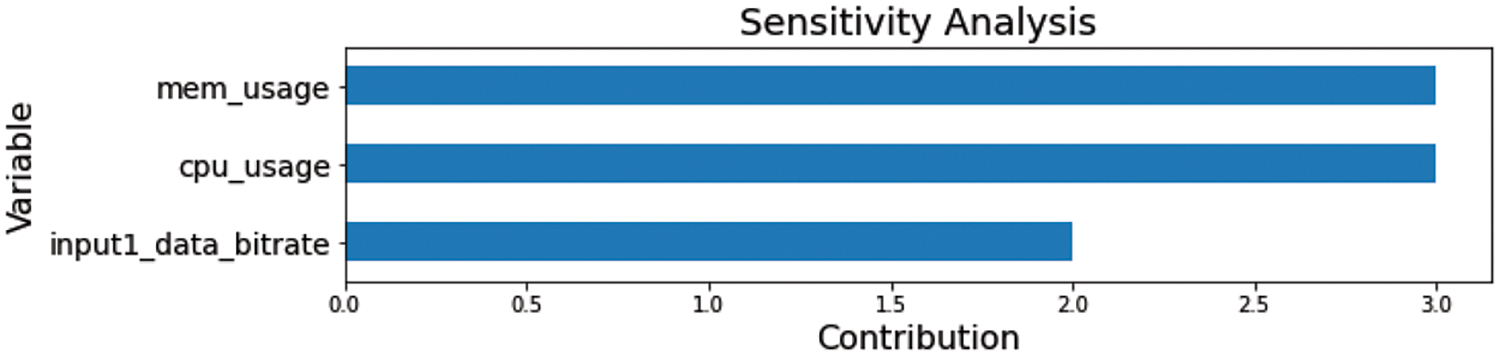
Figure 9: Graph of feature importance of input data
A flowchart showing the abnormal multi-stream detection method proposed in this paper is shown in Fig. 10. In order to build the algorithm database table in Fig. 10, the contents presented in Sections 3.1 to 3.4 must be performed and its process has presented in Fig. 11. As shown in Fig. 10, if the data is in level 3 with the risk value from 100% to 75%, it means immediate switching must required, and if the risk is from 70% to 50%, switching is determined by the cumulative average of three times. In level 2, the risk level is 90% to 70%, the switching is judged by the cumulative average of 5 times, and if the risk is from 65% to 50%, the current state is maintained first, and continuously monitor whether the multi-stream is normal or abnormal. When it is determined that switching is necessary, it means that the corresponding input network needs to be switched. At this point, the packet error rate (PER) of the other different input networks is calculated and compared, and switching is performed to a more stable network.
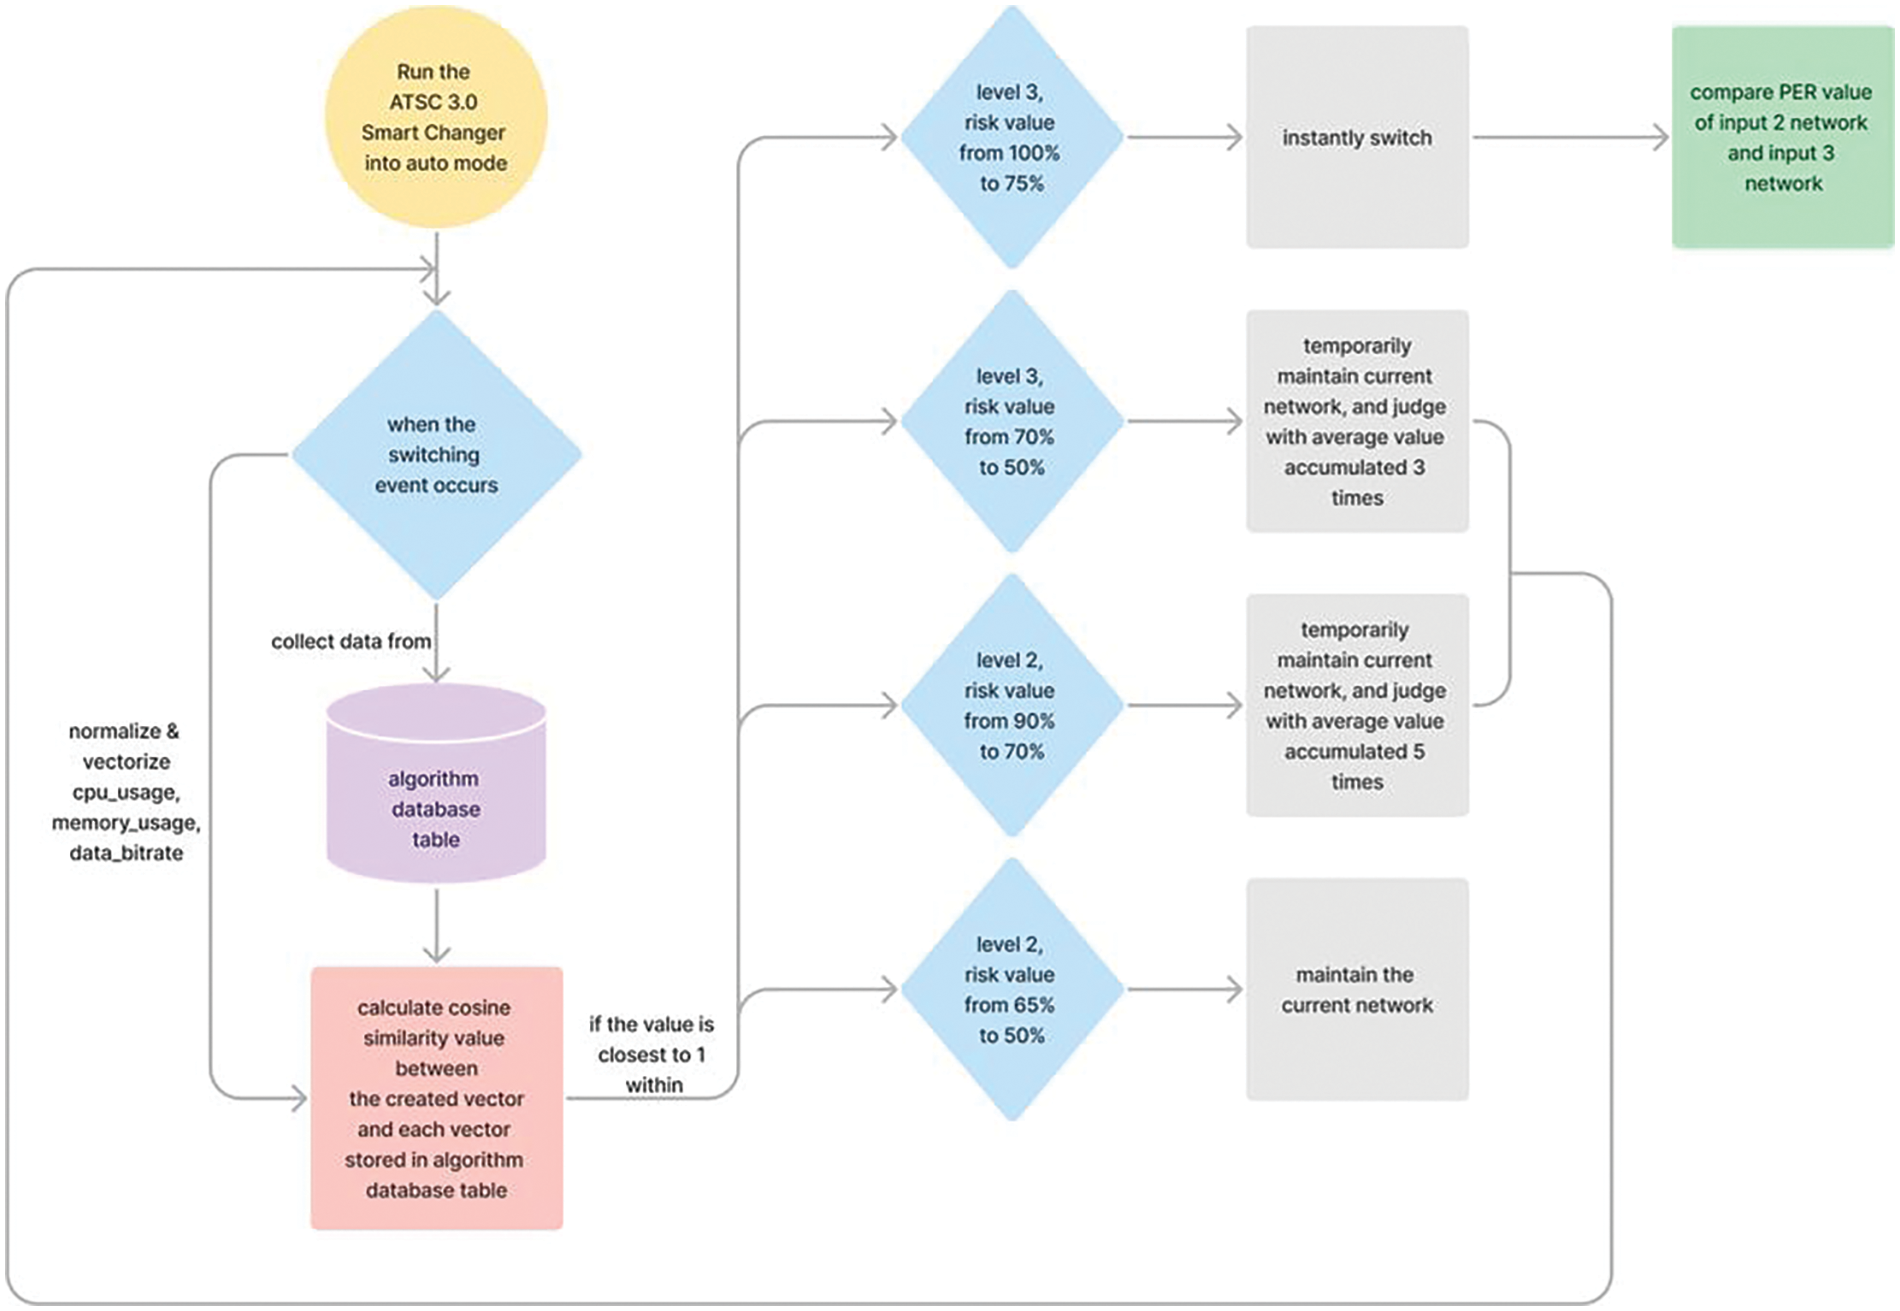
Figure 10: Flowchart of abnormal multi-stream detection method
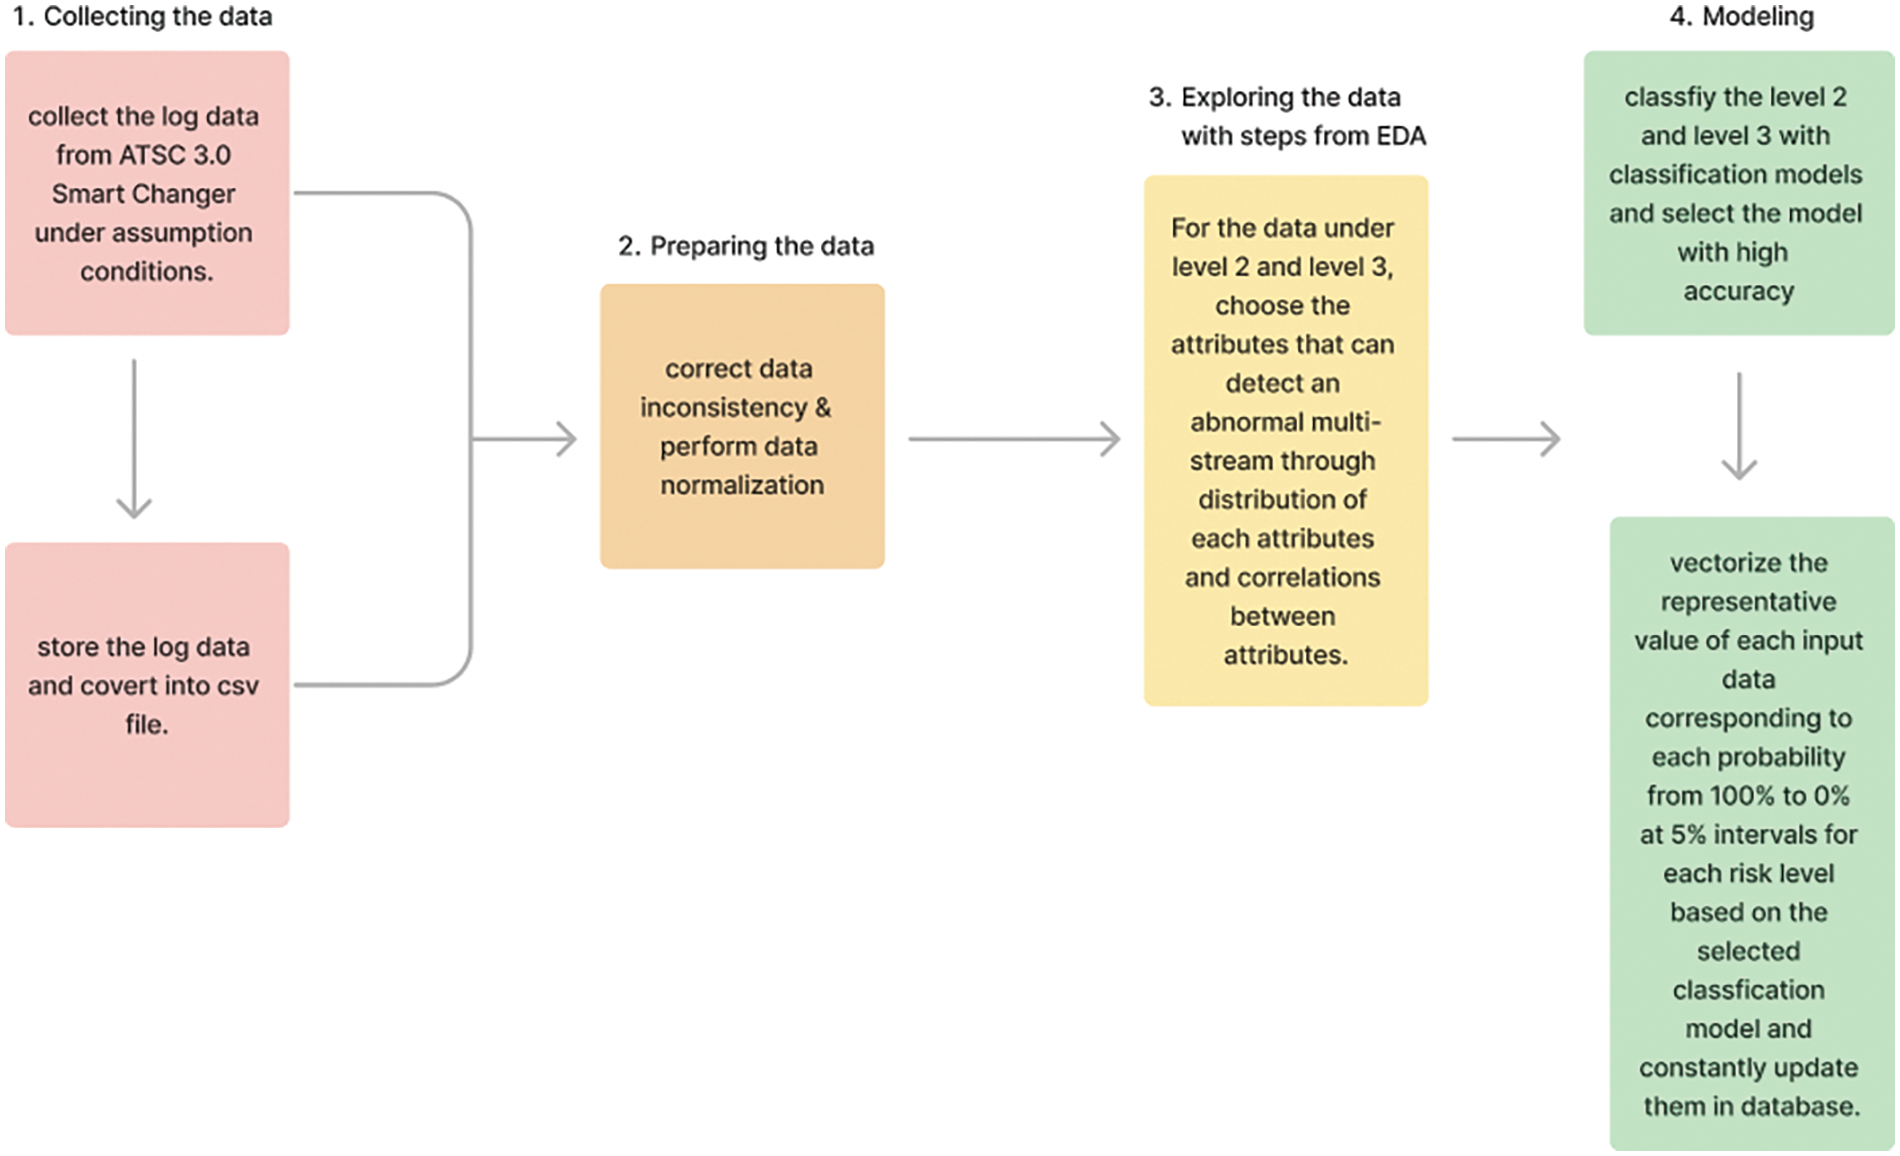
Figure 11: Flowchart of the process to build algorithm database table
4 Verification Platform for Maintaining Stable High Quality of Video Streaming in Multi-Stream Transmission Environments
In this section, we present a platform that can verify the abnormal multi-stream detection method presented above. To apply this method in the ATSC 3.0 Smart Changer server, problems such as stability problems and performance degradation due to system load may occur, so we want to verify it on a platform in an independently distributed environment. First, we present the environment of the verification platform and then explain each step of design and implementation in turn.
4.1 Environment of Verification Platform
A platform capable of verifying the abnormal multi-stream detection method proposed above is designed based on the Model-View-Controller (MVC) pattern, which is most commonly used in software architecture design. The proposed verification platform should be able to process large amounts of data quickly, have standardized data, have relationships between data, and satisfy all of them. To satisfy these conditions, highly versatile MySQL is used as a DBMS. In addition, it is implemented based on Node.js, which can handle events asynchronously when they occur, and uses bootstrap and pug view templates for UI screens. All source codes of the proposed verification platform are managed through GitHub, and Amazon Web Server (AWS) are linked for future distribution [27].
4.2 Definition of the Requirements and Functions of Verification Platform
Users of the proposed verification platform can be divided into ATSC 3.0 Smart Changer and the operator who manages it. The requirements of the verification platform are divided and defined by the user and are presented in Table 6.
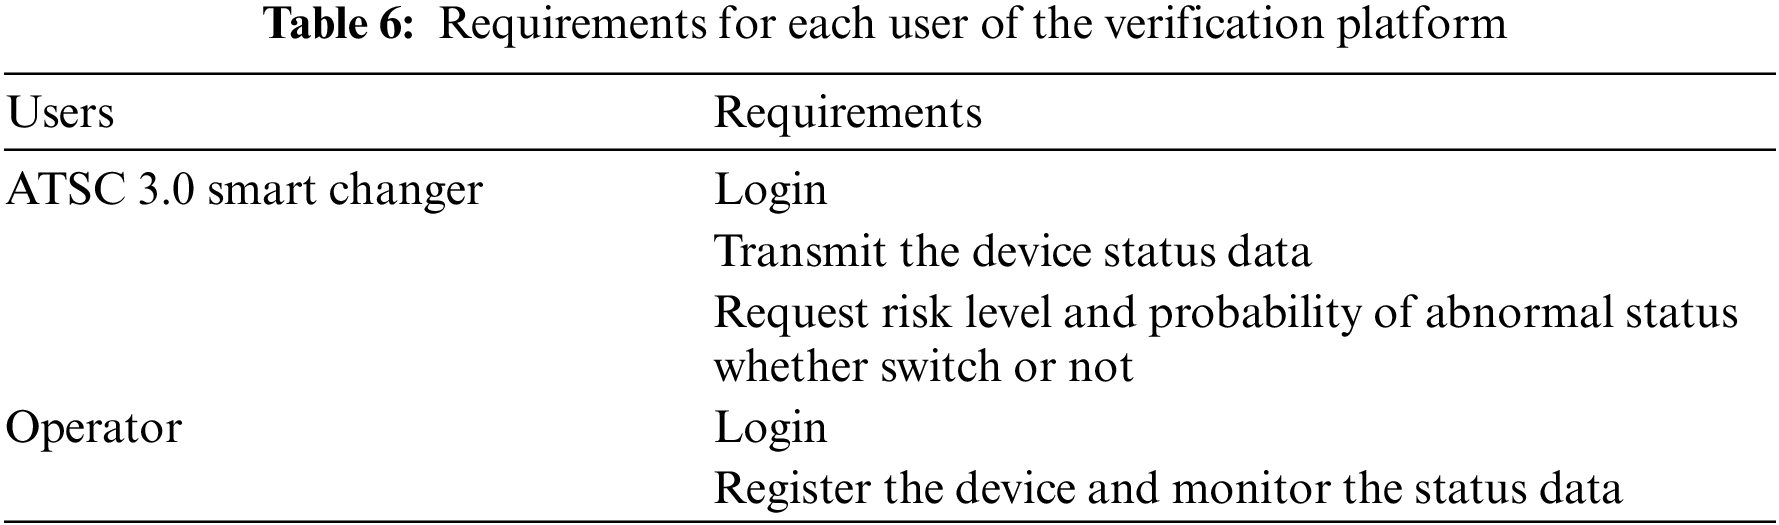
The function of the platform is defined through the requirements presented in Table 6, and the sequence diagram of the function is shown in Fig. 12. As shown in Fig. 12, the operator accesses the platform through login. After successful login, the operator can register basic information such as serial number, device ID, and device password of ATSC 3.0 Smart Changer. Then, the ATSC 3.0 Smart Changer server makes an authentication request to the platform through the registered serial number and device password and receives an authentication success or failure response. Certified ATSC 3.0 Smart Changer devices periodically transmit device status information data to the platform, which also receives transmission success and failure responses. The operator can view and monitor data for each registered ATSC 3.0 Smart Changer device. In addition, the ATSC 3.0 Smart Changer server requests the risk and probability value of the abnormal state, whether switching is needed or not, recommends the network for a successful switch to the platform by fixed cycle, and receives the value obtained through the algorithm in the platform as a response.
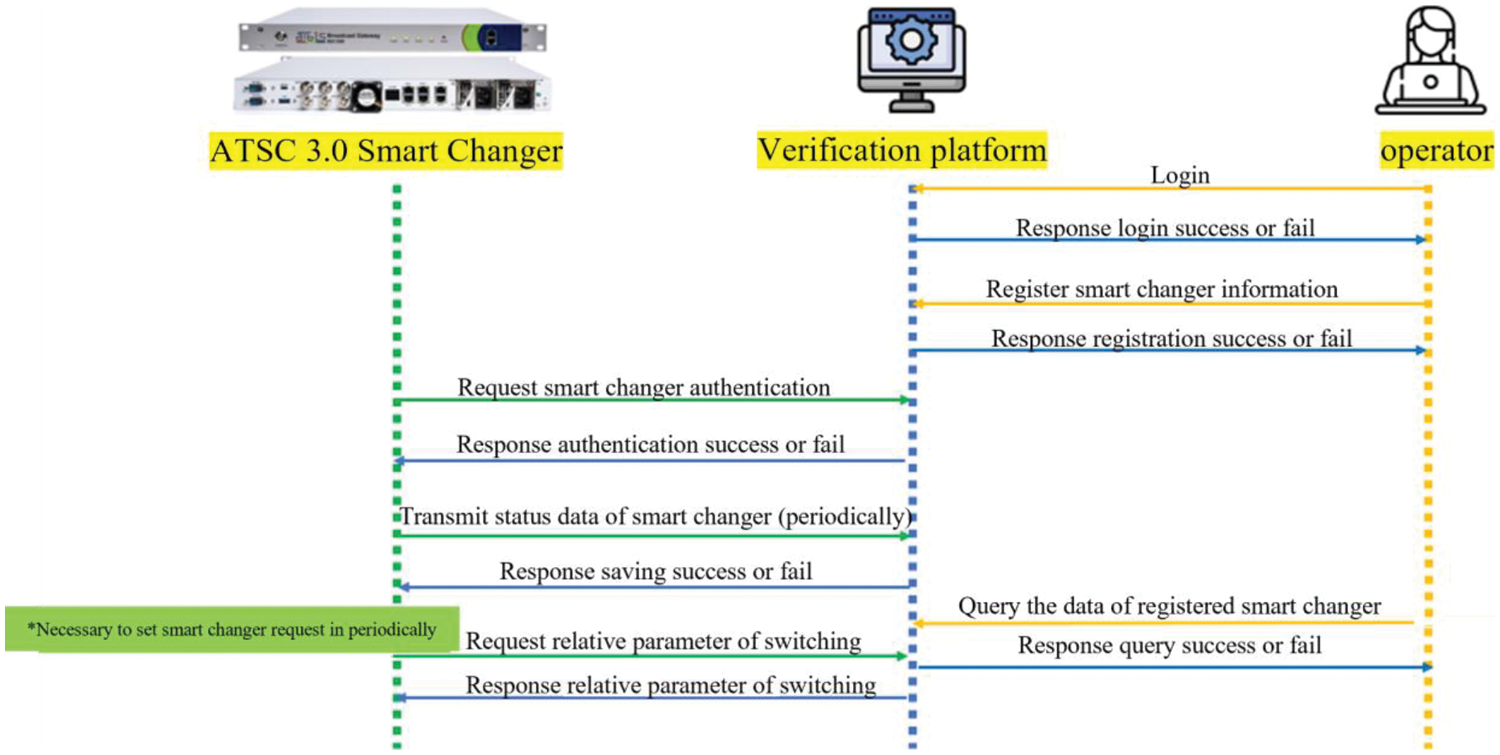
Figure 12: Sequence diagram of the function of the verification platform
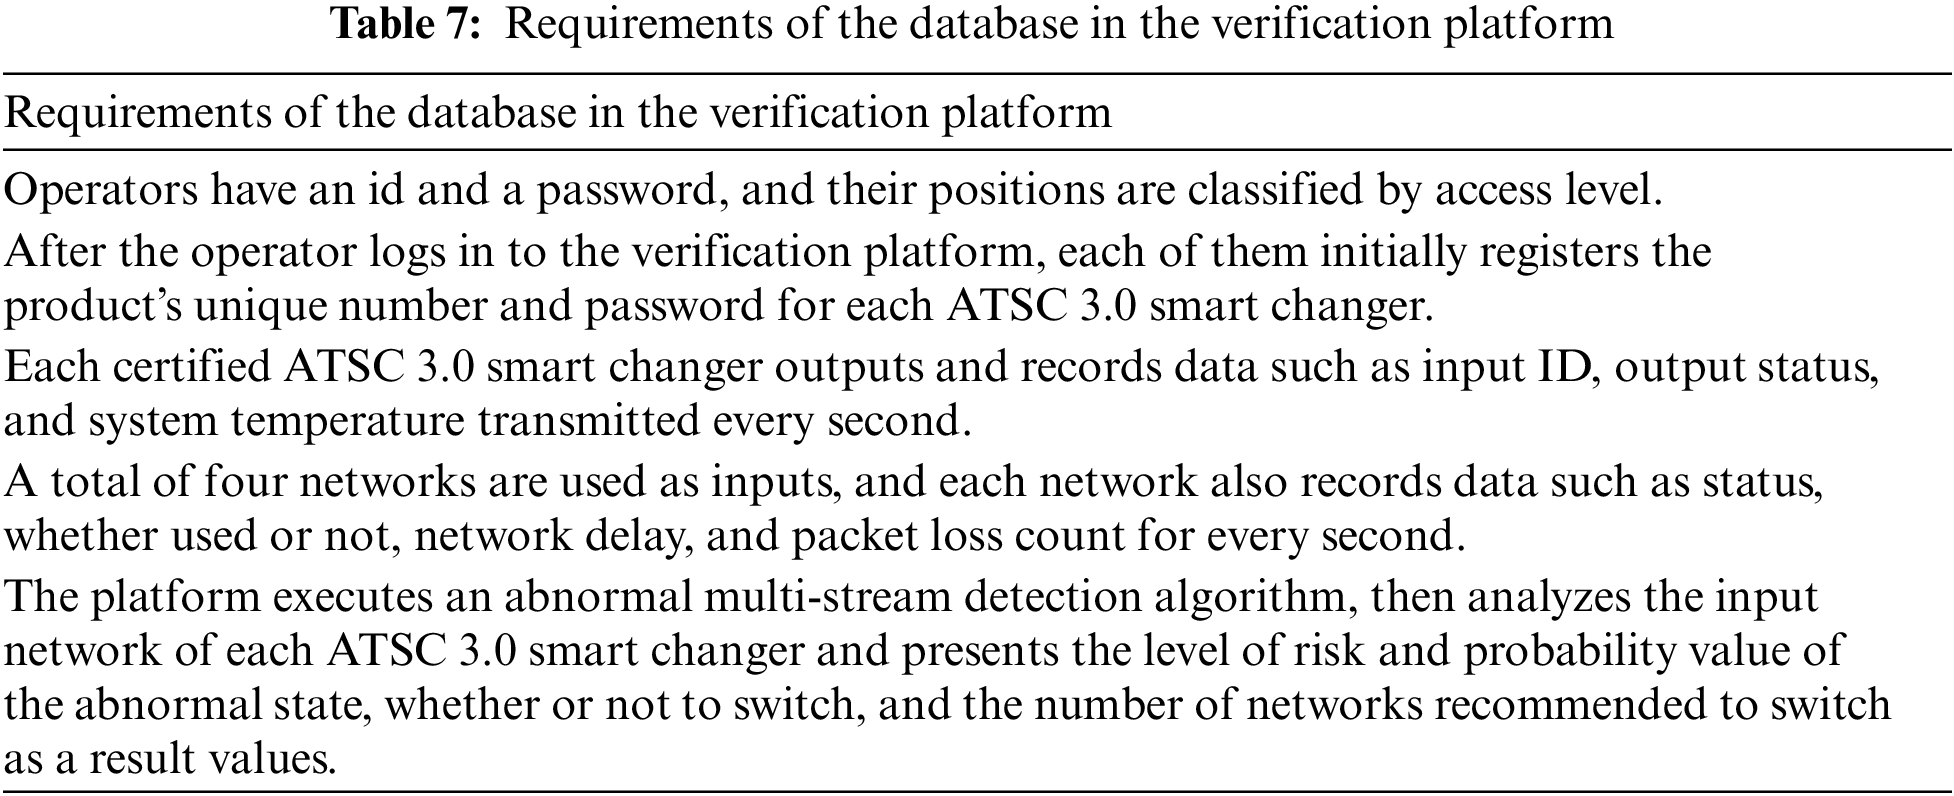
4.3 Design of Database of Verification Platform
The database in the verification platform is designed based on the requirements and functions defined in Table 6 above. The requirements collected and analyzed before designing the database are shown in Table 7.
Conceptual, logical, and physical design proceeds based on the requirements shown in Table 7. The entity relationship-diagram (ERD) obtained based on the conceptual design is shown in Fig. 13. As shown in Fig. 13, there are seven tables. Tables such as Operator and MSC_info contain the basic information for login and registration, separately. One operator can manage several ATSC 3.0 Smart Changers, so there are too many relationships between those tables. One ATSC 3.0 Smart Changer has its basic status and it also contains status information of its four-input network and two-output network. That information contains in the MSC_detail, MSC_input_history, and MSC_output_history, separately. In addition, the result value obtained through the method proposed in Section 3.4 is stored in the algorithm table.
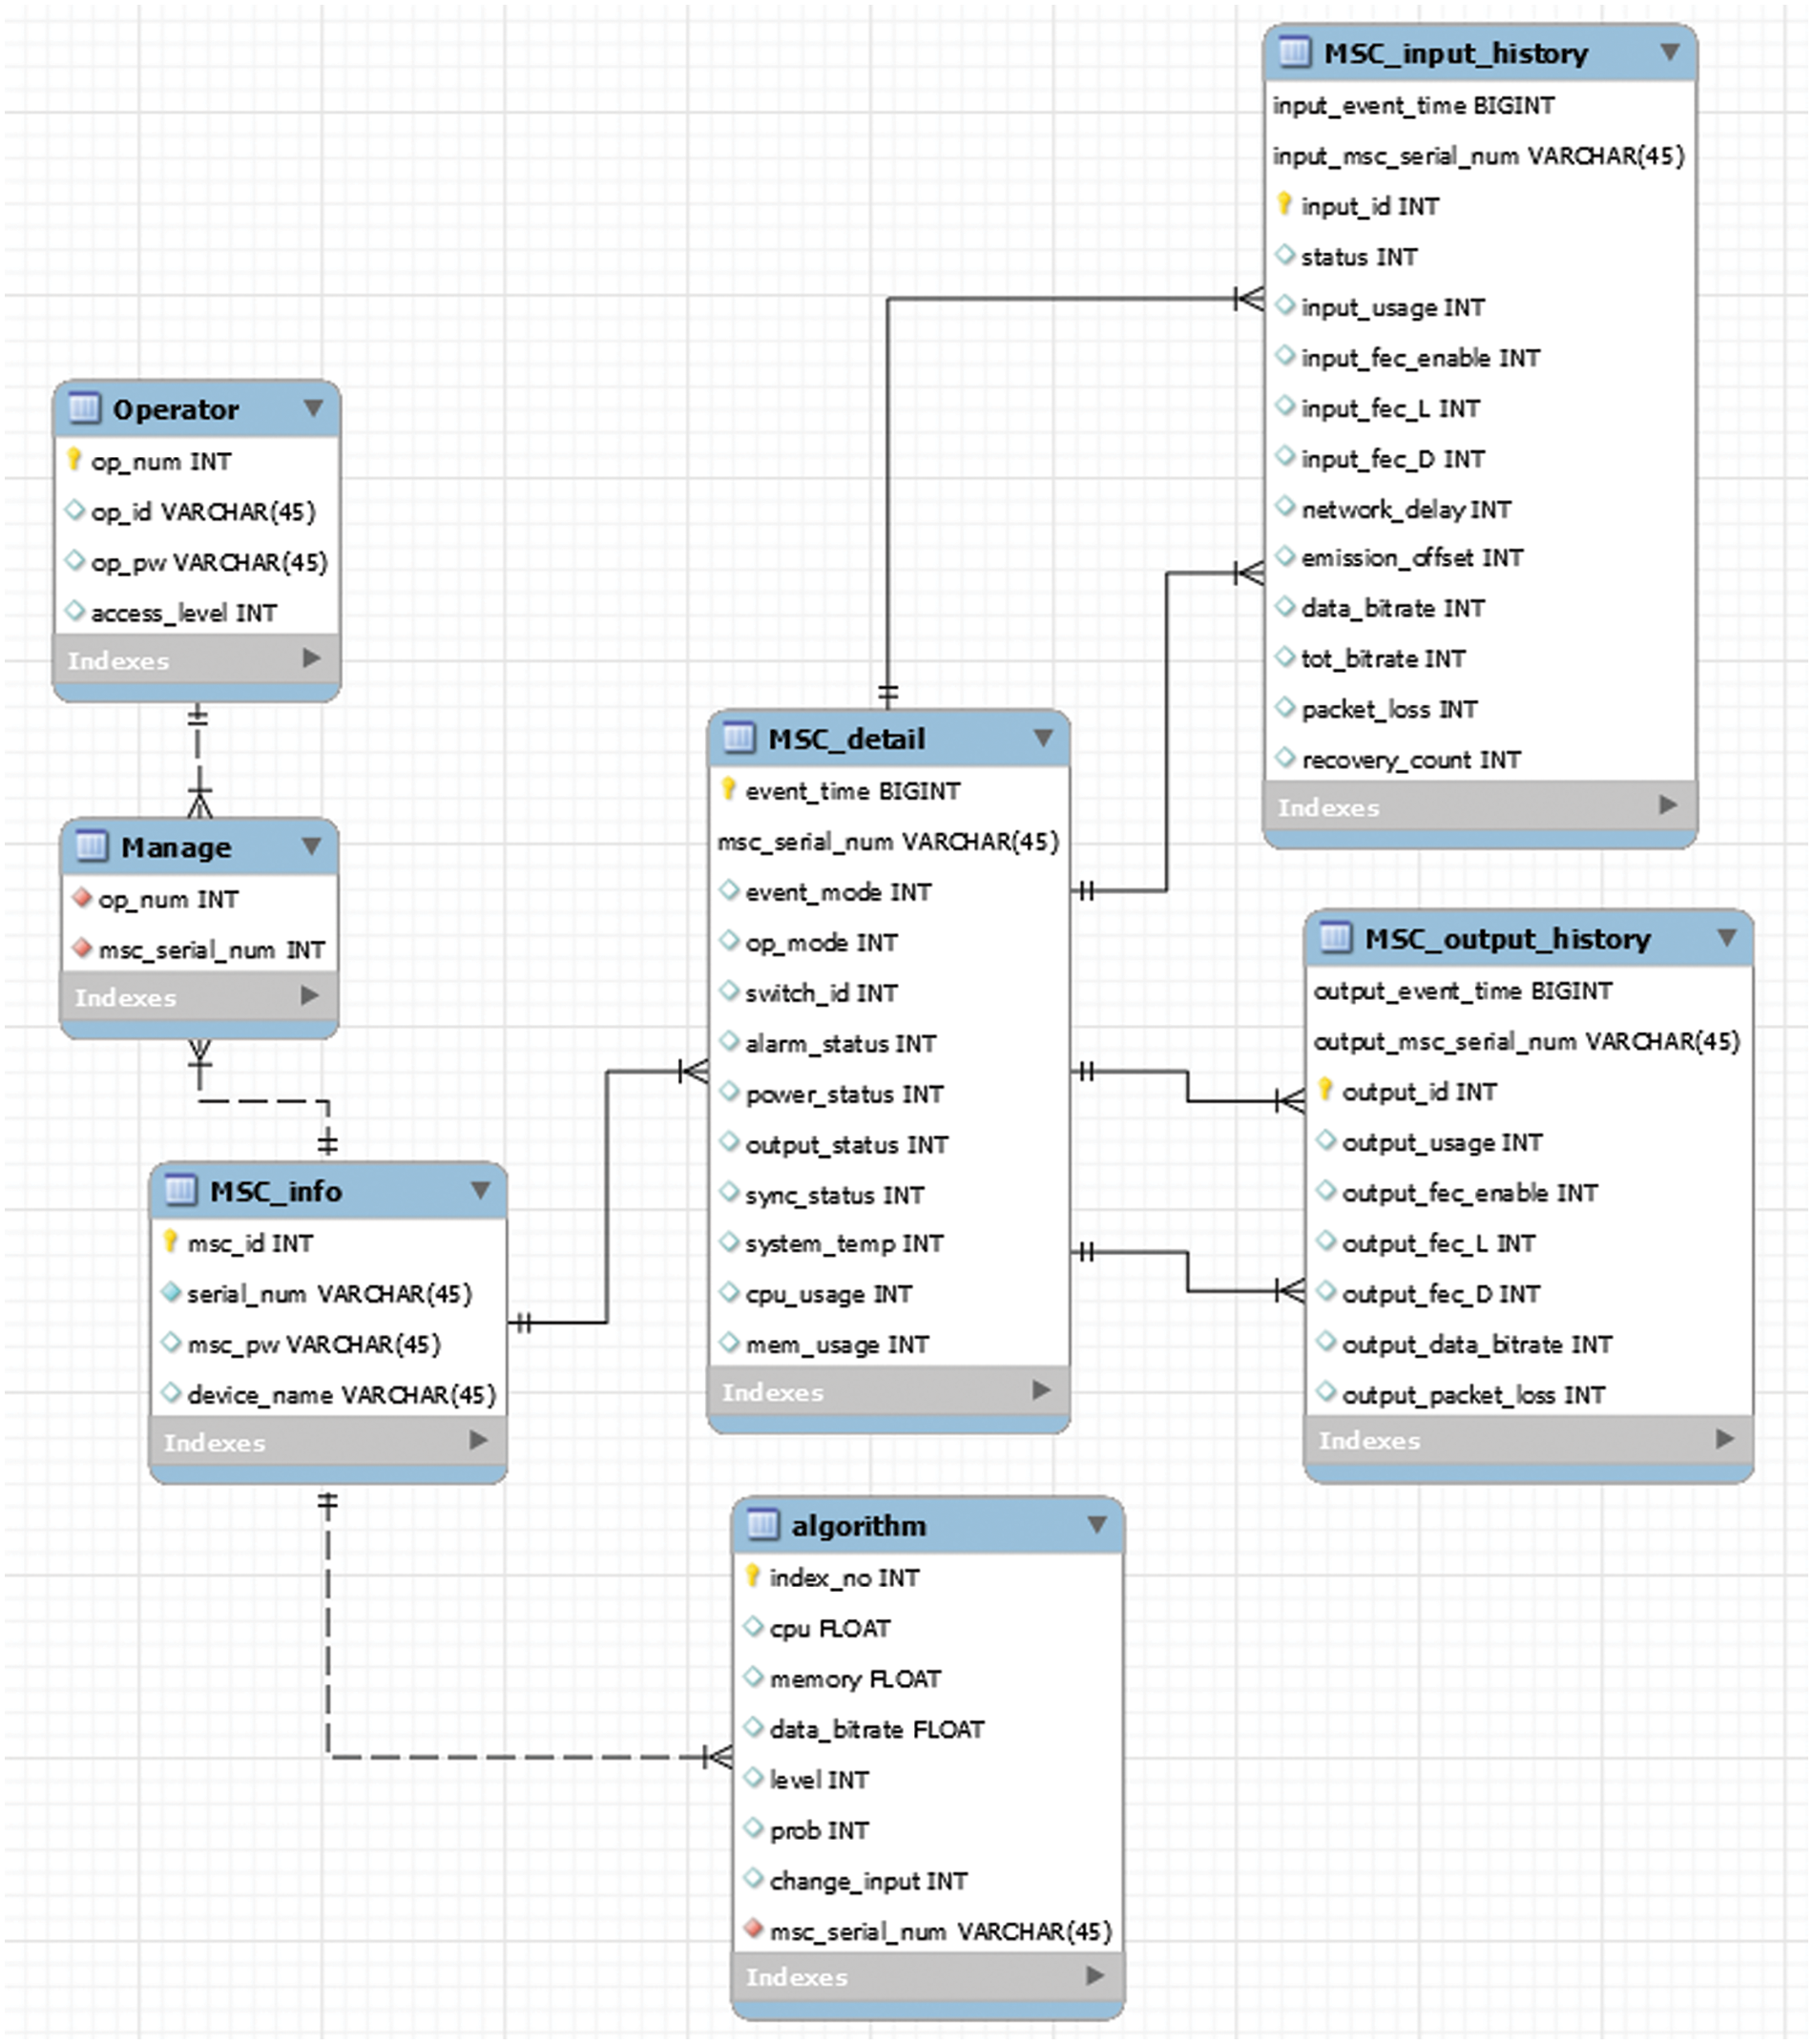
Figure 13: ER-diagram of the database of the verification platform
4.4 Implementation of Verification Platform
Based on Sections 4.2 and 4.3, the verification platform is implemented by function divided by users. The operator accesses the proposed verification platform through a registered ID and password, which are set and stored before. After successful login, the administrator registers the serial number, device ID, and device password, which are the basic information of the ATSC 3.0 Smart Changer in charge and these data are stored in the database of this platform.
The ATSC 3.0 Smart Changer server makes an authentication request to the platform through the registered serial number and device password and receives an authentication success or failure response. Certified ATSC 3.0 Smart Changer devices periodically transmit status information data to the database, which also receives a success or failure response about transmission. As the device’s status data is stored in the MSC_detail table, the MSC_input_history table, and the MSC_output_history table among database tables, operators can view and monitor data for each registered ATSC 3.0 Smart Changer device. Based on the serial number of the device, the data recently entered through the device is displayed on the UI screen. If the data is normally entered, the border of the table that displays the data of the device is shown in green color, but if the data is not updated for more than 10 s, it is shown in red color. Fig. 14 presents each case on the UI screen by dividing it into upper and lower parts.
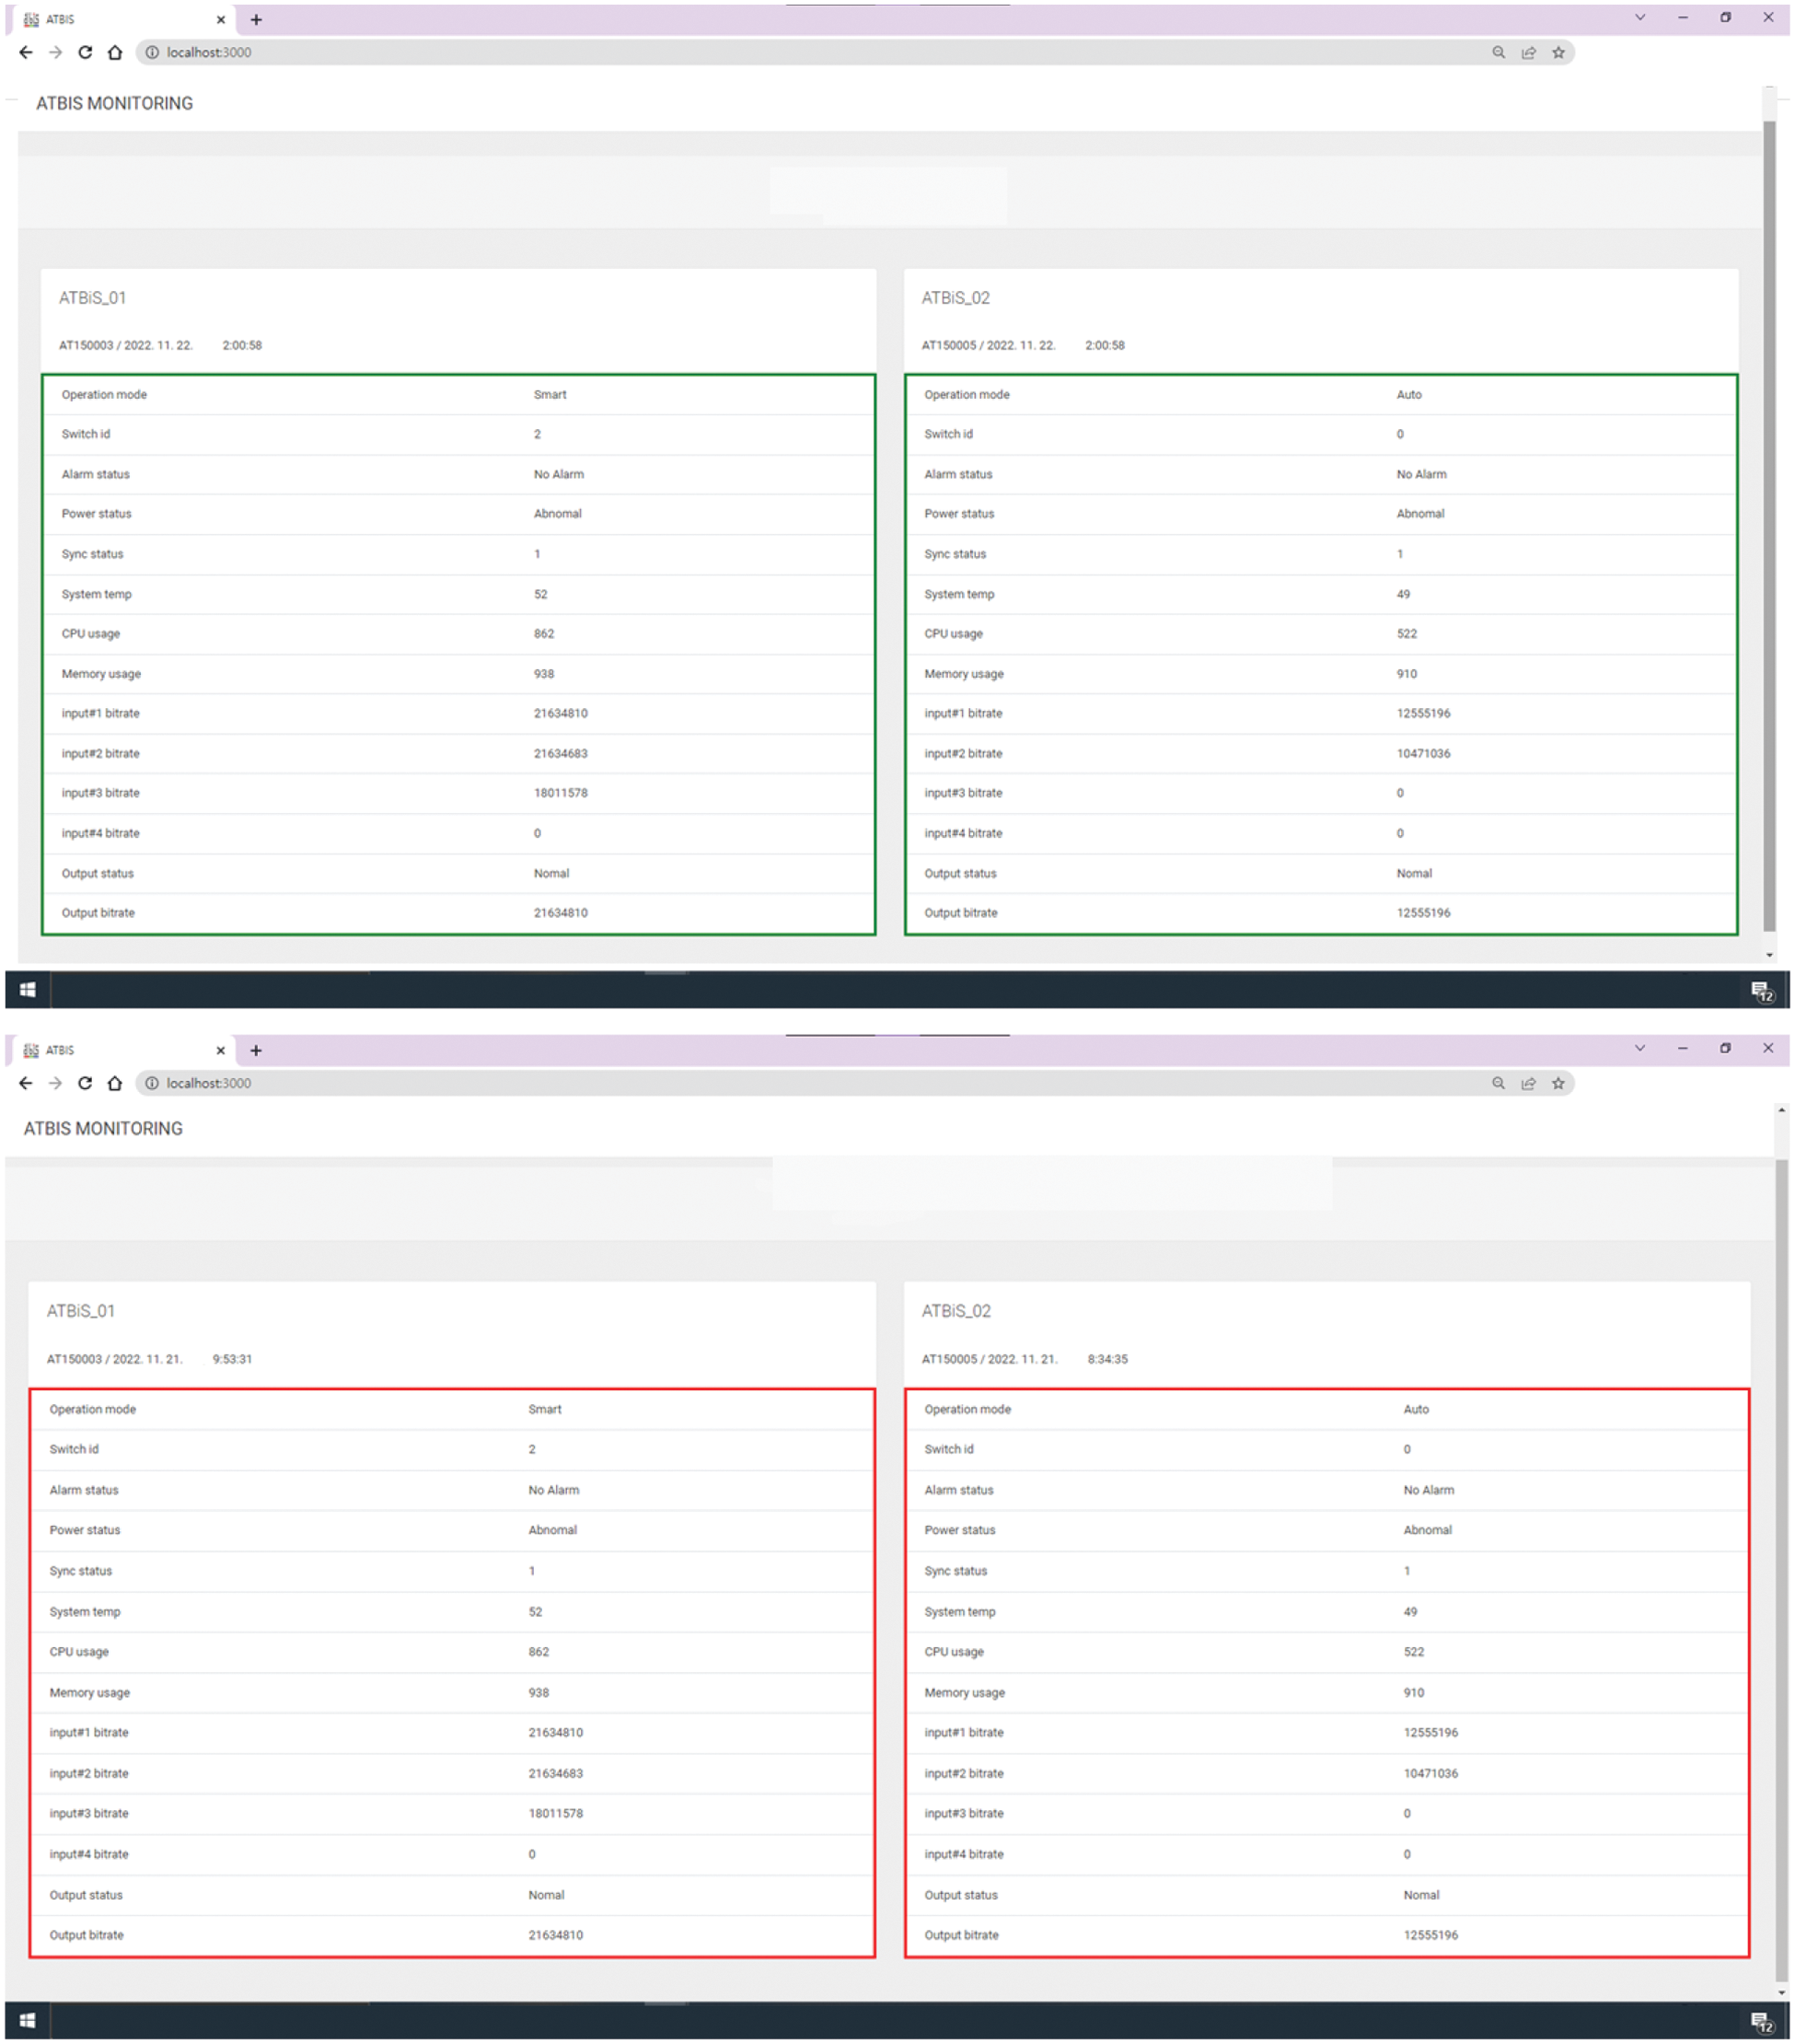
Figure 14: Verification platform: Admin operator’s monitoring UI screen (above normal state, bottom: Abnormal state)
In addition, ATSC 3.0 Smart Changer requests data such as the level of risk and its probability, whether to switch, and the network number recommended to be switched to the verification platform by fixed cycle and receives a response from the value obtained through the algorithm in the verification platform. As shown in Fig. 15, it contains the log data about detecting abnormal multi-stream and the number of networks recommended by the algorithm.
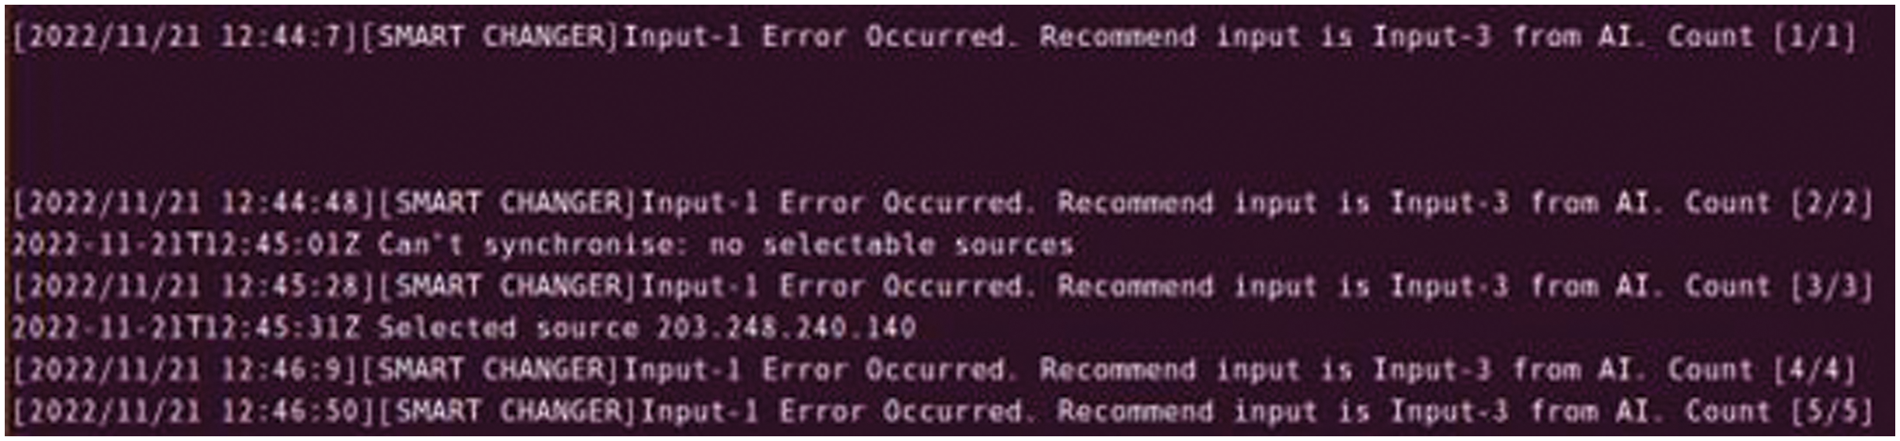
Figure 15: Verification platform: Response log from ATSC 3.0 smart changer server
As broadcasting communication technology has developed, various problems and limitations in multi-stream changers that simultaneously use terrestrial broadcasting networks and wired/wireless networks with high speed to provide large-capacity and high-quality content as a service without interruption have been recognized. To solve this problem, in this paper, we presented a smart packet switching method for maintaining stable high-quality video streaming in multi-stream transmission environments using machine learning and cosine similarity and also verified the proposed platform.
Based on data science methodologies, this paper proposed a method to maintain steady high-quality video streaming in multi-stream transmission environments. First, the research aims to prevent frequent switching by identifying abnormal multi-streams and presenting criteria for making decisions about switching for each case. Afterward, the log data collected came from the ATSC 3.0 Smart Changer equipment. The collected raw data was refined, reduced, and converted to prepare data and normal and abnormal multi-streams were classified. Basic statistics, such as mean and variance, and distribution were identified for each data type. We reduced these data to only meaningful data to detect abnormal multi-streams more precisely. Through this process, the steps for a method for maintaining stable high-quality video streaming in multi-stream transmission environments were designed and implemented. Also, the level of risk and its probability as well as whether switching is needed or not and the number of networks recommended for switching were derived from the method. To implement this method on the ATSC 3.0 Smart Changer server, we took the stability issues and potential performance degradation into account. As a result, we decided to establish it as a separate platform solely for verification.
In the multi-stream changer to which the proposed method is applied, we expected that it can support the process by narrowing down choices, and more reliable and smarter switching will be possible by predicting problems such as reliability and broadcasting accidents of the equipment in advance.
Acknowledgement: The authors would like to thank the editors and reviewers for their valuable work, as well as ATB is company for providing ATSC 3.0 Smart Changer environments.
Funding Statement: This work was supported by a research grant from Seoul Women’s University (2023-0183).
Author Contributions: The authors confirm contribution to the paper as follows: Yumin Jo: Methodology, Investigation, Software, Writing-Original Draft and Review an Editing and Jongho Paik: Resources, Validation, Editing, Funding. All authors reviewed the results and approved the final version of the manuscript.
Availability of Data and Materials: The data used in this paper can be requested from the corresponding author upon request.
Conflicts of Interest: The authors declare that they have no conflicts of interest to report regarding the present study.
References
1. J. J. Yan, Y. Q. Xia, and C. L. Wen, “Quantized stabilization of switched systems with switching delays and packet loss,” J. Frank. Inst., vol. 355, no. 13, pp. 5351–5366, 2018. doi: 10.1016/j.jfranklin.2018.05.009. [Google Scholar] [CrossRef]
2. Y. Gotoh, T. Yoshihisa, H. Taniguchi, and M. Kanazawa, “A method to reduce interruption time for streaming delivery of broadcast and communications integration environments,” in 2010 Int. Conf. on Complex, Intell. Softw. Intensive Syst., Krakow, Poland, 2010, pp. 784–789. [Google Scholar]
3. Y. Gotoh and H. Takahara, “A scheduling method to reduce interruption time in broadcast and communication integration environments,” in MoMM '20: Proc. of the 18th Int. Conf. Adv. Mobile Comput. Multimed., Chiang Mai, Thailand, 2020, pp. 161–169. [Google Scholar]
4. J. Jung, D. Choi, and R. Im, “Switched digital video using convergence transmission of broadcasting and communication on cable TV network,” in 2020 IEEE ICCE-Taiwan, Taoyuan, Taiwan, 2020, pp. 314–317. [Google Scholar]
5. J. Mfitumukiza et al., “IP studio infrastructure intended for modern production and TV broadcasting facilities,” Int. J. Adv. Smart Convergence, vol. 5, no. 3, pp. 61–65, 2016. doi: 10.7236/IJASC.2016.5.3.61. [Google Scholar] [CrossRef]
6. H. Yang, Y. Ryu, Y. Lim, and S. Hwang, “A service and transmission technology of Advanced Americas Broadcasting Standards, ATSC 3.0,” Broadcast. Media Mag., vol. 20, no. 4, pp. 46–57, 2015. [Google Scholar]
7. M. Gwak, “Introduction of ATSC 3.0 based ROUTE/DASH for UHDTV and IP Hybrid broadcasting service,” J. Kor. Inst. Commun. Inform. Sci., vol. 33, no. 7, pp. 25–31, 2016. [Google Scholar]
8. Y. Sohn, M. Cho, M. Seo, and J. Paik, “A Synchronization scheme for hierarchical video streams over heterogeneous networks,” KSII Trans. Internet Inf. Syst., vol. 9, no. 8, pp. 3121–3135, 2015. doi: 10.3837/tiis.2015.08.022. [Google Scholar] [CrossRef]
9. M. Park and Y. Kim, “An overhead comparison of MMT and MPEG-2 TS in broadcast services,” J. Broadcast Eng., vol. 21, no. 3, pp. 436–449, 2016. doi: 10.5909/JBE.2016.21.3.436. [Google Scholar] [CrossRef]
10. H. Yim, H. Oh, S. Kim, B. Bae, and H. Lim, “An ATSC 3.0-based scheduling and signaling system for hybrid broadcasting services,” in 2016 IEEE Int. Symp. Broadband Multimed. Sys. Broadcast. (BMSB), Nara, Japan, 2016, pp. 1–2. [Google Scholar]
11. S. Lee, J. Paik, and H. Dan, “Design and implementation of intelligent IP switch with packet FEC for ensuring reliability of ATSC 3.0 broadcast streams,” J. Internet Comput. Serv., vol. 20, no. 2, pp. 21–27, 2019. [Google Scholar]
12. B. G. Jo and D. S. Han, “Characteristics of UHDTV transmission technology and MIMO technology,” Society of Broadcast Engineering, vol. 2, no. 18, pp. 174–180, 2013. [Google Scholar]
13. S. I. Park, S. H. Kyun, B. H. Lee, and H. J. Lim, “ATSC 3.0-based UHD broadcasting technology trend,” Broadcast. Techno. Mag., pp. 48–55, 2021. [Google Scholar]
14. J. Kang, D. Kang, and K. Kim, “Method of DASH segments into a MMTP stream for switching contents under a hybrid broadcasting environment,” KSII Trans. Internet Inf. Syst., vol. 11, no. 12, pp. 5981–5997, 2017. [Google Scholar]
15. “ATSC Standard: Link-Layer Protocol (A/330)”, ATSC, 2023. [Online]. Available: https://www.atsc.org (accessed on 01/01/2024). [Google Scholar]
16. ST 2022-1:2007, “Forward error correction for real-time video/audio transport over IP networks,” 2007. [Online]. Available: https://www.smpte.org (accessed on 01/01/2024). [Google Scholar]
17. S. C. Kim, B. M. Lim, H. M. Kim, and G. S. Shin, “Broadcast gateway technology for ATSC 3.0 single frequency network,” in Proc. Summer Conf. Korean Society Broadcast. Media Eng. Conf., Jeju, Korea, 2017, pp. 137–138. [Google Scholar]
18. ATSC, “Sytem overview,” in ATSC Standard: A/324 Scheduler/Studio to Transmitter Link, 1st ed. Washington DC, USA: ATSC, 2023. [Online]. Available: https://www.atsc.org/atsc-documents/3242018-scheduler-studio-transmitter-link (accessed on 28/03/2023). [Google Scholar]
19. S. H. Jeon and I. S. Kyeong, “ATSC 3.0 transmission technology for building a broadcasting network,” TTA J., vol. 167, pp. 26–33, 2016. [Google Scholar]
20. N. Dimitrakopulos, “UHD 4K end to end broadcast solution over DVB-T2 SFN network using HEVC real time encoding,” Korea Soc. Broadcast Eng. Mag., vol. 19, no. 2, pp. 36–45, 2014. [Google Scholar]
21. A. Fujimoto, H. Tode, and K. Murakami, “Advanced inter/intra-stream FEC method in distributed multi-server network,” Korea Multimed. Soc. Int. Conf., MITA, vol. 2019, pp. 171–174, 2009. [Google Scholar]
22. S. J. Jo and S. H. Gang, “Industrial applications of machine learning (artificial intelligenceindustrial enginerring magazine,” Indust. Eng. Mag., vol. 23, no. 2, pp. 34–38, 2016. [Google Scholar]
23. Y. T. Oh and S. C. Kim, “Comparative experiment of machine learning performance of logistic regression and support vector machines,” in Proc. Symp. Korean Institute Commun. Inf. Sci., Jeju, Korea, 2019, pp. 1403. [Google Scholar]
24. J. Y. Lee, “Big data analysis based on data science,” in Python Big Data Analysis Based on Data Science, 1st ed. Seoul, Korea: Hanbit Academy, 2020, ch. 3, sec. 3, pp. 67–73. [Google Scholar]
25. M. Hasnain, I. Ghani, M. F. Pasha, and S. R. Jeong, “Machine learning methods for trust-based selection of web services,” KSII Trans. Internet Inf. Syst., vol. 16, no. 1, pp. 38–59, 2022. [Google Scholar]
26. D. K. Nam and G. H. Choi, “The identification of emerging technologies of automotive semiconductor,” KSII Trans. Internet Inf. Syst., vol. 17, no. 2, pp. 663–677, 2023. [Google Scholar]
27. Y. M. Jo, J. I. Shin, Y. H. Kim, and J. H. Paik, “Design of abnormal signal analysis techniques for broadcasting communication equipment,” in Proc. Fall Conf. Korea Internet Inf. Society, vol. 21, no. 2, 2022, pp. 67–68. [Google Scholar]
Appendix A. Row data collected from ATSC 3.0 Smart Changer
Cite This Article
 Copyright © 2024 The Author(s). Published by Tech Science Press.
This work is licensed under a Creative Commons Attribution 4.0 International License , which permits unrestricted use, distribution, and reproduction in any medium, provided the original work is properly cited.
 Downloads
 Citation Tools