
 Submit a Paper
 Propose a Special lssue
 Open Access
ARTICLE

Coal/Gangue Volume Estimation with Convolutional Neural Network and Separation Based on Predicted Volume and Weight
1 School of Mechatronic Engineering, China University of Mining and Technology, Xuzhou, 221116, China
2 China National Coal Group Corp., Beijing, 100029, China
3 Information Institute, Ministry of Emergency Management of the China, Beijing, 100029, China
4 School of Mechanical Engineering, Sana’a University, Sana’a, 31220, Yemen
* Corresponding Authors: Murad S. Alfarzaeai. Email: ; Eryi Hu. Email:
(This article belongs to the Special Issue: Advanced Computer Technology for Materials Characterization, Properties Prediction, Design and Discovery)
Computers, Materials & Continua 2024, 79(1), 279-306. https://doi.org/10.32604/cmc.2024.047159
Received 27 October 2023; Accepted 23 January 2024; Issue published 25 April 2024
 View Full Text
 Download PDF
Abstract
In the coal mining industry, the gangue separation phase imposes a key challenge due to the high visual similarity between coal and gangue. Recently, separation methods have become more intelligent and efficient, using new technologies and applying different features for recognition. One such method exploits the difference in substance density, leading to excellent coal/gangue recognition. Therefore, this study uses density differences to distinguish coal from gangue by performing volume prediction on the samples. Our training samples maintain a record of 3-side images as input, volume, and weight as the ground truth for the classification. The prediction process relies on a Convolutional neural network (CGVP-CNN) model that receives an input of a 3-side image and then extracts the needed features to estimate an approximation for the volume. The classification was comparatively performed via ten different classifiers, namely, K-Nearest Neighbors (KNN), Linear Support Vector Machines (Linear SVM), Radial Basis Function (RBF) SVM, Gaussian Process, Decision Tree, Random Forest, Multi-Layer Perceptron (MLP), Adaptive Boosting (AdaBosst), Naive Bayes, and Quadratic Discriminant Analysis (QDA). After several experiments on testing and training data, results yield a classification accuracy of 100%, 92%, 95%, 96%, 100%, 100%, 100%, 96%, 81%, and 92%, respectively. The test reveals the best timing with KNN, which maintained an accuracy level of 100%. Assessing the model generalization capability to new data is essential to ensure the efficiency of the model, so by applying a cross-validation experiment, the model generalization was measured. The used dataset was isolated based on the volume values to ensure the model generalization not only on new images of the same volume but with a volume outside the trained range. Then, the predicted volume values were passed to the classifiers group, where classification reported accuracy was found to be (100%, 100%, 100%, 98%, 88%, 87%, 100%, 87%, 97%, 100%), respectively. Although obtaining a classification with high accuracy is the main motive, this work has a remarkable reduction in the data preprocessing time compared to related works. The CGVP-CNN model managed to reduce the data preprocessing time of previous works to 0.017 s while maintaining high classification accuracy using the estimated volume value.Keywords
Energy in our life is essential since most life aspects now run on energy, and coal is considered one of the essential sources, which derives this importance as one of the oldest and most widely used energy sources compared to other sources [1]. Although the coal mining industry is vital for economies, it has a negative impact on the environment that comes from mining methods and technologies. The production process goes through several steps; one is separating coal and gangue, which plays an important role in improving production quality, saving energy, reducing consumption, and minimizing environmental hazards [2–6]. Separation methods diversify from manual separation, which is time-consuming and adversely impacts workers’ health, to mechanical processes that lead to environmental hazards [2,7,8]. Through time, computer vision technologies and artificial intelligence (AI) methods merged with the separation methods to gain the advantages of both manual and mechanical techniques and reduce the disadvantages, forming a new separation technique [2,6].
Applying artificial intelligence and computer vision to the coal mining field greatly improved production efficiency and production quality [5,6,9,10], providing useful equipment and tools that proved the great benefits of using this technology [11]. In the matter of the coal gangue separation task, several methods that utilize computer vision with different approaches of AI have been introduced either by applying feature extraction to recognize the visual features of coal and gangue [7,9,10,12–14] and performing the separation based on the differences on these features [2,15–19]. During the development of coal and gangue separation systems, analyzing their characteristics has led to various implementation directions. Few separation systems use image processing techniques to extract geometric texture features from images to classify Coal/Gangue. References [7,19–21] or using a neural network [13,22–27]. Progress has been made in this area through various efforts, and promising outcomes exist. In the study of Li et al. [28], the Least-square support-vector machine (LS-SVM) was utilized to classify coal/gangue in grayscale images and texture features where they used around 500 images of samples collected from two different mines. Their approach yielded a recognition accuracy of around 98.7%, 96.6%, 98.6%, and 96.6%. Liu et al. [29] have developed an enhanced You Only Look Once (YOLOv4) algorithm for coal gangue classification. Their experiment achieved a good accuracy rate of approximately 94% and a recall rate of around 96%. Despite the high accuracy of these approaches, many of these methods encounter significant challenges, including the resemblance in visual appearance of the different classes, variations in source leading to the different visual appearance of the same class samples, dust cover samples leading to misclassify, and fluctuations in the intensity of light because of the harsh mining environment [2,30,31], all these factors reflect on the texture features extraction make it difficult and unstable. In a study by Hu et al. [32], the impact of environmental factors on the classification of coal and gangue in ordinary images was analyzed. They proposed a classification method that uses multispectral imaging technology, which is less affected by those factors. By combining a General Scaled SVM (GS-SVM) classifier with the Local Binary Pattern (LBP) feature extraction, they achieved an accuracy of 96.25% (77/80). Other researchers have also explored different approaches to eliminate the shortcomings of using the texture features that hinder the classification, such as using heat and infrared (IR) imaging as the basis of computer vision, resulting in promising outcomes [2,30]. Xu et al. [16] focused on the thermal emissions and behavior of mineral coal gangues at varying temperatures and applied the test to two types of coal gangue. The Kaolinite-Type and Illite-Type coal gangues were subjected to heating treatment and analyzed using thermal analysis, infrared spectroscopy (IR), scanning electron microscopy (SEM), and X-ray diffraction (XRD). The experiment shows promising benefits of utilizing thermal emissions for separating coal gangues. Furthermore, in the studies [2,30], experiments on using thermal imagining to trace the differences between coal and gangue and to overcome the limitations due to the environmental factors and mining harsh conditions, Eshaq et al. [30] proposed utilization of the IR imaging and studied the effect of heat emissions in coal gangue recognition by extracting specific features which pass into SVM model to perform the classification, results came with 97.83% by using Gaussian-SVM. Later, Alfarzaeai et al. [2] presented a convolutional neural network model called (CGR-CNN) that uses IR imaging to perform feature extraction that leads to classification and reduces the consumed time by the image processing steps; results came out with 97.75% accuracy. These studies clearly show that thermal images provide immunity against challenges in the coal mining environment, such as lighting intensity, visual appearance similarities, dusty environment, and source heterogeneity. However, using thermal images requires a heating process, which is not always feasible except in a few industrial plants, such as big steel factories and power stations [2,30].
So far, we have outlined the significance of the problem, the factors that make it essential, and how those factors led to the development of new solutions that incorporated innovative elements, resulting in a more precise and practical approach to resolving the problem. However, most of the old methods relied on density differences as the basis for the classification. Density can be derived from the volume and the weight of the objects, where, in this case, the weight is easy to measure in production lines. Estimating the volume using computer vision is the main obstacle in this method. Although other decisive factors can be utilized for the recognition of coal and gangue, the density factor could be one of the most accurate factors in this matter, yet estimating objects’ volume using computer vision is, to some extent, problematic. In the matter of estimating objects’ volume using computer vision and AI methods, the shape of an object is an essential factor in determining the methods of volume estimation, whereas in those with regular geometric shapes such as cubic, cylinder, or spherical, the possibility of calculating the volume based on extracting the effective dimensions is high, several works have been done mostly in the food industries where most of the products have regular shapes making the volume estimation easier, such as Eggs [33], Abalone [34], Been seeds, Zlota Saxa seeds, yellow Lupine seeds, Juno seeds [35], Cherry Tomatoes [36], and size of Ham [37], but the process becomes more difficult with irregular shapes like the coal and gangue. Several attempts to utilize the density factor with the coal gangue classification task have been made. Zhang et al. [18] proposed an approach to classify coal and gangue by measuring their density using a device that employs a Laser beam with a charge-coupled device camera (CCD-camera) to perform triangulation equations and measure the volume and weight of the samples during their movement in the production line. The experiment results show good abilities in identifying coal/gangue with a size larger than 10 cm3, with a performance accuracy of around 60%. Wang et al. [17] once again used the triangulation method but with a three-dimensional (3D) laser scanning technology to estimate the volume and with the weight generated by Weight On Motion (WOM) technology density is driven to classify gangue and coal, but no results were presented in their paper. Huang et al. [38] developed a volume prediction method for coal/gangue particles, their method is based on the particles’ shape called the Shape Clustering method, the method can automatically identify the coal/gangue particles and build volume models that adapt with different particle shapes, but the method works in the particles level and not working with big size ore shapes. Looking at the physical characters of the elements and pursuing the AI abilities in estimating these characteristics, such as estimating the volume of objects, which open a promising approach to achieving coal gangue classification, Alfarzaeai et al. [15] developed a method with the use of computer vision to estimate coal gangue volume representation through the visual perception of the objects, the experiment done to connect the weight of the sample with a value called Existence Mean value (ExM) value that extracted from three surrounding images taken from three different directions to the sample using image processing function, then based on these two values (sample weight, and ExM) classification task was done using several classifiers to prove the ability and the high accuracy of classification was between 96% and 100% using several classifiers in training experiment and a cross-validation experiment. Although this work provides a good attempt to utilize the density feature in the coal gangue classification, it still has two major limitations. First, the use of image processing to calculate the ExM and this process is considered time-consuming. Secondly, the ExM value is not the actual volume value, and it only represents the visual presence of the sample in the images with no relation to the actual volume provided in the dataset. This limits the use of this feature in other applications, such as predicting production rates.
In light of the various methods that have been reviewed, this paper addressed the limitations in [15] and presents a new convolutional neural network model called (CGVP-CNN) that makes sample volume prediction using the 3-side images as input and the samples’ real volume as the learning base which makes it more related to the real volume value compared to the ExM value, this modification provides a faster technique that manages to reduce the execute time from 0.4 to 0.017 s, with maintaining the accuracy of the classification in the same level with the results of the ExM value, also the prediction error rate in the accepted rate to be used within the prediction of the production rates. The rest of the paper comes in, Section 2, methodology and the development in this work are discussed in more detail, 3-side images dataset description in 2.1, the classification stage described in 2.2, the (CGVP-CNN) model development in 2.3, Section 3 presents the experiment details starting with the experiment platform in 3.1, 3-side images dataset prepration step for (CGVP-CNN) model in 3.2, the evaluation metrics details in 3.3, training of the (CGVP-CNN) model in 3.4, testing the predicted volume with the classifiers group in 3.5, study on the effect of light shadow in 3.6, the cross-validation test in 3.7. Section 4 discusses the results and compares them with the related works and also explains the prediction error effect on the classification results. Finally, Section 5 presents the conclusion.
2 Recognition System Methodology and Development
2.1 Volume Prediction Methodology
Among the different factors that distinguish between coal and gangue density is the most accurate factor due to the physical nature of the different densities where concentrated coal density is between 1.3–1.5 g/cm3, compared to the density of gangue which is between 1.7–1.9 g/cm3 [29], there is almost 0.4 g/cm3 difference in density which represents a good classification factor. The object density can be defined as the ratio of its mass to volume and measures the amount of substance per unit volume, Eq. (1) [7,15]:
Employing computer vision for measuring geometric objects’ volume could be achieved by obtaining the required factors for volume estimation of these geometric shapes. This can be easily done as long as the factor representation appears in the images. But when it comes to predicting the volume of irregular shapes, like coal gangue, using computer vision to achieve that could be a quite challenging task, so seeking a 100% accurate volume measurement will not be possible due to intrinsic difficulties in the irregular shapes. The exception can be given to the use of a few technologies that can cover the whole object’s surface. But with the 0.4 g/cm3 density difference of coal and gangue, this margin of classification gives us the ability to overcome the difficulty of getting 100% accuracy of volume prediction where no need to reach that high accuracy to achieve the classification task, see Figs. 1 and 2, they clearly shows how the differences in the density create a clear margin between the two classes and it is noticeable that the greater the size of the samples the greater the separation margin between them. Moreover, based on the prediction behavior, the prediction model tends to create an error margin to outcome more stable predictions; this error margin could play a helpful factor that drives the sample’s separation with a bigger separation margin.
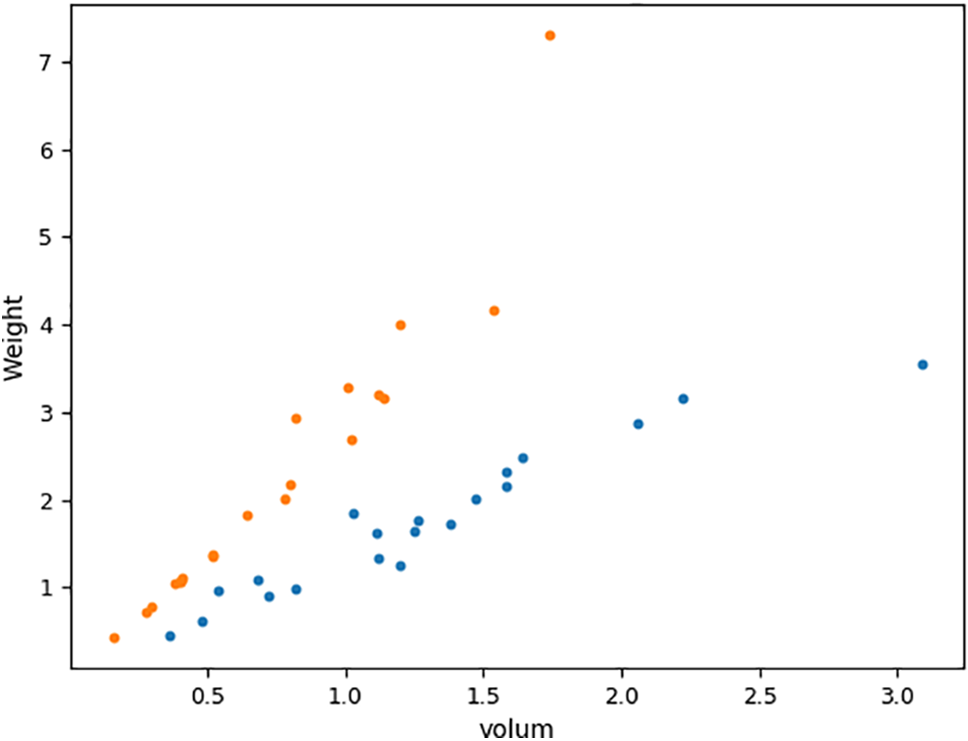
Figure 1: Coal and gangue 40 samples distribution based on real values of volume and weight [15], blue dots refer to coal, and orange dots refer to gangue, where weight unit in kg and volume unit is dm3.
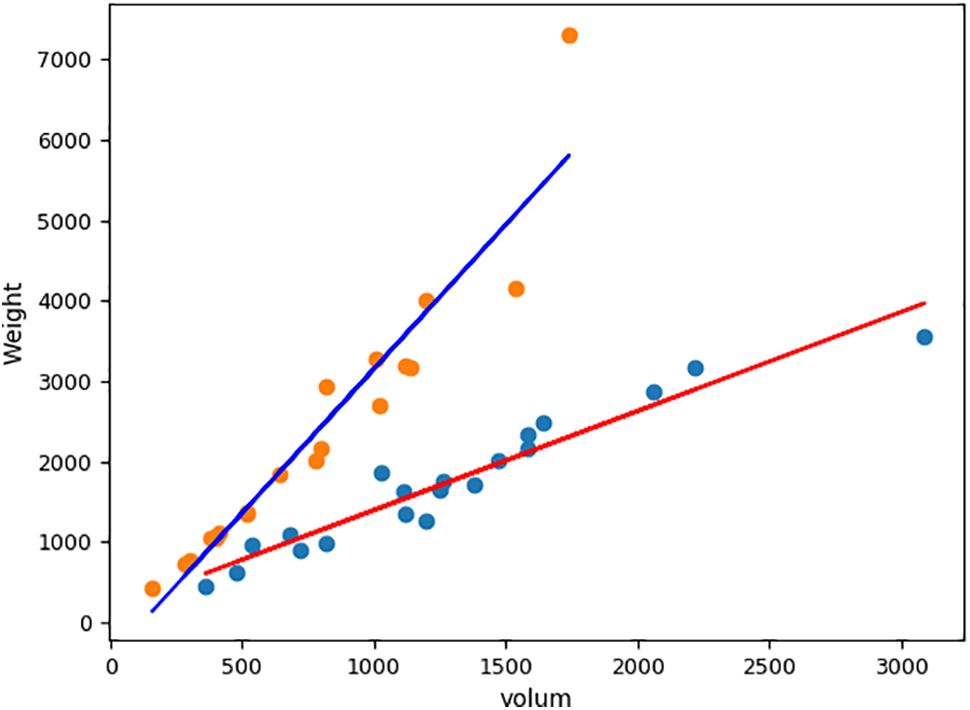
Figure 2: Regression lines plotted using scikit-learn linear model linear regression [39], the red line represents the coal regression, and the blue line represents the gangue regression line, where the weight unit is g and the volume unit is cm3
According to [15], coal gangue is classified based on density principles using an image processing function that receives three surrounding images and calculates the ExM representing the visual volume perception. Using the ExM value and the sample’s weight, classification is conducted with several classifiers, and the study results show the principle to be effective and promising. The ExM calculation method involves detecting objects in the scene, removing small objects to achieve background removal by setting pixels to 255 and counting the pixels smaller than 255 representing the object Existence value (Ex) in each image. Finally, the mean of the three Ex values representing the ExM value is calculated.
The image preprocessing steps during the classification of the samples are time-consuming, reaching 0.4 s for every 3-side image [15], so to reduce the preprocessing time in this paper, a convolutional neural network model (CGVP-CNN), has been developed to estimate the volume and reduce the time of image preprocessing steps in the ExM approach. Fig. 3 illustrates the reduction steps, where in the ExM feature extraction process, the first 4 steps are done through the three images of the 3-side image dataset and no use of the real volume value from the dataset, whereas in the CGVP-CNN only one simple process is applied for the three images to create one 3-side image and label it with the real volume value then pass it to the model where the feature extraction is done and the volume is estimated. Later using the same classifiers group in [15] the results of the estimation model will be tested to compare the accuracy.
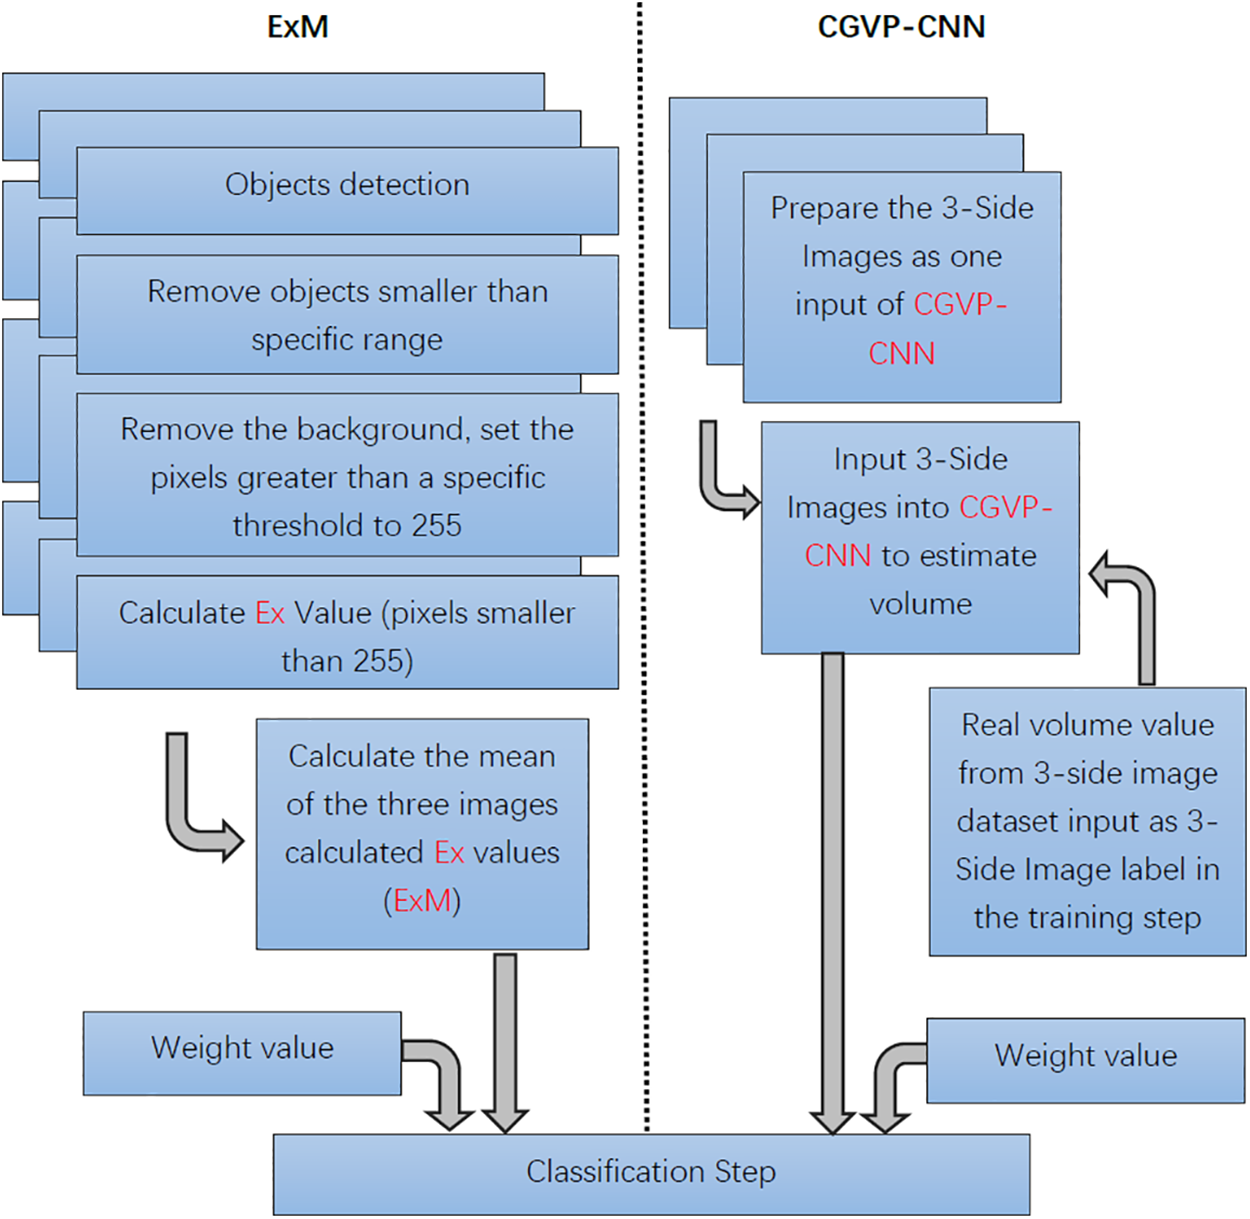
Figure 3: The image processing in ExM steps compared to the CGVP-CNN
2.2 Coal Real Volume and Weight Measurements and the 3-Side Images Dataset
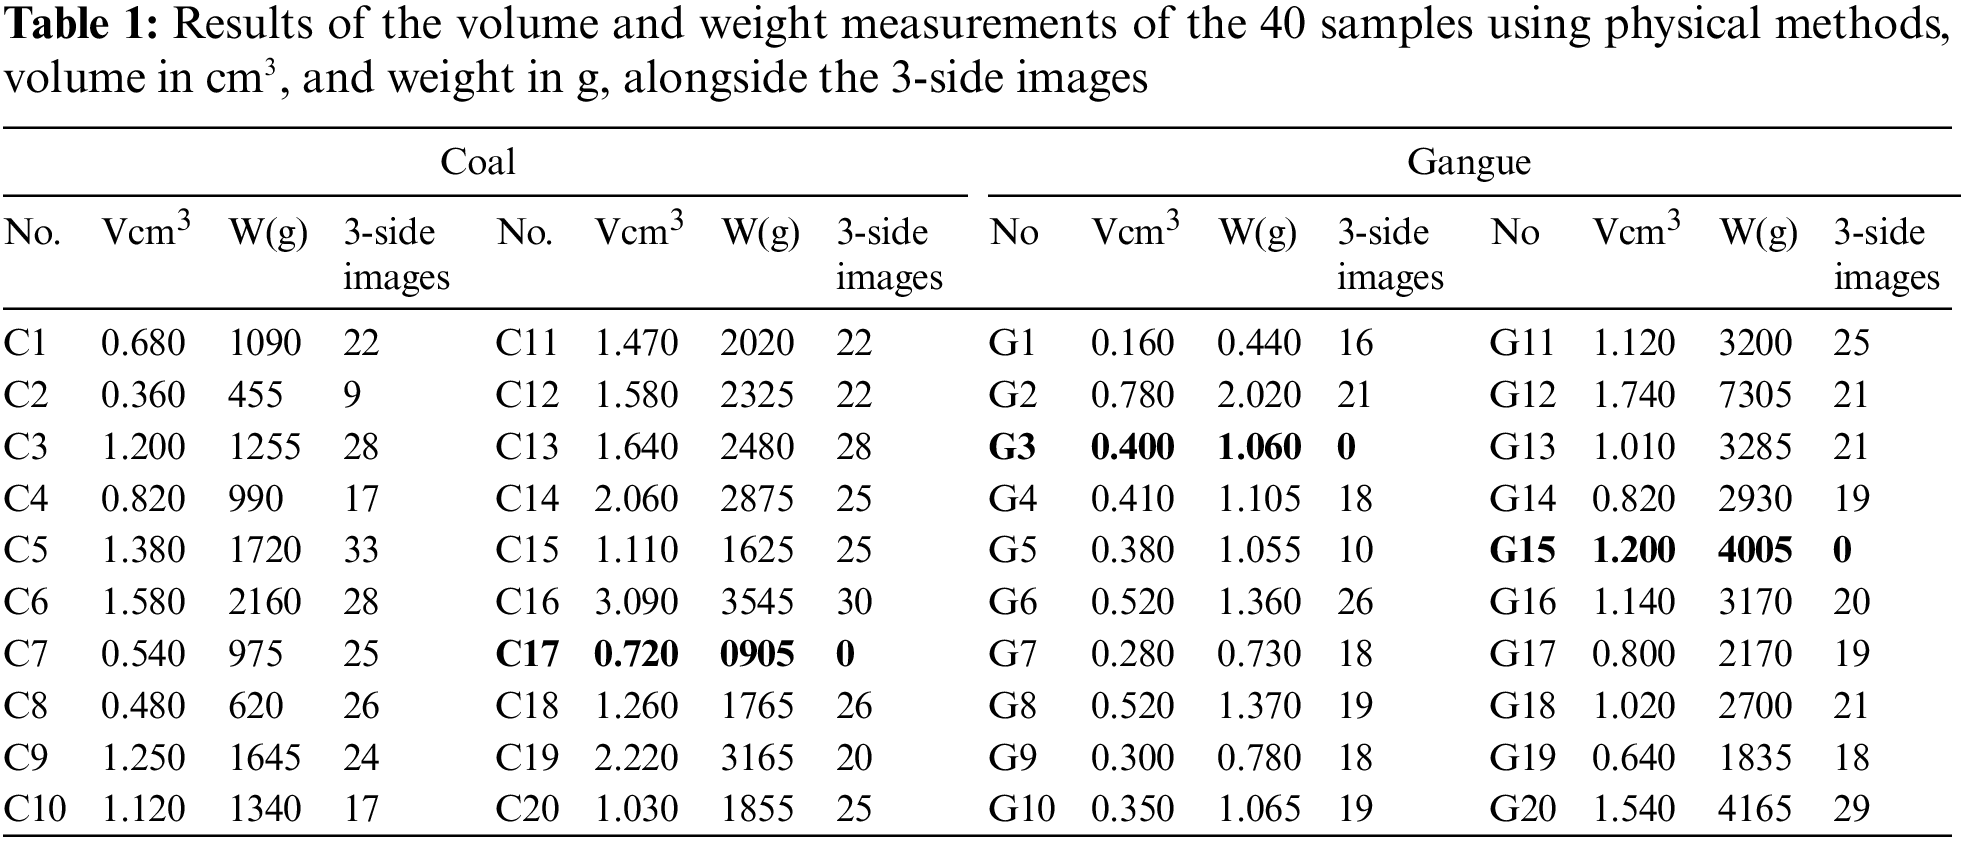
The 3-side images dataset consists of three main parts, images of the sample from three different positions, the sample’s weight, and the sample’s volume. It was created using 20 coal samples and 20 gangue samples gathered from a coal mine in Shanxi, China. The sample images were captured from specific positions that represent the three dimensions x, y, and z of the sample with three cameras, this is done to overcome some cavity problems that could not be seen from two positions [15]. Each sample was subjected to several imaging shots after rotating the sample at the same point several times and flipping the samples on several sides to augment with as many positions as the sample might be in when photographed. During the image capturing the irregular shape of the samples could limit the ability of the different positions of the sample in the capturing stand leading to different numbers of captured images for each sample, such as sample C9 has only 9 positions, also there are three samples C17, G3, and G15, were damaged so they were excluded from the image capturing step. The total number of captured images was 2430 images representing 810 3-side images divided as 451 for coal and 358 for gangue. The second part of the dataset is the weight value of the samples and this is done using an electronic weight scale since the same kind can be integrated with the transportation lines and provide accurate weight measurements such as WOM technology mentioned in [29]. The last part is the sample volume value since this is the main part that needed to be predicted in this work so the sample’s real volume was measured using the physical measurements of water displacement principles, each sample was submerged in a water container with scale, the water level recorded before the submerging and during the submerging to calculate the different in water levels where the different represents the space that the sample occupied in the water leading to the real volume values, Eq. (2) [15]:
where
2.3 Coal Gangue Classification Stage
As Fig. 3 shows the working flowchart and describes the approach differences between the work of this paper and the previous work in [15], where this extraction method in the previous work depends on the image processing approach, and in this work, it depends on deep learning models. However, the final step considers the same classification test using the classifier group test provided by Sklearn library documentation [39], which consists of 10 classifiers (KNN, RBF SVM, Linear SVM, Random Forest, Gaussian Process, Decision Tree, Naive Bayes, Neural Net, AdaBoost, and QDA), this is done to evaluate the results of the prediction model with the same classification test to compare the efficiency of the developed model given classification accuracy and execution time, so the classifiers were used with the same configuration as in [15]. Also, the use of the dataset to train the classifiers was done with the same amount by dividing the dataset into a training group of 70% of the dataset set, and 30% was assigned to the testing group after the CGVP-CNN training finished, the volume value in the dataset is updated with the results of the CGVP-CNN so the input to the classifiers become the estimated volume and the real weight.
2.4 Developing Volume Prediction Model Using Convolutional Neural Network (CGVP-CNN)
The convolutional neural network has been used for classification in several works that have substantiated high efficiency and accuracy, encouraging many researchers to follow the same route. Classification task usually has many classes to choose from. The CNN network was built to select one of these classes with an acceptable learning error; however, in a matter of predicting a regression value, it becomes tougher as learning error affects the expected value, yet this classification value error does not influence choosing the right class. Here, for coal gangue volume prediction, a convolutional neural network model (CGVP-CNN) was designed to perform a regression task to predict coal gangue volume based on three images of the samples captured from three different positions. Each position deals with one dimension, height, length, and width to give the model a better look at the sample and to make the model able to perform real-time work on production lines as well.
CGVP-CNN consists of several layers, The first layer is the input layer which receives the 3-side image with (120, 120, 1) size followed by 3 conv2d layers with (128, 64, 32) kernels followed by activation function (Rectified Linear Unit ReLu), Batch Normalization, and Max Pooling2D (pool_size=(2, 2)), later the output goes through flatten process to be input to Dense_layer (16), activation function (ReLu), Batch Normalization and Dropout (0.5), another Dense_layer (8), activation function (ReLu), Batch Normalization and Dropout (0.5) third Dense_layer (16), activation function (ReLu), and finally, the last Dense_layer (1) representing the regression process and bringing out the predicted volume values, Fig. 4 shows the CGVP-CNN model graph that has generated using the Keras model keras.utils.plot_model function [40], the model graph explains the sequential layer names which express the function of every layer and the input/output shape dimension, the None parameter in the keras model represents the batch number where in this case it is not necessary to be fixed, and finally. The idea of this CNN construction is to build a light model so it becomes more practical in real production lines.
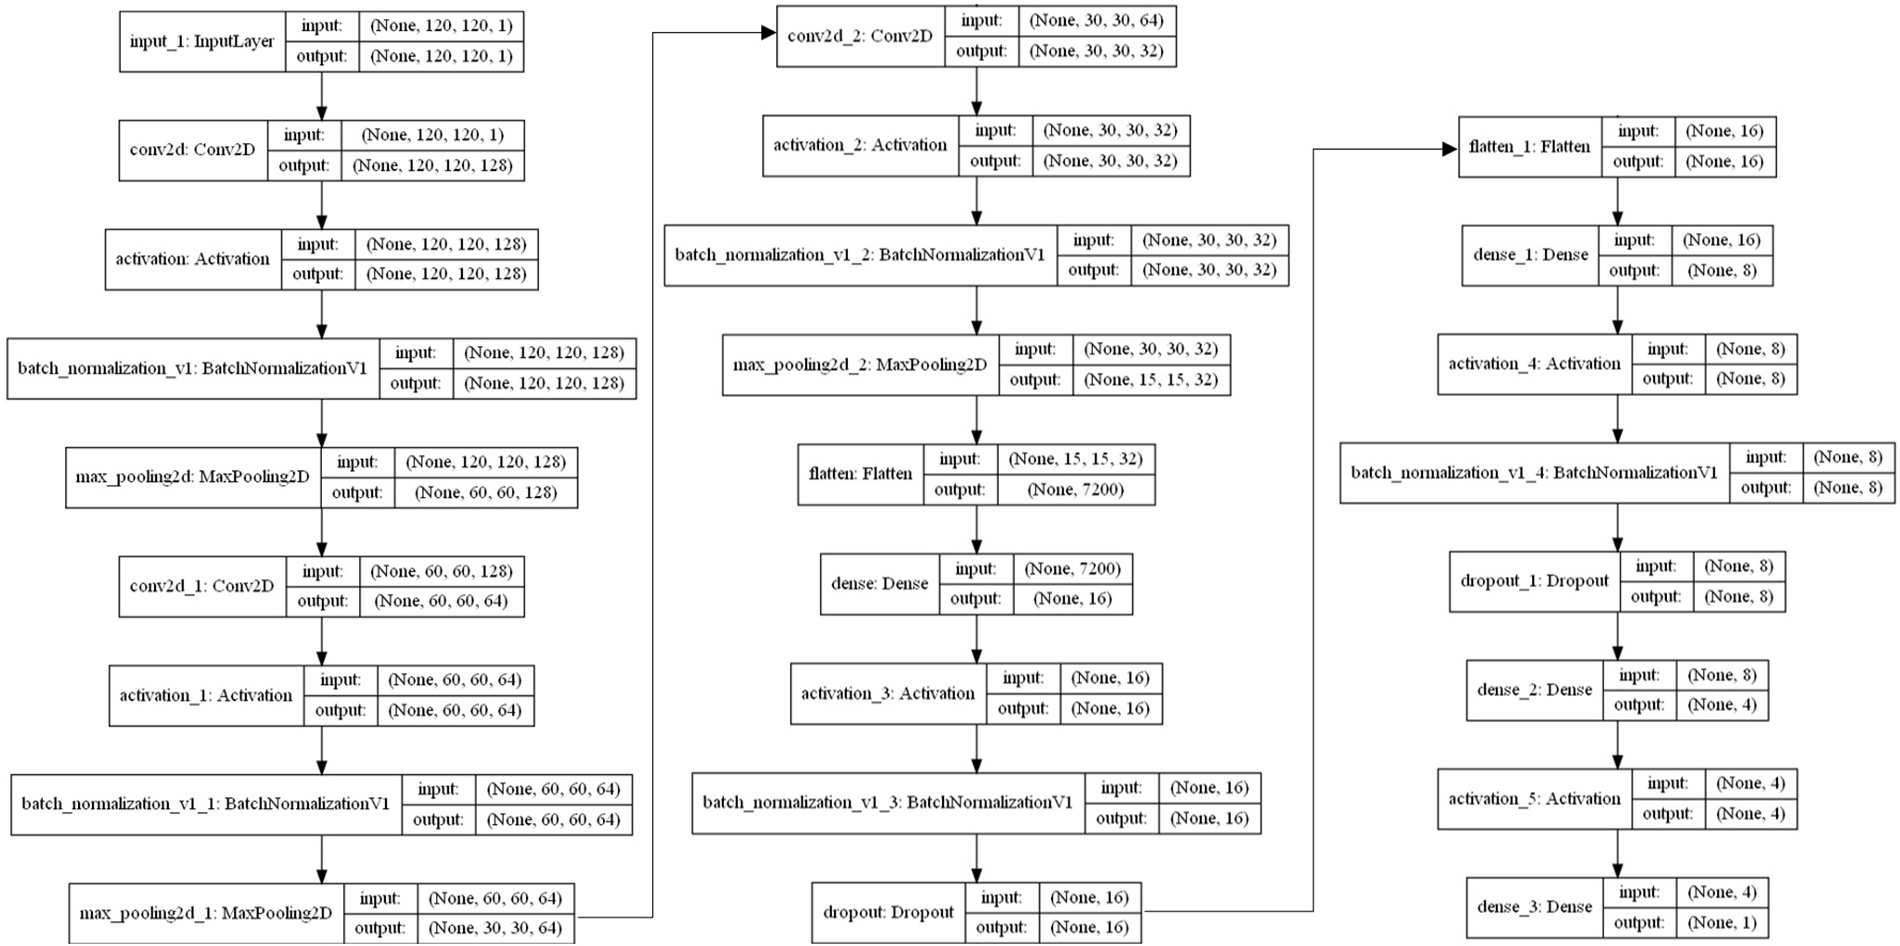
Figure 4: Volume prediction model CGVP-CNN
Note: ‘None’ is to be replaced by the batch size.
The experiments were conducted on a PC featuring CPU A10 PRO-7800B R7,12 Compute Cores 4C + 8 G 3.50 GHz with 4.00 GB RAM and graphic card Nvidia Quadro K 2000 with 2 GB (Graphics Memory 4060 MB, come from a dedicated video memory of 2048 MB GDDR5, and shared system memory of 2012 MB) and the used operating system is Windows 10 Enterprise, with this hardware the volume prediction CGVP-CNN model demonstrates the ability to perform in low resources. For the creation of the 3-side images dataset, a capturing stand prototype that consists of three USB cameras that generate
3.2 Prepration on the 3-Side Image Dataset for the CGVP-CNN Model
The training of the CGVP-CNN model was done by passing the training images that were labeled with the real volume value so that the model connected the volume visual appearance in the 3-side image with the volume value. The process of creating the 3-side images dataset is intended to create several image positions for the same sample this is done for two reasons, first to cover all the possibilities of positioning the samples during the capturing of the 3-side image, second, to give the model as much as possible of different images for the same volume value. Applying this measure, the dataset is augmented to 2430 images in total, and since every 3-side imaging position uses three images, The obtained number of samples are 810 with each sample comprises a set of 3-side images. The dataset contains 451 samples for coal and 358 for gangue. The process of creating every 3-side image using the three images is done with the consideration of reducing the image processing, so the 3-side images go through a simple image processing procedure compared to the preparation procedures in [15] to decrease the image processing time that is considered computationally expensive compared to the neural networks combutational burden. First, the input Red-Green-Blue (RGB) images are converted into Gray Scale images using Eq. (3), and then images go through background isolation by subtracting the object image from the background image taken before placing the object This is to ensure that small black particles that occur during movements of the samples on the board do not affect the isolation process. After that Grayscale image pixels are scanned to increase the differences between the object body and the background using Eq. (4). Finally, three images of samples alongside one background image together construct the 3-side image.
where GP is the one-channel pixel grayscale value of the image, and RGB is the pixel’s three color channel values. This process does not consume the same time as in [15], the calculated average of consumed time per 3-side image is around 0.07 s, which is much less than 0.4 s of image processing consumed time in [15].
Training the CGVP-CNN model needs to be evaluated to measure the improvement in the training and the efficiency of the results, During the training the model uses the loss function and optimization function to control the training and evaluate the results, Mean Absolute Error (MAE) loss function and Adam optimizer are used in the training of the CGVP-CNN model. After the training is finished the model goes to another test where it runs and is evaluated by computing the Absolute Percentage Error (absPercentDiff) of the predicted values, Eq. (5) shows the computation of the absolute percentage error, and Eq. (6) shows the formal of computing the standard deviation (σ) where (μabsPercentDiff) is the Mean Absolute Percentage Error.
where Pv is the predicted value, Rv is the real value, and N is the number of the test values. For the evaluation of the classifiers and based on the evaluation procedure in [15] to evaluate the performance of the classifiers, the authors used the Sklearn-metrics library [39] to generate a classification report. The report displays statices of different metrics calculations to assess the classifiers’ effectiveness. The report presents a comprehensive performance evaluation for the classifiers, utilizing various measures such as Accuracy, Recall, Precision, F1-score, Macro Average, and Weighted Average. These evaluation metrics depend on different factors, such as the prediction results and the number of predictions, where In the classification, the result of the prediction could be one of four cases, two cases of true prediction, first, a true prediction of a positive result of the class True Positive (TP), second true prediction of a negative result of the class True Negative (TN), the other two cases are for the negative prediction which are False prediction of Positive result of the class False Positive (FP), and False prediction of Negative result of the class False Negative (FN). The support represents how many samples each class has in the dataset.
The accuracy metric measures how the classifier correctly predicts the classes so it is the ratio of the true predictions whether true positive or true negative to the total number of the predictions, see Eq. (7). While accuracy measures the total number of correct predictions, the precision metric, and recall metric are used to measure the predictions of each class, precision focuses on the proportion of true positive predictions (TP) of the class to the total class classifications, whether positive predictions (TP) or false positives (FP) so it represents how many true predictions among the total positive predictions of the classifier regardless wither this prediction is right or wrong, this is represented by Eq. (8). On the other hand, Recall looks in the positive predictions of the class and the samples that misclassified as negative, so it measures true predictions (TP) of the class to the actual true positive predcitions class that suppose to be since some of true samples misclassified as negative where they should be classified as true positive (TP) or we can say it is the ratio of the true predcition to the total number of the class samples (TP + FN), see Eq. (9).
Now F1-score metric measures how accurate the prediction is at the class-wise level by combining the Recall and Precision values, so it symmetrically represents the two metrics together in one metric and is driven by the Eq. (10). The next metric utilizes the average of the three previous matrices of precision value, recall value, and F1-score value as a Macro Average that done by calculating the average of the F1-score of every class in both binary classification cases 0 and 1 then we calculate the F1-score of these two classes, see Eq. (11). The last metric is the Weighted Average which work similar to the macro average but concerning the weight support of each class, Eq. (12) explains how the average of the values calculated with respect to the weight support of each F1-score and explain the difference between the Macro Average and the Weighted Average.
3.4 Training and Learning of CGVP-CNN
Using the prepared dataset, the training phase starts with a cycle of 500 epochs and a batch size equal to 10, and the Adam optimizer learning rate is set to 0.5 with 1e3/200 of decay. The training is done using the 3-side image by labeling every 3-side image with the real value of the volume to train the CGVP-CNN to predict the volume, the dataset was divided in the base of 70% for training and 30% validation. The training starts with a high learning rate starting with 0.5 to help the model gain more affected weights at the beginning of the training and with time the decay function will reduce the learning rate, this learning rate was the best in this case of coal volume values.
The training loss and validation loss values were recorded for each training epoch to show the training performance. Fig. 5 shows the training loss and validation loss curves during model training. The training curves show stable training to a certain level. For more clarity, looking into the values of the standard deviation helps to measure the spread of the distribution. The results show that the absolute percentage error mean (μabsPercentDiff = 26.91%), and standard deviation around (σ = 23.54%), although these results are considered low, it is acceptable in this case due to some variance of the real values of the same sample which create a range of acceptable values instead of one certain value.
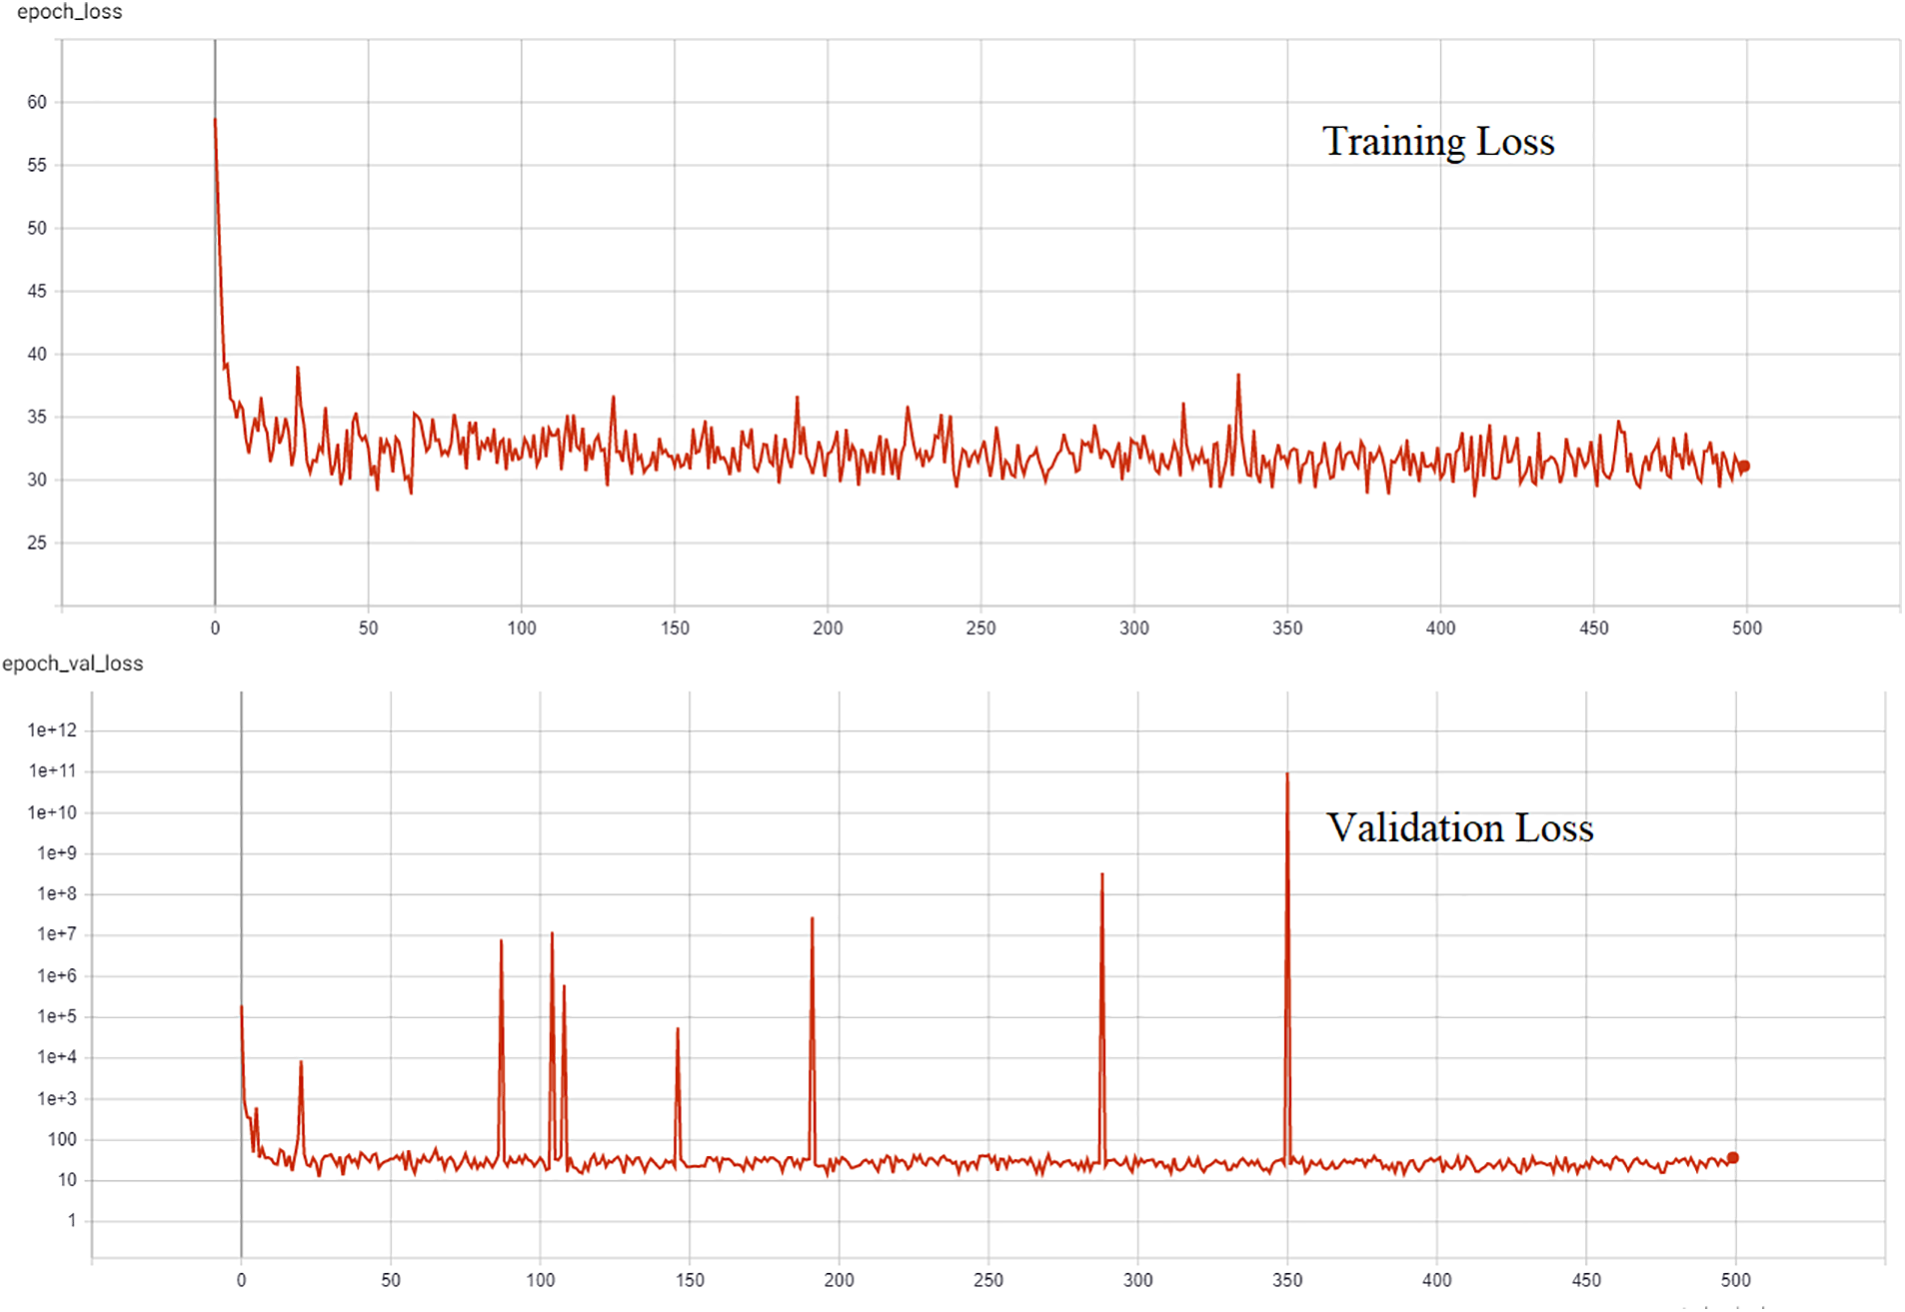
Figure 5: CGVP-CNN training performance
These results are comprehensible due to different environmental factors that affect the image’s volume illusion, such as sample shadows that occur under the samples and can be eliminated with lighting design on the capture stand. However, this error percentage in volume prediction shall not affect coal gangue classification with the classifiers, as error spreads over the two classes equally, not affecting classification that much, also, the model shall get the advantage of the different concentrations of the coal and gangue. On the other hand, we must mention that the experiment was conducted using low-quality photographic cameras to place the experiment within the lowest level of the used hardware. Therefore, if higher-quality cameras are used, this will reflect positively on the prediction accuracy.
3.5 Testing CGVP-CNN Prediction Results with the Different Classifiers
After CGVP-CNN training is finished, it is necessary to evaluate the efficiency of the estimated volume values with the classifiers group from [15] by classification accuracy. To do that, first, the 3-side images dataset (the volume value) was updated by the results of the CGVP-CNN, so the new estimated volume and real weight values to be passed into the classifiers groups to perform the classification in this base, similar to the classification process in [15]. Second; the dataset is divided into groups, one for classifiers fitted with the predicted values to perform coal gangue classification, and another for testing to observe the accuracy of the classification task. The prepration of the training dataset is to be 70% of the dataset and 30% for testing. In the first step, the whole dataset of 810 3-side images is used to fit the classifiers by 70% (567 images) and tested with 30% (243 images). Based on the test classifiers, we can conclude that the new values are a good fit and have yielded excellent results. The classification margins of the classifier’s group and the distribution of the two classes of samples are displayed in Fig. 6, it is clear that the coal samples spread in perfect distribution compared to the regression line of the same group in Fig. 2, this gives us high confidence that the model achieves good prediction for this class. Although, the spread of the gangue samples has some variance with the regression line in Fig. 2 to the same group, Yet, they spread on the area over that line to achieve the classification with excellent results.
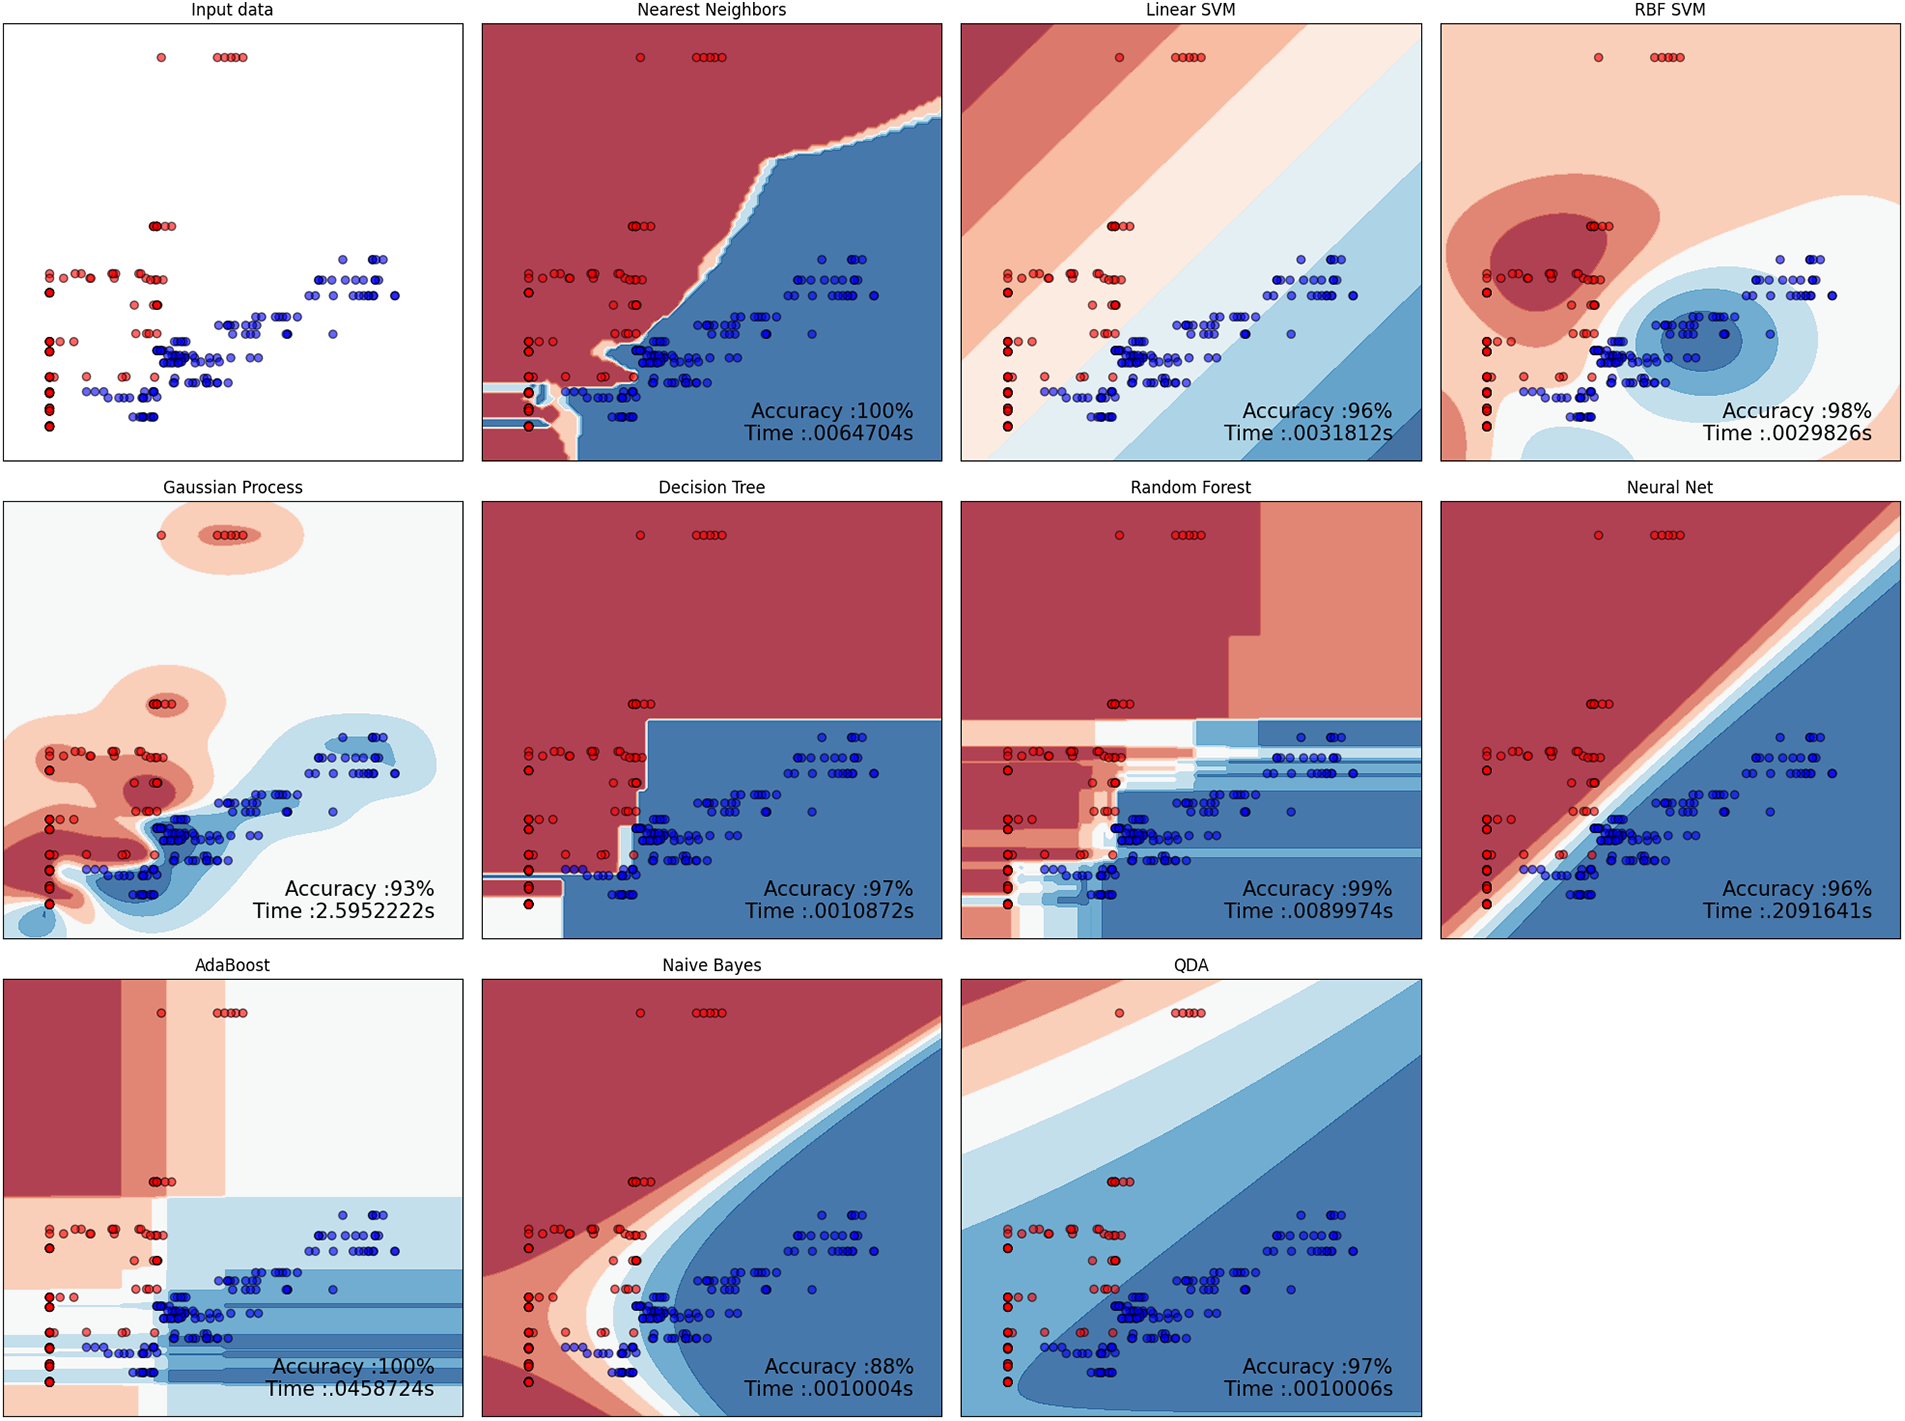
Figure 6: Classifier group classes boundary decisions and classification with CGVP-CNN prediction results, visualization of the samples (gangue in Red and Coal in blue), the accuracy on a scale of (0–100) and time in seconds
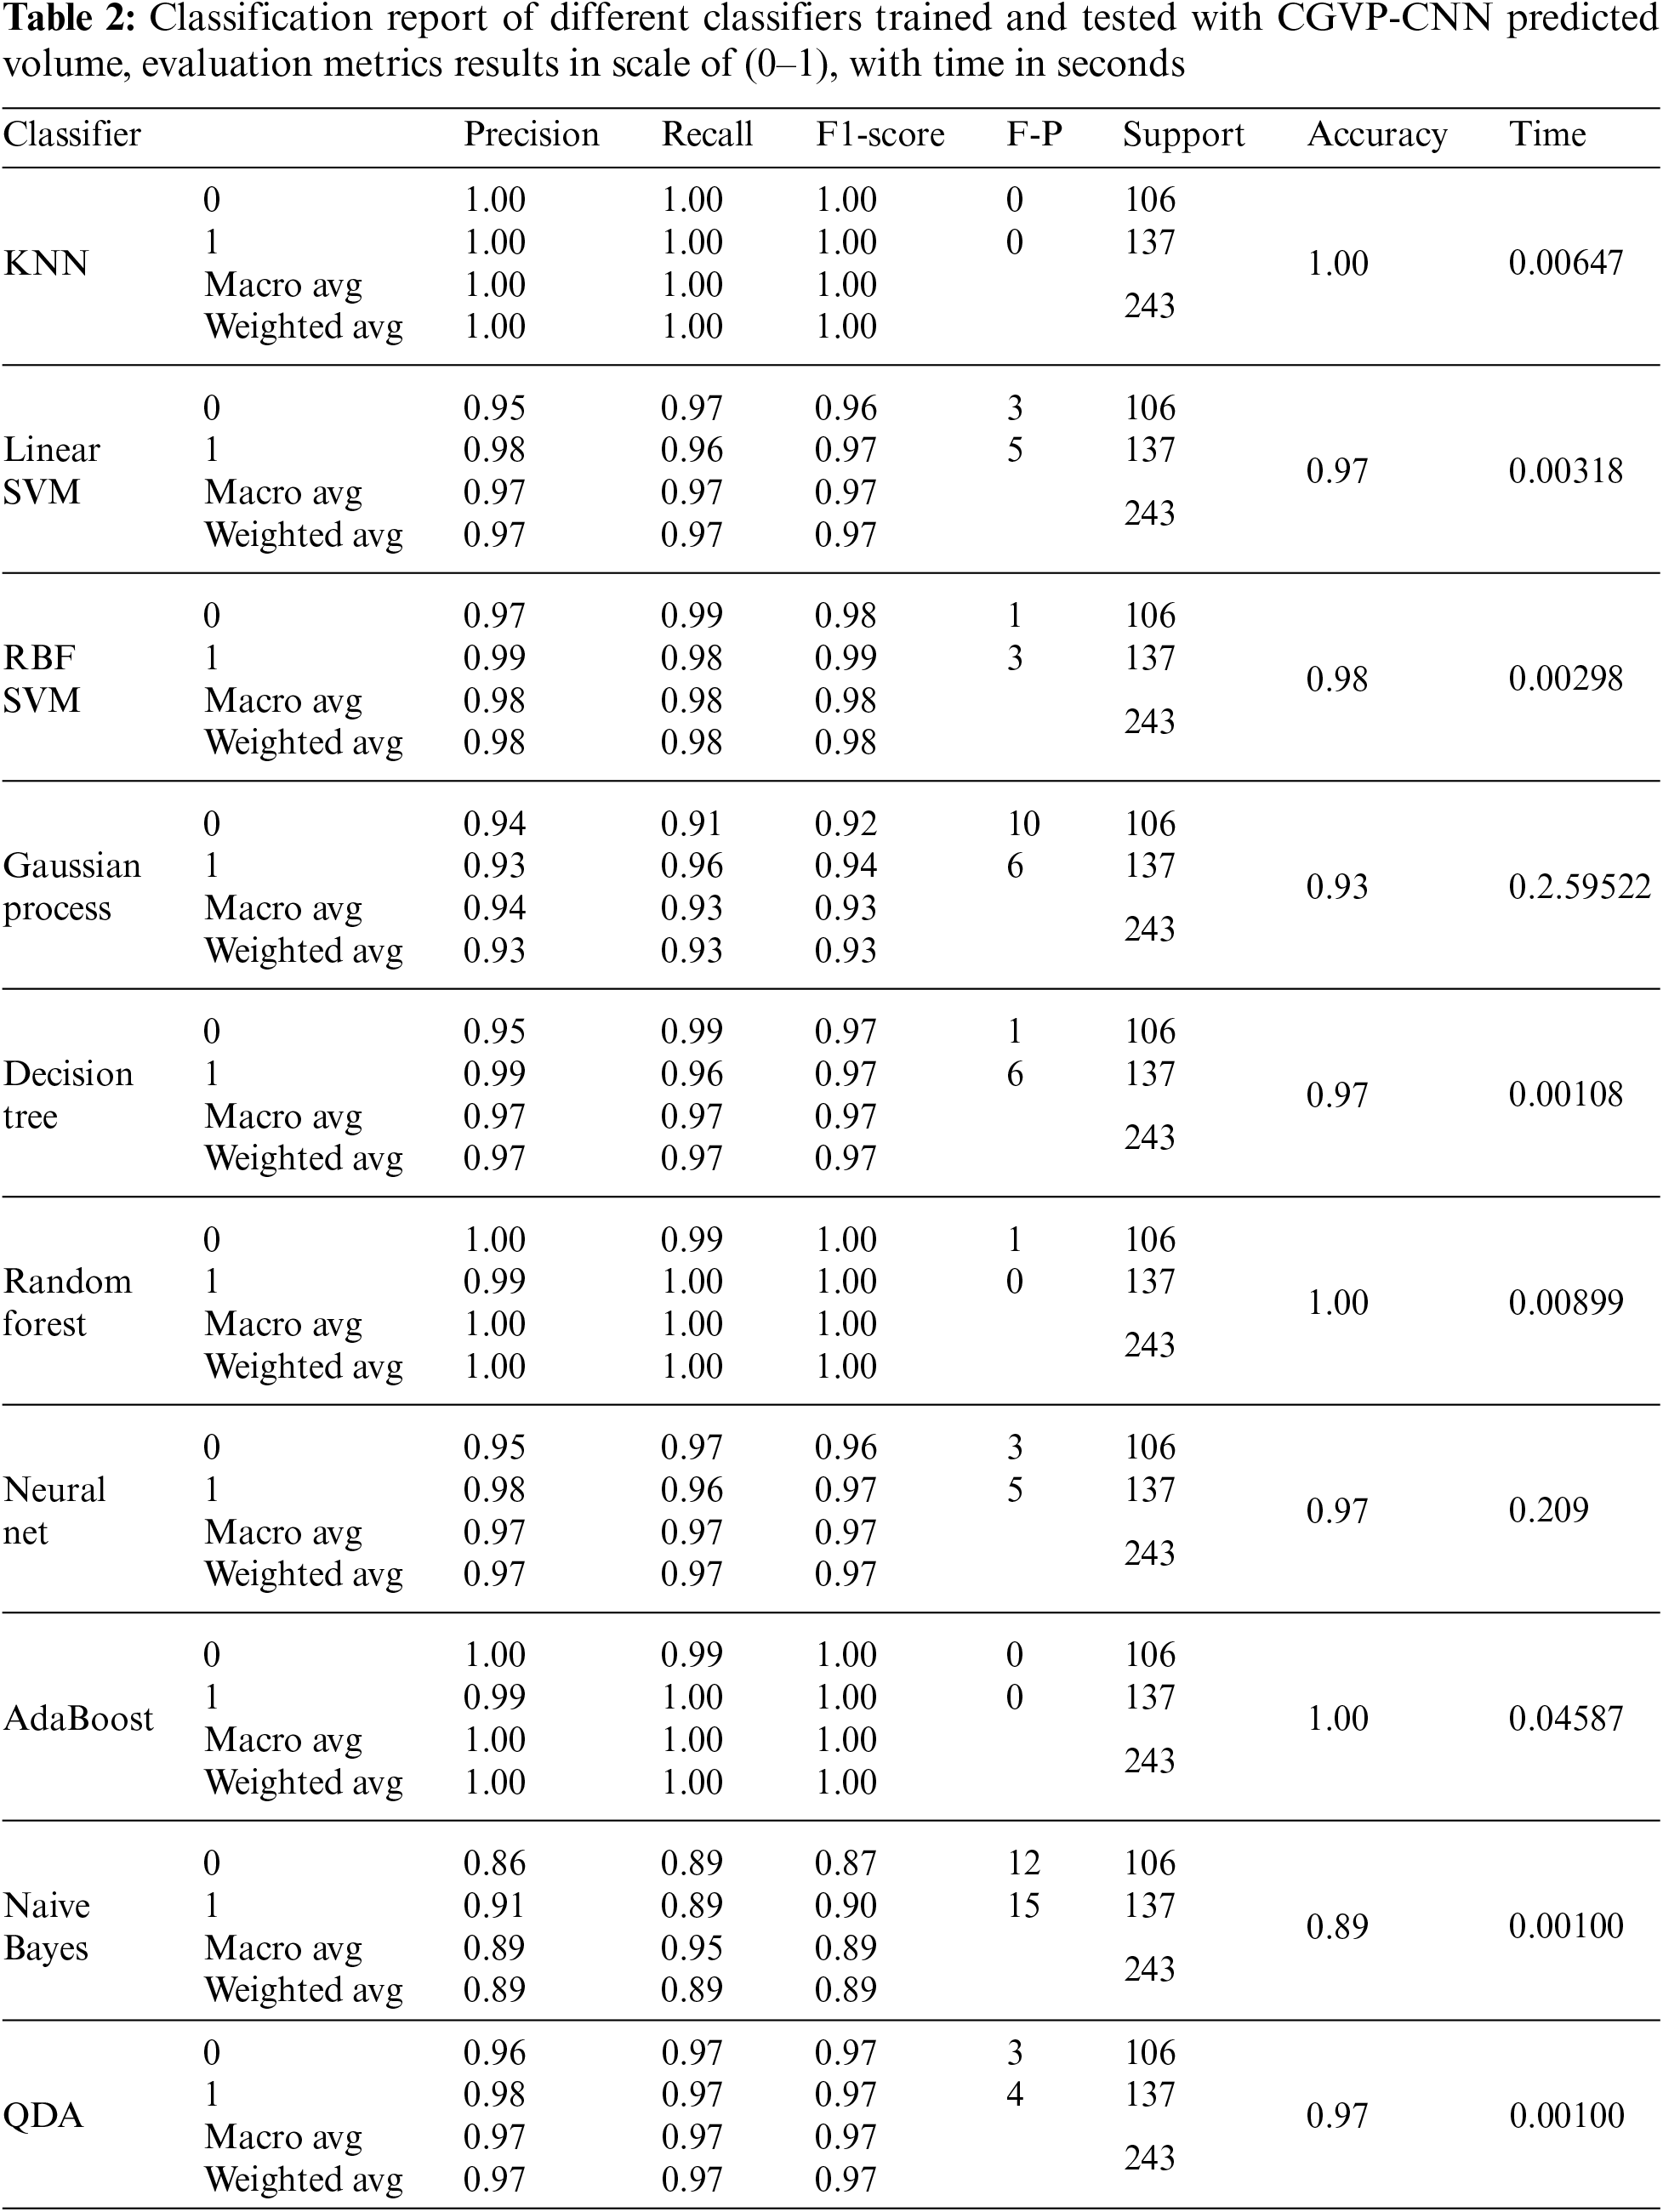
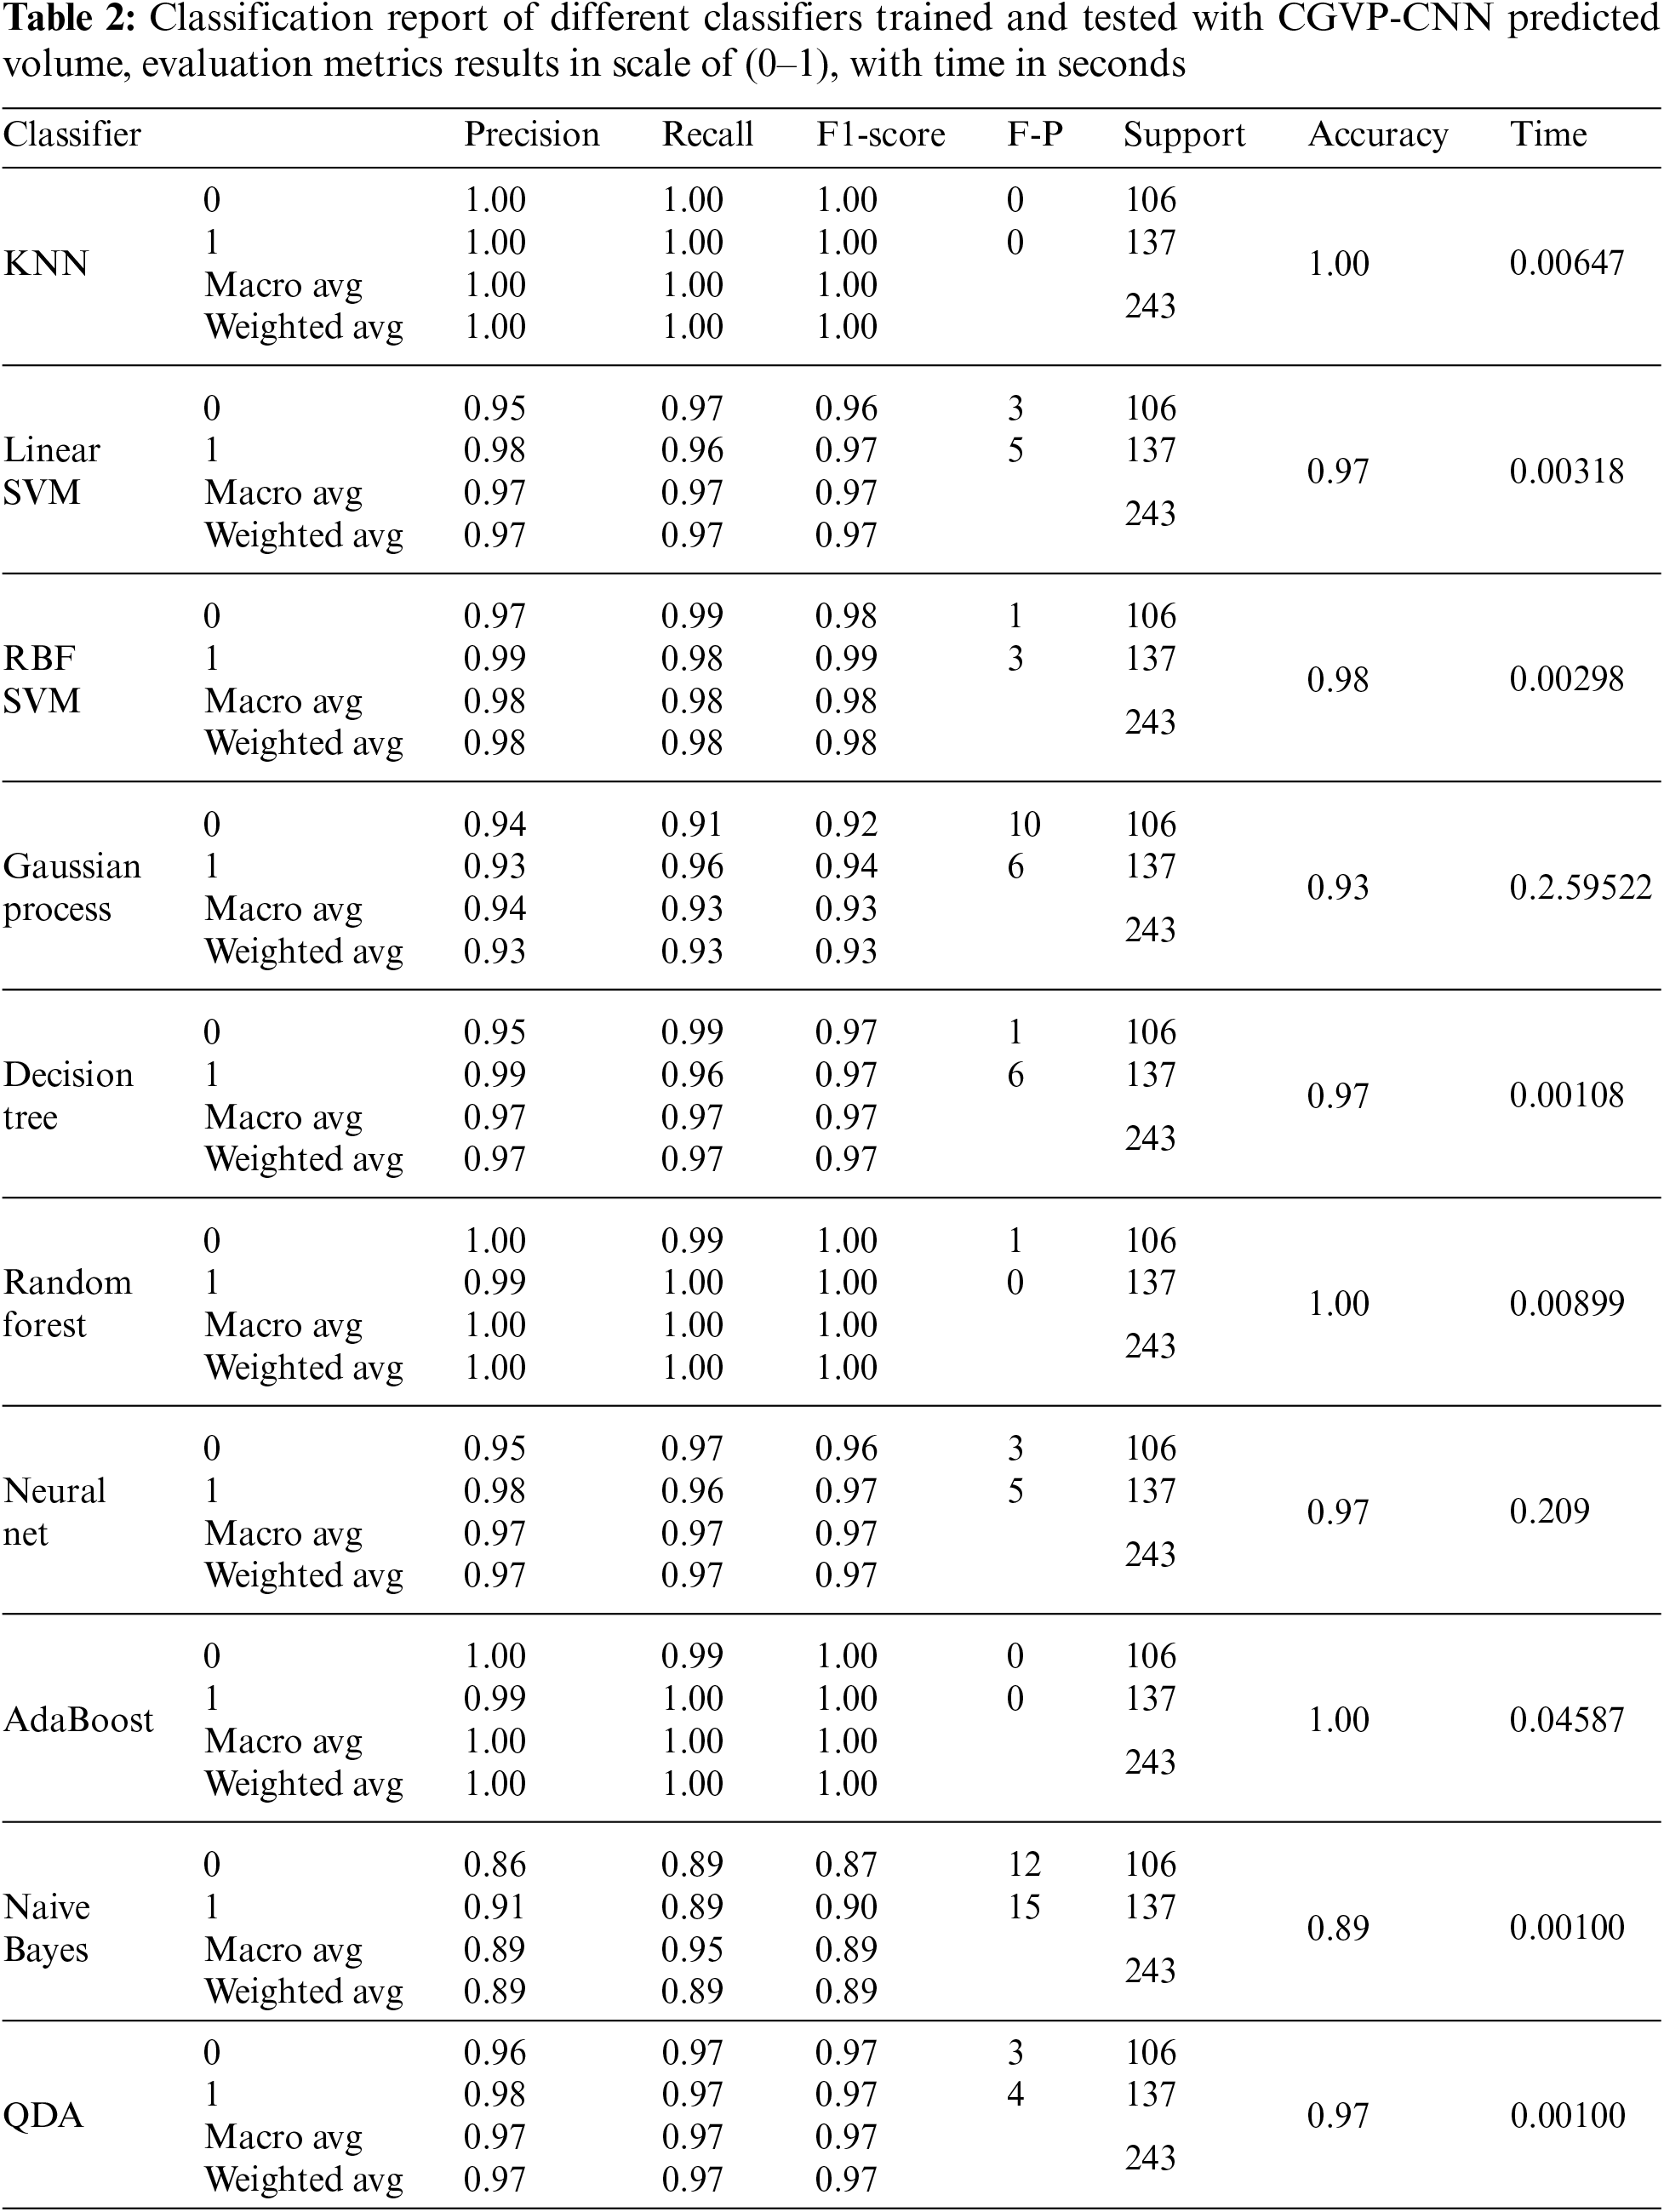
Looking at Table 2, which displays a classification report for the evaluation metrics of the different classifier’s performance while using the predicted volume by CGVP-CNN model, the table presents the statices of the different evaluation metrics for each classifier alongside the support number peer classes and the total, all these factors significantly contribute in evaluating the accuracy of the classification, which comes with the consumed time in the last two columns. It is worth mentioning that the CGVP-CNN predicted values were able to deliver high classification accuracy during both training and testing of the classifiers.
3.6 Effect of Light Shadow Isolation on 3-Side Images
During the collection of the 3-side images, a shadow formed in the area under the sample being photographed, the size of the shadow changes with the differences in the sample’s geometric shapes leading to different interference, so in this test, we track the shadow and do manual removing for 548 3-side images to study the shadow impact on the prediction and clasification accuracy, Fig. 7 shows samples’ top side, left side, front side, and background images after eliminating the shadow and background with the final generated three side image. The 3-side images were processed and trained CGVP-CNN model, The results of training came out with a mean of absolute percentage error equal to 18.73% and a standard deviation of the absolute percentage equal to: 26.39%. Fig. 8 shows training and validation loss curves, where the curves show more stable training, which indicates that the prediction training is more promising in this case.
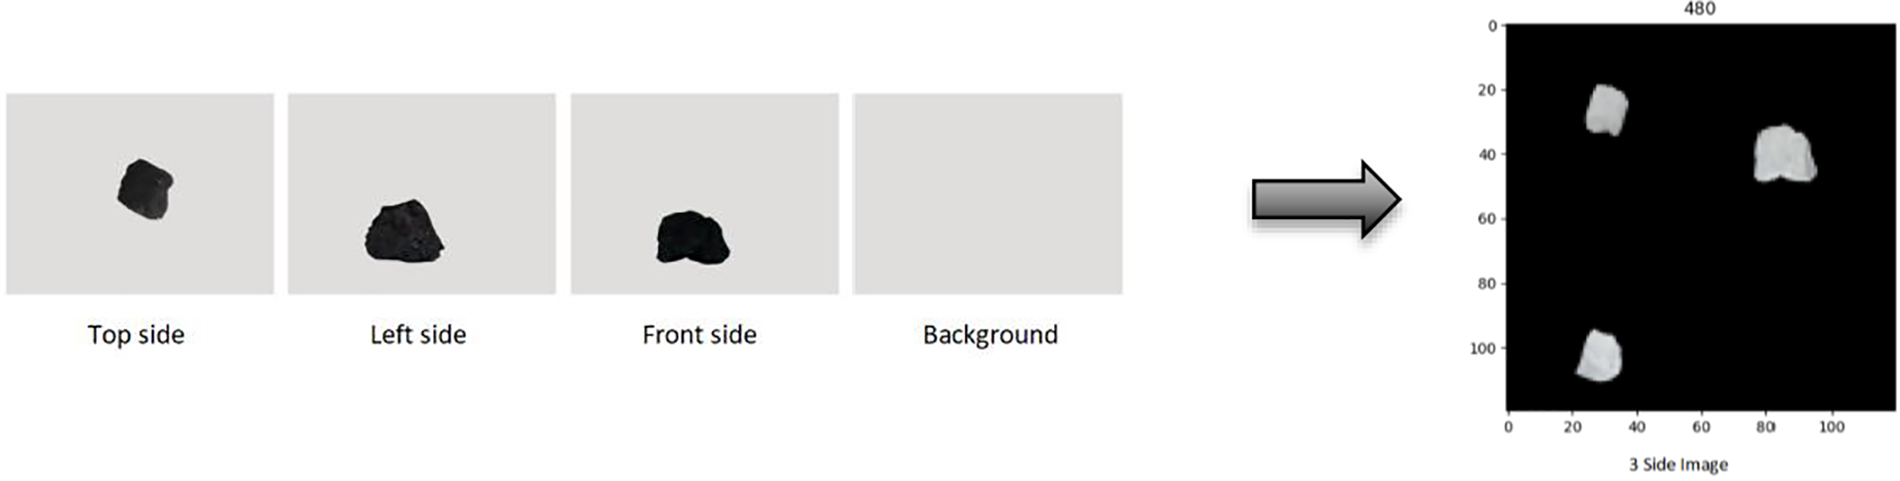
Figure 7: 3-side images after light shadow and background isolation
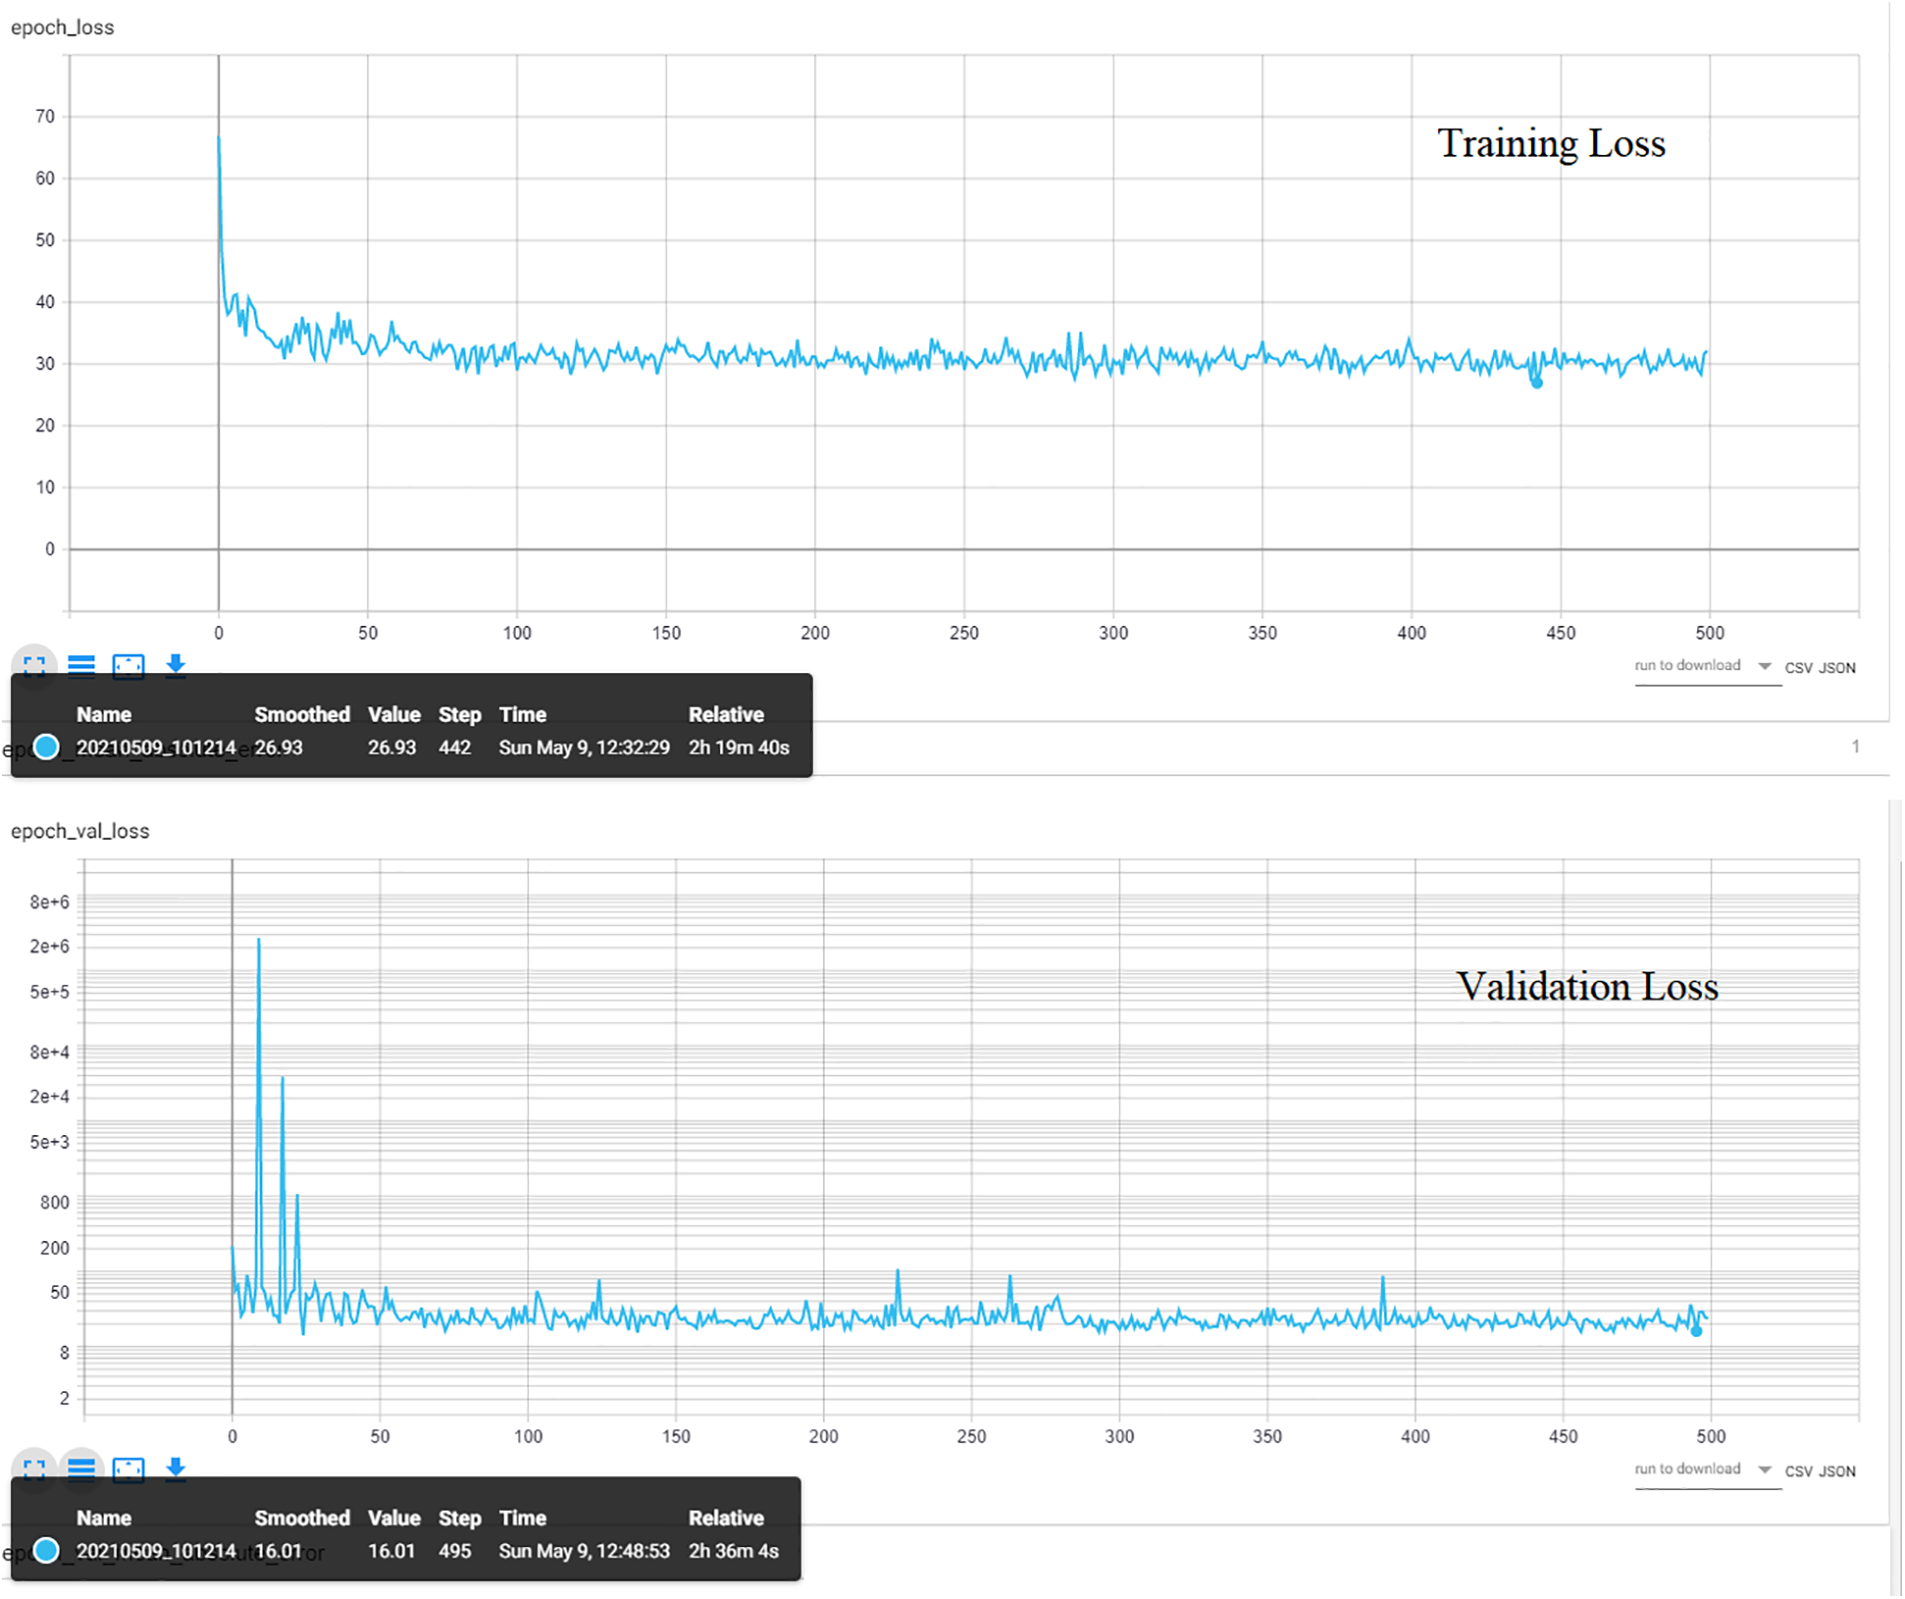
Figure 8: CGVP-CNN training performance with shadow isolation process
The results of the prediction using the shadow-isolated dataset were then passed to the classification process using the same classification procedures, where the data was split into 70% as training data and 30% for testing data, Fig. 9 shows how the prediction of the model affects the spread of the values in a way that increases the separation margin which will improve the classification results as we notice from the 285 results of the classification. Following the same procedure for Gaussian Process, Decision Tree, and Random Forest, all these classifiers show improvement in the classification accuracy within 1%∼3% other classifiers show a decrease in the accuracy such as Quadratic Discriminant Analysis (QDA). Table 3 displays the classification report of the classifiers and Fig. 10 shows the decisions boundary of the classifiers, accuracy and time, it is clear that there is some improvement in the spread of the samples in the two classes which are reflected on the classification results.
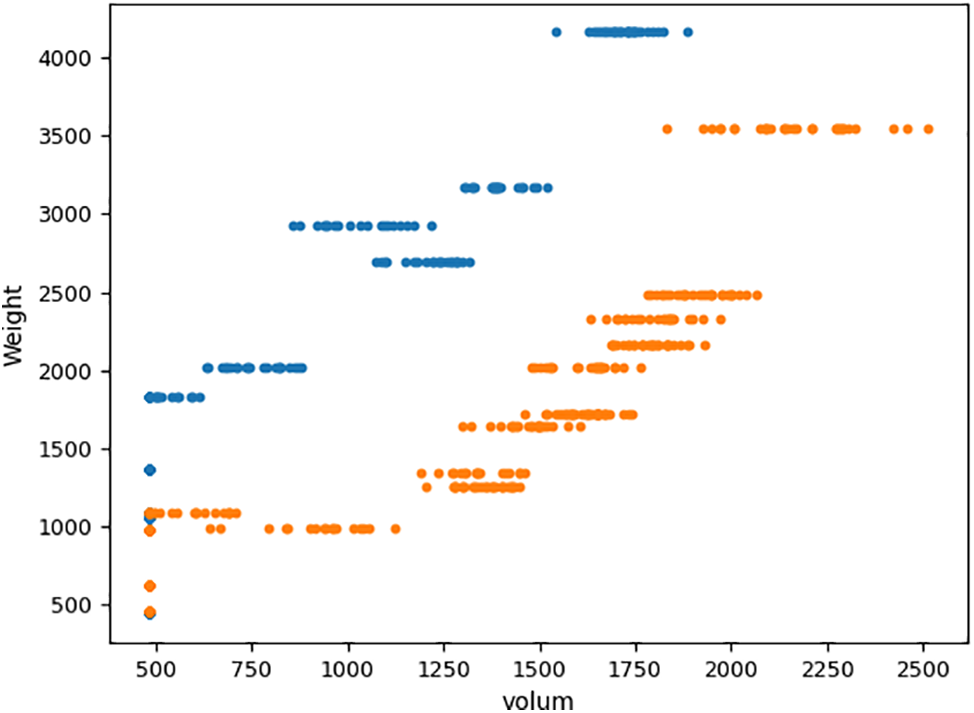
Figure 9: Predicted values spread of the two classes after removing shadow, blue dots represent the coal gangue and orange dots represent the coal
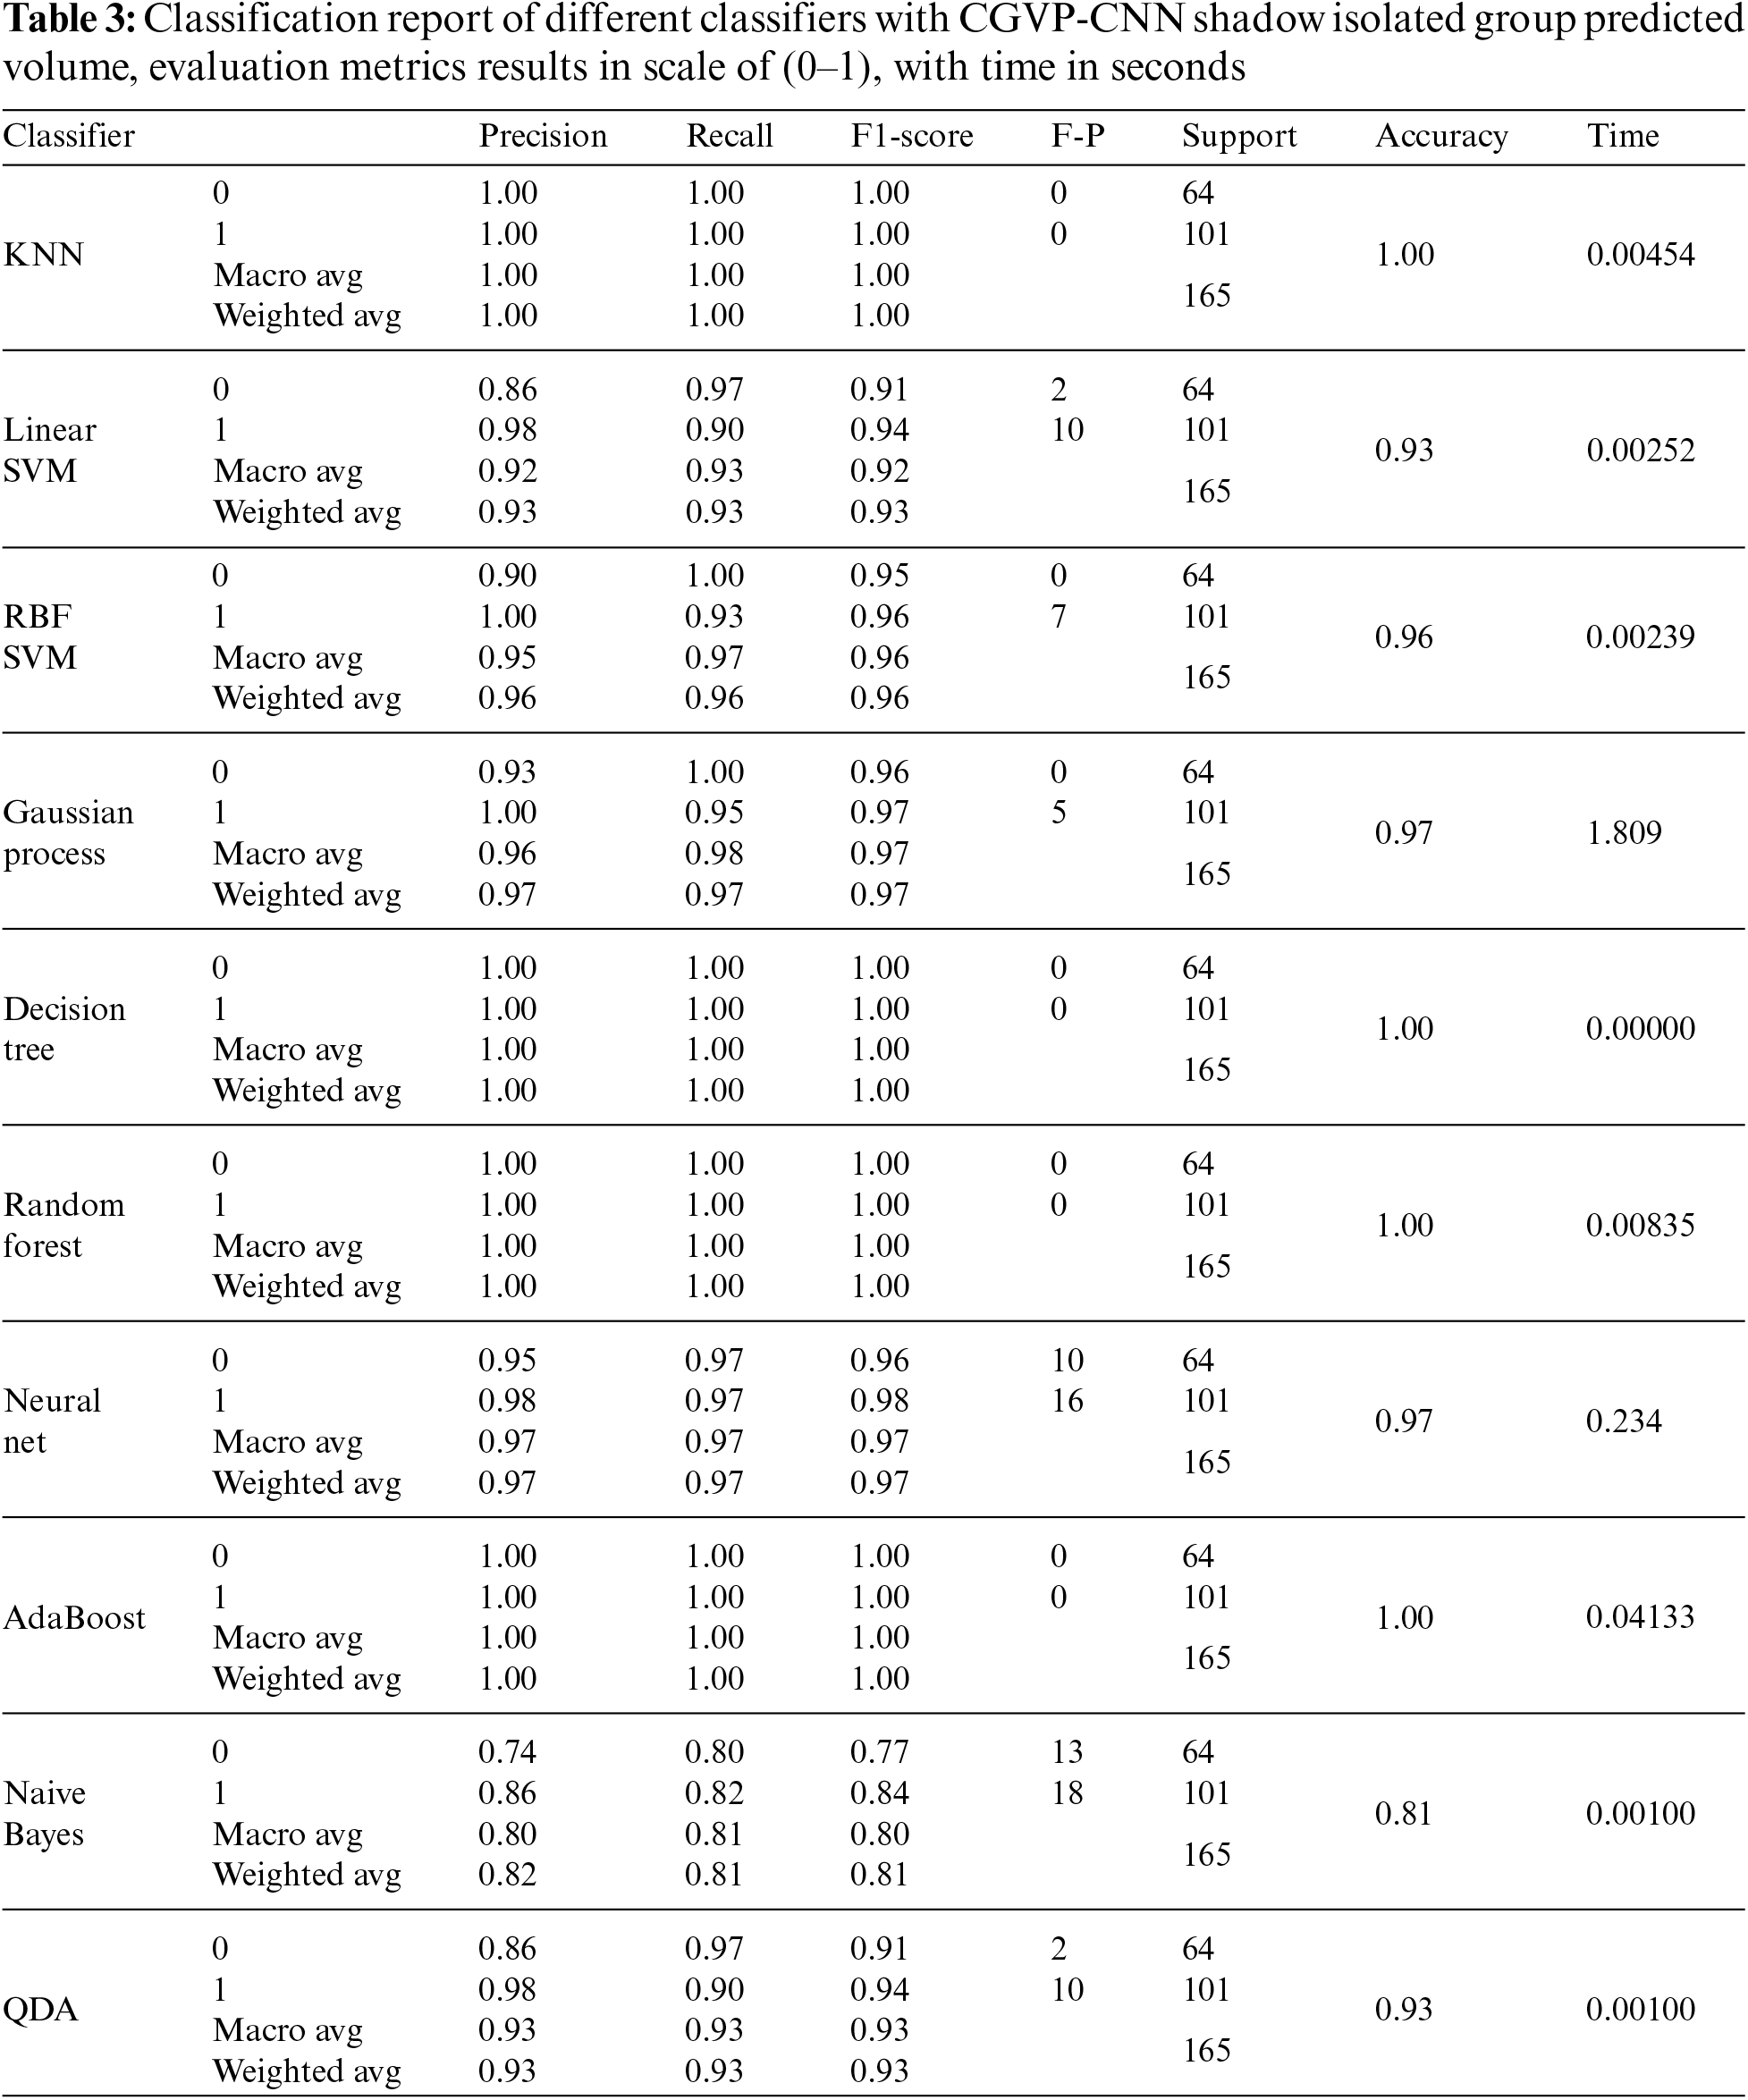
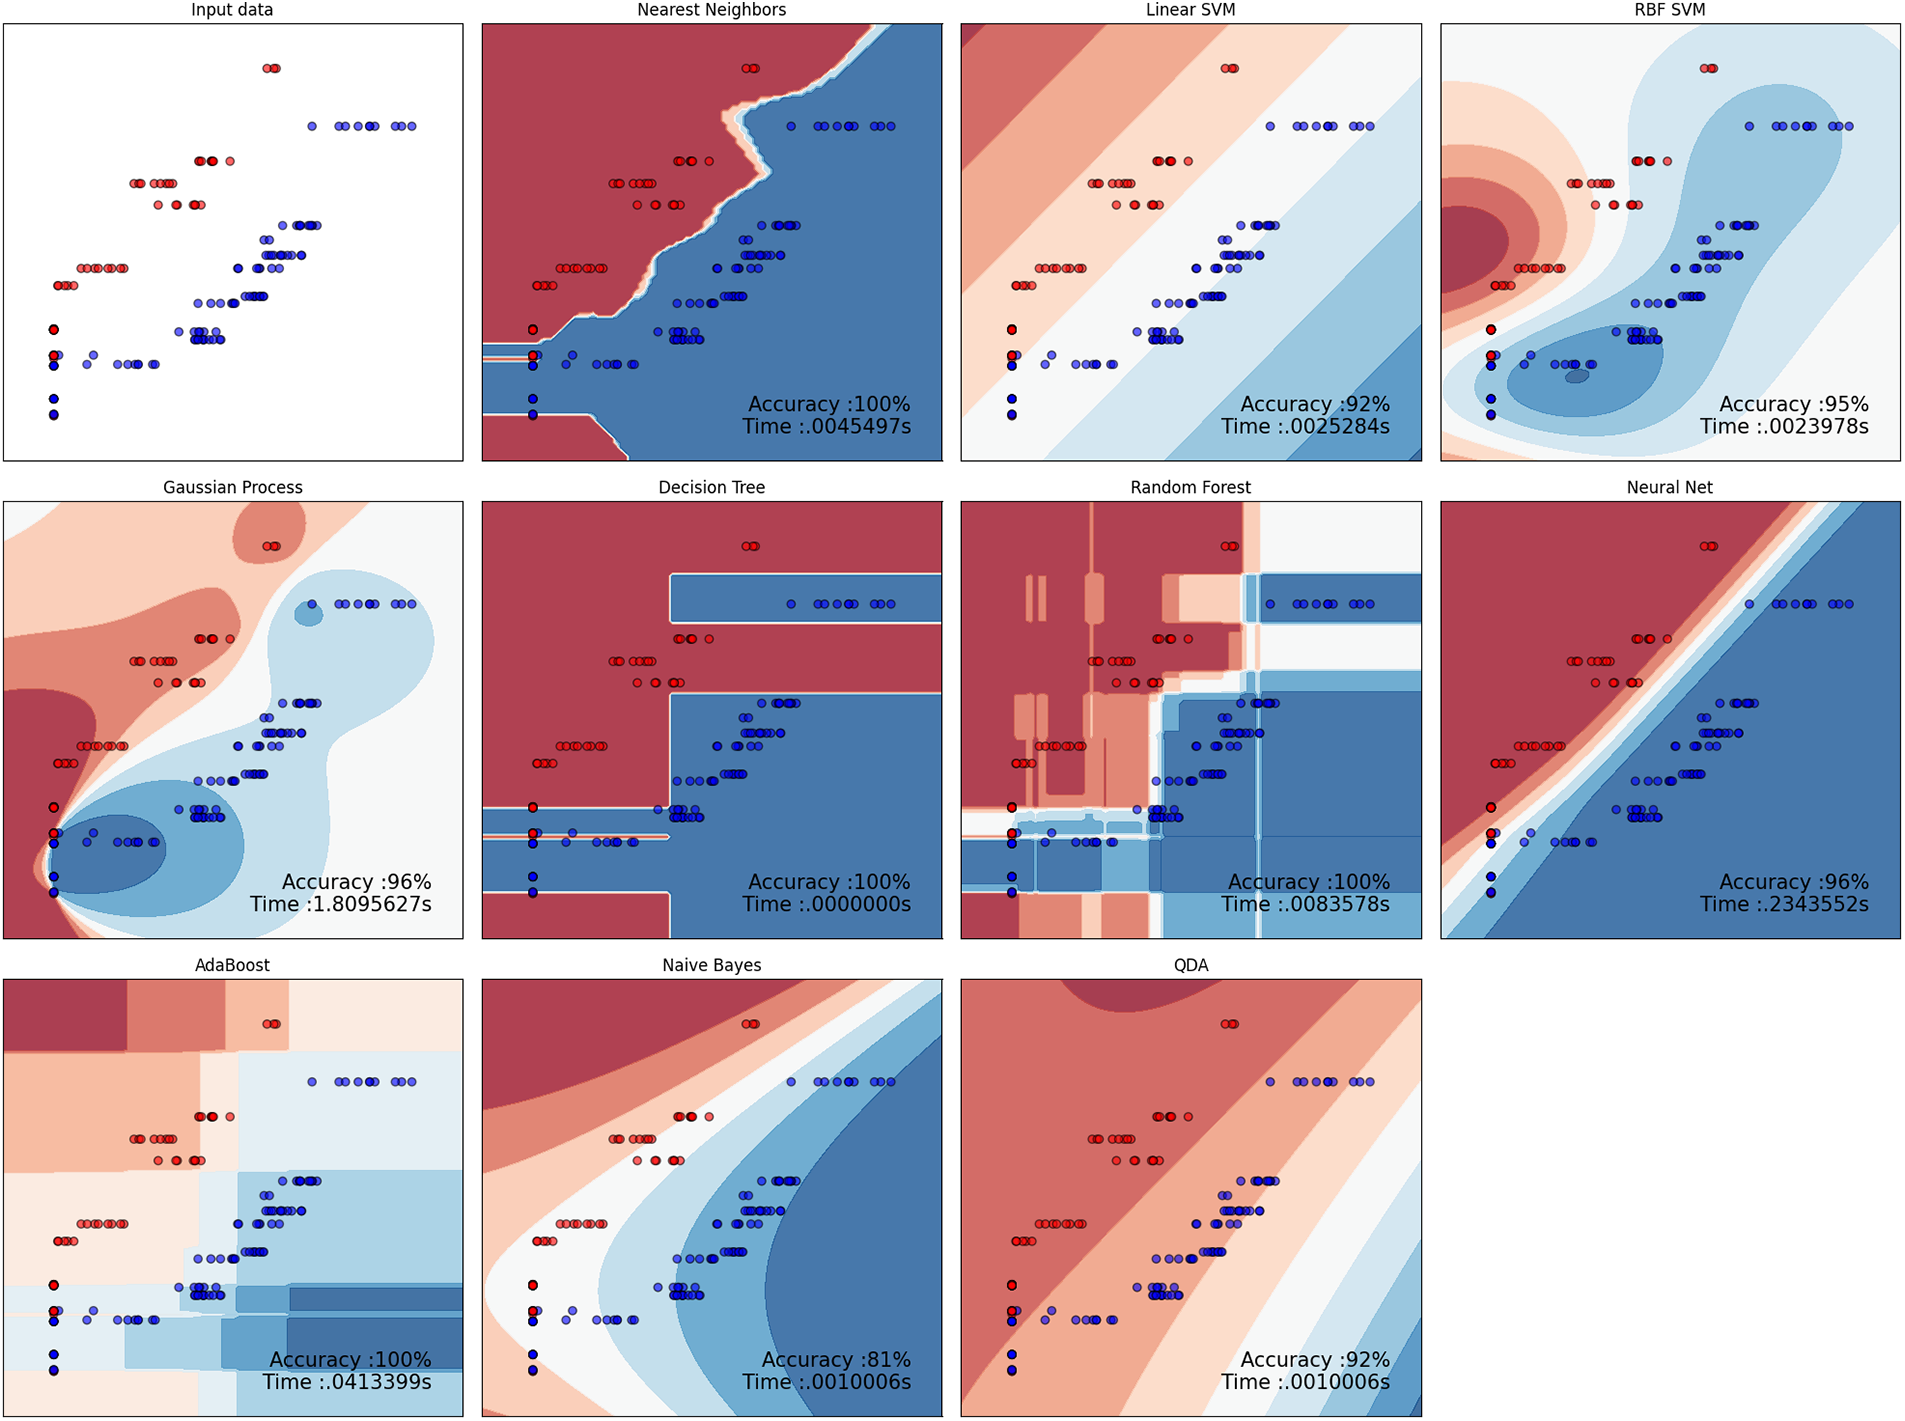
Figure 10: Classifier group Classes boundary decisions and classification with the shadow isolated CGVP-CNN prediction results and weight values, decision boundaries visualization of (blue dots represent coal, and red dots represent gangue), classification accuracy on a scale of (0–100) and time in seconds
Prediction models should be guaranteed to work well on all future data, including the data used for training and testing. Tests such as cross-validation are crucial to assess the generalization of a prediction model with new data. During the training phase, the prediction accuracy is not assured to remain the same when the model is used. The data used to modify the model’s weights were used to determine the best results it could deliver. However, the nature of the 3-side image dataset and the fact that the same volume value is shared with several images might reduce the efficiency of the model, so the cross-validation was conducted in two steps. First, a regular cross-validation test is performed over a 10% of the dataset. The model results of these data will indicate how the model reacts to new data within the range of the trained volume values. The results show that the proposed model can predict volume values that lead to good classification with weight.
Although the first cross-validation test shows great results, yet, this test is not sufficient to determine the model’s generalization abilities on new volume values. Since the training data in classifiers training was split across all samples by applying the split process to the whole dataset without considering the division to be based on the volume values. This measure allows the leak of some features from the validation group to the training group, it could work as a similar category where they are shared with different 3-side images. A second step cross-validation test was applied to this experiment by isolating specific samples 3-side image groups (C5, C15, G20, and G13) of volume values (1.380, 1.110, 1.540, and 1.010) and have 3-side images (33, 25, 29, and 21), respectively, these samples excluded from the training and the validation of the model and the training of the classifiers so they can be used for the cross-validation as new volume values with maintain that these volume values came in within the range of the volume value that the model trained with. The classification accuracy results of this test came with (100%, 100%, 100%, 98%, 88%, 87%, 100%, 87%, 97%, and 100%) for the classifiers group, also this test was done several times with different volume values to overcome any bias in choosing the samples and the worst test results remained over 90%. This result clearly explains that the model has a good generalization for new data even with similar volume values or even with new volume values, Fig. 11 displays the isolated samples group distribution and the classification results of the different classifiers group with time. Table 4 also presents the evaluation metrics of the classifiers.
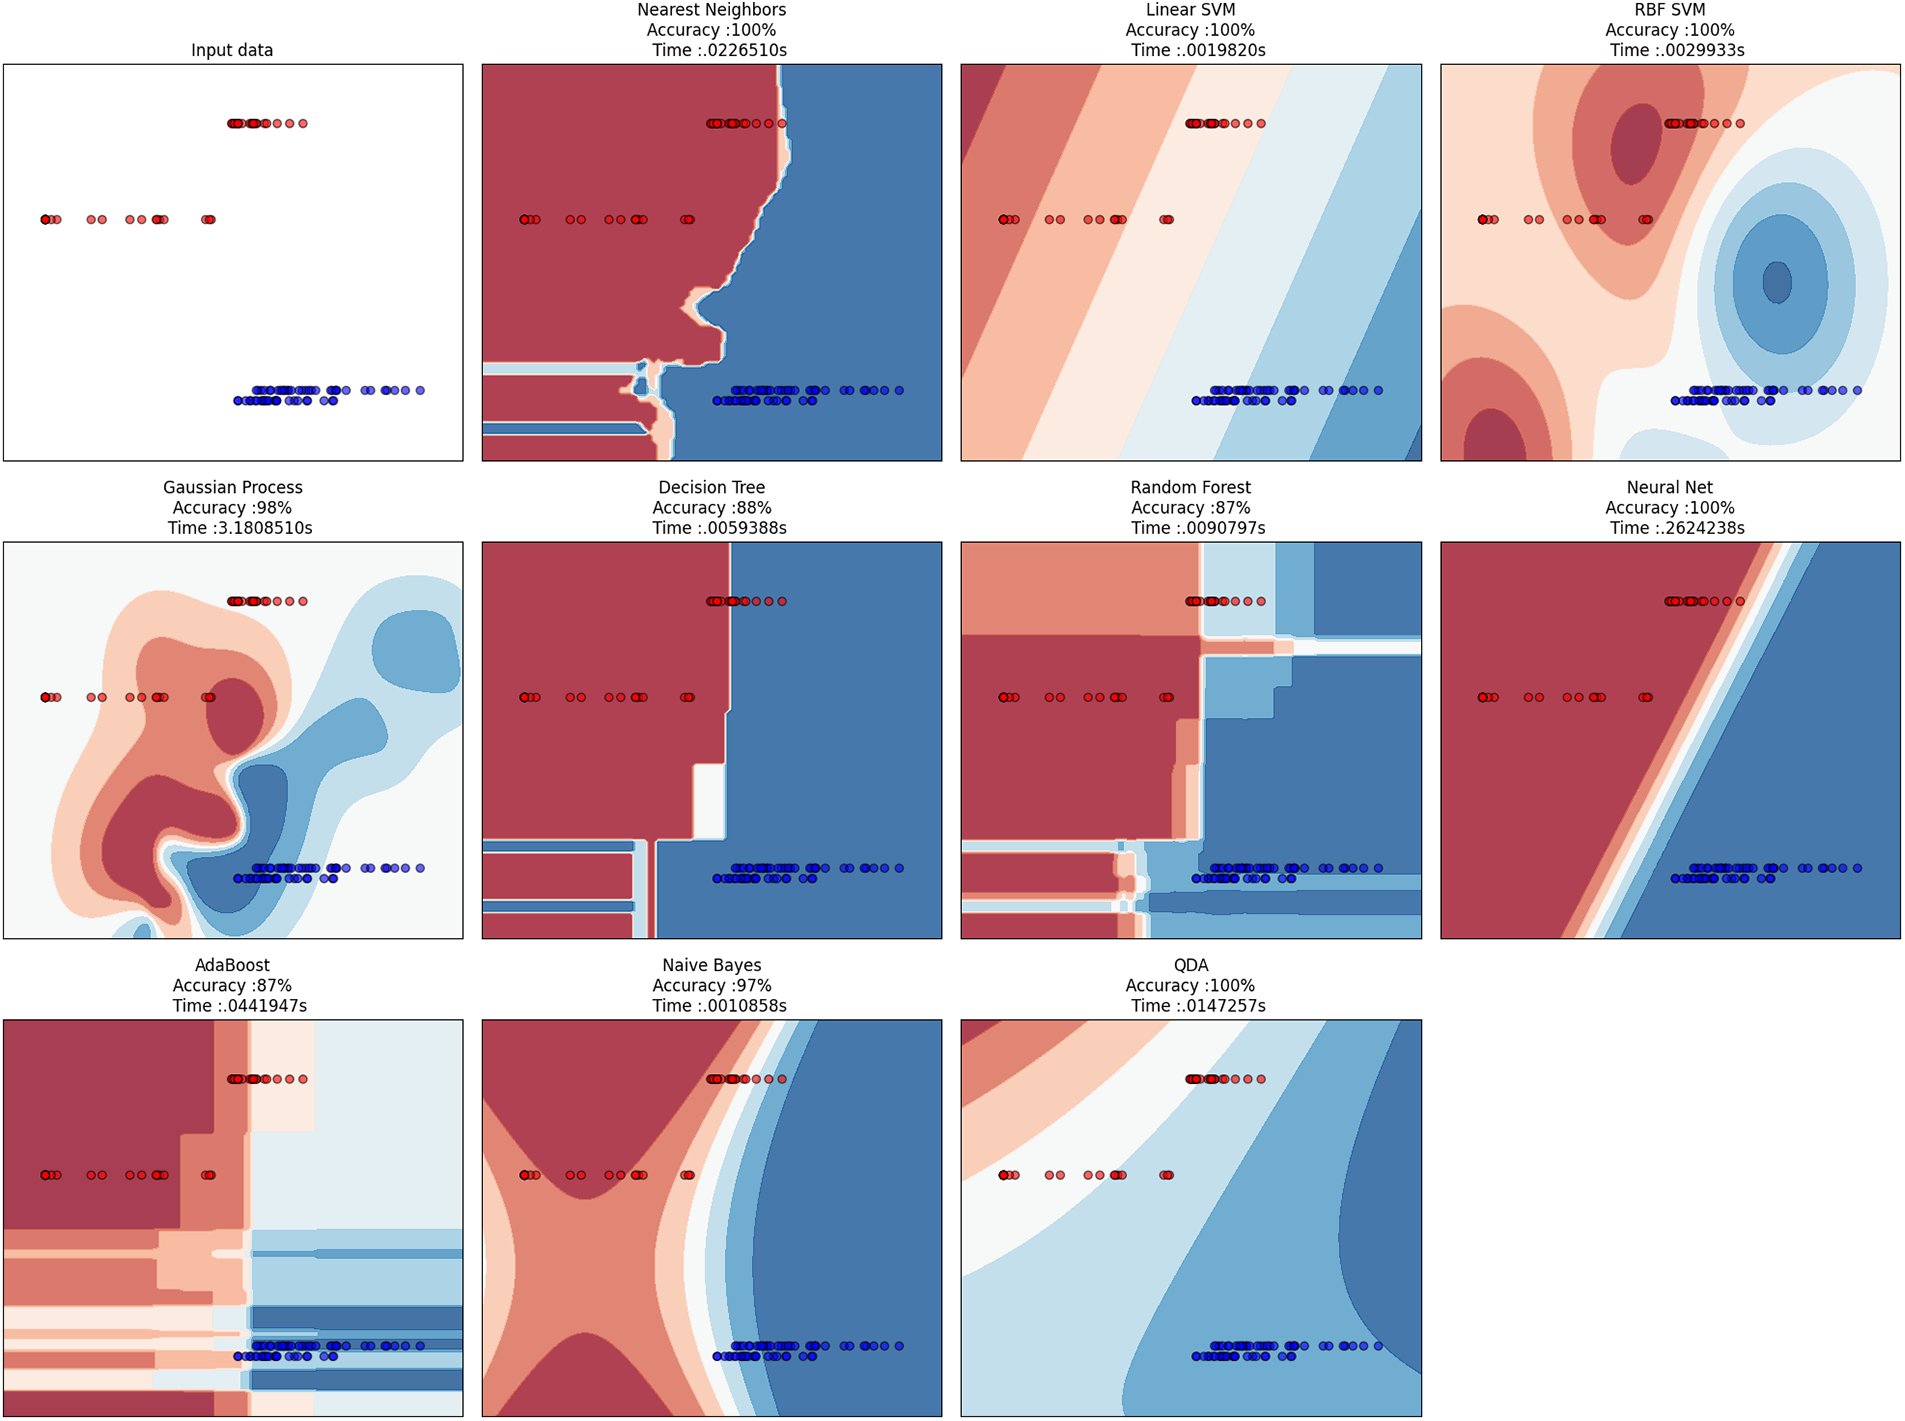
Figure 11: Cross-validation test of classifiers group results with CGVP-CNN predicted volume and weight values, decision boundaries visualization of (blue dots represent coal, and red dots represent gangue)
The research presented in this paper aimed to estimate the volume of coal gangue that can replace the ExM values mentioned in [15], the main objective is to evaluate how effective this process is based on time taken and classification accuracy. The accuracy of the process is evaluated by comparing the classification results of CGVP-CNN estimated values with the real values and the ExM values. For time comparison, during the several processes in the two methods, the ExM-SVM in [15] or the CGVP-CNN both consider the same time calculations which were done by calculating the duration of each process and summing the total time while running in similar hardware to ensure the maximum degree of similarity in both methods. The time taken for the CGVP-CNN estimation process is also evaluated and compared with the time taken with the ExM values, based on two steps the preparation of the input data and the classification process. The results of this study will be useful in determining the feasibility of using CGVP-CNN estimation as a replacement for ExM values in future studies and the feasibility of volume estimation as a useful method in the mining industry.
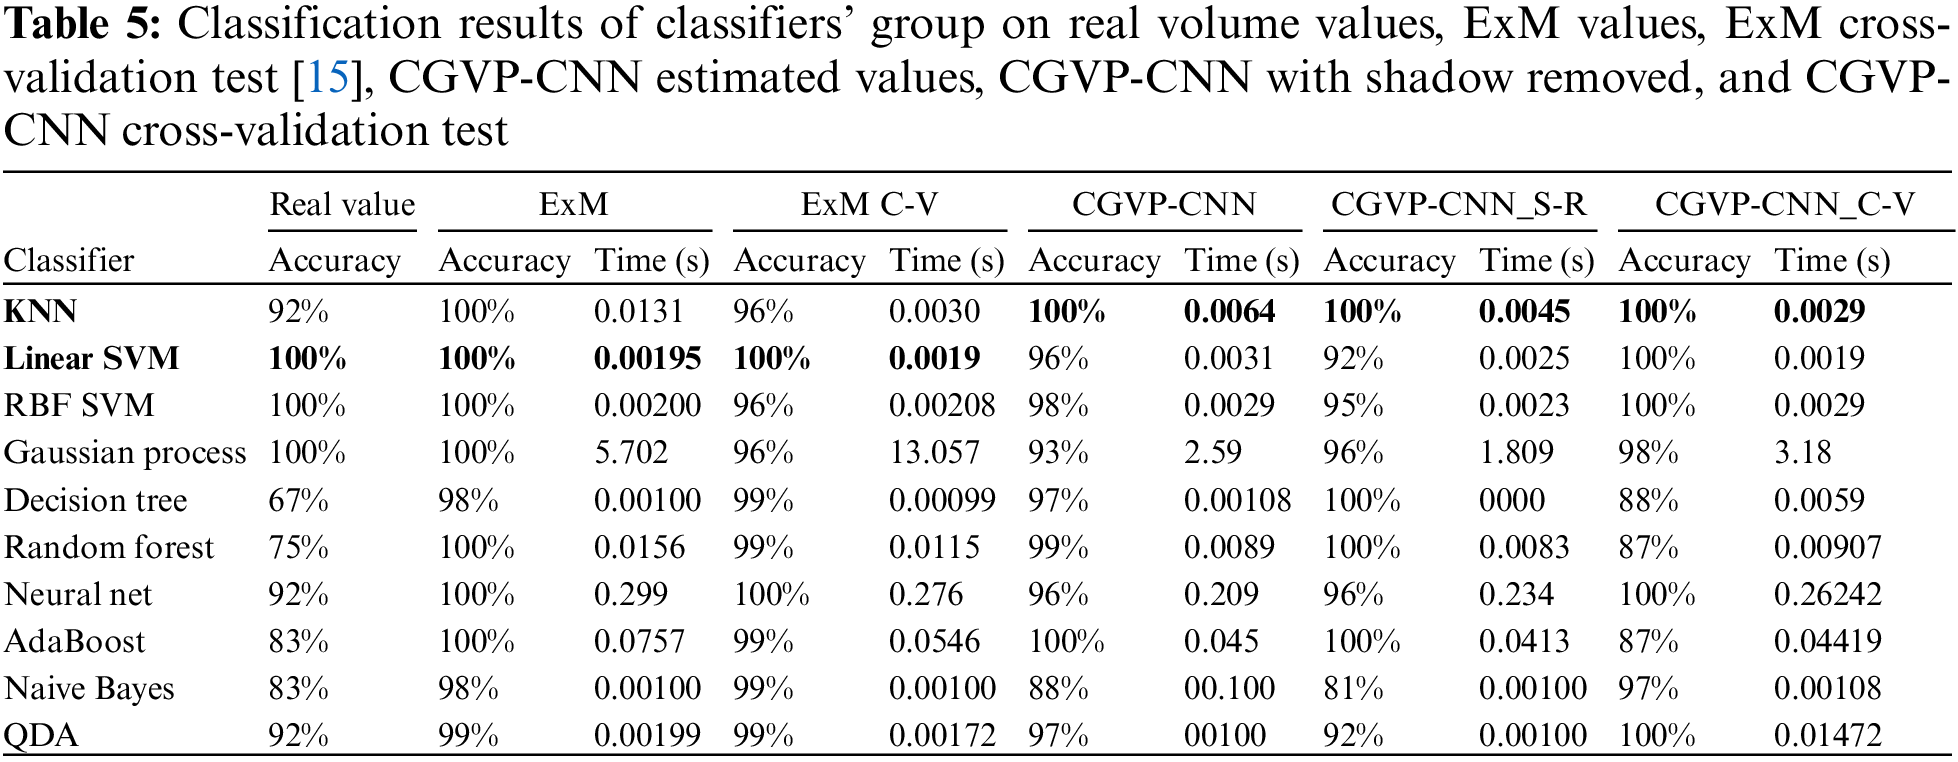
As explained earlier about the dataset preparation timing, it is clear that the CGVP-CNN does not consume as much time as the ExM process does, where CGVP-CNN only consumes around 0.07 s and the ExM process consumes 0.4 s this difference in the timing gives the CGVP-CNN preference over ExM, so the main target is to assess the efficiency of using the predicted volume of the CGVP-CNN as replacement of ExM vlaue in the classification process through the accuracy percentage, Table 5, displays the classifier’s classification accuracy alongside the classification time for different values: Real values, ExM value, and ExM value cross-validation are imported from [15] and CGVP-CNN value, CGVP-CNN with shadow removal, and CGVP-CNN cross-validation, results of ExM and CGVP-CNN with the different classifiers came as with (ExM-CGVP-CNN, 100%–100%, 100%–96%, 100%–98%, 100%–93%, 98%–97%, 100%–99%, 100%–96%, 100%–100%, 98%–88%, 99%–97%) as classifier sequence respectively, although, ExM demonstrates better classification accuracy almost 99.5% accuracy average compared to CGVP-CNN which achieved around 96.4% accuracy average, yet the CGVP-CNN achieved the maximum accuracy in two classifiers which is enough to fulfil the accuracy requirment of the classification task. This proves the hypothesis of this research by reducing the timing of the preprocessing steps and maintaining high classification accuracy. On the other hand, estimating coal gangue volume is the technique presented here in this work to perform classification tasks, and as described in the introduction about related work, there are not a lot of works in this direction of classification for coal and gangue. Therefore, a fair comparison is driven by shared factors such as fulfilling the main task (accuracy of classification) and computational cost (the needed resources and execution time). The experiment was done with low hardware resources, as the hardware platform details shows that the computional resources and the used cameras are in the normal specification, which also leads to the advantage over the highly structured techniques based on the requirement needs.
So to compare the accuracy of the work, this research applies the same comparison in [15]. Table 6 shows how the presented work achieves high accuracy compared to several works. The previous studies [28,29], and [41] used feature extraction with SVM classifiers to separate coal and gangue. However, relying only on the texture differences of grayscale images [28] or the colored images [29,41] of coal and gangue, still suffer from environmental problems such as similarity, dust, and poor intensity. Liu et al. [29] to overcome that used the Laplacian operator, and Gaussian filter methods to improve the quality of the images making them more time consuming.
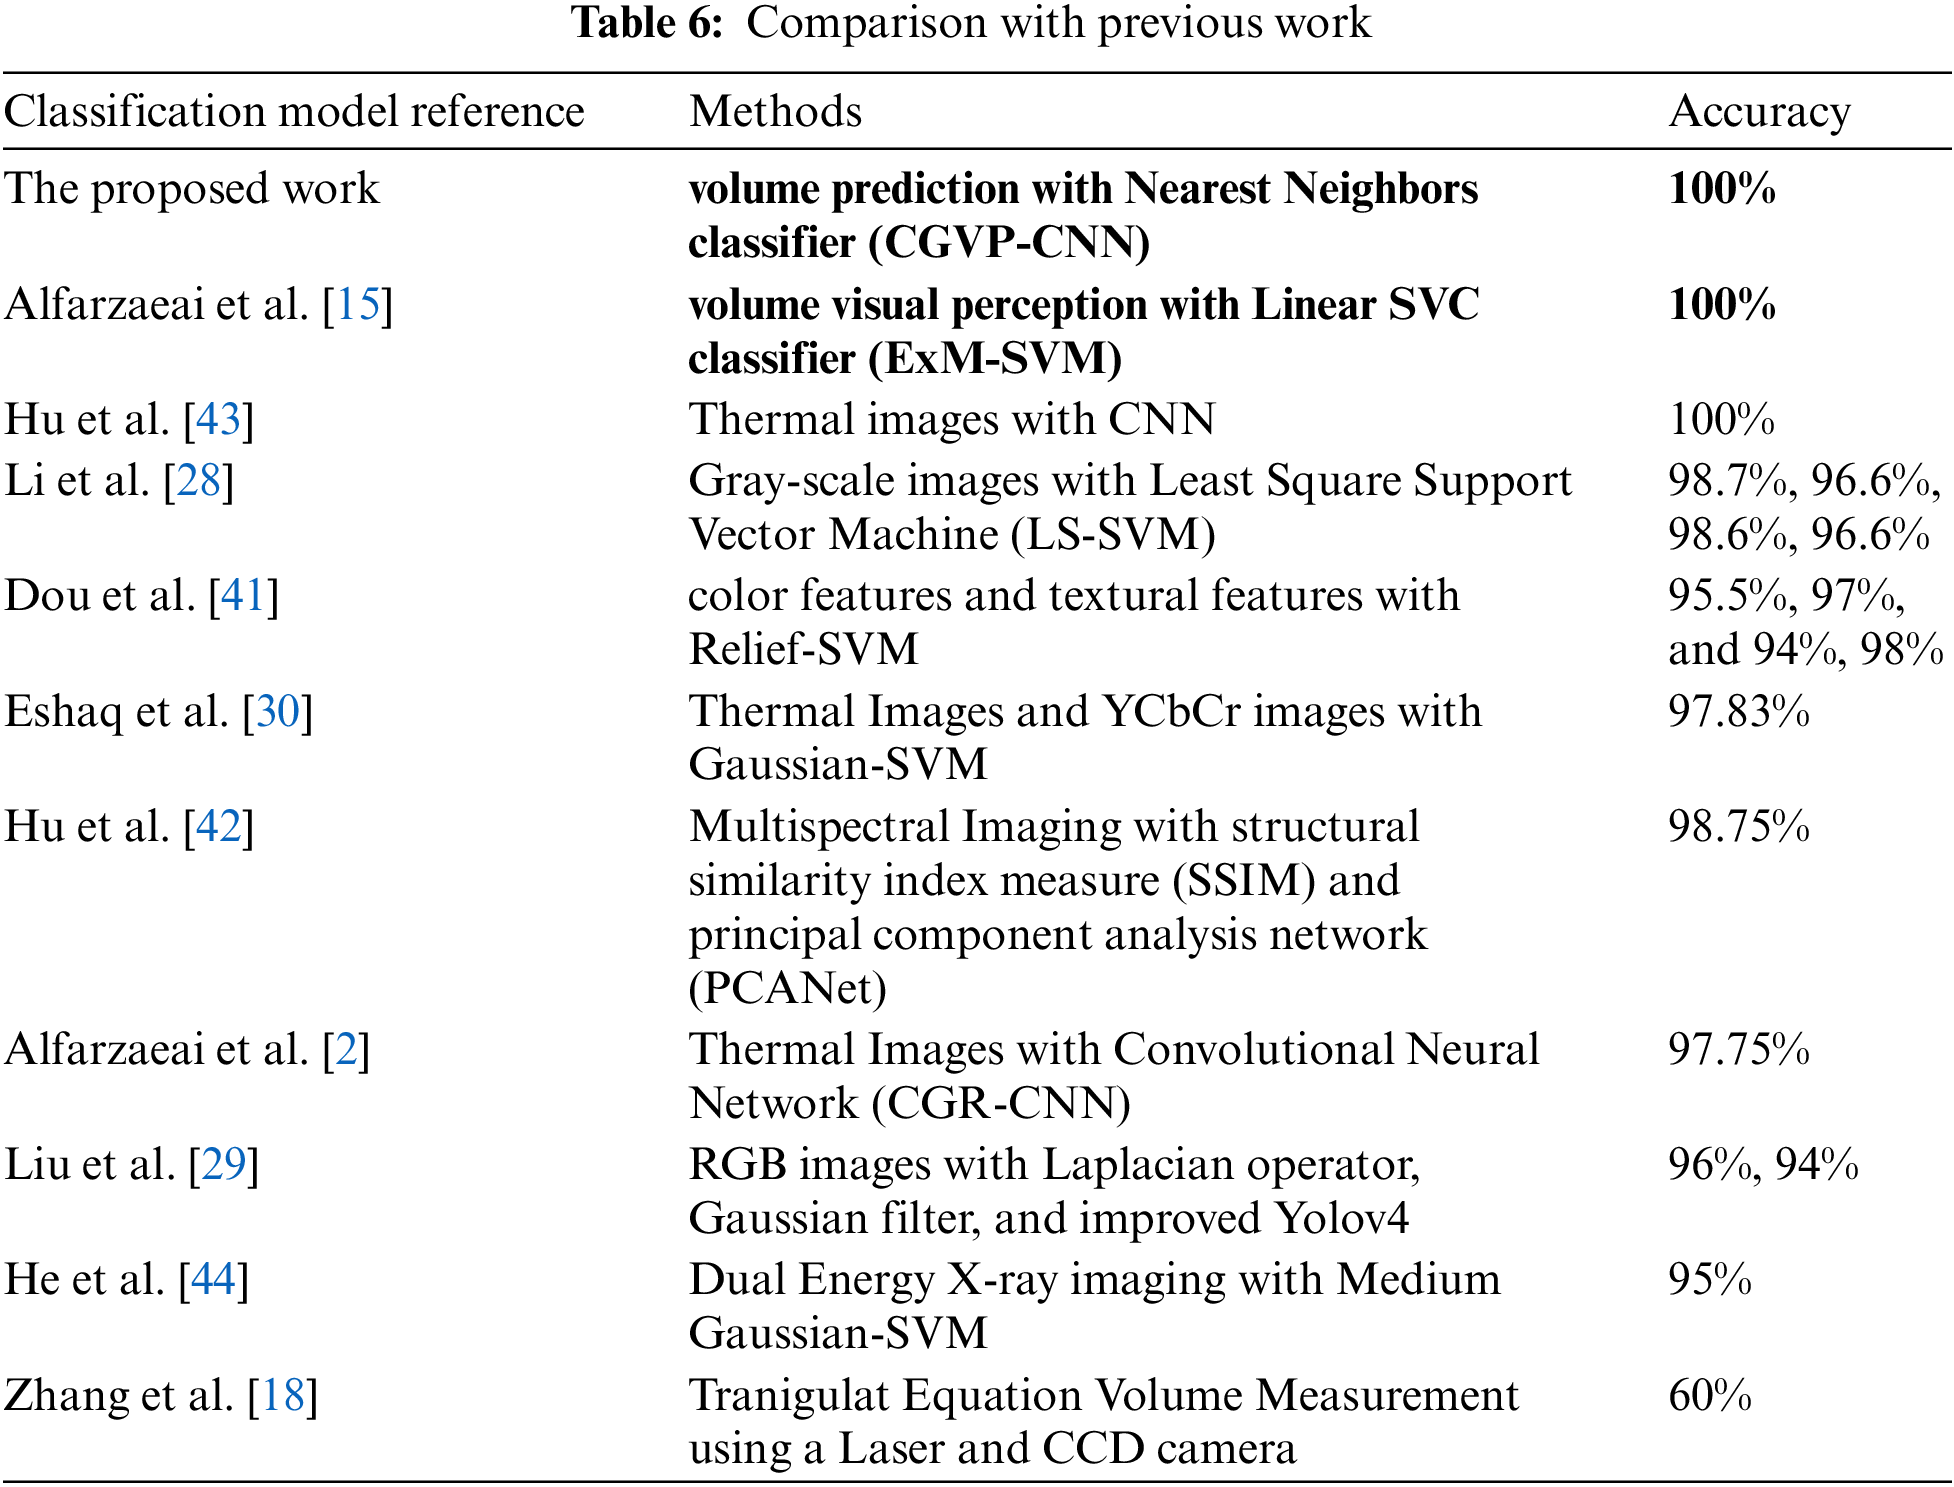
Although these studies achieved good results ranging from 94% to 98.7%, the presented work achieved higher accuracy of a 100% success rate, Also addressed those problems and adopted a different approach to solve the problem and avoid the effect of the environmental factors resulting in enhanced accuracy.
Moreover, convolution neural networks hit high performance given accuracy and timing, and for tracing the use of CNN within the coal gangue classification, comparison with [2,30,42], and [43] was done, where those works move to use the thermal factor that can neutralize the influence of the environmental factors. The advantage of good timing is partly owed to CNN’s feature extraction capability against other feature extraction methods. once again the accuracy of those works came lower than the presented work in this paper where the classification accuracy of these works ranged between 98.7% and 96.6%. Hu et al.’s work in [43] has 100% but they used a small dataset with around 192 thermal images for training and 48 for testing, and no cross-validation tests were mentioned in the paper. Also, the use of multispectral characteristics extraction with thermal images needs InfraRed cameras and Multi-Spectral cameras, which are considered a high requirement yet essential for separation efficiency. However, in this work, even low-quality cameras, such as webcams, can be used while still being able to surpass the accuracy reported in the works above.
Applying the density factor within the coal gangue classification was mentioned in several methods, such as using X-ray imaging to visualize the density, we mentioned here one reference [44] to indicate the use of this technology and how the classification accuracy, but the technology is considered dangerous for the human body and also needs a lot of power resource during the use of it, so it far away of the comparison bases with the presented work of this paper.
Delving into using computer vision to predict the volume of the objects as the base of the coal gangue classification, we presented Zhang et al. [18] work which introduces the use of the laser with a CCD camera to create the triangular parameters to calculate the volume but the result in this paper indicates a classification accuracy around 60% which considered too low. Later, in a paper of Wang et al. [17] relied on a similar technology employing a 3D imaging, no classification results were reported in their paper, compared to this work the difference in the classification accuracy is clear, and also using 3D cameras considered as a high requirement compared to the cameras using in this work. Another work by Sun et al. [45], in which the authors present a coal gangue classification based on computer vision that uses two cameras to create the volume perception and achieve volume prediction by tracing the height of the samples and estimating the depth, no results were presented in the paper so the comparison based on the accuracy is not available, also the use of only two cameras will not solve the cavity problem.
We can say that the proposed work here in this paper and based on the cross-validation test also the consideration of the low hardware that was used with this work, all make this work ideal to solve the problem of the coal gangue classification task.
4.1 Prediction Error Effect on Classification
During the volume prediction experiment of coal and gangue using the CGVP-CNN model, the model showed a mean absolute error percentage of 16.40%, and a standard deviation of the absolute error percentage of 25.09%; however, this error percentage did not affect the ability of classifiers to classify coal and gangue with accuracy reached 100% for most of the time, we believe this is attributed to the fact that prediction error was distributed equally on the two classes which were reflected positively on the performance of classification. This conclusion can be noted in the regression lines of the two classes in the first situation with the real measurements and the second with the predicted measurements from the CGVP-CNN model. Fig. 12 shows the regression lines of the two situations of gangue and coal, and it is obvious that there was no considerable difference in regression because when volume prediction affected the coal regression line, shifting it slightly, a gangue regression line was also shifted almost equally leading to clear separation area between the two regression lines. Observing the volume prediction error and the poor effect on the classification result, it is clear that breaking down the classification task of any neural network into two parts-one part is to build neural networks that predict the classification factors, and the second part is to receive the output of the first part, and by controlling the results of the first part-more efficient neural networks can be built.
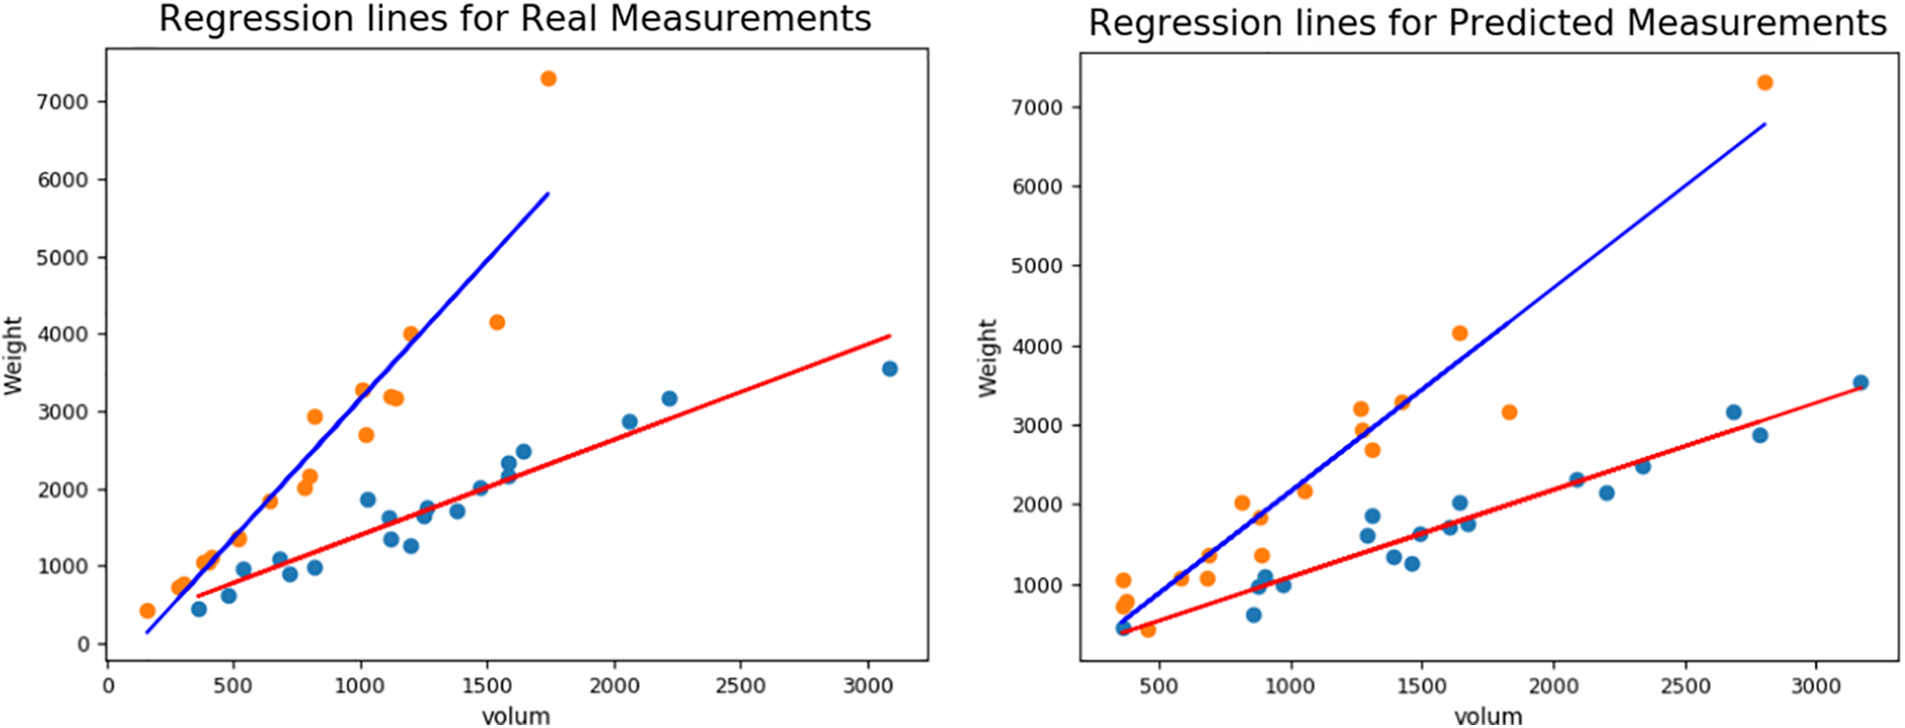
Figure 12: Prediction error effect on regression lines of the two classes
The research presented aims to estimate the volume of coal gangue that can replace the ExM values mentioned in [15]. The assessment process includes evaluating both the classification accuracy and computational cost. To test accuracy, the classification results of (CGVP-CNN) estimated values are compared to the real and ExM values. Additionally, the computational time required for the (CGVP-CNN) estimation process is evaluated and compared to the corresponding cost for the ExM values. Time is accountable for both the preparation phase of input data and the classification process. The results of this study will be useful in determining the feasibility of using (CGVP-CNN) estimation as a replacement for ExM values in future works and the feasibility of volume estimation as a useful method in the mining industry. There are two steps to conduct the classification. First, a convolutional neural model (CGVP-CNN) was developed to predict the volume of coal and gangue samples using 3-side images. To accomplish this, the 3-side images dataset was used and prepared for training and testing the (CGVP-CNN) model, as well as real measurements of volume and weight of 40 coal gangue samples, second to use 10 classifiers to perform the classification. The results of classification with the predicted volume by (CGVP-CNN) and the weight came with high accuracy around (100%, 96%, 98%, 93%, 97%, 99%, 96%, 100%, 88%, and 97%) as classifier sequence, respectively, and the overall accuracy average around 96.4%, and cross-validation test results (100%, 100%, 100%, 98%, 88%, 87%, 100%, 87%, 97%, and 100%) with around 95.7% of average accuracy. The best results reported are for the KNN classifier with a classification accuracy of 100% on the training set and a cross-validation test. It proves good generalization over new data. Moreover, it accomplished 100% accuracy after conducting the shadow removal for the 3-side image test.
The division of work into two models aims to evaluate the impact of feature prediction and control. This approach helps identify controllable factors within neural networks, which can enhance the training efficiency of the model. During volume prediction, prediction error was distributed equally among the two classes, leading to a more stable classification that aids the understanding of the model’s convergence during training. The work is promising, yet more space for improvement exists, especially in the computer vision aspect. We believe that using special kinds of camera setups to reduce the distance between the camera and the object will contribute to shooting more accurate images that help with volume prediction as well as improving the capture stand with backlight to reduce the light shadow of the object.
Acknowledgement: We would like to thank Prof. Niu Qiang for his guidance that facilitated the creation of the data, and Mr. Maged M. A. Al-Kainaeai for his assistance in creating the 3-side images dataset.
Funding Statement: This work was supported by the National Natural Science Foundation of China under Grant No. 52274159 received by E. Hu, https://www.nsfc.gov.cn/, Grant No. 52374165 received by E. Hu, https://www.nsfc.gov.cn/, the China National Coal Group Key Technology Project Grant No. (20221CY001) received by Z. Guan, and E. Hu, https://www.chinacoal.com/.
Author Contributions: The authors confirm their contribution to the paper as follows: study conception and design: Murad S. Alfarzaeai, Zenglun Guan; data collection: Murad S. Alfarzaeai, Zenglun Guan, Taqiaden Alshmeri; analysis and interpretation of results: Murad S. Alfarzaeai, Zenglun Guan, Eryi Hu, Taqiaden Alshmeri; draft manuscript preparation: Murad S. Alfarzaeai, Taqiaden Alshmeri; project management, supervision and funding: Zenglun Guan, Eryi Hu, Wang Peng; All authors reviewed the results and approved the final version of the manuscript.
Availability of Data and Materials: Data is available on request from the authors. The data that support the findings of this study are available from Dr. Murad S. Alfarzaeai, upon reasonable request, email: mfarzai@yahoo.com.
Conflicts of Interest: The authors declare that they have no conflicts of interest to report regarding the present study.
References
1. I. E. Agency, “Coal information: Overview,” 2020. Accessed: Oct. 08, 2023. [Online]. Available: https://www.iea.org/reports/coal-information-overview [Google Scholar]
2. M. S. Alfarzaeai, Q. Niu, J. Zhao, R. M. A. Eshaq, and E. Hu, “Coal/Gangue recognition using convolutional neural networks and thermal images,” IEEE Access, vol. 8, pp. 76780–76789, 2020. doi: 10.1109/ACCESS.2020.2990200. [Google Scholar] [CrossRef]
3. B. Wang, C. Q. Cui, Y. X. Zhao, B. Yang, and Q. Z. Yang, “Carbon emissions accounting for China’s coal mining sector: Invisible sources of climate change,” Nat. Hazards, vol. 99, pp. 1345–1364, 2018. [Google Scholar]
4. R. Gao, Z. Sun, W. Li, L. Pei, Y. Hu and L. Xiao, “Automatic coal and gangue segmentation using U-Net based fully convolutional networks,” Energies, vol. 13, pp. 829, 2020. doi: 10.3390/en13040829. [Google Scholar] [CrossRef]
5. Z. Sun, L. Huang, and R. Jia, “Coal and gangue separating robot system based on computer vision,” Sens., vol. 21, pp. 1349, 2021. doi: 10.3390/s21041349 [Google Scholar] [PubMed] [CrossRef]
6. J. G. Li and K. Zhan, “Intelligent mining technology for an underground metal mine based on unmanned equipment,” Eng., vol. 4, pp. 381–391, 2018. doi: 10.1016/j.eng.2018.05.013. [Google Scholar] [CrossRef]
7. R. Wang and Z. Liang, “Automatic separation system of coal gangue based on DSP and digital image processing,” in Symp. Photonics Optoelectron. (SOPO), Wuhan, China, 2011, pp. 1–3. doi: 10.1109/SOPO.2011.5780625. [Google Scholar] [CrossRef]
8. H. Hong, L. Zheng, J. Zhu, S. Pan, and K. Zhou, “Automatic recognition of coal and gangue based on convolution neural network,” arXiv preprint arXiv:1712.00720, 2017. [Google Scholar]
9. L. Su, X. Cao, H. Ma, and Y. Li, “Research on coal gangue identification by using convolutional neural network,” in 2nd IEEE Adv. Inform. Manage., Commun., Electron. Autom. Control Conf. (IMCEC), Xi’an, China, 2018, pp. 810–814. doi: 10.1109/IMCEC.2018.8469674. [Google Scholar] [CrossRef]
10. Y. Pu, D. B. Apel, A. Szmigiel, and J. Chen, “Image recognition of coal and coal gangue using a convolutional neural network and transfer learning,” Energies, vol. 12, pp. 1735, 2019. doi: 10.3390/en12091735. [Google Scholar] [CrossRef]
11. G. Wang et al., “Research and practice of intelligent coal mine technology systems in China,” Int. J. Coal. Sci. Technol., vol. 9, no. 1, pp. 19–35, 2022. doi: 10.1007/s40789-022-00491-3. [Google Scholar] [CrossRef]
12. J. Xu and F. Wang, “Study of automatic separation system of coal and gangue by IR image recognition technology,” in Advances in Automation and Robotics, G. Lee (Ed.Berlin, Heidelberg: Springer Berlin Heidelberg, 2012, vol. 2, pp. 87–92. [Google Scholar]
13. D. P. Tripathy and K. G. R. Reddy, “Novel methods for separation of gangue from limestone and coal using multispectral and joint color-texture features,” J. Inst. Eng. (IndiaSeries D, vol. 98, pp. 109–117, 2017. doi: 10.1007/s40033-015-0106-4. [Google Scholar] [CrossRef]
14. D. M. Hobson, R. M. Carter, Y. Yan, and Z. Lv, “Differentiation between coal and stone through image analysis of texture features,” in IEEE Int. Workshop Imaging Syst. Tech., Cracovia, Poland, 2007, pp. 1–4. [Google Scholar]
15. M. S. Alfarzaeai, E. Hu, W. Peng, N. Qiang, and M. M. A. Alkainaeai, “Coal gangue classification based on the feature extraction of the volume visual perception ExM-SVM,” Energies, vol. 16, pp. 1–18, 2023. doi: 10.3390/en16042064. [Google Scholar] [CrossRef]
16. B. Xu, Q. Liu, B. Ai, S. Ding, and R. L. Frost, “Thermal decomposition of selected coal gangue,” J. Therm. Anal. Calorim., vol. 131, pp. 1413–1422, 2018. doi: 10.1007/s10973-017-6687-4. [Google Scholar] [CrossRef]
17. W. Wang and C. Zhang, “Separating coal and gangue using three-dimensional laser scanning,” Int. J. Miner. Process., vol. 169, pp. 79–84, 2017. doi: 10.1016/j.minpro.2017.10.010. [Google Scholar] [CrossRef]
18. C. Zhang and C. Zhang “Coal gangue separation system based on density measurement,” in IEEE Int. Conf. Comput. Sci. Autom. Eng. (CSAE), Zhangjiajie, China, 2012, vol. 1, pp. 216–218. [Google Scholar]
19. Q. Mu and J. Dong, “The application of coal cleaning detection system based on embedded real-time image processing,” in Fifth Int. Conf. Meas. Tech. Mechatron. Autom., Hong Kong, China, 2013, pp. 1125–1127. doi: 10.1109/ICMTMA.2013.274. [Google Scholar] [CrossRef]
20. W. Li, Y. Wang, B. Fu, and Y. Lin, “Coal and coal gangue separation based on computer vision,” in Fifth Int. Conf. Front. Comput. Sci. Technol., Changchun, China, 2010, pp. 467–472. [Google Scholar]
21. K. Gao, C. Du, H. Wang, and S. Zhang, “An efficient of coal and gangue recognition algorithm,” Int. J. Signal Process., Image Process. Pattern Recognit., vol. 6, pp. 22, 2013. [Google Scholar]
22. Y. He, J. He, N. Zhou, B. Chen, and H. Liang, “Notice of retraction: Research on identification of coal and waste rock based on PCA and GA-ANN,” in 3rd Int. Conf. Comput. Sci. Inform. Technol., Chengdu, China, 2010, vol. 6, pp. 579–584. doi: 10.1109/ICCSIT.2010.5564418. [Google Scholar] [CrossRef]
23. J. Sun and B. Su, “Coal-rock interface detection on the basis of image texture features,” Int. J. Min. Sci. Technol., vol. 23, pp. 681–687, 2013. doi: 10.1016/j.ijmst.2013.08.011. [Google Scholar] [CrossRef]
24. K. Liu, X. Zhang, and Y. Chen, “Extraction of coal and gangue geometric features with multifractal detrending fluctuation analysis,” Appl. Sci., vol. 8, pp. 463, 2018. doi: 10.3390/app8030463. [Google Scholar] [CrossRef]
25. M. Li, Y. Duan, X. He, and M. Yang, “Image positioning and identification method and system for coal and gangue sorting robot,” Int. J. Coal. Prep. Util., vol. 42, no. 6, pp. 1759–1777, 2020. doi: 10.1080/19392699.2020.1760855. [Google Scholar] [CrossRef]
26. J. Jiang, Y. F. Han, H. Zhao, J. Suo, and Q. Cao, “Recognition and sorting of coal and gangue based on image process and multilayer perceptron,” Int. J. Coal. Prep. Util., vol. 43, no. 1, pp. 54–72, 2021. doi: 10.1080/19392699.2021.2002852. [Google Scholar] [CrossRef]
27. W. Hou, “Identification of coal and gangue by feed-forward neural network based on data analysis,” Int. J. Coal. Prep. Util., vol. 39, pp. 33–43, 2019. doi: 10.1080/19392699.2017.1290609. [Google Scholar] [CrossRef]
28. M. Li and K. Sun “An image recognition approach for coal and gangue used in pick-up robot,” in IEEE Int. Conf. Real-Time Comput. Robot. (RCAR), Kadima, Maldives, 2018, pp. 501–507. doi: 10.1109/RCAR.2018.8621725. [Google Scholar] [CrossRef]
29. Q. Liu, J. Li, Y. Li, and M. Gao, “Recognition methods for coal and coal gangue based on deep learning,” IEEE Access, vol. 9, pp. 77599–77610, 2021. doi: 10.1109/ACCESS.2021.3081442. [Google Scholar] [CrossRef]
30. R. M. A. Eshaq, E. Hu, M. Li, and M. S. Alfarzaeai, “Separation between coal and gangue based on infrared radiation and visual extraction of the YCbCr color space,” IEEE Access, vol. 8, pp. 55204–55220, 2020. doi: 10.1109/ACCESS.2020.2981534. [Google Scholar] [CrossRef]
31. M. Li, X. He, Y. Duan, and M. Yang, “Experimental study on the influence of external factors on image features of coal and gangue,” Int. J. Coal. Prep. Util., pp. 1–18, 2021. doi: 10.1080/19392699.2021.1901692. [Google Scholar] [CrossRef]
32. F. Hu, M. Zhou, P. Yan, K. Bian, and R. Dai, “Multispectral imaging: A new solution for identification of coal and gangue,” IEEE Access, vol. 7, pp. 169697–169704, 2019. doi: 10.1109/ACCESS.2019.2955725. [Google Scholar] [CrossRef]
33. C. Okinda et al., “Egg volume estimation based on image processing and computer vision,” J. Food. Eng., vol. 283, pp. 110041, 2020. doi: 10.1016/j.jfoodeng.2020.110041. [Google Scholar] [CrossRef]
34. D. Lee, K. Lee, S. Kim, and Y. Yang, “Design of an optimum computer vision-based automatic abalone (haliotis discus hannai) grading algorithm,” J. Food. Sci., vol. 80, pp. E729–E733, 2015. doi: 10.1111/1750-3841.12799 [Google Scholar] [PubMed] [CrossRef]
35. A. Anders, Z. Kaliniewicz, and P. Markowski, “Numerical modelling of agricultural products on the example of bean and yellow lupine seeds,” Int. Agrophys., vol. 29, pp. 397–403, 2015. doi: 10.1515/intag-2015-0046. [Google Scholar] [CrossRef]
36. I. Nyalala et al., “Tomato volume and mass estimation using computer vision and machine learning,” J. Food. Eng., vol. 263, pp. 288–298, 2019. doi: 10.1016/j.jfoodeng.2019.07.012. [Google Scholar] [CrossRef]
37. Y. Gan, S. T. Liong, and Y. C. Huang, “Automatic surface area and volume prediction on ellipsoidal ham using deep learning,” arXiv preprint arXiv:1901.04947, 2019. [Google Scholar]
38. H. Huang, D. Dou, and G. Liu, “Modeling of coal and gangue volume based on shape clustering and image analysis,” Int. J. Coal. Prep. Util., vol. 43, pp. 329–345, 2022. doi: 10.1080/19392699.2022.2051011. [Google Scholar] [CrossRef]
39. F. Pedregosa et al., “Scikit-learn: Machine learning in Python,” J. Mach. Learn. Res., vol. 12, pp. 2825–2830, 2011. [Google Scholar]
40. F. Chollet, others, “Keras,” 2015. Accessed: Dec. 08, 2023. [Online]. Available: https://github.com/keras-team/keras [Google Scholar]
41. D. Dou, D. Zhou, J. Yang, and Y. Zhang, “Coal and gangue recognition under four operating conditions by using image analysis and relief-SVM,” Int. J. Coal. Prep. Util., vol. 40, pp. 473–482, 2018. doi: 10.1080/19392699.2018.1540416. [Google Scholar] [CrossRef]
42. F. Hu, M. Zhou, R. Dai, and Y. Liu, “Recognition method of coal and gangue based on multispectral spectral characteristics combined with one-dimensional convolutional neural network,” Front. Earth Sci., vol. 10, pp. 893485, 2022. doi: 10.3389/feart.2022.893485. [Google Scholar] [CrossRef]
43. F. Hu and K. Bian, “Accurate identification strategy of coal and gangue using infrared imaging technology combined with convolutional neural network,” IEEE Access, vol. 10, pp. 8758–8766, 2022. doi: 10.1109/ACCESS.2022.3144386. [Google Scholar] [CrossRef]
44. L. He, S. Wang, Y. Guo, K. Hu, G. Cheng and X. Wang, “Study of raw coal identification method by dual-energy X-ray and dual-view visible light imaging,” Int. J. Coal. Prep. Util., pp. 1–16, 2022. doi: 10.1080/19392699.2022.2051013. [Google Scholar] [CrossRef]
45. X. Sun, Y. Zhao, and Y. Zhao, “Application of volume detection based on machine vision in coal and gangue separation,” in IEEE 5th Conf. Energy Internet and Energy Syst. Integr. (EI2), Taiyun, China, 2021, pp. 4094–4098. doi: 10.1109/EI252483.2021.9713460. [Google Scholar] [CrossRef]
Cite This Article
 Copyright © 2024 The Author(s). Published by Tech Science Press.
This work is licensed under a Creative Commons Attribution 4.0 International License , which permits unrestricted use, distribution, and reproduction in any medium, provided the original work is properly cited.
 Downloads
 Citation Tools