
 Submit a Paper
 Propose a Special lssue
 Open Access
ARTICLE

A Study on Enhancing Chip Detection Efficiency Using the Lightweight Van-YOLOv8 Network
School of Mechanical Engineering and Automation, Dalian Polytechnic University, Dalian, 116034, China
* Corresponding Author: Honglei Wei. Email:
(This article belongs to the Special Issue: Neural Architecture Search: Optimization, Efficiency and Application)
Computers, Materials & Continua 2024, 79(1), 531-547. https://doi.org/10.32604/cmc.2024.048510
Received 10 December 2023; Accepted 11 February 2024; Issue published 25 April 2024
 View Full Text
 Download PDF
Abstract
In pursuit of cost-effective manufacturing, enterprises are increasingly adopting the practice of utilizing recycled semiconductor chips. To ensure consistent chip orientation during packaging, a circular marker on the front side is employed for pin alignment following successful functional testing. However, recycled chips often exhibit substantial surface wear, and the identification of the relatively small marker proves challenging. Moreover, the complexity of generic target detection algorithms hampers seamless deployment. Addressing these issues, this paper introduces a lightweight YOLOv8s-based network tailored for detecting markings on recycled chips, termed Van-YOLOv8. Initially, to alleviate the influence of diminutive, low-resolution markings on the precision of deep learning models, we utilize an upscaling approach for enhanced resolution. This technique relies on the Super-Resolution Generative Adversarial Network with Extended Training (SRGANext) network, facilitating the reconstruction of high-fidelity images that align with input specifications. Subsequently, we replace the original YOLOv8s model’s backbone feature extraction network with the lightweight Vanilla Network (VanillaNet), simplifying the branch structure to reduce network parameters. Finally, a Hybrid Attention Mechanism (HAM) is implemented to capture essential details from input images, improving feature representation while concurrently expediting model inference speed. Experimental results demonstrate that the Van-YOLOv8 network outperforms the original YOLOv8s on a recycled chip dataset in various aspects. Significantly, it demonstrates superiority in parameter count, computational intricacy, precision in identifying targets, and speed when compared to certain prevalent algorithms in the current landscape. The proposed approach proves promising for real-time detection of recycled chips in practical factory settings.Keywords
The escalating volume of discarded electronic devices has led to the emergence of a significant reservoir of reusable semiconductor chips. Compared to their new counterparts, recycled chips come at a markedly lower price, prompting numerous enterprises to adopt chip regenerating equipment for cost reduction. Following successful functional testing, chips undergo tape-and-reel packaging for automated surface mounting on circuit boards. Ensuring precise chip orientation during this process is crucial, as any deviation can result in severe consequences, including the scrapping of circuit boards. To maintain consistent chip orientation, a small circular marker is typically placed on one end of the chip to denote pin arrangement. Detecting and identifying the position of this circular marker is essential for both testing and packaging. However, recycled chips often exhibit substantial surface wear, leading to blurred and challenging-to-detect markers. Moreover, the computational resources required by models for detection are substantial, posing difficulties and challenges during algorithm deployment on computing-limited terminal apparatus. Therefore, a critical challenge in this field is how to minimize the complexity and computational demands of detection models while ensuring precision.
Recycled chip mark detection falls under the category of small object recognition in the field of machine vision. The common methods include conventional image processing and deep learning. Conventional image processing mainly involves image segmentation, texture analysis, image restoration, and feature matching. Feature matching is widely used due to its adaptability in dealing with grayscale changes, deformation, and occlusion. Cui et al. [1] employed diverse approaches for identifying distinct irregularities on the exterior of mobile phone casings, including the least squares method, image differential algorithm, and an improved traditional template matching algorithm for detecting IR holes, ink spots, and LOGOs. Yao et al. [2] extracted the HU invariant moment features and template features of target contours for coarse matching to obtain candidate part contours, used an improved Harris corner detection method to obtain corners, and based on gray-scale fast matching, achieved the effect of improving the precision of part image matching. While these conventional methods have made progress in target feature matching, they perform well on clear chip surfaces but are less effective on severely worn marks on recycled chips.
With the progress of modern information technology and intelligent manufacturing techniques, deep learning-based systems for detecting small targets in industrial products have found widespread application [3]. Given that the hardware employed in industrial settings is often edge devices with limited memory and computational power, considerations extend beyond the requirements of the mechanical drive systems to encompass the computational demands of the models. Consequently, reducing the size of the model proves advantageous for seamless integration into computing devices [4]. The prevalent methodologies for object detection include multi-step strategies like Region-Centric Convolutional Neural Network (R-CNN) [5], Fast R-CNN [6], Mask R-CNN [7], and one-step methodologies such as One-Shot Multibox Detector (SSD) [8], You Only Look Once (YOLO) [9], and Transformer-based object detection algorithms like Detection Transformer (DETR) [10]. Two-stage algorithms first generate candidate boxes and then extract features from these boxes before regressing the objects, which slows down the detection speed. Transformer-based DETR performs poorly in small object detection and has extremely long training times, 10–20 times that of two-stage algorithms. In contrast to alternative categories, object detection algorithms employing a single-stage approach, grounded in regression, combine both localization and classification objectives, leading to increased detection speed and significant advantages in terms of real-time object detection. Moreover, the YOLO algorithm is highly scalable and easily extends to new detection tasks. Based on single-stage algorithms, for more accurate specific target detection, Li et al. [11] proposed an aviation engine part surface defect detection model, YOLO-KEB. This model incorporates the Efficient Channel Attention Network (ECA-Net) into YOLO’s foundational feature extraction network to improve its capabilities in feature extraction. Additionally, it integrates the Bi-directional Feature Pyramid Network (BiFPN) module into the feature integration network for a comprehensive integration of multi-scale features, thereby amplifying the model’s performance for object detection. Wang et al. [12] introduced a network for small defect detection, YOLOV4-SA, combining the Spatial Attention Module (SAM) with YOLOV4. SAM corrects feature values and highlights defect areas, thus effectively recognizing small defects. To address the deployment issue of object detection models on terminal devices with limited computational resources, Zhou [13] and colleagues introduced the YOLOv5s-GCE lightweight model designed to identify surface defects on strip steel. This model incorporates the Ghost module and integrates the Coordinate Attention (CA) strategy, effectively decreasing the model’s dimensions and computational demand without compromising detection accuracy. Yang et al. [14] proposed the improved CBAM-MobilenetV2-YOLOv5 model, introducing both the Mobile Network Version 2 (MobilenetV2) module and Convolutional Block Attention Module (CBAM) for a lighter strip steel surface defect detection model. Following this, Zhang [15] improved YOLOv5 by using a lighter Shuffle Network Version 2 (ShuffleNetv2) as the backbone network, reducing model complexity and having an advantage in detection speed. Zhou et al. [16] proposed the YOLOv8-EL object detection method, using Generative Adversarial Network for Generative Art (GauGAN) for the purpose of augmenting the dataset to rectify the imbalance of different defects in the dataset. The method incorporates the Context Aggregation Module (CAM) in the backbone and feature extraction networks to suppress background noise and builds a Multi-Attention Detection Head (MADH) to effectively improve detection accuracy.
The aforementioned studies have undertaken significant efforts in the lightweight processing of computationally intensive object detection models, offering valuable insights. Addressing challenges related to the identification of small and heavily worn markings on semiconductor chips, as well as the deployment complexities of generic detection algorithms on resource-limited devices, this paper presents a novel lightweight chip marker detection algorithm. Leveraging the characteristics of chip markings and building upon YOLOv8s as the baseline, our approach enhances the detection performance of the original YOLOv8s method while reducing the computational load, rendering the network more lightweight. The principal achievements of this study are delineated as follows:
(1) Effectively generating high-quality samples using the SRGANext sample generator to meet the input size requirements of the detection model. Simultaneously, significantly enhancing image resolution in this process contributes to providing a superior dataset for the detection model.
(2) Introducing the lightweight VanillaNet [17] as the backbone feature extraction network for YOLOv8s, successfully reducing the number of convolutional layers and computational resources. This adjustment results in a more lightweight detection model.
(3) Integrating the HAM [18] into the foundational structure of YOLOv8s to enhance the network’s proficiency in capturing target feature information. This technology elevates the model’s predictive capacity, enabling the real-time and accurate detection of chip markings.
Section 2 of this paper outlines the chip marker detection approach, encompassing data collection, image preprocessing, and the Van-YOLOv8 detection model. In Section 3, the experimental details are expounded, covering evaluation metrics, assessing the effectiveness of validation data preprocessing, conducting ablation experiments, and comparing results with other experiments. Section 4 concludes the paper and provides future prospects.
2 Experimental Setup and Methodology
As depicted in Fig. 1, the experimental platform primarily consists of an industrial camera, a light source, a vibrating disk, a fiber optic sensor, and a feed box. Chips are transported along the track of the vibrating disk and, once detected by the fiber optic sensor, trigger the industrial camera to capture an image. The indicator on the front side of the chip is used to identify the position of the first pin. Accurate detection of this circular mark is essential. Therefore, the YOLOv8 network is used to detect the position of the chip mark. When the indicator is positioned in the lower-left corner, chips continues to move forward and is placed into the tray by a robotic arm to proceed to the next inspection process. Otherwise, the chip is blown back to the vibrating disk by air holes. The detection continues until all the chips on the vibrating disk are checked. The company requires an image processing speed of 200 pcs/min, and to improve the speed of image capture and transmission, the image resolution is set to 304 pixels × 168 pixels.
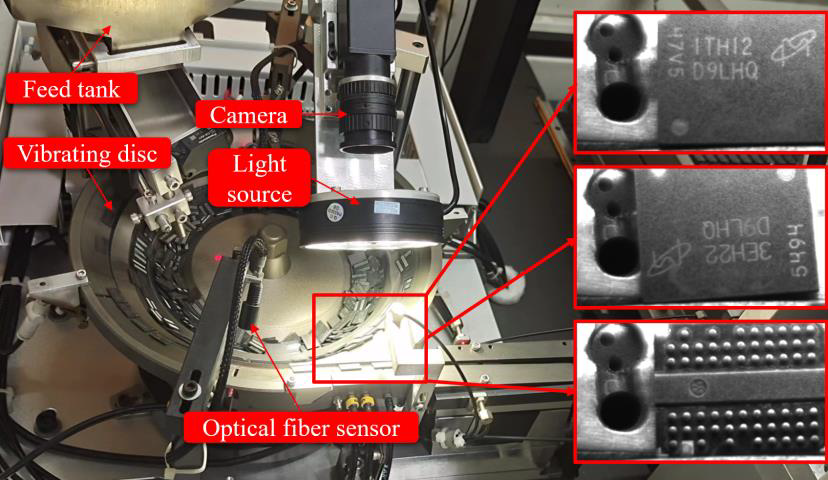
Figure 1: Experimental platform for chip symbol detection
In practical applications, low-resolution images may hinder deep learning models from effectively capturing and identifying critical features, thereby impacting the ultimate detection performance. To surmount this challenge, the paper introduces SRGANext technology, enhancing the quality and clarity of chip marker images significantly. The specific process is illustrated in Fig. 2, where a 128 * 128-sized block is extracted from the image’s bottom-left corner, and the circular marker is magnified. If the template matches the marker in this region, it indicates correct positioning. The YOLOv8 model uses the Letterbox [19] function to process images to fit the model’s input size. This function maintains the original aspect ratio of the image by adding padding on one or both necessary sides to adjust the size to meet the input dimensions. This method introduces additional non-informative areas, reducing the effective resolution. Therefore, to improve recognition accuracy, this paper first enlarges the image to 512 × 512 before inputting it into the YOLOv8 model. To enhance the clarity of the enlarged image, a super-resolution magnification method based on the SRGANext network is used. The images are then annotated to construct a training set for network training, followed by chip detection.
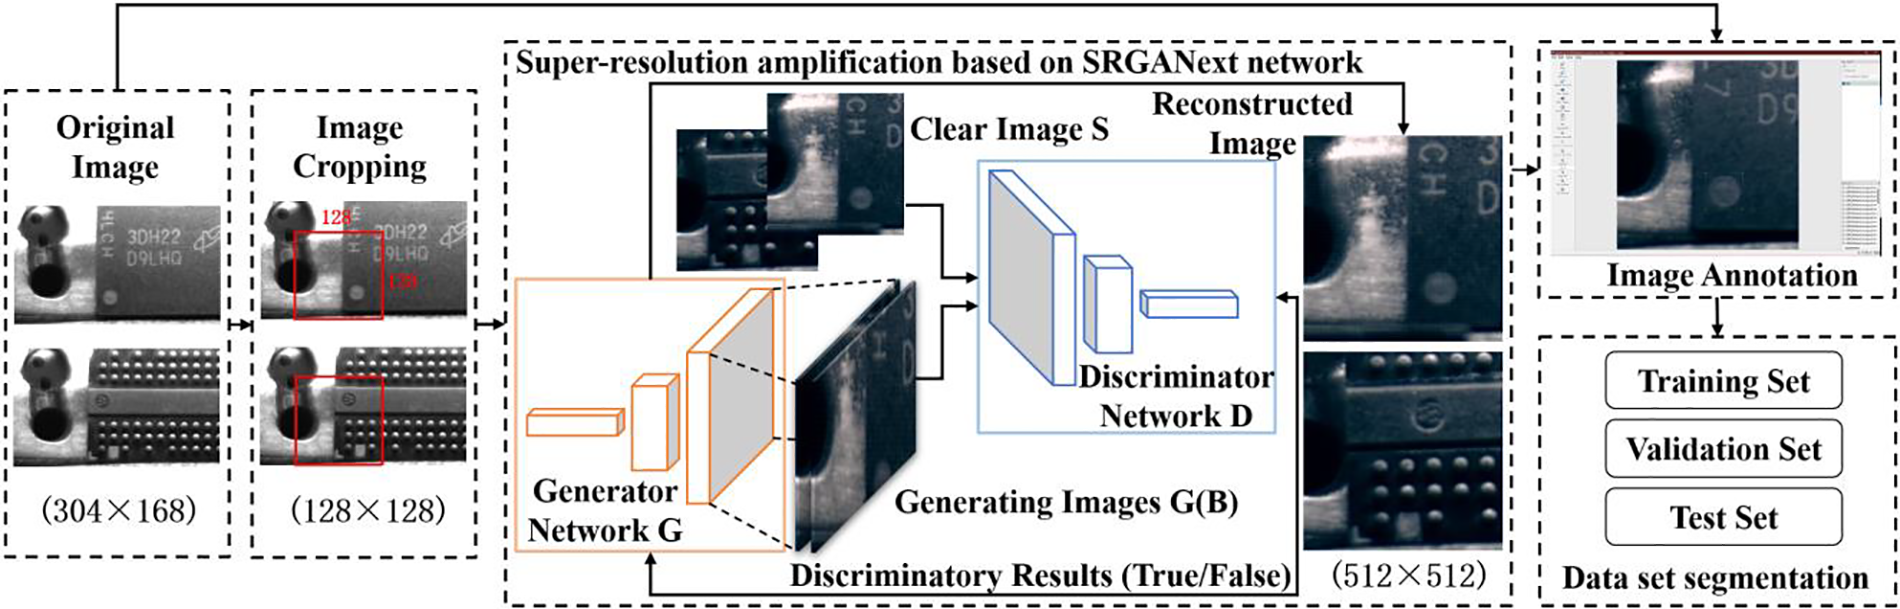
Figure 2: Overall framework for data preprocessing
The SRGANext architecture represents an enhanced iteration of the Super-Resolution Generative Adversarial Network (SRGAN) [20], with structural improvements facilitated by the Convnext [21] network. It comprises a generative network and a discriminative network. The framework takes in low-resolution images with three channels, and the generator network reconstructs high-resolution images from these. The discriminator serves as a tool to help the generator produce better quality images. The discriminator only guides the generator during the training phase. In the inference stage, the generator independently reconstructs high-resolution images. The specific structure is illustrated in Fig. 3.
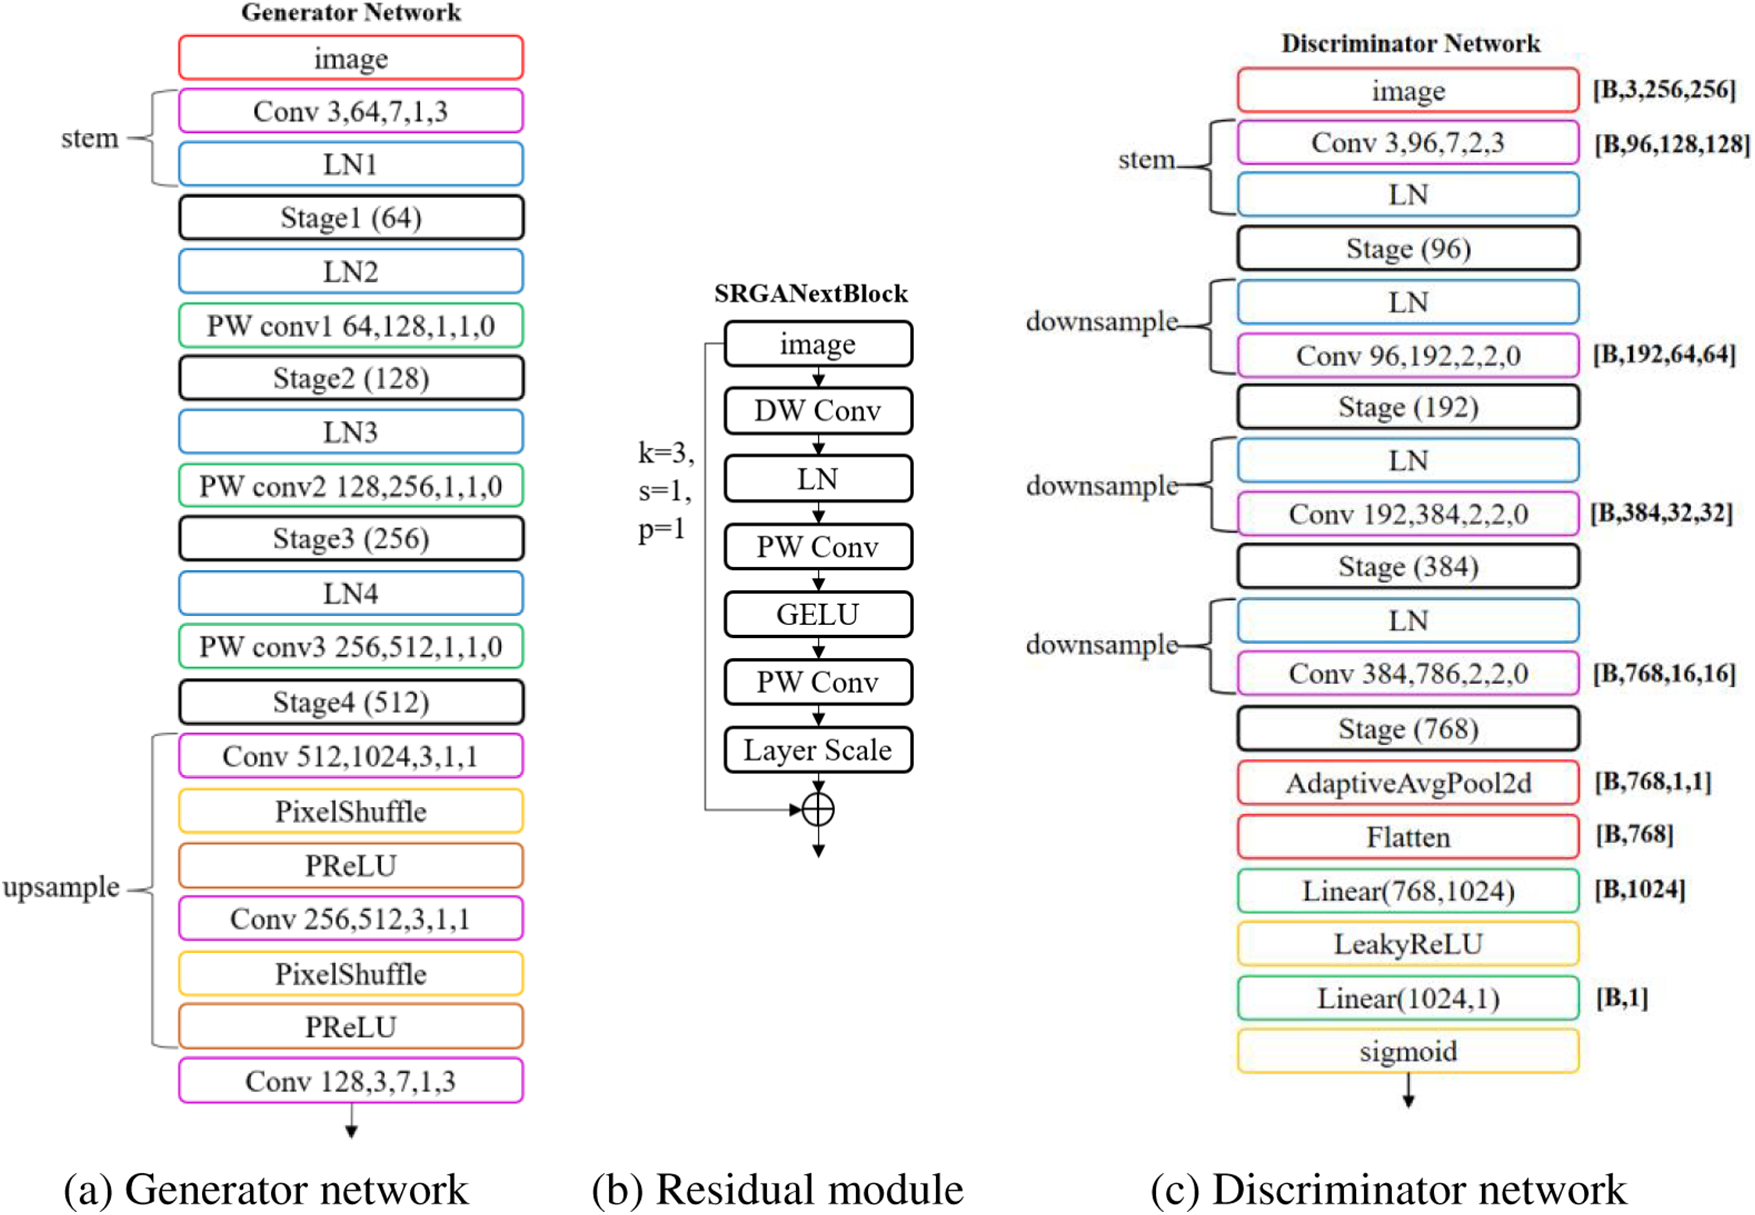
Figure 3: SRGANext network architecture
The generative module in the SRGANext architecture is derived from the Convnext network, incorporating internal adjustments in channel quantity, as illustrated in Fig. 3a. The generator network sequentially goes through a stem module, four Stage modules, and an upsample module. Each Stage module contains a certain number of SRGANext Block modules in the ratio of 3:3:9:3. As shown in Fig. 3b, the SRGANext Block is a residual module that includes DW Conv and PW Conv for adjusting the channel count. Additionally, the LayerNorm component is employed for channel-wise normalization, thereby diminishing the model’s intricacy and lessening computational demands.
The discriminative component within the SRGANext architecture draws inspiration from the SRGANext Block as its foundational module. It incorporates Depthwise Convolution modules that substantially decrease the parameter count and diminish the interdependence among channels, thereby expediting model training, as illustrated in Fig. 3c. Unlike the generator, the discriminator network undergoes downsampling, reducing the feature map size to half of its original. Ultimately, it undergoes global average pooling for feature map size reduction to 1 × 1, bringing the reconstructed representation closer to the actual image. Fig. 4 shows the image reconstruction effect of the SRGANext network after 100 training cycles, demonstrating a notable improvement in the resolution ratio of the reconstructed images.
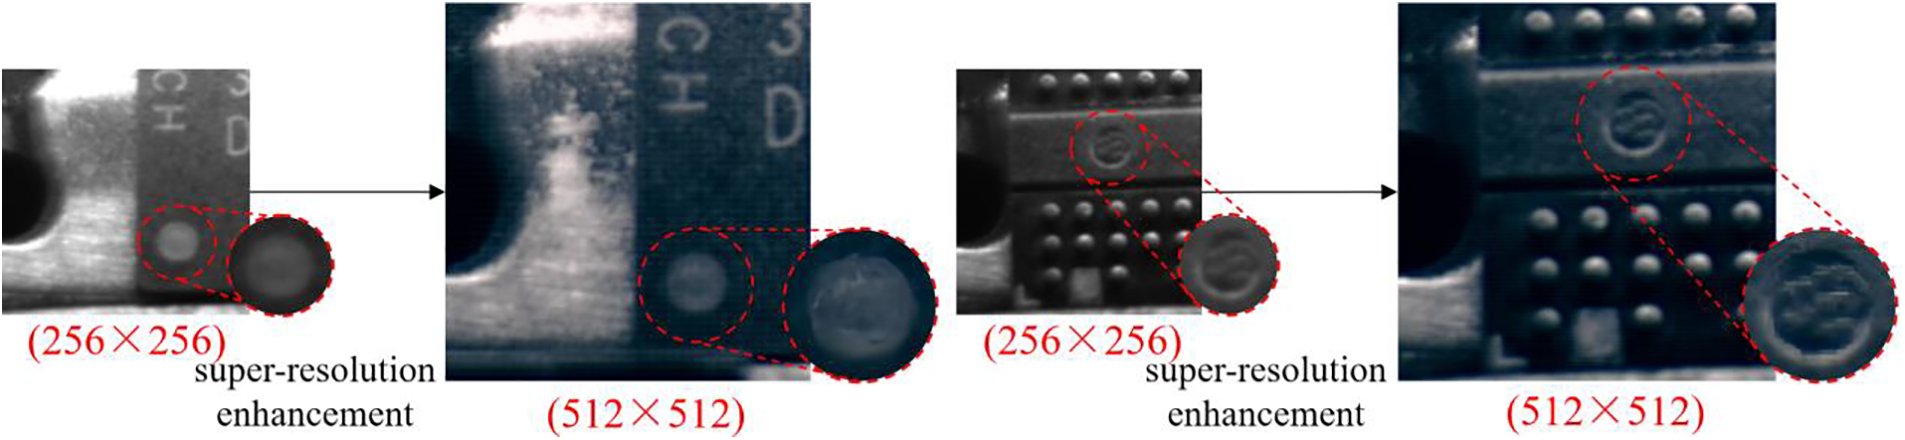
Figure 4: SRGANext network processing effect
In this study, inputting low-resolution ratio chip marker images into the SRGANext network effectively increases pixel density, thereby enhancing image clarity and detail. This super-resolution enhancement technology not only aids in compensating for information loss caused by low resolution in deep learning models but also strengthens the accuracy of the model in chip marker detection tasks.
2.3 Van-YOLOv8 Detection Model
The challenge of detecting small and heavily worn markings on recycled chips has given rise to issues of false positives and negatives, underscoring the pressing need for enhanced precision in detection. At the same time, prevalent target identification methodologies present issues such as heightened intricacy and considerable computational demands, rendering the deployment of algorithms on edge devices notably challenging. Therefore, this paper proposes a lightweight YOLOv8s network structure, namely Van-YOLOv8, as illustrated in Fig. 5, to address these issues.
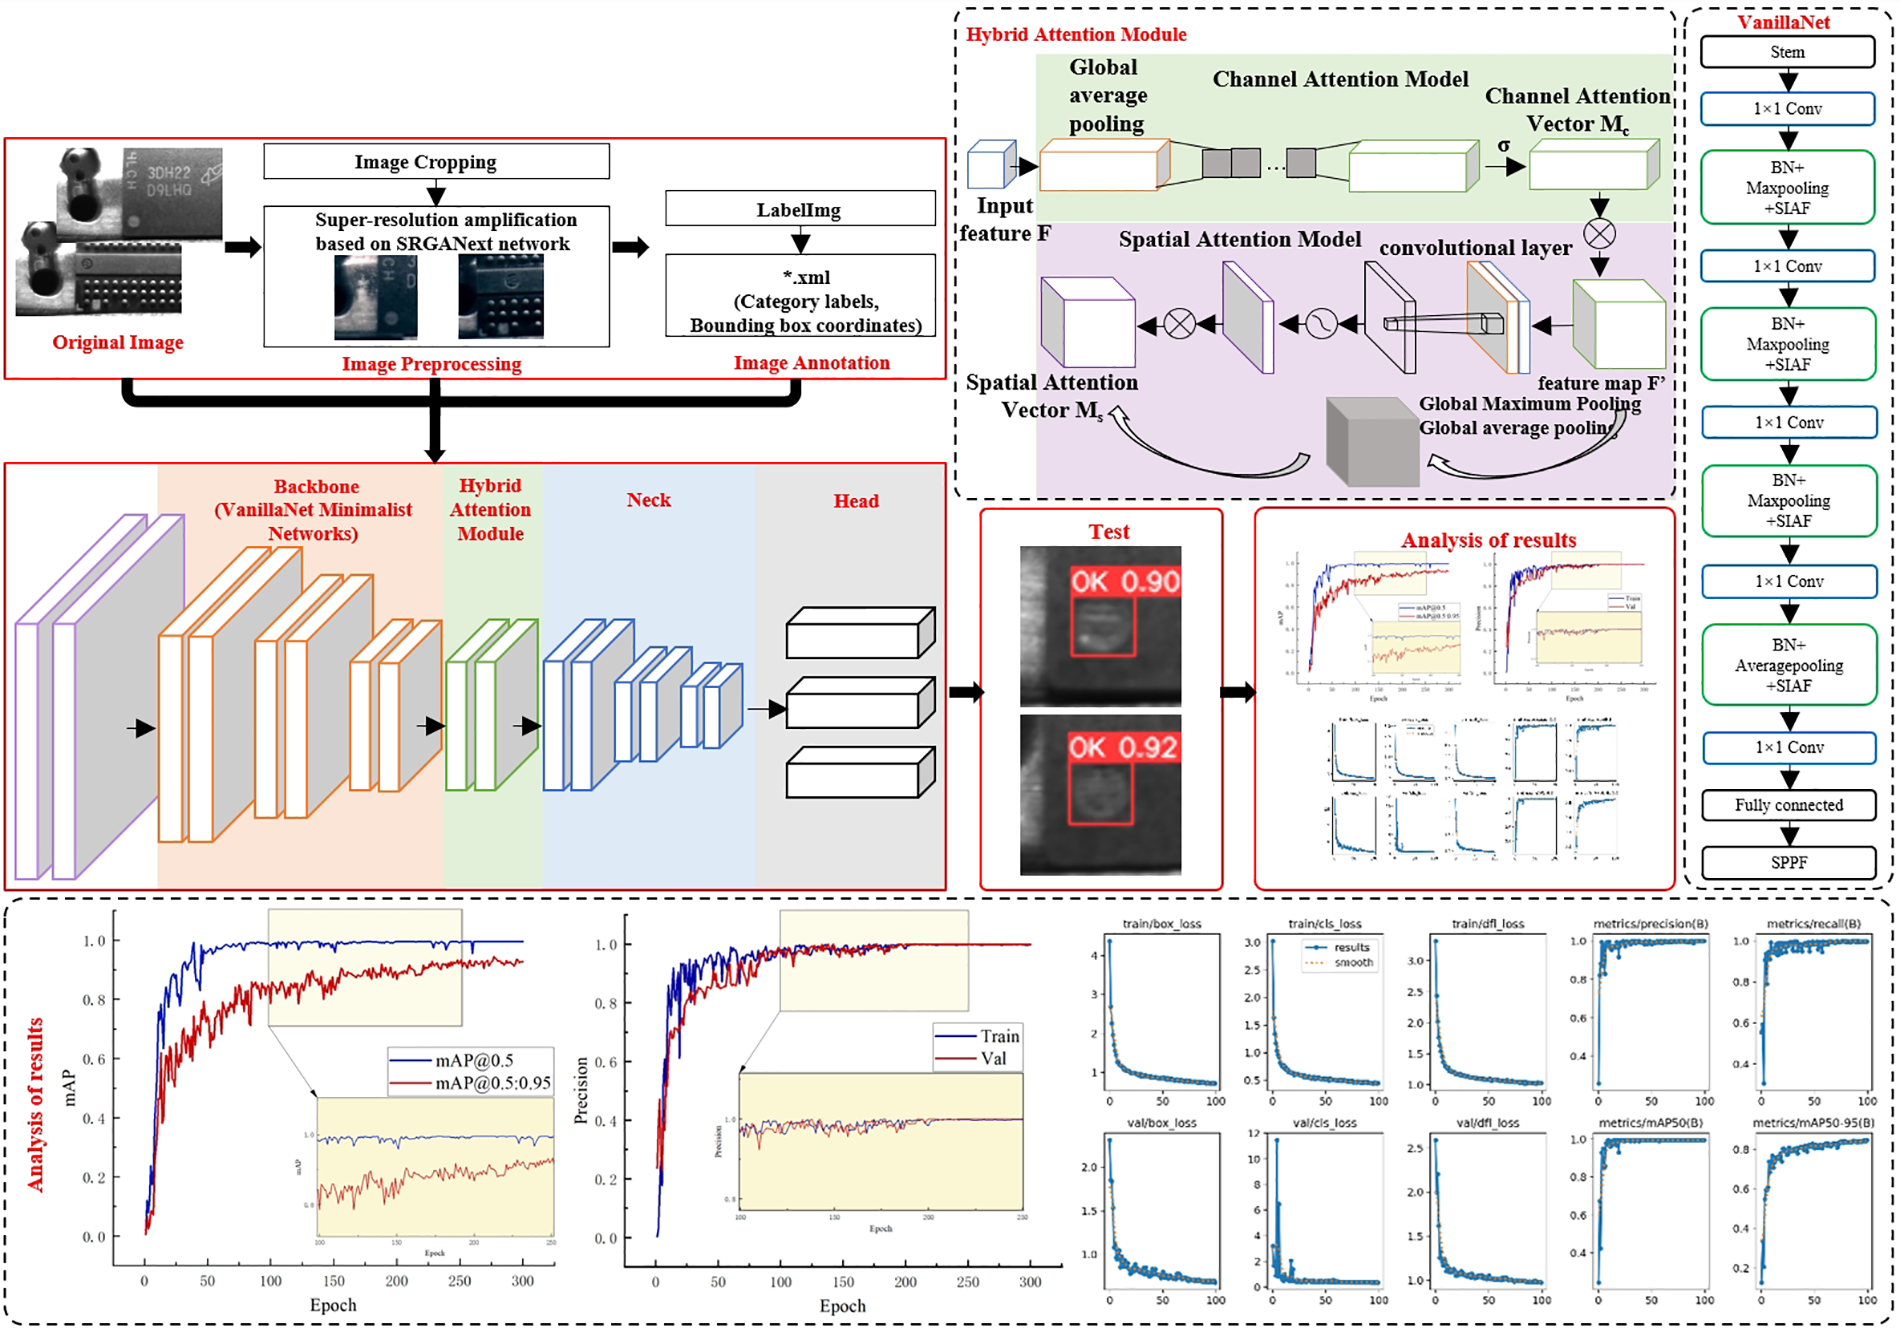
Figure 5: Topology of the Van-YOLOv8 model
The primary detection process involves three key steps: Image preprocessing, model refinement, and model testing. In the first step, low-resolution ratio images undergo super-resolution ratio enlargement to reconstruct a high-quality dataset. After selecting specific images, the circular markings within them are annotated using the LabelImg annotation software. Notably, some heavily worn chips that, even after preprocessing, fail to exhibit a complete marking are manually identified, with those meeting the circular marking criteria deemed qualified. Transitioning to the subsequent stage, the categorized images, both after preprocessing and in their original state, are utilized for the training and validation procedures, and subsequently input into the Van-YOLOv8 model for training. The detection framework consists of a simplified VanillaNet, an amalgamated Attention Mechanism (HAM) element, and the YOLOv8s convolutional neural architecture component. The VanillaNet significantly reduces the model’s volume, thus lowering computational resource demands. The backbone network, augmented with the HAM module at the bottom, enhances feature extraction capabilities. The input is processed through the Neck network and detection head, ultimately providing predicted bounding box coordinates and class labels for the targets. In the third step, the trained model undergoes evaluation using the test set, allowing for an analysis of its detection performance.
2.3.1 Baseline-YOLOv8s Network
In this manuscript, we utilize the single-stage detection algorithm YOLOv8s as the reference model. As illustrated in Fig. 6, this framework comprises three fundamental elements: Backbone architecture, Neck module, and Head component. In the Backbone architecture, in contrast to YOLOv5, YOLOv8s adopts a more lightweight C2f module in lieu of the C3 module. In the Neck network, YOLOv8s omits the 1 × 1 convolutional downsampling unit observed in YOLOv5 and substitutes the C3 with a C2f. In the Head network, YOLOv8s utilizes a disentangled head configuration, segregating the tasks of classification and regression, and shifts from Anchor-Based to Anchor-Free.
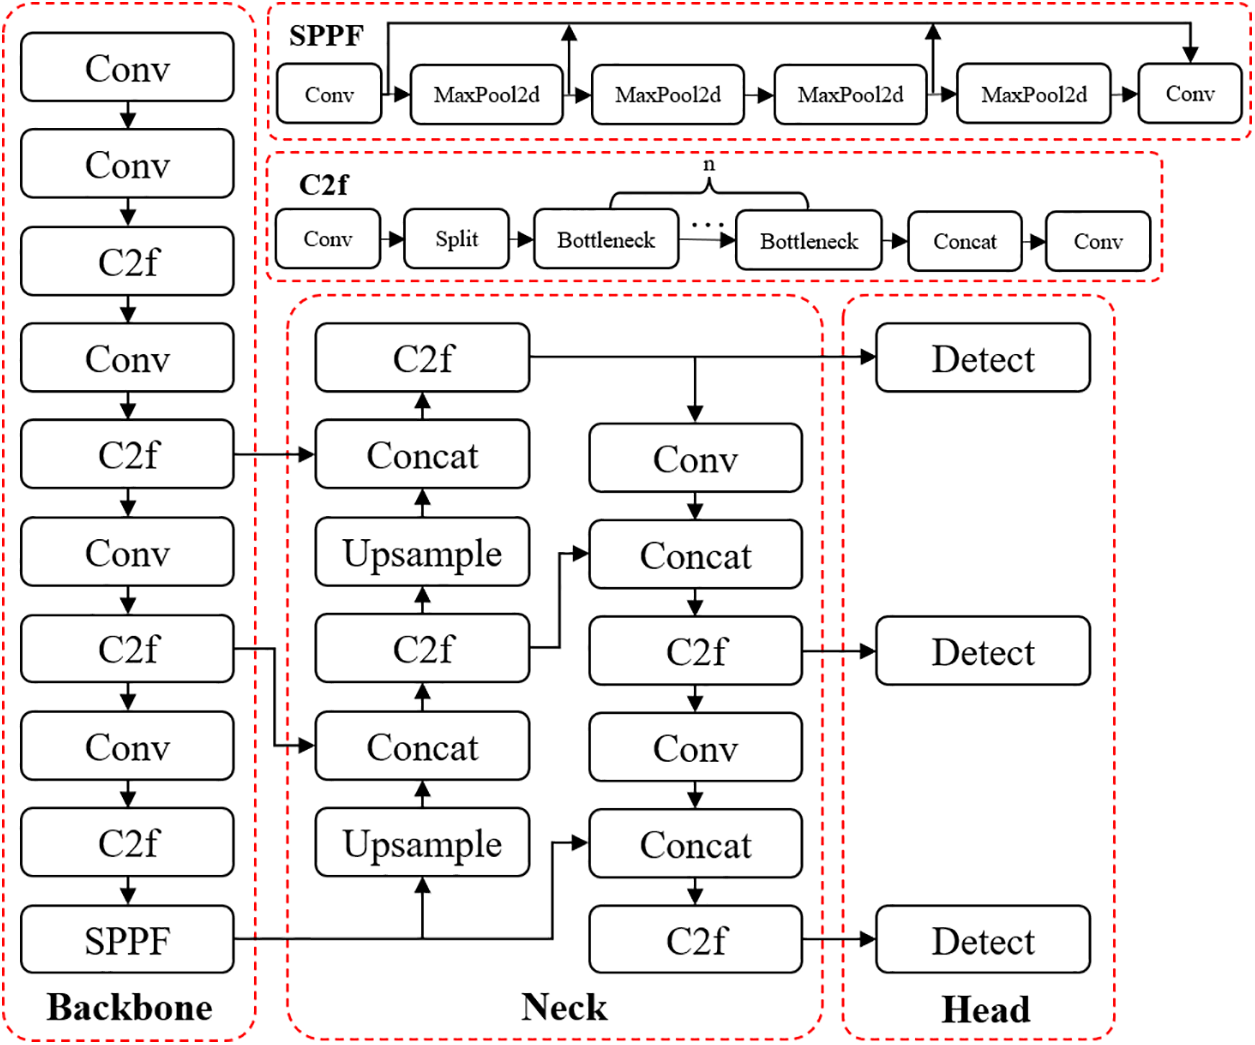
Figure 6: YOLOv8s network structure diagram
2.3.2 Integrated VanillaNet Minimalist Network
Considering the limited computational resources typically found in endpoint devices within conventional enterprises, deploying complex chip marker detection models that demand significant computing power often becomes a constrained task. In response to this challenge, this paper addresses the issue by introducing a streamlined neural network module, VanillaNet, into the backbone feature extraction network of the baseline model YOLOv8s. In contrast to intricate residual and attention modules, VanillaNet comprises basic convolutional and pooling layers, eliminating complex connections and skip connections. Such a design streamlines the network structure, significantly reducing the model’s volume and parameter count, consequently lowering the computational intricacy.
The architecture of VanillaNet is depicted in Fig. 7 (using a 6-layer structure as an example), and it mainly consists of three parts: A backbone block, which converts the input image from 3 channels to multiple channels and performs downsampling; a main body that extracts useful information; and a densely connected layer for generating classification results. For the backbone block, a 4 × 4 × 3 × C convolution layer with a stride of 4 is used to downsample the original 3-channel image into a feature map with C channels. In the primary segments—stage 1, stage 2, and stage 3—max-pooling layers with a 2-unit stride are implemented to modify the dimension of the feature map and double the number of channels from the preceding layer. In stage 4, an average pooling operation is employed without augmenting the channel quantity. Finally, the fully connected layer outputs the classification result.
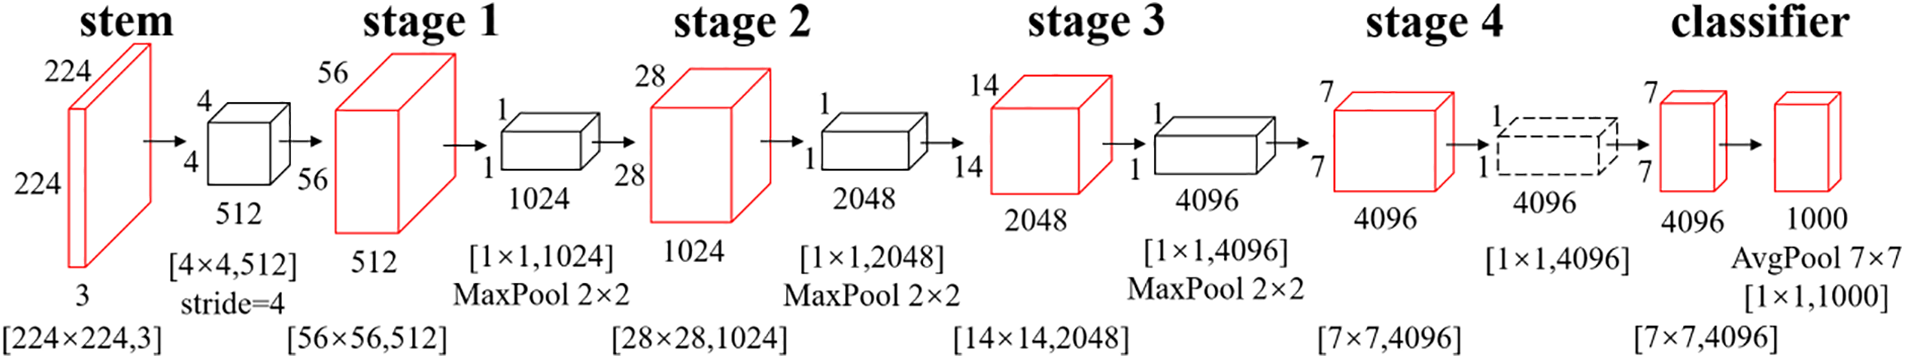
Figure 7: VanillaNet network structure
To preserve feature map information at each layer while minimizing computational costs, we opted for 1 × 1 convolutional kernels. Following each 1 × 1 convolutional layer, we applied the Series Informed Activation Function (SIAF), expressed mathematically as shown in Eq. (1). This choice aims to effectively activate the neural network’s response, rendering the network more flexible and responsive during the information propagation process. To further simplify the training process, we introduced batch normalization after each convolutional layer.
Here, n denotes the quantity of cascaded activation functions, and
2.3.3 Introduction of Hybrid Attention Mechanisms
In order to concentrate on the regions of the image that include circular marks, to enhance the network’s feature extraction capabilities, a HAM module is utilized. HAM incorporates an attention mechanism, integrating both channel and spatial attention mechanisms to retrieve crucial relevant details from initial images’ channel and spatial properties. In contrast to traditional attention mechanisms, this approach is more flexible and adaptive, offering a balance between adaptability and computational efficiency.
Part A: Channel Attention (CAM). Channel attention chiefly concentrates on modifying the weights of individual channels at each spatial location. Channel attention distributes weights to convolutional feature maps. Following the convolution of the original image, global average pooling is executed to derive a vector with dimensions [C,1,1]. The resulting tensor quantity undergoes convolutional and activation processes to produce the weight vector corresponding to the channels ‘s’. As depicted in Fig. 8, the [C, H, W] dimensional input feature ‘X’ undergoes global average pooling (GAP) for dimension reduction and information condensation. Interactions among neighboring channels are delineated by contemplating each individual channel alongside its surrounding ‘k’ channels. Efficient prediction of channel-based attention mechanism is achieved through a Conv1D convolution employing a kernel with dimensions ‘k’ × ‘k’, where the kernel dimension is proportionate to the channel dimension ‘C’. The input representation map ‘X’ undergoes multiplication with the weight vector ‘s’ associated with channels to produce the output representation map ‘Y’. The equation is expressed as [22]:
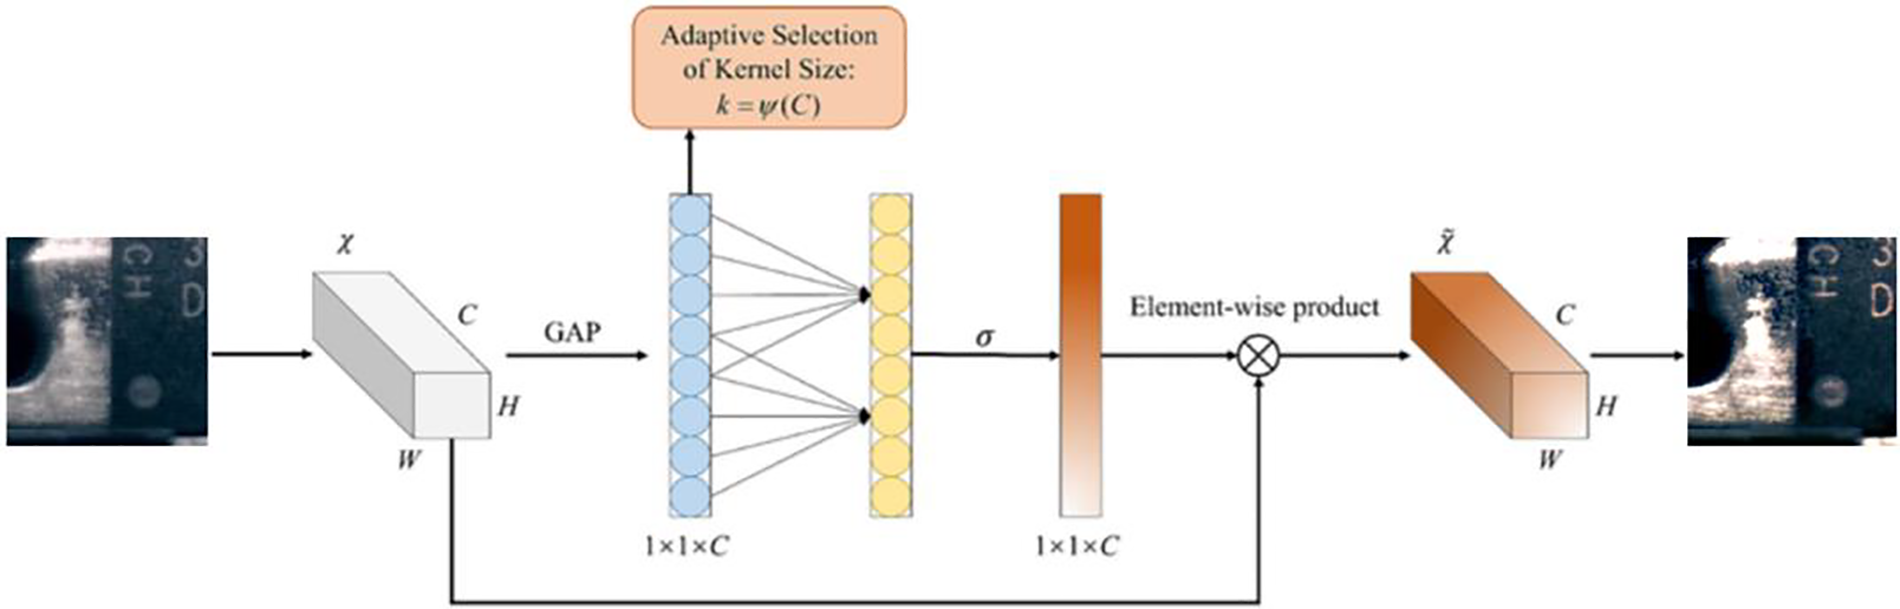
Figure 8: CAM diagram
Here, σ represents the Sigmoid activation operation. The dimension of the convolutional kernel k adjusts proportionally to the channel dimension, with the model parameters γ = 2 and b = 1. The symbol ‖odd specifies that k must exclusively be positive odd integers. The adopted channel attention strategy in this investigation utilizes a regional inter-channel communication approach, maintaining optimal effectiveness while concurrently diminishing model complexity.
Part B: Spatial Attention (SAM). Spatial attention is concerned with adjusting the importance of different spatial positions within each channel. The attention mechanism based on spatial attributes filters out less relevant portions of the background in an image and directs attention towards and transforms regions of significance. In Fig. 9, the feature maps are subjected to processing through Max Pooling (MaxPool) and Mean Pooling (AvgPool) to produce two arrays with dimensions [1,H,W], aggregating every channel at the same representation point. The pair of representation maps are later merged to generate a unified representation map with dimensions [2,H,W], and subsequently transformed to [1,H,W] through a convolutional stratum. The spatial influence is employed to modulate the original feature map with dimensions [C,H,W] for refinement. By backpropagating the effective receptive field to the initial image, the network can dynamically concentrate on crucial portions [23].
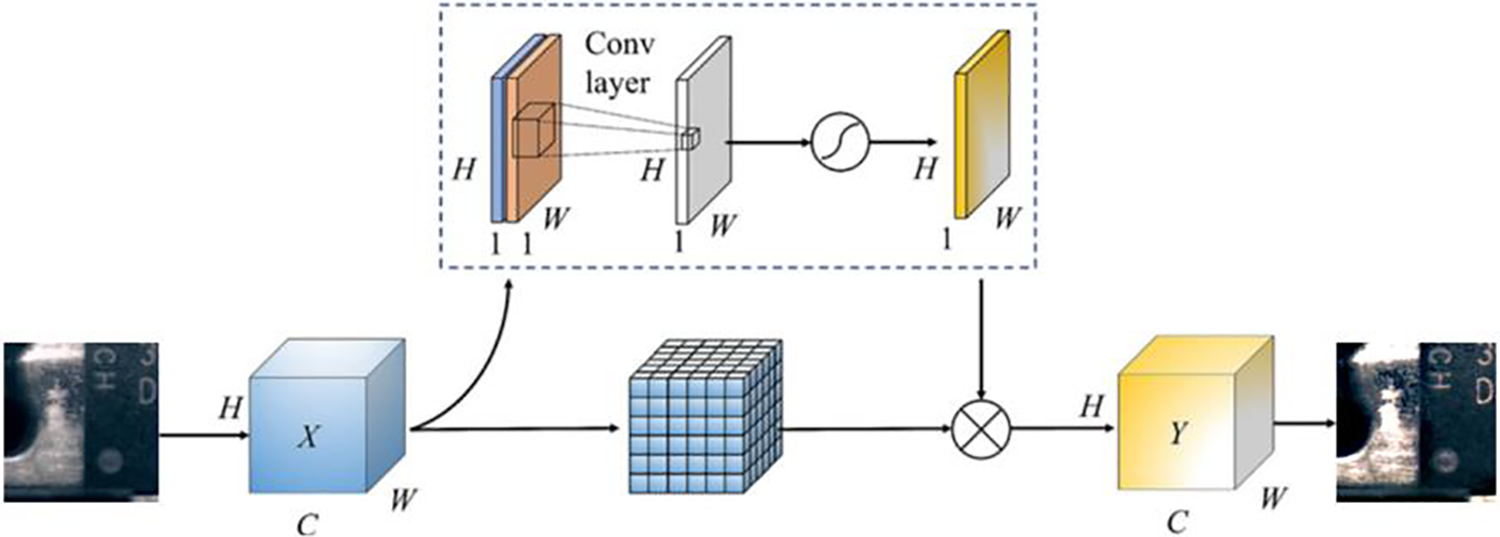
Figure 9: SAM diagram
Here, fn×n denotes a convolutional operation employing a kernel dimension of n × n. X represents the input representation map, while Y indicates the resulting representation map. G(X) denotes the segmentation of the input representation map into a lattice of points.
The Van-YOLOv8 network is deployed and trained on the TensorRT (version 8.4) framework, using FP16 optimization mode. The experiment employed an NVIDIA GeForce RTX 3060 GPU; an Intel Core i7-12700H CPU with a base frequency of 2.70 GHz and 16 GB of RAM; the operating system was Windows 11. The programming software used was PyCharm 2021.3.1, and the CUDA version was 11.8. The dimensions of the input image were configured to 512 pixels × 512 pixels, with the count of iterations (Epoch) designated as 300. The size of the training batch was established as 8, while the quantity of threads (Num workers) was defined as 4. During the model training process, the weights trained on the COCO dataset were used as pre-trained weights. Additionally, 600 images generated by the SRGANext network were utilized as training samples for the detection model, with a subset of 150 original images employed for testing and validation purposes.
In this experiment, we introduced evaluation criteria for gauging the efficacy of image reconstruction and object detection. To evaluate the fidelity of reconstructed images, this study incorporates two metrics: Structural SIMilarity (SSIM) and Peak Signal-to-Noise Ratio (PSNR).
Here, l, c, and s denote the resemblance in brightness, contrast ratio, and composition, respectively. MSE stands for Mean Square Error.
For measuring the performance of object detection, this paper introduces five evaluation metrics: Detection precision (Precision), mean Average Precision (mAP), Frames Per Second (FPS), model parameter count (Params), and computational load (GFLOPs).
Here, TP refer to correctly identified positive instances. FN indicate incorrectly missed positive instances. FP signify incorrectly identified negative instances. k symbolizes the quantity of categories, and AP(i) denotes the Average Precision value corresponding to the i-th category. ElapsedTime encompasses the total duration for image preprocessing, inference, and post-processing. Floating Point Operations Per Second (FLOPs) correspond to the quantity of floating-point operations conducted. C0 signifies the count of resultant channels, Ci denotes the quantity of initial channels, kw denotes the convolution kernel width, and kh indicates the convolution kernel height.
3.2 Effectiveness of Image Preprocessing
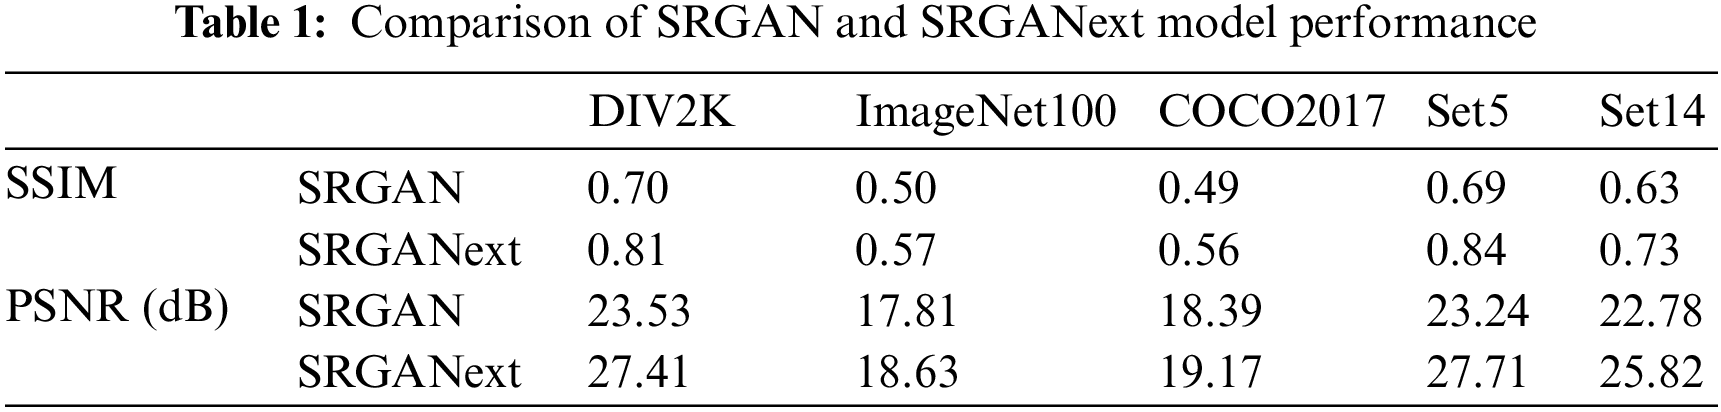
In this part of our study, we examine how well the SRGAN and SRGANext models reconstruct images across various datasets. We tested these models using several datasets: DIV2K, ImageNet100, COCO2017, Set5, and Set14. According to Table 1, the SRGANext framework uniformly surpasses the SRGAN framework in both SSIM and PSNR across all these datasets. These metrics are important for evaluating the quality of image reconstruction.
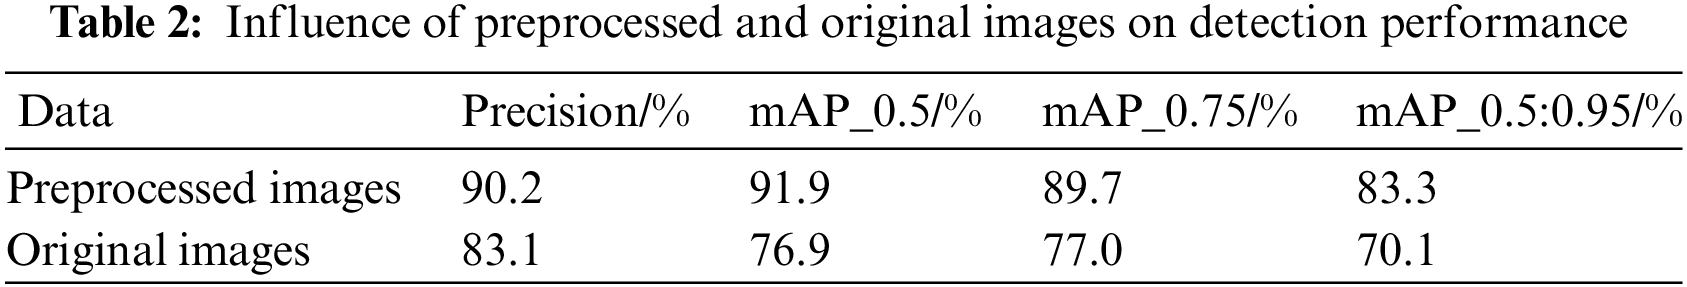
Moreover, this study delves into a comprehensive examination of the comparison between images preprocessed using the SRGANext network and the original images in the Van-YOLOv8 model for chip datasets. The preprocessed images exhibit sharper and more accurate features in chip marker detection tasks, contributing to an improved ability of the model to recognize subtle markings. Table 2 clearly illustrates the substantial improvements of preprocessed images over original images across various performance metrics, emphasizing the notable role of SRGANext preprocessing in enhancing chip marker detection effectiveness.
In this study, YOLOv8s is employed as the foundational model, and the VanillaNet element is integrated into the core feature extraction network to streamline the model’s intricacy. Simultaneously, a HAM is incorporated to focus on local information and enhance feature extraction capabilities. To affirm the efficacy of the enhancements implemented on the foundational model, ablation studies were conducted from two perspectives:
1) Derived from the foundational model, each enhancement module was introduced one at a time to validate the influence of individual modules on model identification accuracy, number of parameters, detection speed, etc.
2) In the conclusive model (Van-YOLOv8), each enhancement module was systematically excluded one by one (except for the exclusion of the VanillaNet module) to evaluate the influence of specific improvement modules on the final model’s performance. The outcomes of the experiments are illustrated in Table 3.
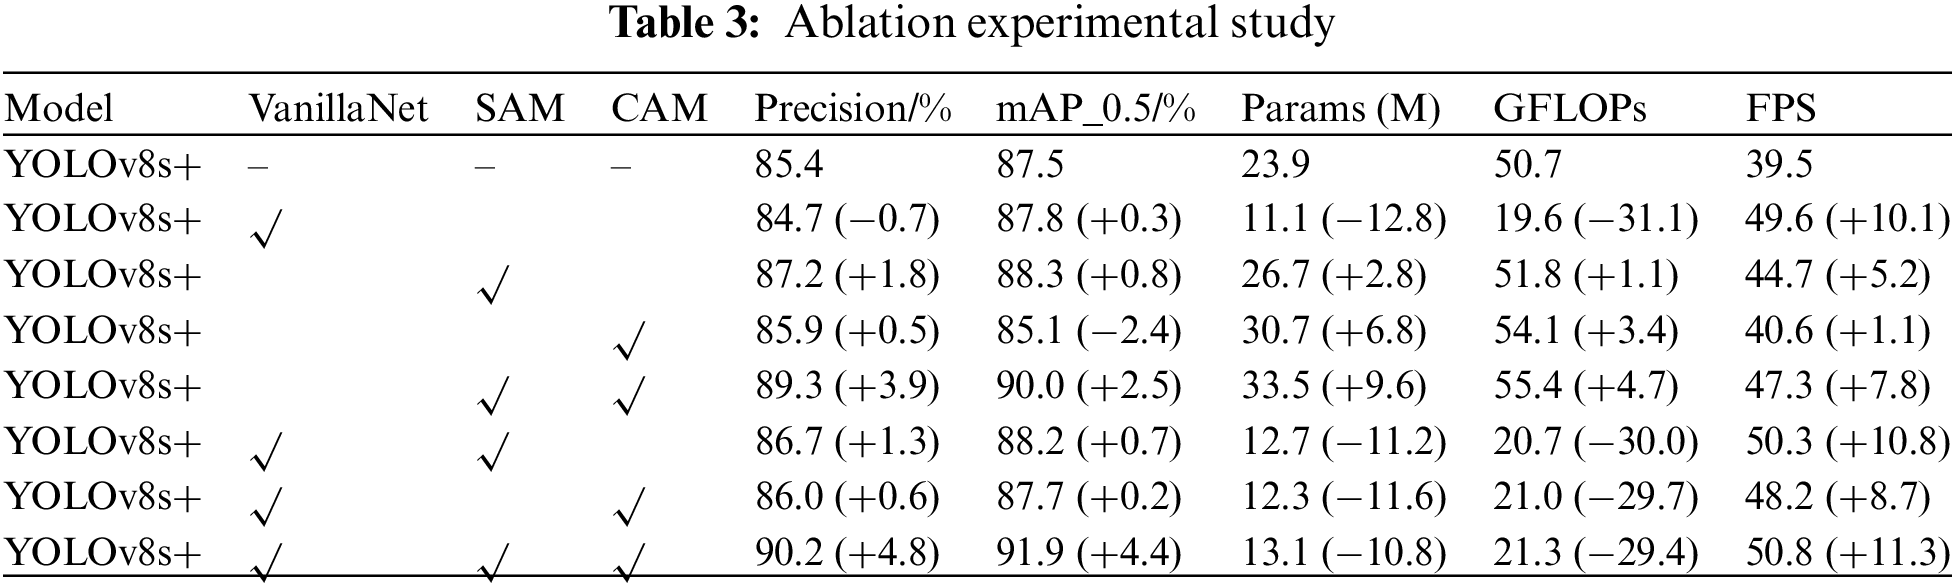
The experimental findings indicate that by exclusively integrating the VanillaNet component within the feature extraction network of the backbone, the parameter count decreased from 23.9 M in the baseline to 11.1 M, resulting in a reduction of 12.8 M. VanillaNet uses a sequence of convolution-pooling structures to extract features, without direct connections between different blocks. The feature map is continuously downsampled through convolution and pooling layers to subsequent blocks, avoiding branched structures and thereby reducing a significant amount of computation. Hence, incorporating the simplified VanillaNet module into the backbone for feature extraction efficiently diminishes the model’s intricacy and enhances inference speed. Furthermore, integrating the HAM component within the structure explicitly establishes the interrelation among image channels and spatial dimensions. It aggregates information from multiple convolution kernels in a nonlinear manner, focusing more quickly on local information. The HAM module, composed of SAM and CAM, only slightly increases the parameters and computational cost, enhancing the model’s inference velocity. The ultimate model proposed in this manuscript, incorporating both the VanillaNet and HAM modules, achieves a detection accuracy of 90.2% and an mAP of 91.9%, respectively, increasing by 4.8% and 4.4%. Moreover, the final model maintains a lower number of parameters and computational load, only 54.8% and 42.0% of the baseline, with an FPS increase of 11.3 fps compared to the baseline. In summary, the lightweight chip mark detection model presented in this study efficiently simplifies the model’s structure while preserving robust detection accuracy and real-time efficiency.
3.4 Comparison with Current Advanced Algorithms
In our study, we compared the performance of various advanced object detection algorithms with our Van-YOLOv8 network. This encompassed the two-step algorithm Fast RCNN and various single-step algorithms: SSD, YOLOv4-Tiny [24], YOLOv5s, YOLOv7s [25], and YOLOv8s. The results of these comparative tests are condensed in Table 4.
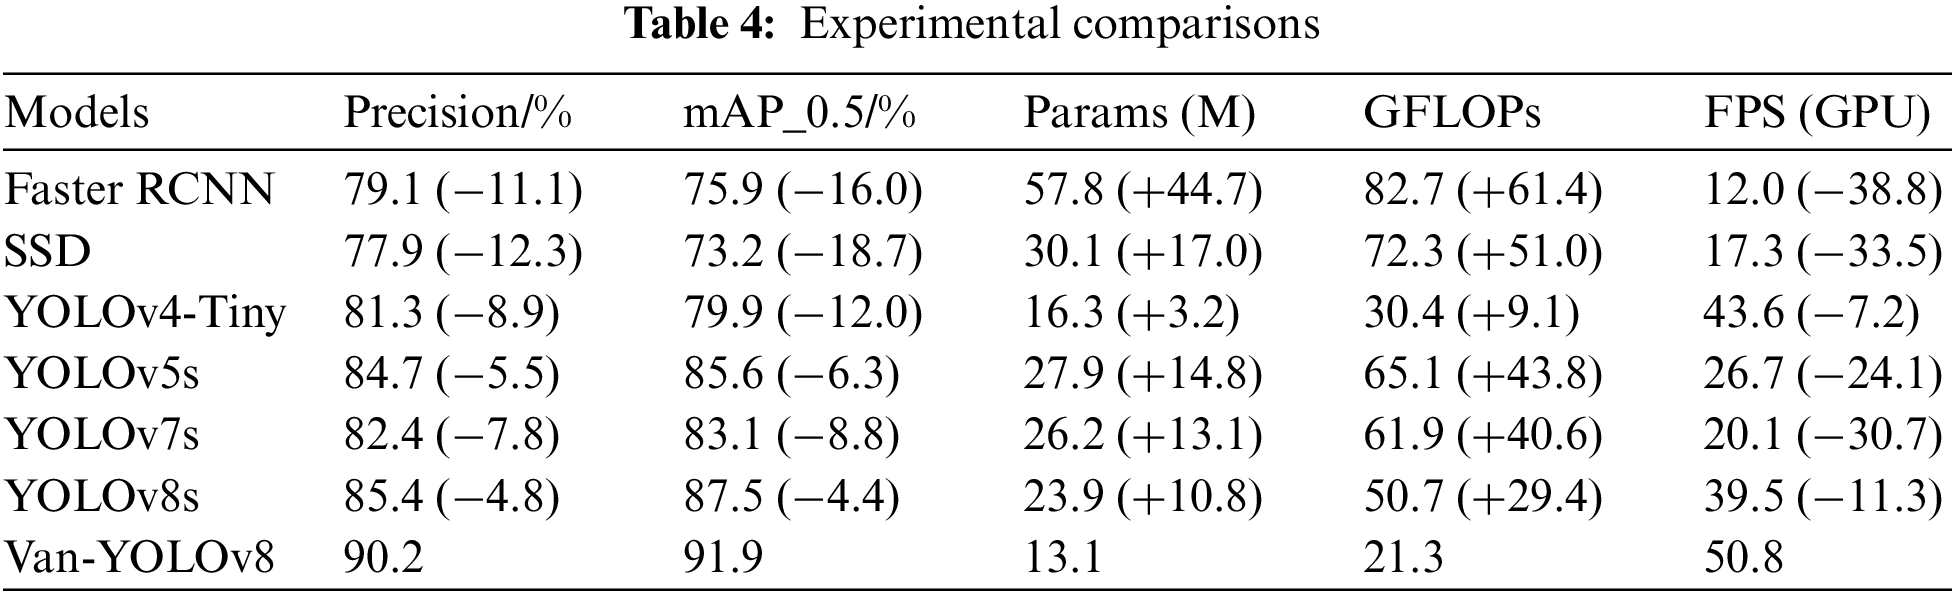
According to the results provided in Table 4, the framework within this investigation demonstrated superior execution concerning detection accuracy, mAP, model parameter count, computational load, and FPS. Compared to the baseline YOLOv8s, it increased detection accuracy by 4.8%, mAP by 4.4%, diminished the quantity of model parameters by 10.8 M, and lowered the computational load from 50.7 GFLOPs to 21.3 GFLOPs, a decrease of 29.4 GFLOPs, while FPS increased by 11.3 fps. In comparison with YOLOv5s, another one-stage object detection algorithm, our approach showed even more significant advantages in chip mark detection, with notable improvements in detection accuracy and mAP. The model’s parameter count was reduced by 14.8 M, only 46.9% of YOLOv5s, and the computational load decreased by 43.8 GFLOPs, only 32.7% of YOLOv5s, with an increase of 24.1 fps. Furthermore, Van-YOLOv8 reduces the parameter count by 13.1 M compared to YOLOv7s, 3.2 M compared to YOLOv4-tiny, 17.0 M compared to SSD, and 44.7 M compared to Faster RCNN. The frames per second (FPS) are enhanced by 30.7 fps over YOLOv7s, 7.2 fps over YOLOv4-tiny, 33.5 fps over SSD, and 33.8 fps over Faster RCNN. Additionally, Fig. 10 presents the detection accuracy and mAP curve of the Van-YOLOv8 model training. The curve showing the changes in detection accuracy over iterations indicates that the Van-YOLOv8 model quickly improves in target detection accuracy and can achieve a result close to 1 when stabilized. To more intuitively display the differences between each model, examples of the detection process are illustrated in Fig. 11.
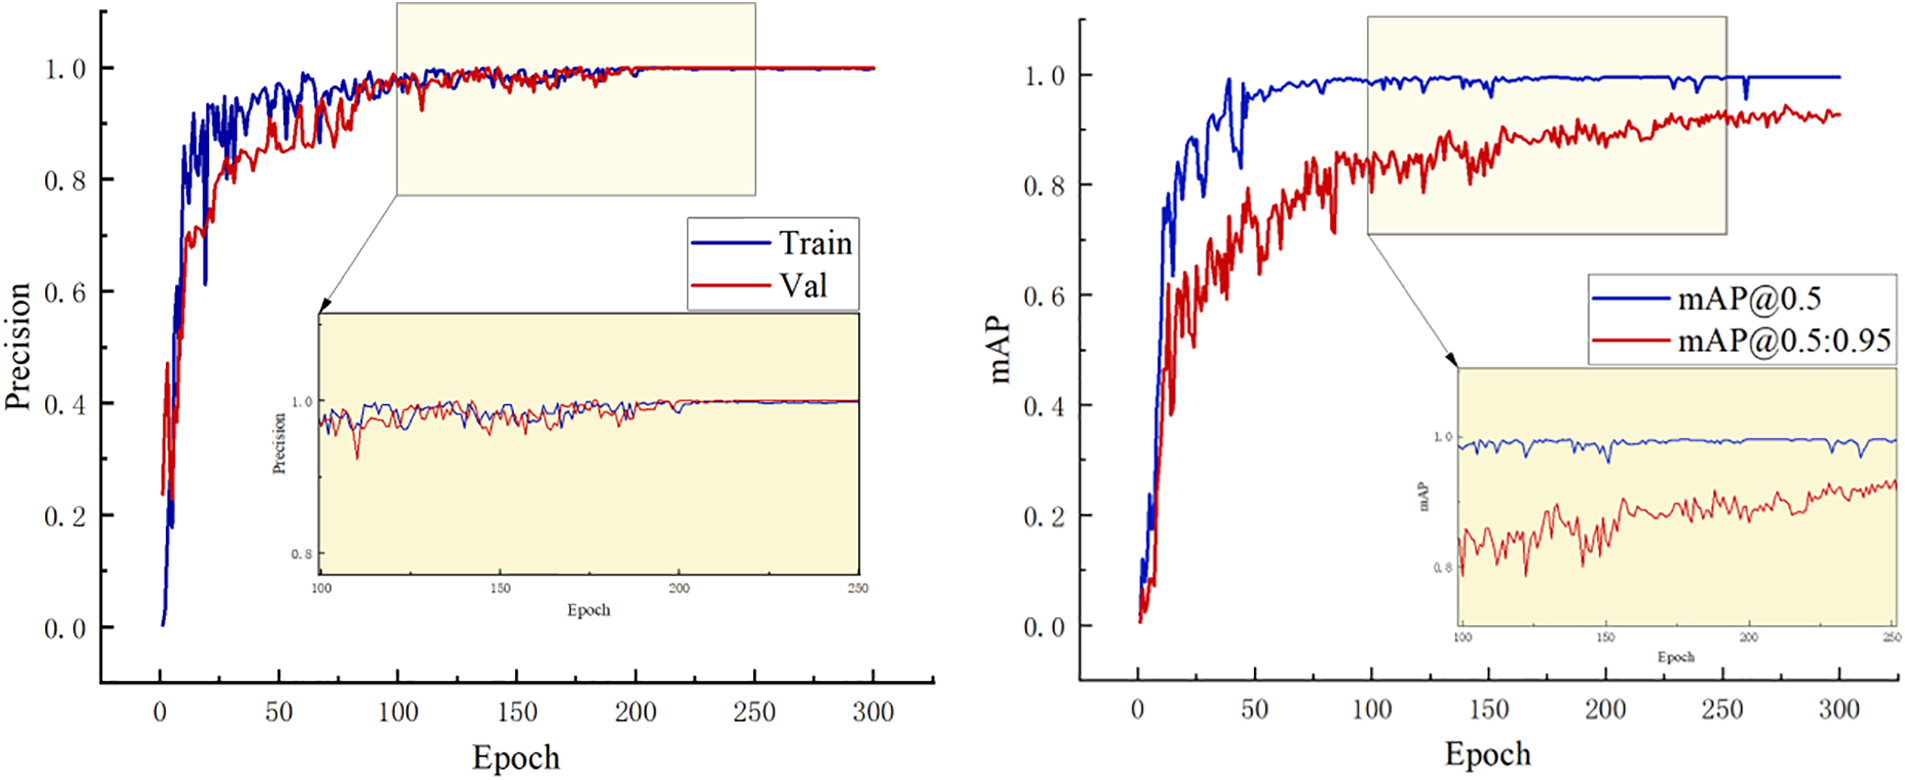
Figure 10: Van-YOLOv8 model training results
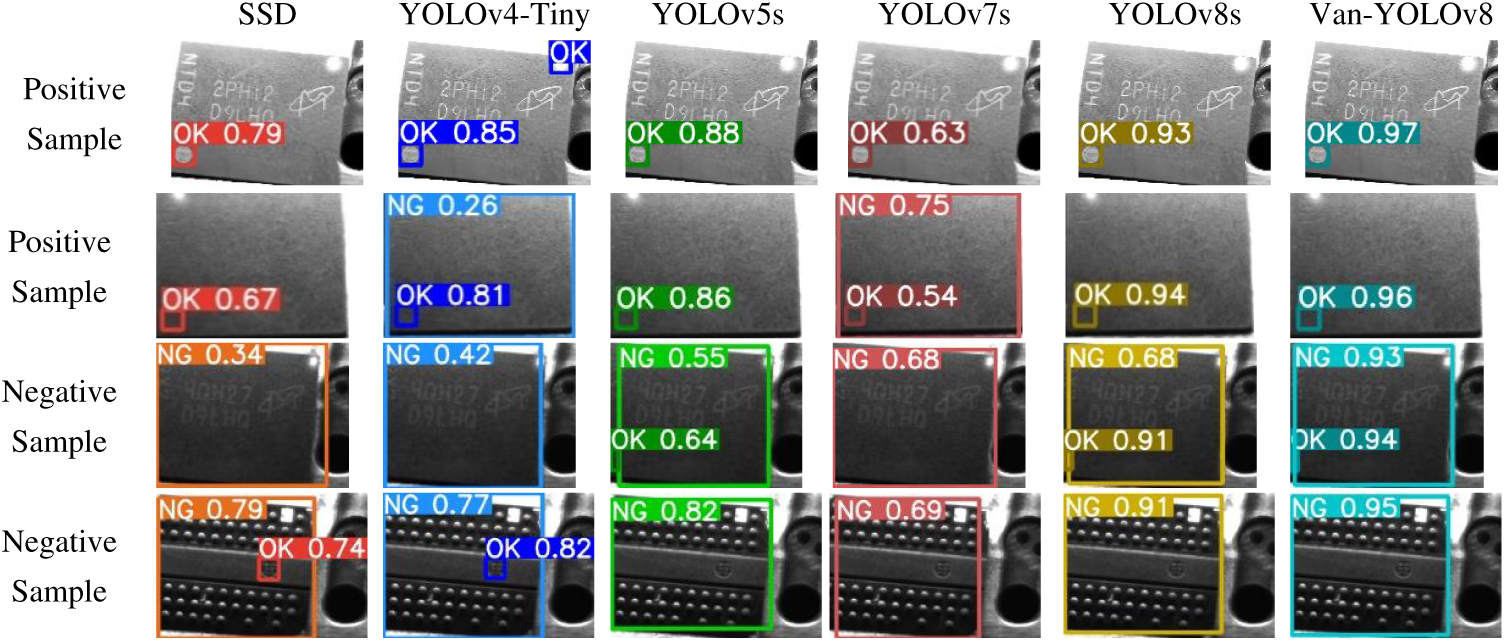
Figure 11: Detection results of different models. The boxes indicate the locations of detected marks, and the numbers signify the model’s confidence level in the detected objects
Through detailed results and comparative analysis, the Van-YOLOv8 model significantly curtails computational costs while ensuring enhanced detection precision compared to other cutting-edge algorithms. This not only underscores the outstanding performance of Van-YOLOv8 in object detection tasks but also indicates its effective management of computational resources while enhancing accuracy. The successful manifestation of this balance highlights the unique design and excellent performance advantages of the Van-YOLOv8 model.
The Van-YOLOv8 model, leveraging SRGANext for processing the chip dataset, integrates VanillaNet and a hybrid attention mechanism, demonstrating outstanding performance in detection accuracy. Simultaneously, Van-YOLOv8 achieves a significant improvement in computational costs, striking a balance between efficiency and performance. This is particularly crucial for implementing target detection tasks in resource-constrained environments, offering a balanced solution that meets high accuracy requirements while effectively managing computational expenses.
While Van-YOLOv8 excels in object detection tasks, its design is more tailored to specific recycled chip detection, and adaptability differences may exist for other types of object detection tasks. Additionally, Van-YOLOv8’s performance is sensitive to certain key hyperparameters, requiring careful tuning for optimal performance, thereby increasing the difficulty of model optimization. In the future of object detection, it is recommended to improve the framework’s versatility to ensure broader applicability in diverse object detection scenarios. Moreover, exploring automated methods for hyperparameter optimization, such as reinforcement learning or optimization algorithm-based auto-tuning tools, can assist in reducing the complexity of model tuning while enhancing performance stability and generalization.
Acknowledgement: We sincerely thank the Scientific Research Funding Project of Liaoning Provincial Department of Education in 2021, the Comprehensive Reform Project of Undergraduate Education and Teaching in Liaoning in 2021, and the Graduate Innovation Fund of Dalian University of Technology for providing the necessary technical support for this research.
Funding Statement: This work was supported by the Liaoning Provincial Department of Education 2021 Annual Scientific Research Funding Program (Grant Numbers LJKZ0535, LJKZ0526), and the 2021 Annual Comprehensive Reform of Undergraduate Education Teaching (Grant Numbers JGLX2021020, JCLX2021008), and Graduate Innovation Fund of Dalian Polytechnic University (Grant Number 2023CXYJ13).
Author Contributions: Study conception and design: Honglei Wei, Meng Huang, Xianyi Zhai; data collection: Meng Huang; analysis and interpretation of results: Honglei Wei, Meng Huang; draft manuscript preparation: Meng Huang. All authors reviewed the results and approved the final version of the manuscript.
Availability of Data and Materials: The data cannot be made publicly available upon publication because they are owned by a third party and the terms of use prevent public distribution. The data that support the findings of this study are available upon reasonable request from the authors.
Conflicts of Interest: The authors declare that they have no conflicts of interest to report regarding the present study.
References
1. Y. Cui, K. Peng, and Y. Y. Yang, “Design of a mobile phone cover plate surface defect detection system based on machine vision,” Manufacturing Autom., vol. 45, no. 7, pp. 75–79, 2023. [Google Scholar]
2. M. L. Yao, X. L. Zhang, and L. J. Xia, “A rapid matching method for parts based on HU features and improved harris corners,” Laser Magaz., vol. 43, no. 5, pp. 139–144, 2022. [Google Scholar]
3. N. Li, L. Ma, and G. Yu, “Survey on evolutionary deep learning: Principles, algorithms, applications, and open issues,” ACM Comput. Surv., vol. 56, no. 2, pp. 1–34, 2023. [Google Scholar]
4. W. Tang, H. Gao, and S. Liu, “Design and implementation of small waters intelligent garbage cleaning robot system based on Raspberry Pi,” Sci. Technol. Eng., vol. 19, no. 34, pp. 239–247, 2019. [Google Scholar]
5. F. T. Liang, Y. Zhou, and X. Chen, “Review of target detection technology based on deep learning,” in Proc. 5th Int. Conf. Control Eng. Artif. Intell., 2021, pp. 132–135. [Google Scholar]
6. R. Girshick, “Fast R-CNN,” in Proc. IEEE Int. Conf. Comput. Vis., 2015, pp. 1440–1448. [Google Scholar]
7. F. Guo, Y. Qian, and D. Rizos, “Automatic rail surface defects inspection based on mask R-CNN,” Transp. Res. Rec., vol. 2675, no. 11, pp. 655–668, 2021. doi: 10.1177/03611981211019034. [Google Scholar] [CrossRef]
8. J. S. Ren and Y. Wang, “Overview of object detection algorithms using convolutional neural networks,” J. Comput. Commun., vol. 10, no. 1, pp. 115–132, 2022. [Google Scholar]
9. P. Y. Jiang, D. Ergu, and F. Y. Liu, “A review of Yolo algorithm developments,” Procedia Comput. Sci., vol. 199, no. 11, pp. 1066–1073, 2022. doi: 10.1016/j.procs.2022.01.135. [Google Scholar] [CrossRef]
10. N. Carion, F. Massa, and G. Synnaeve, “End-to-end object detection with transformers,” in Computer Vision–ECCV 2020: 16th Euro. Conf., Proc., Glasgow, UK, Springer International Publishing, vol. 16, Aug. 23–28, 2020, pp. 213–229. [Google Scholar]
11. X. Li, C. Wang, and H. Ju, “Surface defect detection model for aero-engine components based on improved YOLOv5,” Appl. Sci., vol. 12, no. 14, pp. 7235, 2022. doi: 10.3390/app12147235. [Google Scholar] [CrossRef]
12. S. Wang, H. Wang, and F. Yang, “Attention-based deep learning for chip-surface-defect detection,” Int. J. Adv. Manuf. Technol., vol. 121, no. 3, pp. 1957–1971, 2022. doi: 10.1007/s00170-022-09425-4. [Google Scholar] [CrossRef]
13. S. Zhou, Y. Zeng, and S. Li, “Surface defect detection of rolled steel based on lightweight model,” Appl. Sci., vol. 12, no. 17, pp. 8905, 2022. doi: 10.3390/app12178905. [Google Scholar] [CrossRef]
14. L. Yang, X. Huang, and Y. Ren, “Steel plate surface defect detection based on dataset enhancement and lightweight convolution neural network,” Machines, vol. 10, no. 7, pp. 523, 2022. doi: 10.3390/machines10070523. [Google Scholar] [CrossRef]
15. Z. C. Zhang, “Improved YOLOv5 for lightweight strip steel surface defect detection,” Comput. Syst. Appl., vol. 32, no. 6, pp. 278–285, 2023. [Google Scholar]
16. Y. Zhou, Y. Z. Yan, and H. Y. Chen, “Defect detection of photovoltaic cells based on improved Yolov8,” Laser Optoelectron. Prog., vol. 61, no. 8, pp. 8–25, 2023. http://kns.cnki.net/kcms/detail/31.1690.tn.20230821.1446.128.html [Google Scholar]
17. H. Chen, Y. Wang, and J. Guo, “VanillaNet: The power of minimalism in deep learning,” arXiv preprint arXiv:2305.12972, 2023. [Google Scholar]
18. R. Sunkara and T. Luo, “No more strided convolutions or pooling: A new CNN building block for low-resolution images and small objects,” in Joint Europ. Conf. Mach. Learning Knowl. Discovery in Databases, Cham, Springer Nature Switzerland, 2022, pp. 443–459. [Google Scholar]
19. A. Naseri and N. H. M. Ali, “Detection of drones with YOLOv4 deep learning algorithm,” Int. J. Nonlinear Anal. Appl., vol. 13, no. 2, pp. 2709–2722, 2022. [Google Scholar]
20. L. Galteri, L. Seidenari, and M. Bertini, “Deep generative adversarial compression artifact removal,” in Proc. IEEE Int. Conf. Comput. Vis., 2017, pp. 4826–4835. [Google Scholar]
21. Z. Liu, H. Mao, and C. Y. Wu, “A ConvNet for the, 2020s,” in Proc. IEEE/CVF Conf. Comput. Vis. Pattern Recognit., 2022, pp. 11976–11986. [Google Scholar]
22. Q. Wang, B. Wu, P. Zhu, P. Li, and Q. Hu, “ECA-Net: Efficient channel attention for deep convolutional neural networks,” in 2020 IEEE Comput. Soc. Conf. Comput. Vis. Patt. Recognit., 2020, pp. 11534–11542. [Google Scholar]
23. X. G. Mei et al., “Spectral-spatial attention networks for hyperspectral image classification,” Remote Sens., vol. 11, no. 8, pp. 963, 2020. doi: 10.3390/rs11080963. [Google Scholar] [CrossRef]
24. Z. Jiang, L. Zhao, and S. Li, “Real-time object detection method based on improved YOLOv4-tiny,” arXiv preprint arXiv:2011.04244, 2020. [Google Scholar]
25. C. Y. Wang, A. Bochkovskiy, and H. Y. M. Liao, “YOLOv7: Trainable bag-of-freebies sets new state-of-the-art for real-time object detectors,” in Proc. IEEE/CVF Conf. Comput. Vis. Pattern Recognit., 2023, pp. 7464–7475. [Google Scholar]
Cite This Article
 Copyright © 2024 The Author(s). Published by Tech Science Press.
This work is licensed under a Creative Commons Attribution 4.0 International License , which permits unrestricted use, distribution, and reproduction in any medium, provided the original work is properly cited.
 Downloads
 Citation Tools