
 Submit a Paper
 Propose a Special lssue
 Open Access
ARTICLE
An Integrated Perception Model for Predicting and Analyzing Urban Rail Transit Emergencies Based on Unstructured Data
1 School of Traffic and Transportation, Beijing Jiaotong University, Beijing, 100044, China
2 School of Automation and Software Engineering, Shanxi University, Taiyuan, 030006, China
* Corresponding Author: Guangyu Zhu. Email:
Computers, Materials & Continua 2025, 84(2), 2495-2512. https://doi.org/10.32604/cmc.2025.063208
Received 08 January 2025; Accepted 17 April 2025; Issue published 03 July 2025
 View Full Text
 Download PDF
Abstract
The accurate prediction and analysis of emergencies in Urban Rail Transit Systems (URTS) are essential for the development of effective early warning and prevention mechanisms. This study presents an integrated perception model designed to predict emergencies and analyze their causes based on historical unstructured emergency data. To address issues related to data structuredness and missing values, we employed label encoding and an Elastic Net Regularization-based Generative Adversarial Interpolation Network (ER-GAIN) for data structuring and imputation. Additionally, to mitigate the impact of imbalanced data on the predictive performance of emergencies, we introduced an Adaptive Boosting Ensemble Model (AdaBoost) to forecast the key features of emergencies, including event types and levels. We also utilized Information Gain (IG) to analyze and rank the causes of various significant emergencies. Experimental results indicate that, compared to baseline data imputation models, ER-GAIN improved the prediction accuracy of key emergency features by 3.67% and 3.78%, respectively. Furthermore, AdaBoost enhanced the accuracy by over 4.34% and 3.25% compared to baseline predictive models. Through causation analysis, we identified the critical causes of train operation and fire incidents. The findings of this research will contribute to the establishment of early warning and prevention mechanisms for emergencies in URTS, potentially leading to safer and more reliable URTS operations.Keywords
Urban rail transit (URT) is the preferred mode of transportation for urban communities, and its safe and stable operation is an essential reflection of the city’s level of safety management. The operation of the Urban rail transit system (URTS) is in relatively enclosed spaces and often accumulates many passengers within a short period. In such scenarios, emergencies can result in massive casualties and severe consequences [1–3]. Research on the perception methods for emergencies in URTS, in-depth exploration of hidden information in historical emergency data. Forecasting potential events and analyzing associated causes serves as a crucial approach to prevent incidents and enhance system security [4,5].
Urban Rail Transit Emergencies (URTE) data predominantly consist of unstructured narrative texts, such as accident reports, eyewitness descriptions, investigation reports, news reports [6,7]. Current methods for structuring text data include Label Encoding [8], One Hot Encoding [9], and Bag of Words models [10]. Label encoding involves mapping text labels into numerical form, preserving the relationships between sequences to the greatest extent possible.
The low incidence of emergency, incomplete reporting records, and data collection and sharing constraints [11,12] have contributed to the sparse and incomplete characteristics of structured URTE data. Currently, there are three types of interpolation methods for incomplete data [13,14]; the first one is based on statistics and regression ideas, which includes mean value [15], regression model [16,17], principal component analysis (PCA) [18], etc.; the second one is based on machine learning data completion methods, which includes: K-Nearest Neighbor (KNN) [19,20], decision tree [21], Bayesian network [22], etc. However, these methods are restricted in handling low-dimensional and simple datasets and face challenges with high-dimensional and complex URTE data, potentially reducing the accuracy of perception models and limiting comprehensive risk identification.
An increasing number of scholars are exploring deep learning methods for interpolating missing data values, forming a third category of approaches. In 2018, Yoon et al. [23] introduced the GAIN network model utilizing generative adversarial networks to fill missing data values. Based on the GAIN network, Sun et al. [24] compared various complementation algorithms such as variational auto-encoder (VAE) with unique heat coding using multiple datasets for different missing mechanisms, and the experiments showed that GAIN performs better in all missing mechanisms. Bernardini et al. [25] proposed a conditional generative adversarial network (ccGAN) data interpolation method in the medical clinical domain for real-world electronic health record data containing multiple records with missing values. In summary, GAIN surpasses traditional methods by accurately capturing the complex distribution of raw data. However, overfitting is prone to occur during the training process.
The prediction of URTE is based on using models to learn the event’s characteristics and predict the critical features of emergencies. There have been studies using traditional machine learning methods such as Decision Trees [26], Support Vector Machines (SVM) [27,28], and logistic regression [29] to predict emergencies, but such methods are only adapted to simple, balanced datasets. The distribution of emergency data in terms of category and level often has an uneven problem [30], which leads to traditional machine learning perception models tending to learn emergency features of a particular category and level. Prediction models are prone to prediction errors in the case of limited samples.
Compared to traditional machine learning methods, Ensemble Learning (EL) methods, which aggregate the results of multiple base classifiers, are gaining significant attention from researchers [31–33]. Meng et al. [34] proposed an EL strategy for accident-type prediction and causation analysis in response to unbalanced railway accident data. Wang et al. [35] used an EL approach with AdaBoost to predict critical indicators such as PM2.5 in the metro environment. This approach aims to enhance air quality management and help prevent cardiopulmonary diseases caused by passengers’ exposure to hazardous air. EL methods offer a robust approach for various predictive tasks, especially in scenarios involving complex and imbalanced datasets. However, right now, this method is hardly used in predicting emergencies in URTS.
The cause analysis of emergencies involves identifying the primary causes that lead to the occurrence of such events, thereby facilitating a clear analysis of the processes underlying emergency situations. In recent years, researchers have employed a variety of methodologies to explore the origins of emergencies. One such approach is model-based, which includes System-Theoretic Accident Model and Processes (STAMP) [36] and AcciMap [37]. These methodologies identify potential accident causes by analyzing the interactions and feedback loops within a system. However, the complexity of URTS and the inherent uncertainty of emergencies make modeling within actual URT environments exceedingly challenging. Consequently, data-driven methods [38] have increasingly been utilized to uncover the deep relationships between emergency characteristics and their causes, providing a more objective and quantifiable perspective for causes analysis.
Main contributions of this study are summarized as follows:
(1) Coding schemes for the types and levels of emergencies are built, and label coding is carried out to achieve structured data processing.
(2) This study integrates elastic net regularization to refine the GAIN (ER-GAIN). By leveraging its capability to learn the complex distribution of the original data, the model effectively interpolates missing values within the dataset, thereby enhancing the integrity of emergency data.
(3) To address the imbalance in data related to URTE, we employed the AdaBoost ensemble learning model to predict the key features of these emergencies.
(4) This paper utilizes the IG from data-driven strategies to analyze the causes of emergencies, thereby identifying the key factors that contribute to the occurrence of such events.
The rest of the paper is structured as follows: Section 2 provides a detailed description of the integrated perception model; Section 3 uses actual URTE data for experimental; Section 4 discusses the results. Section 5 concludes and looks forward to the work in this paper.
The framework of the URTE integrated perceptual model is shown in Fig. 1. It contains a total of four parts: (1) Structuring of data, (2) Data interpolation based on ER-GAIN, and (3) Emergency prediction method. (4) Cause analysis of emergency.
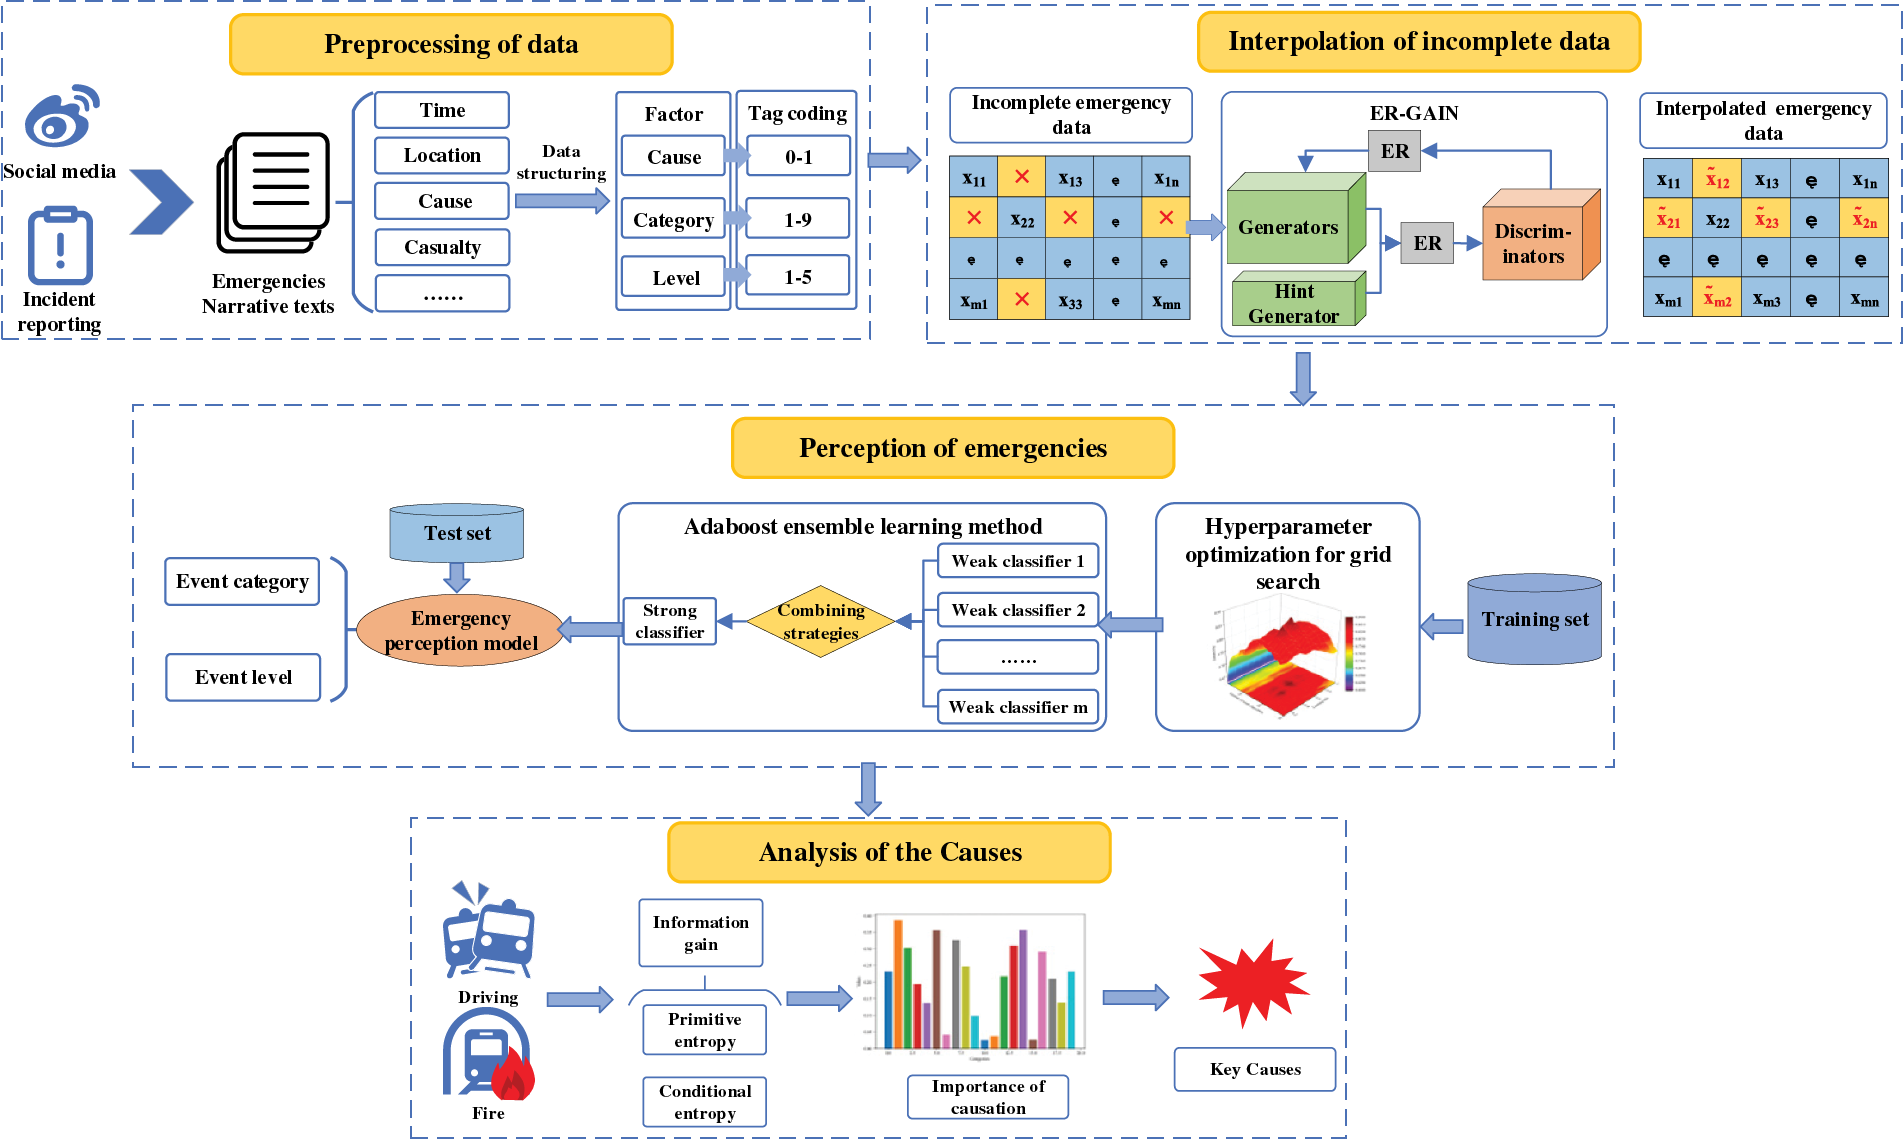
Figure 1: Framework of integrated perception model for URTE under incomplete data
2.1 Structured Method for Emergency Data
Unstructured data obtained from various sources, such as social media and incident reports, provide narrative textual records of the processes and outcomes of URTE. However, Structured Data refers to data stored and organized in a predefined format, whose structure and content follow clear rules and patterns, facilitating efficient processing and analysis by computer programs. This paper employs a label encoding method to process unstructured emergency data, developing a labeling scheme in terms of the cause, type, and level of emergencies.
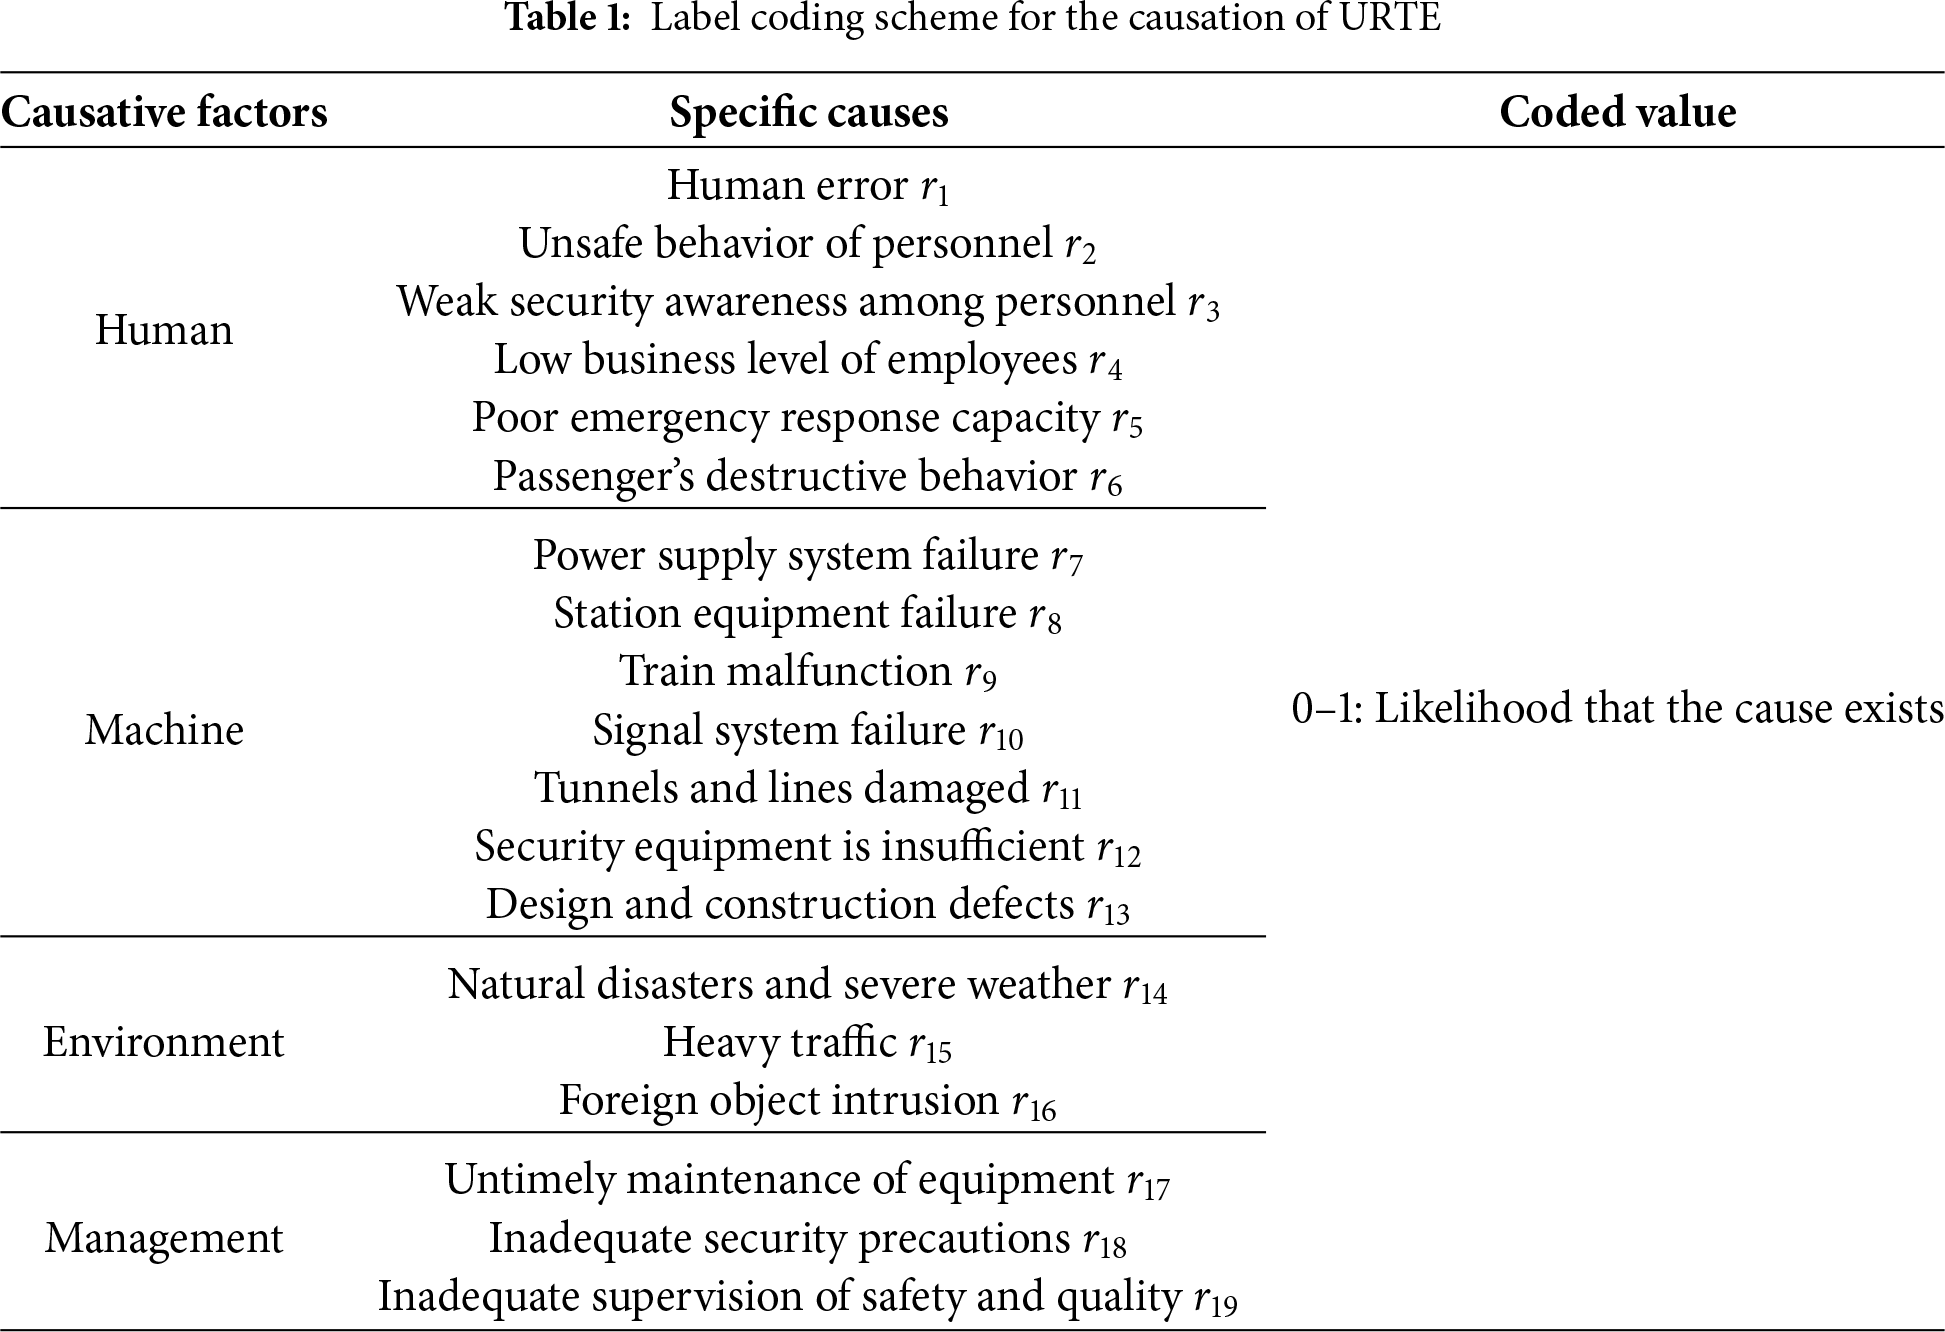
The causes or interactions of causes leading to URTE directly reflect system vulnerabilities and insufficient resilience. According to the theory of event causality [39], these emergencies can often be attributed to four key factors: unsafe human behavior, unsafe material conditions, adverse environmental conditions, and managerial deficiencies. Building on this theory, our study further refines the causes of URTE across four dimensions: human, machine, environment, and management. By combining a literature review and expert experience, we identified 19 specific causal factors, detailed in Table 1.
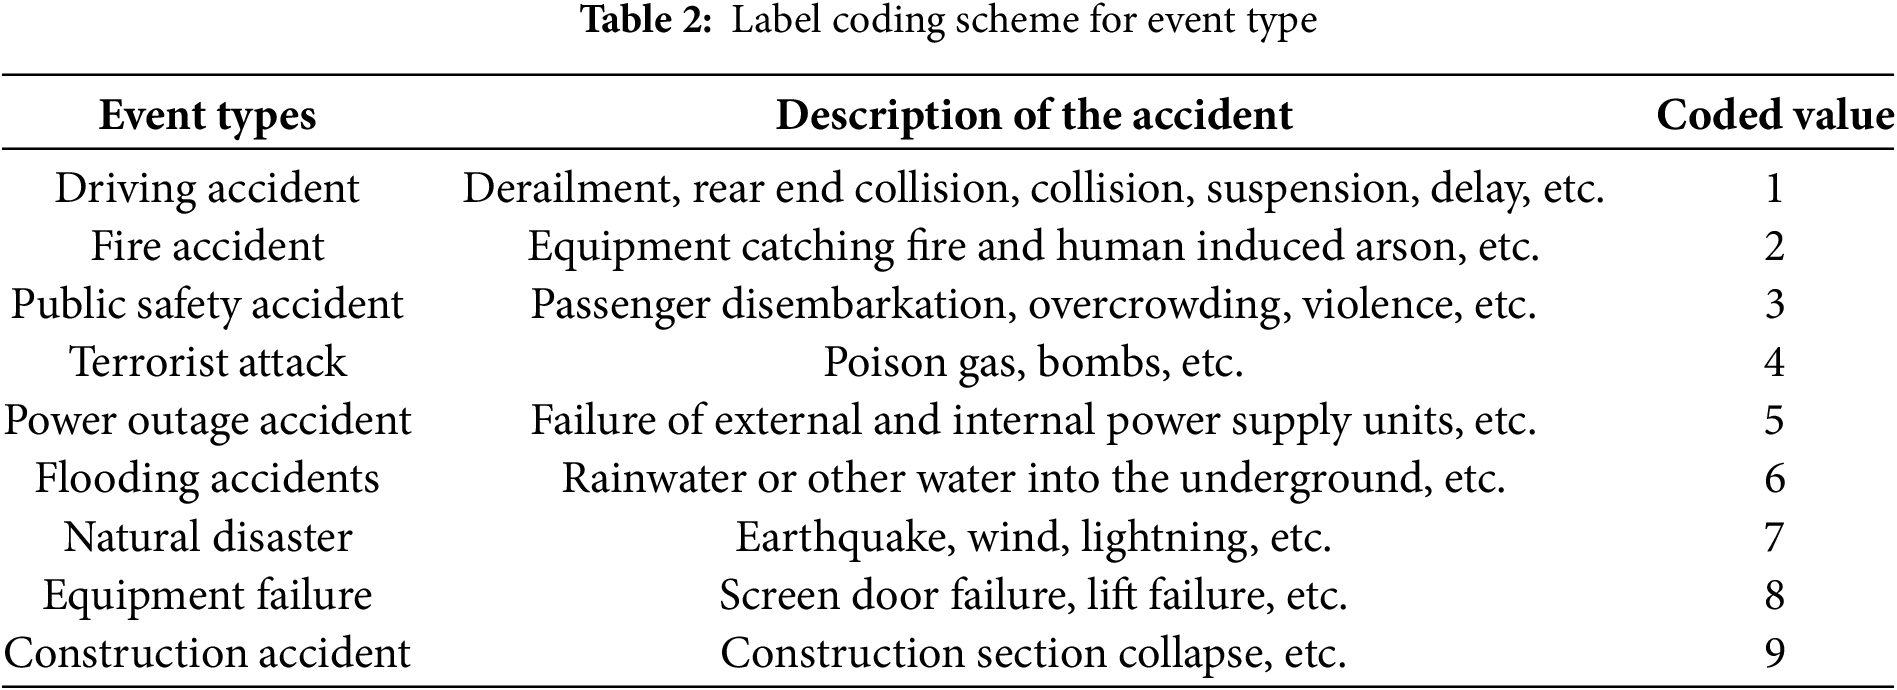
Event types refers to all types of emergencies that may occur during operations, which may have a serious impact on passenger safety, operational order, and facilities and equipment. In this study, the classification of URTE and their corresponding encoding values are detailed in Table 2.
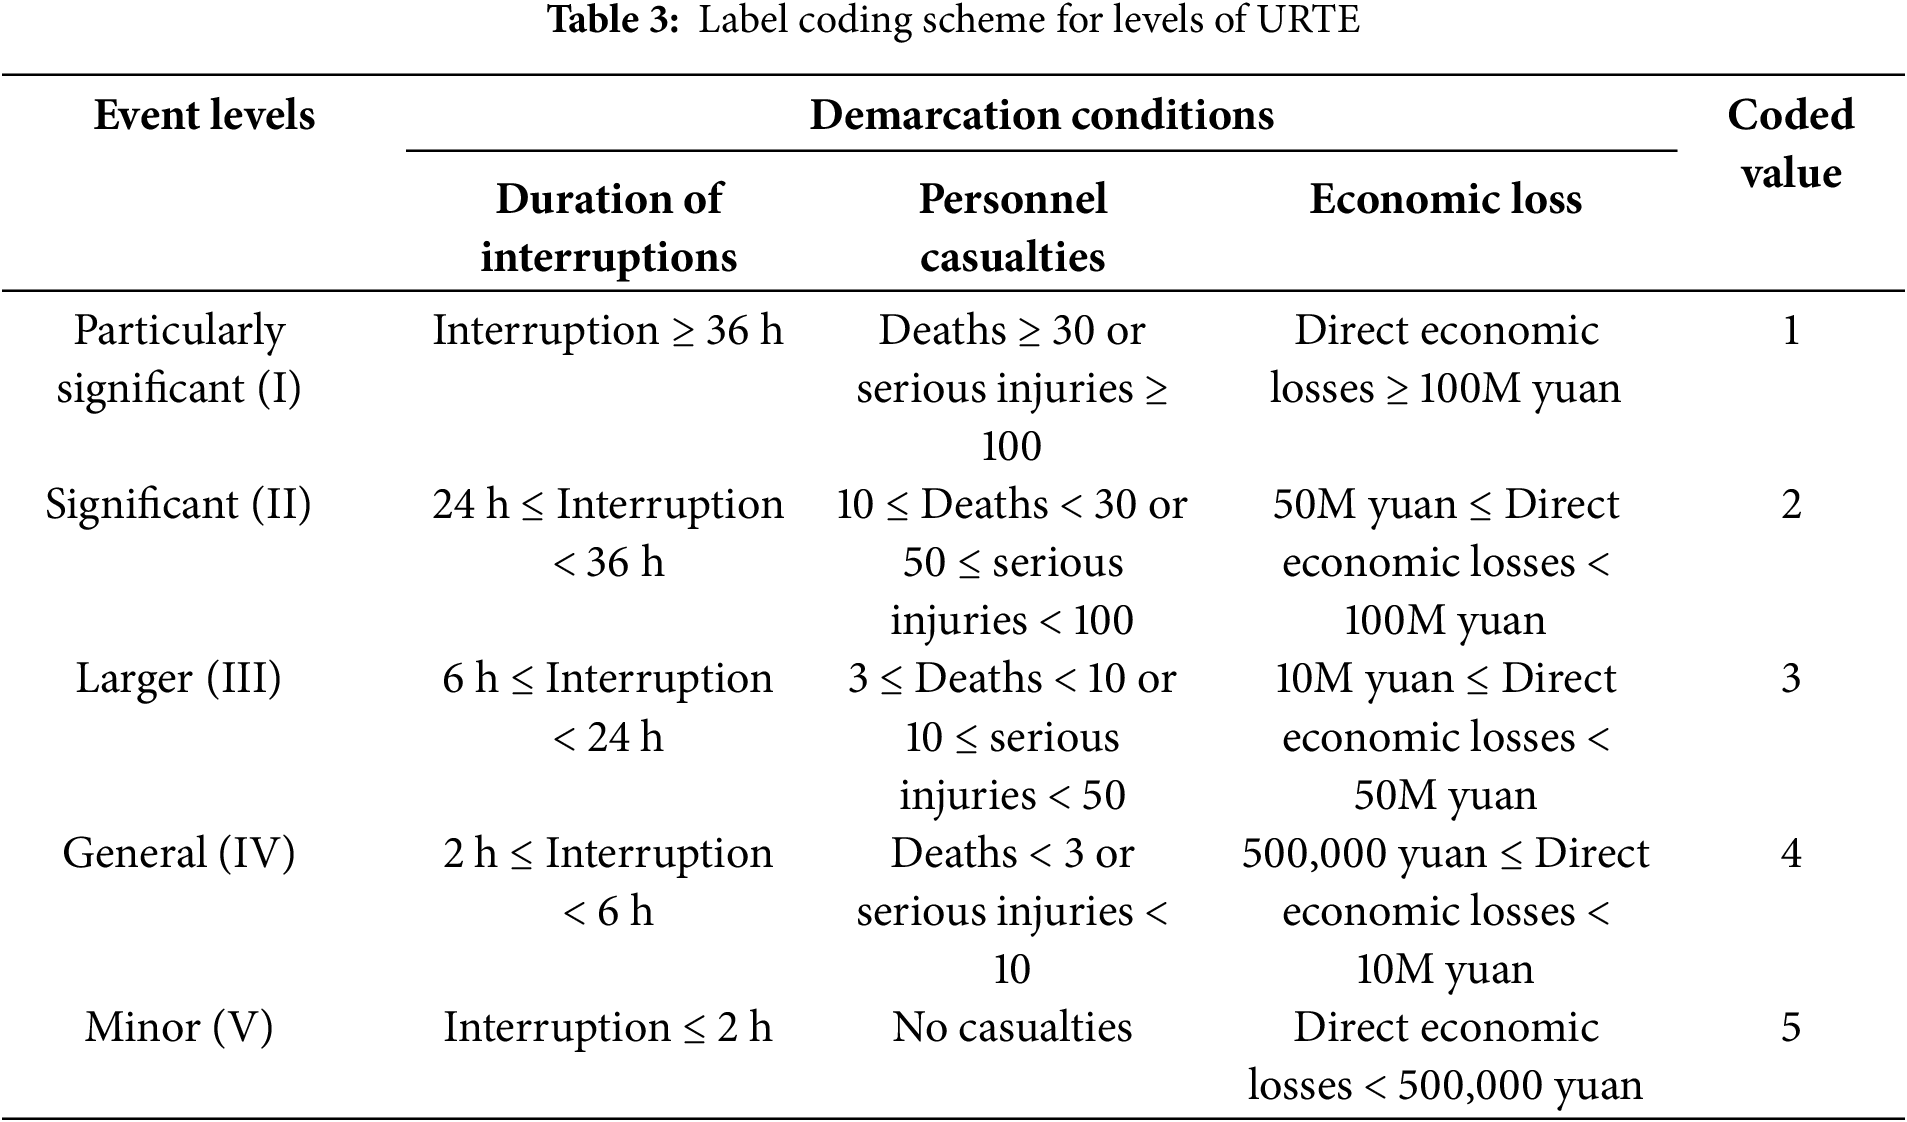
Event levels refers to the categorization and grading of emergencies based on factors such as their severity, scope of impact, degree of harm, and emergency response needs [40], and the results are shown in Table 3. If the event meets one of the classification conditions, it will be classified as such.
2.2 GAIN-Based Data Interpolation Method
The issue of data missingness in URTE is complex, encompassing both random and non-random factors. GAIN is an unsupervised interpolation method, and the core idea is to use a generative adversarial network to simulate and learn the underlying distribution of event data to estimate and interpolate missing data more accurately. However, the traditional GAIN is prone to overfitting during the training process, which results in poor generalization capabilities of the model. Therefore, we propose an improved data imputation method that combines elastic network regularization (ER) and GAIN. The framework is shown in Fig. 2.

Figure 2: The framework of ER-GAIN
ER [41] is a machine learning method that combines L1 and L2 regularization techniques. It aims to perform variable selection and control model complexity by constructing an optimized loss function, thereby effectively preventing the model from overfitting. Specifically, L1 regularization (Lasso) encourages sparsity in the model parameters, which aids in feature selection, while L2 regularization (Ridge) controls the growth of model weights to prevent overfitting. The general form of the elastic net regularization loss function is shown as Eq. (1).
where,
Applying elastic net regularization to GAIN involves reconstructing the loss functions of both the generator and the discriminator. For the generator, the goal is to learn more generalized feature representations while reducing the noise in the generated data. For the discriminator, the aim is to enhance its ability to generalize, thereby improving its capacity to distinguish between real and generated data. The reconstructed loss functions for both components are presented as Eqs. (2) and (3):
where,
2.3 Emergency Prediction Method
Due to the inherent variability in the probability of occurrence of URTE, with certain equipment failure events being more frequent than major disasters, this leads to a significant imbalance in the URTE dataset with respect to event types and severity levels. In order to prevent this imbalance from affecting the performance of the prediction model, Prediction of URTE using AdaBoost [42] (Fig. 3).

Figure 3: Integrated prediction model for URTE
2.4 URTE Cause Analysis Method
The causal analysis of URTE aims to identify causes associated with emergency types. IG can serve as an indicator to evaluate the importance of a cause. This indicator is derived by measuring the reduction in uncertainty regarding the type of emergency given a specific cause. The calculation method is presented as Eqs. (4)–(6):
where,
3.1 URTE Dataset and Structuring
We manually collected text records from the Internet and URTS operational event reports, totaling 496 URTS event records worldwide from 1969 to 2021. After structuring the textual data using label coding, we statistically analyzed the events for key features and missing data, as shown in Fig. 4.

Figure 4: Statistical results of emergencies data. (a) Key features; (b) Missing of the data
There is a highly uneven distribution of emergency data, with the most significant percentage of emergencies of equipment failure types and minor grades, while the number of events of other types and levels is low, and there is even a situation where no record exists. There are a large number of missing cases in the structured emergency data, especially the percentage of missing causes such as tunnel and line damage
3.2 Interpolation of Structured Emergencies Data
This section employs the ER-GAIN proposed herein to impute missing values within structured emergency data. The generator and discriminator are trained using the methodology outlined in Appendix A. The training parameters were configured as follows: the training step size was set to 20,000, with λ1 and λ2 assigned the values of 0.05 and 0.5, respectively. The evolution of the loss for both models during the training process is depicted in Fig. 5.

Figure 5: Variation of generator and discriminator losses during the training process
The loss of the generator gradually tends to stabilize during the training process, while the loss of the discriminator still has large fluctuations at the late stage of training. This characteristic shows that the complementary model has good missing data interpolation ability, so the discriminator cannot distinguish the generated data from the actual data well.
3.3 Emergencies Prediction and Result Analysis
3.3.1 Tuning of Hyperparameters of Predictive Models
The number of weak classifiers and the learning rate significantly affect the prediction performance of AdaBoost. To make the optimal prediction performance of AdaBoost, it is necessary to adjust the number of weak classifiers and the learning rate of the model before training and to find a set of optimal values for the model hyperparameters.
The hyperparameter tuning scheme of grid search is utilized to find the optimal number of weak classifiers and model learning rate in a violently exhaustive manner. In the grid search process, the efficiency of the computational process is fully considered, and the training step size is set to be uniformly 30, the number of weak classifiers ranges from 1 to 30, and the model learning rate ranges from 0.1 to 1. The computational process of the optimal hyperparameter grid search is shown in Fig. 6.

Figure 6: Grid search process for optimal hyperparameters of the prediction model
As the number of weak classifiers increases, the accuracy of event perception shows an upward trend. When the number of weak classifiers reaches a number, the accuracy of the prediction instead shows a decreasing trend. Too small a learning rate will result in the model not being adequately trained, while too large a learning rate will result in the model not being able to converge, which in turn affects the accuracy of the model. According to the grid search results, the highest model accuracy (88.18%) was achieved by choosing 18 for the number of weak classifiers and 0.6 for the learning rate.
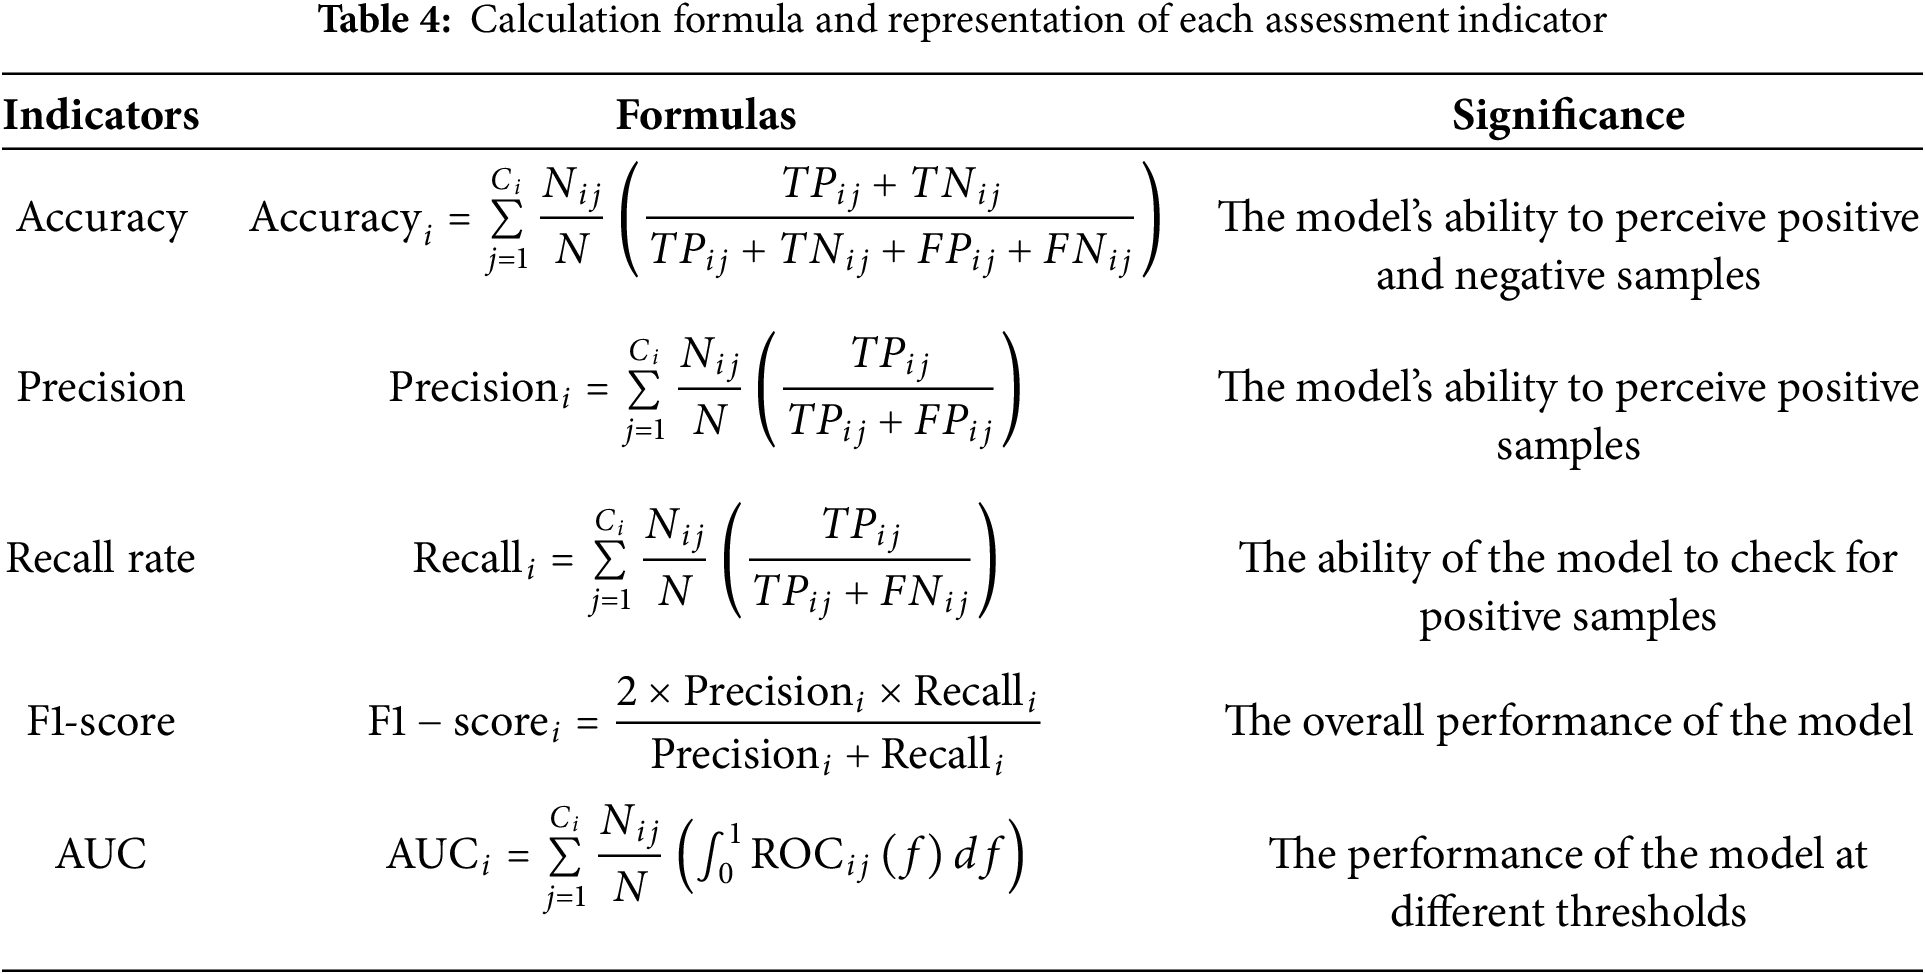
3.3.2 Indicators for Model Assessment
To effectively evaluate the performance of the predictive model and other benchmark models, Accuracy, F1-score, Precision, Recall, and AUC (Area Under Curve) are selected to evaluate the model comprehensively, these evaluation indicators are shown in Table 4.
3.3.3 Comparative Analysis of Experimental Results
The above hyperparameter scheme are used to train the Adaboost. The dataset is divided into the training and test set according to the ratio of 8:2. The prediction results is shown in Fig. 7.

Figure 7: Prediction results. (a) Event types; (b) Event levels
The confusion matrix derived from the predictive outcomes reveals that the model exhibits greater accuracy in predicting event types and levels with larger sample sizes, achieving an accuracy rate of over 85% in most cases. However, for events such as natural disasters and terrorist attacks, which are characterized by a scarcity of samples, the model’s training is insufficient, thereby adversely affecting the accuracy of its predictions for these types of incidents. Different thresholds are set to plot the ROC curves of the perceptual model in terms of both event types and event levels, and the results are shown in Fig. 8.
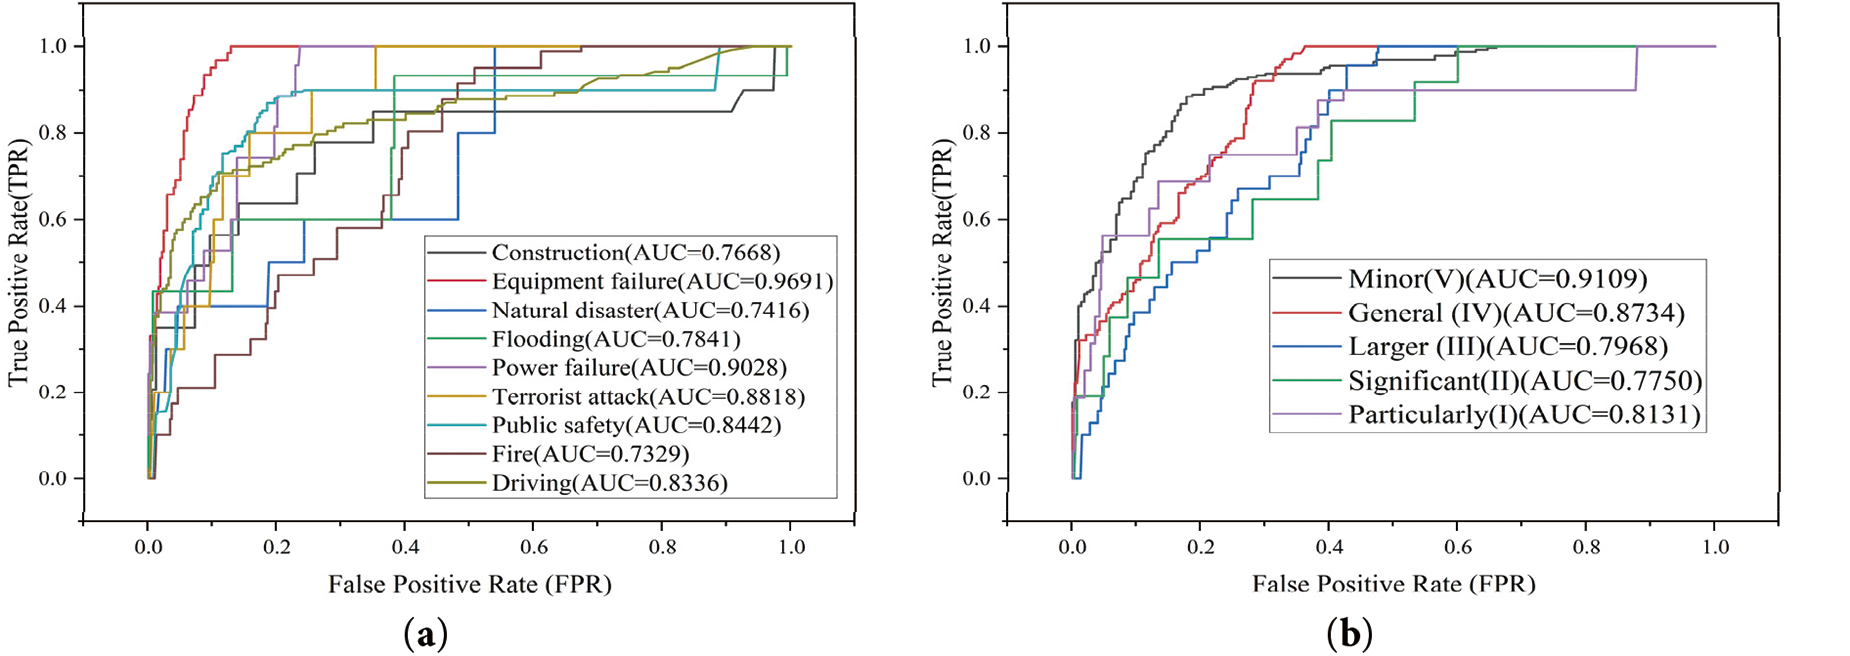
Figure 8: Prediction ROC curve. (a) Event types; (b) Event levels
From the figure, in the prediction of event types, the AUC of the two types of equipment failure and power outage are more than 0.9, and the AUC of other types are above 0.7; in the perception of event level, the AUC of level V is more than 0.9, and the AUC of other types are above 0.75. It proves that the perception model was effectively trained, and the model validation by adding the test set still has a good perception effect, which proves that the model has been balanced.
After verifying the performance of the data-completion model and the prediction model, the commonly used machine learning algorithms are selected as the benchmark perceptual model, and a comprehensive comparative analysis is conducted with different data-completion datasets to verify the superiority of the perceptual model in this paper. The benchmark models include Naive Bayes Classification (NBC) [43], SVM [27], and Artificial Neural Networks (ANN) [44], and the data completion methods include MICE, KNN, and ER-GAIN. The comparative results of the performance of the different models in the prediction of event types and levels are shown in Tables 5 and 6.
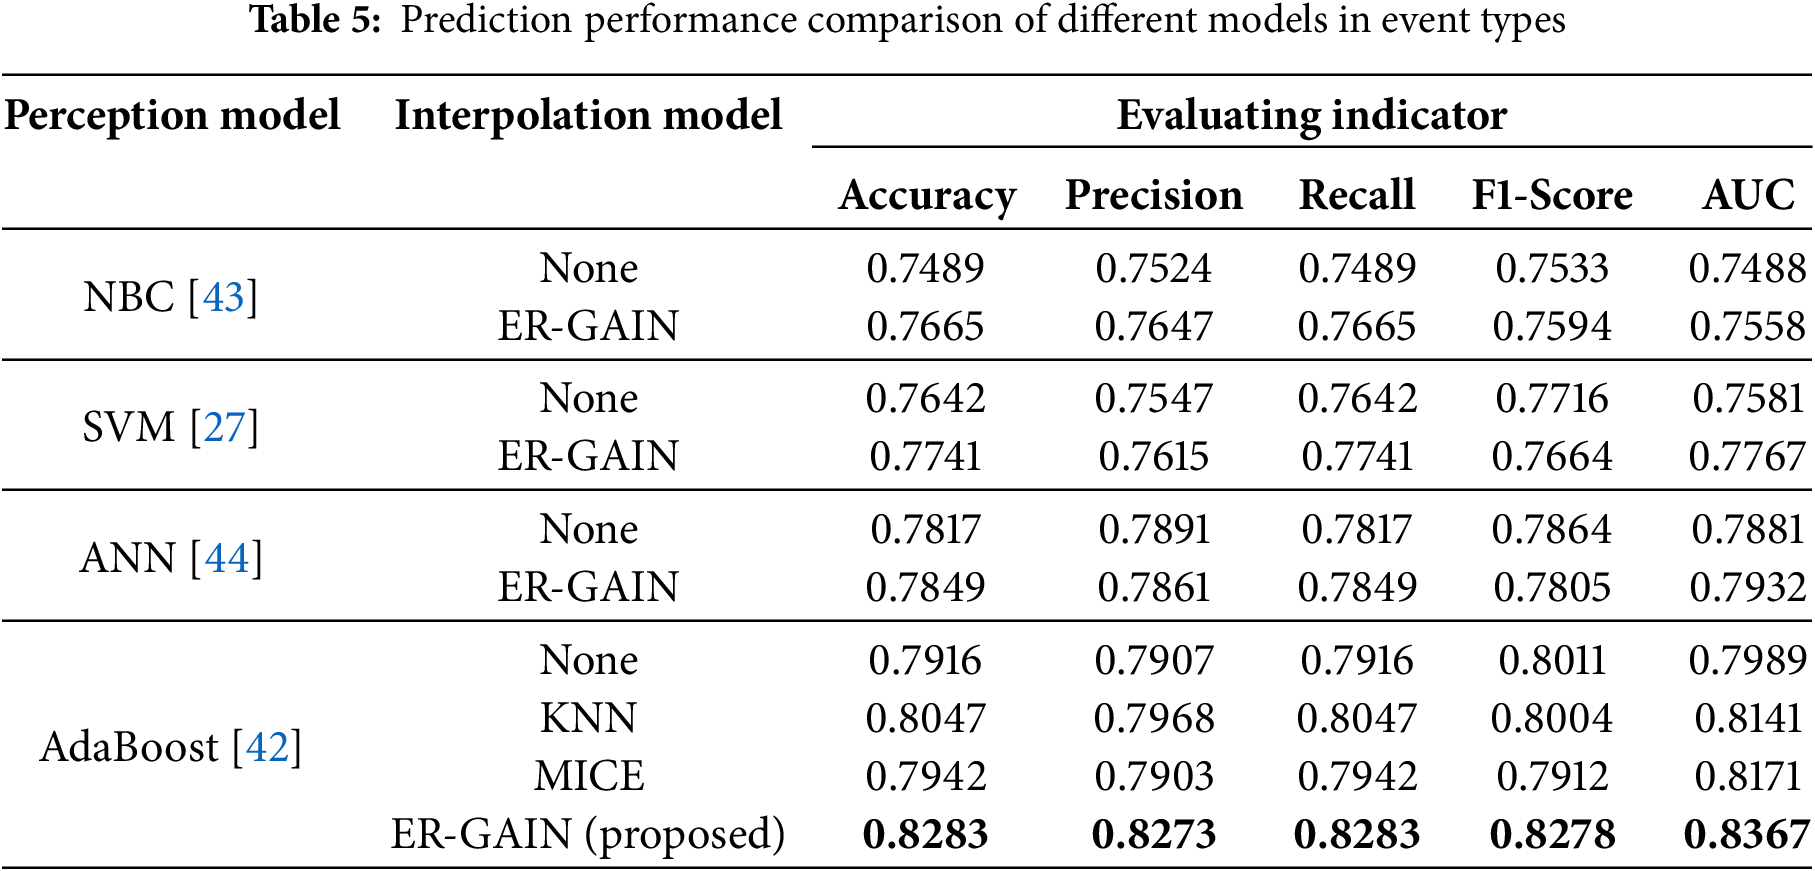
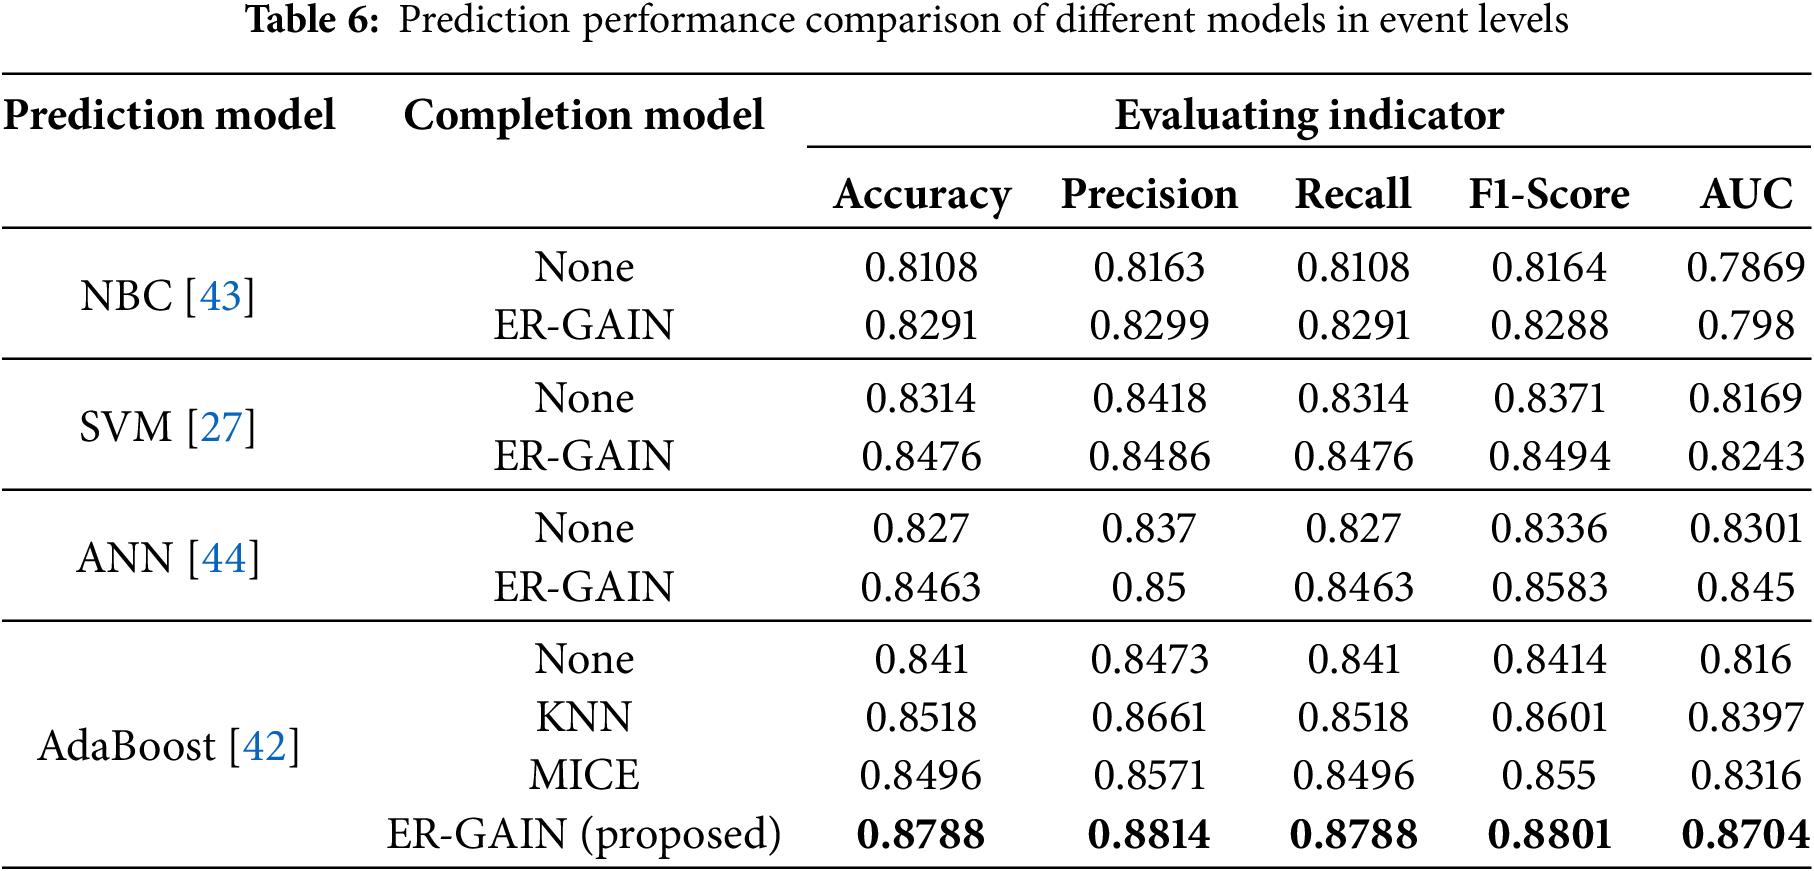
From the comparison results in the above table, after adopting the data complemented by the ER-GAIN, the performance of each model for the event types and levels is improved. From the comparison results in the above table, after adopting the data complemented by the ER-GAIN, the performance of each model for the event types and levels is improved. The model proposed in this study compared to other models under the same conditions, and it has improved in multiple indicators such as accuracy, precision, recall, F1 score, and AUC. For predicting event types, it has increased by 2.36%, 3.05%, 2.36%, 2.67%, and 1.96%, respectively; The prediction of event levels has increased by 2.7%, 1.53%, 2.7%, 2.0%, and 2.54%, respectively. This proves the effectiveness of ER-GAIN for incomplete emergency data, which improves the validity and completeness of the data. In addition, the AdaBoost has a higher percentage of improvement in the perceptual performance of the data complemented using the ER-GAIN compared to the other benchmark models.
Two scenarios (Table 7) are set up to test the trained emergencies perception model to predict the features of emergencies that may occur in that scenario.
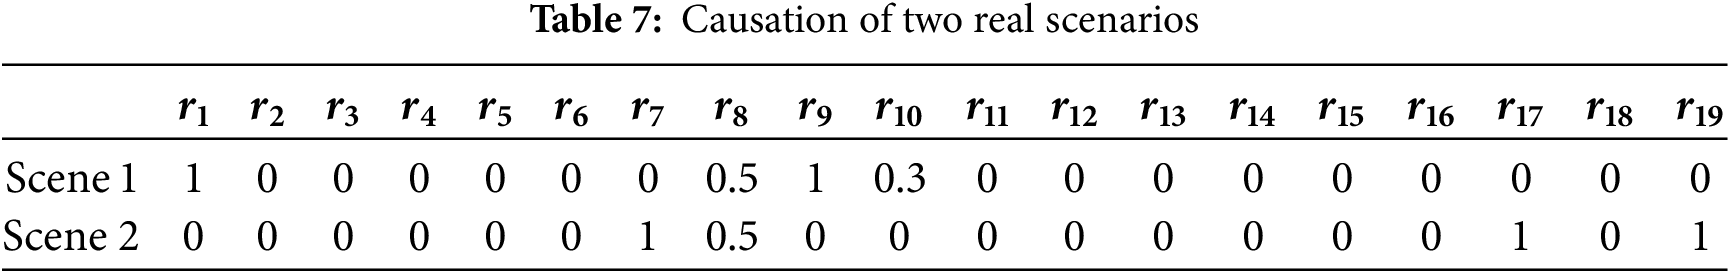
The prediction results for these two scenarios are shown in Fig. 9.

Figure 9: Prediction results for two scenarios. (a) Event type of Scenario 1; (b) Event type of Scenario 2; (c) Event level of Scenario 1; (d) Event level of Scenario 2
A Level II/III Driving/Equipment failure accident is most likely to occur in Scenario 1, and a Level IV/IV Fire/Power failure accident is most likely to occur in Scenario 2. This prediction result is highly compatible with the historical case data and widely recognized by experts in the field. Leveraging the predictive outcomes enables practitioners to conduct thorough accident analysis and implement corresponding remedial measures. For example, by utilizing geographical information such as latitude and longitude, they can identify accident-prone stations or areas. Consequently, more human resources and funding can be allocated to these locations. This allows for enhanced early warning systems, improved risk management strategies, and more effective maintenance of operating trains and tracks. As demonstrated by Singapore’s Intelligent Transport System (ITS) [45], which utilizes real-time traffic information and data analytics to predict traffic events and improve public transportation, such an approach can significantly enhance the safety and efficiency of urban rail transit systems.
This section employs the IG method to analyze the key causes of URTE. As shown in Fig. 6, the primary types of Level I and II catastrophic URTE are traffic accidents and fires. The URTE dataset was filtered for these two types, and the IG method was utilized to calculate the importance of each cause. The results are illustrated in Fig. 10.

Figure 10: Ranking of the importance of the causes of driving and fire accidents. (a) Driving; (b) Fire
The results indicate that significant driving and fire accidents primarily arise from a combination of Human and Machine factors. In driving accidents, Machine factors are relatively more prominent, whereas in fires, human factors have a greater influence. Unsafe human behaviors, human errors, and power system failures are the most critical factors contributing to these accidents. By conducting an in-depth analysis and implementing effective management of these key factors, we can significantly reduce the occurrence of significant driving and fire accidents, thereby safeguarding lives and property.
The data structuring component of our model is intricately tailored to the unique characteristics of the URTS, leveraging the expertise of domain-specific professionals. URTS operates with a distinctive mode, featuring specialized equipment architecture and a specific logic for data generation. This unique setup allows our data structuring approach to precisely extract and integrate the nuanced features of data pertinent to URTS. However, this very specificity poses a challenge when considering the model’s application beyond the URTS domain. The data structuring methodology, rooted in the experience of experts familiar with the intricacies of urban rail transit, is not readily transferable to other fields. This is primarily due to the substantial disparities in data sources, formats, and the embedded business logic that vary significantly across different domains.
To extend the model’s applicability, we can achieve this by the following methods. Firstly, the framework that will be the subject of this research can be modularized and divided into domain-specific rules and directly generalizable algorithms. This modularity allows us to redefine the domain-specific rules. Secondly, for other domains with different data formats, such as GPS data in transport or sensor data in industrial systems. Flexible data preprocessing methods can be developed to enable the conversion of metadata to standardized data. Finally, by collaborating with relevant experts, domain-specific knowledge can be integrated and data coding schemes can be modified to enable the migration of this research to other domains.
This study has certain limitations in terms of data. When constructing the interannual analysis framework, although the initial integration of rail transit data between 1969 and 2021 was achieved through standardized processing, it did fail to fully incorporate the characteristics of the evolution of the urban rail transit system over time in terms of technological standards, operation modes, etc. due to the differences in statistical calibers and the absence of key indicators in the early historical data. To address the limitations of the data in this regard, we can develop data preprocessing methods based on backward calibration techniques. In the case of passenger flow data, for example, by establishing a baseline equivalence between historical manual statistical passenger flow data and modern automated statistical passenger flow data, and using the overlapping validation period (1995–2005) in which the two data types co-exist to determine the conversion factor, we can then achieve the alignment of the different standard data.
URTS confronts significant operational risks due to the abrupt and unpredictable nature of URTE. The inherent characteristics of these emergencies result in URTE data that are often unstructured, incomplete, and imbalanced. This study, therefore, presents an integrated incident perception model that encompasses data structuring, completion, emergency prediction, and causal analysis. Initially, a tagging encoding scheme was developed through literature synthesis and expert consultation, thereby structuring the unstructured textual URTE data. Subsequently, to address the incompleteness in URTE data and prevent biases in subsequent models, an improved GAIN method with elastic network regularization was proposed, achieving the completion of incomplete data. Furthermore, to counteract the negative impact of class and grade imbalances in URTS data on model predictions, an EL approach was employed to construct an incident prediction model, enriching the decision boundaries of the perception model and enhancing its predictive performance.
To substantiate the efficacy of this study, the proposed integrated perception model underwent rigorous experimental analysis, with various machine learning methods serving as benchmark models for comparison. The results demonstrate that the ER-GAIN data completion method not only optimizes statistical metrics but also enhances the predictive performance across all models. Moreover, the AdaBoost model based on the EL outperforms other benchmark models in predicting emergencies. These findings validate the effectiveness of both the data completion method and the emergency prediction model. A causal analysis was conducted on the two most severe types of accidents: train operations and fires. By IG index, key causes for these accidents were identified, and their causal coupling mechanisms were revealed. This study provides a scientific foundation for the development of targeted safety prevention measures, the refinement of emergency management strategies, and the enhancement of the overall safety performance of URTS.
Future work will focus on several key areas to further enhance the safety and efficiency of URTS. Firstly, expanding the dataset to include diverse scenarios and emerging risk factors will improve model robustness and adaptability. Additionally, integrating real-time data feeds into the incident prediction model could facilitate proactive management and quicker response times.
Acknowledgement: The authors would like to thank the editors and reviewers for their valuable work.
Funding Statement: This research was supported by the Fundamental Research Funds for the Central Universities (grant number 2024YJS096), and National Natural Science Foundation of China (grant numbers 62433005, 62272036, 62173167).
Author Contributions: Liang Mu: Conceptualization, Methodology, Software, Writing—original draft. Yurui Kang: Writing—review & editing. Zixu Yan: Data curation, Visualization. Guangyu Zhu: Supervision and review. All authors reviewed the results and approved the final version of the manuscript.
Availability of Data and Materials: The authors confirm that the data supporting the findings of this study are available within https://doi.org/10.6084/m9.figshare.27021613.v1.
Ethics Approval: Not applicable.
Conflicts of Interest: The authors declare no conflicts of interest to report regarding the present study.
The GAIN interpolation process for burst incomplete data is as follows:
(1) Suppose X is the original data matrix, where some of the data (for example
(2) The Generator tries to estimate the values of the missing data based on the original data matrix X, the mask matrix M, and the random noise matrix Z and outputs the complete data matrix
G stands for the generator function, which is a fully connected multilayer feed-forward neural network used to learn the distribution of the original data and generate missing values. The generator’s hidden layer usually uses the ReLU (Rectified Linear Unit) activation function, and its output layer usually uses the Softmax activation function.
(3) The discriminator receives the output
D stands for the discriminator function, a fully connected multilayer feedforward neural network that distinguishes actual data from generator-generated artificial data. The hidden layer of the discriminator usually uses the ReLU activation function, and its output layer usually uses the Sigmoid activation function.
(4) In GAIN, two loss functions train the Generator and Discriminator, respectively. In this case, the loss functions for the Discriminator and Generator are
The objective function of GAIN is:
(5) In the training process of GAIN, the objective function contains the mathematical expectation E. The objective of G is to minimize the function, while the objective of D is to maximize the function. Through adversarial training, the two models gradually reach a Nash equilibrium, at which point the D cannot accurately identify whether the input data is real data or artificially interpolated data generated by the G.
References
1. Zhu G, Ding J, Wei Y, Yi Y, Xu SS-D, Wu EQ, et al. Two-Stage OD flow prediction for emergency in urban rail transit. IEEE Trans Intell Transp Syst. 2024;25(1):920–8. doi:10.1109/TITS.2023.3235413. [Google Scholar] [CrossRef]
2. Zhou M, Dong H, Ning B, Wang F. Parallel urban rail transit stations for passenger emergency management. IEEE Intell Syst. 2020;35(6):16–27. doi:10.1109/MIS.2019.2963192. [Google Scholar] [CrossRef]
3. Zhou Z, Irizarry J, Guo W. A network-based approach to modeling safety accidents and causations within the context of subway construction project management. Saf Sci. 2021;139(10):105261. doi:10.1016/j.ssci.2021.105261. [Google Scholar] [CrossRef]
4. Xue G, Liu S, Ren L, Gong D. A data aggregation-based spatiotemporal model for rail transit risk path forecasting. Reliab Eng Syst Safe. 2023;239(2):109530. doi:10.1016/j.ress.2023.109530. [Google Scholar] [CrossRef]
5. Xue G, Liu S, Gong D. Identifying abnormal riding behavior in urban rail transit: a survey on “in-out” in the same subway station. IEEE Trans Intell Transp Syst. 2020;23(4):3201–13. doi:10.1109/TITS.2020.3032843. [Google Scholar] [CrossRef]
6. Zhu G, Yang R, Wu EQ, Law R. Extraction of emergency elements and business process model of urban rail transit plans. IEEE Trans Comput Soc Syst. 2024;11(2):1744–52. doi:10.1109/TCSS.2023.3235338. [Google Scholar] [CrossRef]
7. Zhu G, Huang X, Yang R, Sun R. Relationship extraction method for urban rail transit operation emergencies records. IEEE Trans Intell Veh. 2023;8(1):520–30. doi:10.1109/TIV.2022.3160502. [Google Scholar] [CrossRef]
8. Jia BB, Zhang ML. Multi-dimensional classification via decomposed label encoding. IEEE Trans Knowl Data Eng. 2021;35(2):1844–56. doi:10.1109/TKDE.2021.3100436. [Google Scholar] [CrossRef]
9. Li B, Tang X, Qi X, Chen Y, Li C-G, Xiao R, et al. EMU: effective multi-hot encoding net for lightweight scene text recognition with a large character set. IEEE Trans Circuits Syst Video Technol. 2022;32(8):5374–85. doi:10.1109/TCSVT.2022.3146240. [Google Scholar] [CrossRef]
10. Guo S, Guo W. Process monitoring and fault prediction in multivariate time series using bag-of-words. IEEE Trans Autom Sci Eng. 2020;19(1):230–42. doi:10.1109/TASE.2020.3026065. [Google Scholar] [CrossRef]
11. Zhang Q, Geng S. Dynamic uncertain causality graph applied to dynamic fault diagnoses of large and complex systems. IEEE Trans Reliab. 2015;64(3):910–27. doi:10.1109/TR.2015.2416332. [Google Scholar] [CrossRef]
12. Wang Y, Sheng K, Niu P, Chu C, Li M, Jia L. A comprehensive analysis method of urban rail transit operation accidents and safety management strategies based on text big data. Saf Sci. 2024;172(1):106400. doi:10.1016/j.ssci.2023.106400. [Google Scholar] [CrossRef]
13. Bertsimas D, Pawlowski C, Zhuo Y. From predictive methods to missing data imputation: an optimization approach. J Mach Learn Res. 2018;18(196):1–39. [Google Scholar]
14. Miao X, Wu Y, Chen L, Gao Y, Yin J. An experimental survey of missing data imputation algorithms. Trans Knowl Data Eng. 2023;35(7):6630–50. doi:10.1109/TKDE.2022.3186498. [Google Scholar] [CrossRef]
15. Henrickson K, Zou Y, Wang Y. Flexible and robust method for missing loop detector data imputation. Transp Res Rec. 2015;2527(1):29–36. doi:10.3141/2527-04. [Google Scholar] [CrossRef]
16. Wang R, Su M, Wang Q. Distributed nonparametric regression imputation for missing response problems with large-scale data. J Mach Learn Res. 2023;24(68):1–52. [Google Scholar]
17. Karmitsa N, Taheri S, Bagirov A, Mäkinen P. Missing value imputation via clusterwise linear regression. IEEE Trans Knowl Data Eng. 2022;34(4):1889–901. doi:10.1109/TKDE.2020.3001694. [Google Scholar] [CrossRef]
18. Li L, Liu H, Zhou H, Zhang C. Missing data estimation method for time series data in structure health monitoring systems by probability principal component analysis. Adv Eng Softw. 2020;149(2):102901. doi:10.1016/j.advengsoft.2020.102901. [Google Scholar] [CrossRef]
19. Seoane SM, Abreu PH, Fernández A, Luengo J, Santos J. The impact of heterogeneous distance functions on missing data imputation and classification performance. Eng Appl Artif Intel. 2022;111(3):104791. doi:10.1016/j.engappai.2022.104791. [Google Scholar] [CrossRef]
20. Al-Helali B, Chen Q, Xue B, Zhang M. A new imputation method based on genetic programming and weighted KNN for symbolic regression with incomplete data. Soft Comput. 2021;25(8):5993–6012. doi:10.1007/s00500-021-05590-y. [Google Scholar] [CrossRef]
21. Lyngdoh GA, Zaki M, Krishnan NMA, Das S. Prediction of concrete strengths enabled by missing data imputation and interpretable machine learning. Cem Concr Comp. 2022;128:104414. doi:10.1016/j.cemconcomp.2022.104414. [Google Scholar] [CrossRef]
22. Li Z, Yu H, Zhang G, Wang J. A Bayesian vector autoregression-based data analytics approach to enable irregularly-spaced mixed-frequency traffic collision data imputation with missing values. Transp Res C-Emer. 2019;108:302–19. doi:10.1016/j.trc.2019.09.013. [Google Scholar] [CrossRef]
23. Yoon J, Jordon J, Schaar M. GAIN: missing data imputation using generative adversarial nets. In: Proceedings of the 35th International Conference on Machine Learning; 2018 Jul 10–15; Stockholm, Sweden. p. 5689–98. [Google Scholar]
24. Sun Y, Li J, Xu Y, Zhang T, Wang X. Deep learning versus conventional methods for missing data imputation: a review and comparative study. Expert Syst Appl. 2023;227(87):120201. doi:10.1016/j.eswa.2023.120201. [Google Scholar] [CrossRef]
25. Bernardini M, Doinychko A, Romeo L, Frontoni E, Amini M-R. A novel missing data imputation approach based on clinical conditional Generative Adversarial Networks applied to EHR datasets. Comput Biol Med. 2023;163(W1):107188. doi:10.1016/j.compbiomed.2023.107188. [Google Scholar] [PubMed] [CrossRef]
26. Zheng Z, Lu P, Tolliver D. Decision tree approach to accident prediction for highway-rail grade crossings: empirical analysis. Transp Res Rec. 2016;2545(1):115–22. doi:10.3141/2545-12. [Google Scholar] [CrossRef]
27. Jha AN, Chatterjee N, Tiwari G. A performance analysis of prediction techniques for impacting vehicles in hit-and-run road accidents. Accid Anal Prev. 2021;157(24):106164. doi:10.1016/j.aap.2021.106164. [Google Scholar] [PubMed] [CrossRef]
28. Lu Y, Fan X, Zhao Z, Jiang X. Dynamic fire risk classification prediction of stadiums: multi-dimensional machine learning analysis based on intelligent perception. Appl Sci. 2022;12(13):6607. doi:10.3390/app12136607. [Google Scholar] [CrossRef]
29. Liu X, Saat MR, Barkan CPL, Wang J. Freight-train derailment rates for railroad safety and risk analysis. Accid Anal Prev. 2017;98(229):1–9. doi:10.1016/j.aap.2016.09.012. [Google Scholar] [PubMed] [CrossRef]
30. Zhang X, Deng Y, Li Q, Skitmore M, Zhou Z. An incident database for improving metro safety: the case of Shanghai. Saf Sci. 2016;84(3):88–96. doi:10.1016/j.ssci.2015.11.023. [Google Scholar] [CrossRef]
31. Ganaie MA, Hu M, Malik AK, Tanveer M, Suganthan PN. Ensemble deep learning: a review. Eng Appl Artif Intel. 2022;115:105151. doi:10.1016/j.engappai.2022.105151. [Google Scholar] [CrossRef]
32. Dong X, Yu Z, Cao W, Shi Y, Ma Q. A survey on ensemble learning. Front Comput Sci. 2020;14(2):241–58. doi:10.1007/s11704-019-8208-z. [Google Scholar] [CrossRef]
33. Mohammed A, Kora R. A comprehensive review on ensemble deep learning: opportunities and challenges. J King Saud Univ-Comput Inf Sci. 2023;35(2):757–74. doi:10.1016/j.jksuci.2023.01.014. [Google Scholar] [CrossRef]
34. Meng H, Tong X, Zheng Y, Xie G, Ji W, Hei X. Railway accident prediction strategy based on ensemble learning. Accid Anal Prev. 2022;176(6):106817. doi:10.1016/j.aap.2022.106817. [Google Scholar] [PubMed] [CrossRef]
35. Wang J, Wang D, Zhang F, Yoo CK, Liu H. Soft sensor for predicting indoor PM2.5 concentration in subway with adaptive boosting deep learning model. J Hazard Mater. 2024;465(24):133074. doi:10.1016/j.jhazmat.2023.133074. [Google Scholar] [PubMed] [CrossRef]
36. Bjerga T, Aven T, Zio E. Uncertainty treatment in risk analysis of complex systems: the cases of STAMP and FRAM. Reliab Eng Syst Safe. 2016;156(1):203–9. doi:10.1016/j.ress.2016.08.004. [Google Scholar] [CrossRef]
37. Salmon PM, Hulme A, Walker GH, Waterson P, Berber E, Stanton NA. The big picture on accident causation: a review, synthesis and meta-analysis of AcciMap studies. Saf Sci. 2020;126(4):104650. doi:10.1016/j.ssci.2020.104650. [Google Scholar] [CrossRef]
38. Xie X, Shu X, Fu G, Shen S, Jia Q, Hu J, et al. Accident causes data-driven coal and gas outburst accidents prevention: application of data mining and machine learning in accident path mining and accident case-based deduction. Process Saf Env. 2022;162:891–913. doi:10.1016/j.psep.2022.04.059. [Google Scholar] [CrossRef]
39. Zhu G, Sun R, Fan J, Li F, Hou Y, Yu H, et al. Coupling effect and chain evolution of urban rail transit emergencies. IEEE Trans Intell Transp Syst. 2024;25(1):1044–53. doi:10.1109/TITS.2023.3283100. [Google Scholar] [CrossRef]
40. National emergency response plan for emergencies in urban rail transit operations [Internet]. Beijing, China: General Office of the State Council; 2015 [ cited 2025 Jan 08]. Available from: https://www.gov.cn/zhengce/content/2015-05/14/content_9751.htm. [Google Scholar]
41. Tay JK, Narasimhan B, Hastie T. Elastic net regularization paths for all generalized linear models. J Stat Softw. 2023;106. doi:10.18637/jss.v106.i01. [Google Scholar] [PubMed] [CrossRef]
42. Rätsch G, Onoda T, Müller KR. Soft margins for AdaBoost. Mach Learn. 2001;42(3):287–320. doi:10.1023/A:1007618119488. [Google Scholar] [CrossRef]
43. Frank E, Trigg L, Holmes G, Witten IH. Naive Bayes for regression. Mach Learn. 2000;41(1):5–25. doi:10.1023/A:1007670802811. [Google Scholar] [CrossRef]
44. Wu Y, Feng J. Development and application of artificial neural network. Wirel Pers Commun. 2018;102(2):1645–56. doi:10.1007/s11277-017-5224-x. [Google Scholar] [CrossRef]
45. Smart Nation: Singapore’s Intelligent Transport System (ITS) [Internet]. Singapore: The ASEAN Post; 2018 [cited 2025 Jan 08]. Available from: https://theaseanpost.com/article/smart-nation-singapores-intelligent-transport-system-its. [Google Scholar]
Cite This Article
 Copyright © 2025 The Author(s). Published by Tech Science Press.
This work is licensed under a Creative Commons Attribution 4.0 International License , which permits unrestricted use, distribution, and reproduction in any medium, provided the original work is properly cited.
 Downloads
 Citation Tools