
 Submit a Paper
 Propose a Special lssue
 Open Access
ARTICLE
Automated Gleason Grading of Prostate Cancer from Low-Resolution Histopathology Images Using an Ensemble Network of CNN and Transformer Models
1 School of Informatics, Kochi University of Technology, Kami, 782-8502, Japan
2 RIoT Center, Independent University, Bangladesh, Dhaka, 1229, Bangladesh
3 Department of Histopathology, Armed Forces Institute of Pathology, Dhaka, 1216, Bangladesh
4 Information Systems Department, College of Computer and Information Sciences, Imam Mohammad Ibn Saud Islamic University (IMSIU), Riyadh, 11432, Saudi Arabia
5 Department of Computer Sciences, College of Computer and Information Sciences, Princess Nourah bint Abdulrahman University, Riyadh, 11671, Saudi Arabia
* Corresponding Author: Md Shakhawat Hossain. Email:
# These authors contributed equally to this work
(This article belongs to the Special Issue: Cutting-Edge Machine Learning and AI Innovations in Medical Imaging Diagnosis)
Computers, Materials & Continua 2025, 84(2), 3193-3215. https://doi.org/10.32604/cmc.2025.065230
Received 07 March 2025; Accepted 16 May 2025; Issue published 03 July 2025
 View Full Text
 Download PDF
Abstract
One in every eight men in the US is diagnosed with prostate cancer, making it the most common cancer in men. Gleason grading is one of the most essential diagnostic and prognostic factors for planning the treatment of prostate cancer patients. Traditionally, urological pathologists perform the grading by scoring the morphological pattern, known as the Gleason pattern, in histopathology images. However, this manual grading is highly subjective, suffers intra- and inter-pathologist variability and lacks reproducibility. An automated grading system could be more efficient, with no subjectivity and higher accuracy and reproducibility. Automated methods presented previously failed to achieve sufficient accuracy, lacked reproducibility and depended on high-resolution images such as . This paper proposes an automated Gleason grading method, ProGENET, to accurately predict the grade using low-resolution images such as . This method first divides the patient’s histopathology whole slide image (WSI) into patches. Then, it detects artifacts and tissue-less regions and predicts the patch-wise grade using an ensemble network of CNN and transformer models. The proposed method adapted the International Society of Urological Pathology (ISUP) grading system and achieved 90.8% accuracy in classifying the patches into healthy and Gleason grades through using WSI, outperforming the state-of-the-art accuracy by 27%. Finally, the patient’s grade was determined by combining the patch-wise results. The method was also demonstrated for grading and binary classification of prostate cancer, achieving 93.0% and 99.6% accuracy, respectively. The reproducibility was over 90%. Since the proposed method determined the grades with higher accuracy and reproducibility using low-resolution images, it is more reliable and effective than existing methods and can potentially improve subsequent therapy decisions.Keywords
A prostate is a small, walnut-shaped soft organ in men whose primary function is to produce seminal fluids. Healthy prostate tissue consists of non-glandular stroma and stroma-surrounding glands. The normal glands consist of a lumen and epithelial cells. Cancer of the prostate causes uncontrolled replication of epithelial cells, which disrupts the regular arrangement of glands. The uncontrolled replication of epithelial cells replaces the stroma and lumen in high-grade cancers. Most cases of prostate cancer are found on the gland’s periphery. Prostate cancer is the second-deadliest cancer in men in the United States [1,2]. The American Cancer Society estimates it will result in about 35,250 new cases and 299,010 new cases in 2024 worldwide [3].
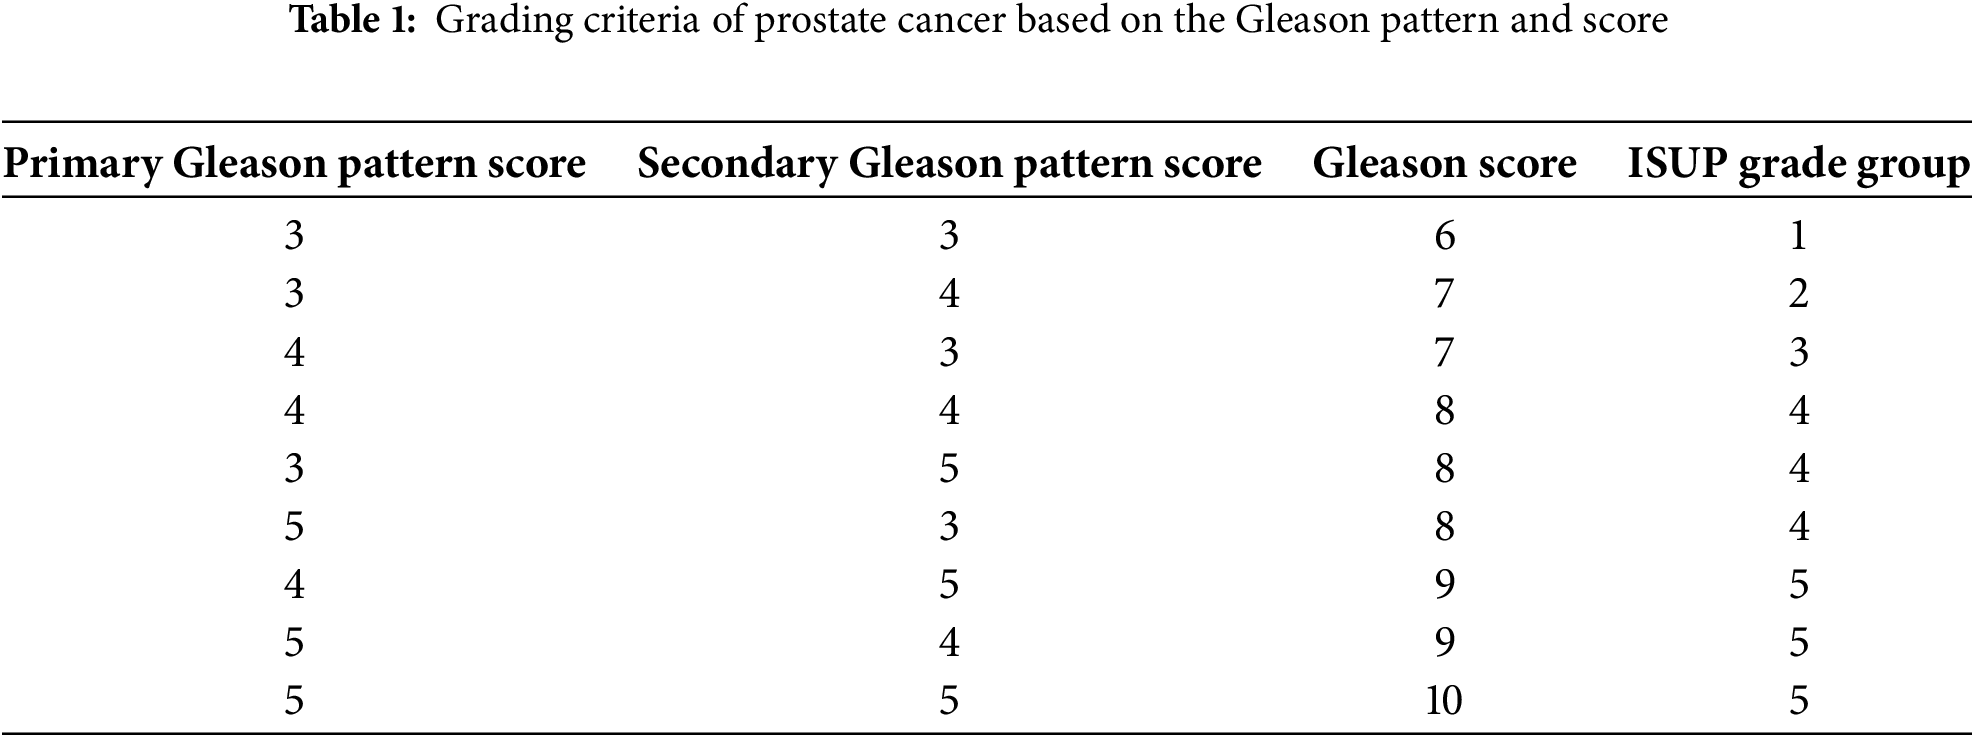
The Gleason grading, proposed by Donald Gleason in 1974, is the most reliable and widely used diagnosis to estimate the aggressiveness of prostate cancer [4]. The International Society for Urological Pathology (ISUP) later revised this grading system in 2005 and 2014 [5]. The Gleason grading involves identifying the tissue pattern related to the tumor’s architectural growth pattern and scoring it. The two most common patterns, primary and secondary, are identified. The most common pattern is the primary or major pattern, and the second most common pattern is the secondary or minor pattern. Each pattern is scored between 1 and 5 depending on its tissue morphology, according to Fig. 1. The pattern is scored one if the tissue cells or glands are dense, uniform, small and well-differentiated. If the pattern shows well-differentiated but loosely arranged glands with more spaces, then it is scored as 2. The Gleason pattern with a score of 2 shows more stroma. The pattern of distinct interpretation of cells from glands at the margins is scored as 3. The Gleason pattern, with a score of four, is characterized by poorly differentiated glands and abnormal masses of cells in the glands. Finally, the pattern that shows irregular glands or lacks glandular differentiation is scored 5. After scoring the primary and secondary pattern, they are summed up to determine the final Gleason grade, as shown in Table 1. The Gleason grade is defined as twice the primary pattern if the secondary pattern is missing.

Figure 1: Gleason patterns and their corresponding grades and properties
Traditionally, pathologists determine the grade by assessing and scoring the tumor structural growth pattern in a Hematoxylin and Eosin (H&E) stained tissue prepared from the patient’s biopsy. Previously, pathologists examined the tissue specimen using a microscope by zooming and panning the entire slide. With the advent of the whole slide imaging (WSI) technique, it is now possible to convert the entire tissue specimen into high-resolution digital images, called WSI. WSI can be observed on a computer screen and controlled using a computer mouse, reducing the labor and hustle for manual naked-eye observation of specimens. Nevertheless, the manual examination is still time-consuming, subjective and lacks reproducibility. An image-based automated system would be more practical and efficient due to its ability to significantly reduce the analysis time and labor, eliminate inter and intra-observer variability, and improve reproducibility.
This paper presents an artificial intelligence (AI)-guided image-based method for automated Gleason grading of prostate cancer patients from their H&E WSIs. The proposed method relies on an ensemble network of selected deep-learning models and utilizes the entire WSI instead of pattern-segmented regions of the specimen to predict the Gleason grade of the patient. In this paper, the proposed prostate grading ensemble network is termed ProGENET. Combining multiple deep learning models was found more effective in achieving high accuracy and reproducibility for prostate cancer grading [2] using low-resolution images. This study combined multiple deep learning models of the two most successful image classification architectures: convolutional neural network (CNN) and image transformer.
Most existing methods predicted primary and secondary Gleason scores using deep learning models and then combined the predicted scores to determine the grades. However, in this study, we trained the models to directly predict the grades from the raw pixel data of the image patches extracted from the WSI, taking advantage of deep learning techniques to map raw pixels of images to the desired outputs directly. However, training the models on vast pixel data is highly time-consuming. Therefore, in this study, we utilized a low-resolution WSI of
Several methods have been proposed in the last twenty years to facilitate the autonomous Gleason grading of prostate cancer from histopathology images. While many of these methods leverage deep learning architectures for automated feature extraction, some rely on traditional machine learning techniques. These automated or semi-automated prostate cancer grading methods can be broadly classified into three categories: (1) traditional machine learning-based methods, (2) deep learning-based methods, and (3) hybrid approaches that integrate both traditional and deep learning models.
Traditional machine learning models such as Support Vector Machine (SVM), Random Forest (RF), K-Nearest Neighbors (KNN), Naive Bayes (NB) Logistic Regression (LR) and Decision Trees (DT) rely on handcrafted features extracted from the images, as opposed to the automatic feature extraction typical in deep learning models. These models require domain expertise to identify relevant features and usually perform well with structured data or smaller datasets. They are computationally efficient, easy to interpret and suitable for training the network using a comparatively small dataset. One of the very first methods for automated Gleason grading was proposed by Jafari-Khouzani and Soltanian-Zadeh in 2003 [6] and was based on a traditional machine learning model. This method utilized multiple wavelets to extract features from the images. Then, these features were processed using a KNN classifier to determine the Gleason pattern score for each image with 97% accuracy. Jafari-Khouzani reported that using multiple wavelet functions enhances feature extraction. Unlike traditional wavelets, multi-wavelets can simultaneously offer orthogonality, symmetry, and better edge handling, leading to more accurate image texture classification. This method extracted features from the entire image instead of focusing on individual cells or gland structures. This comprehensive feature extraction could contribute to the high classification accuracy of the proposed method. Although this method achieved high accuracy, their dependency on the
Later, in 2007, Tabesh et al. trained an SVM model to classify histopathology images into low and high-risk Gleason grades based on the images’ color, texture, and morphometric features [7]. They utilized
Similarly, Khurd et al. proposed another SVM-based method utilizing Spatial Pyramid Match Kernel and texture features [10]. They achieved 88.8% accuracy but considered only Gleason grades 3 and 4. Xu et al. also proposed an SVM-based classification of prostate texture features [11]. This method utilized a
Deep learning-based models can automatically learn relevant features from raw images, reducing the need for manual feature extraction and domain expertise. These networks, such as CNN and transformers, can learn and model complex, non-linear relations within the images that may be challenging for traditional models. Gummeson et al. [13] proposed a CNN-based approach to directly predict the Gleason grade for the
Moreover, such a large population of tissue specimens is not always available. Therefore, TMA-based Gleason grading is not suitable for routine practical use. Strom et al. [15] proposed another deep learning-based method in which they developed an ensemble network of Inception-based CNN models. This Inception model ensemble was first tested to classify the images into benign and malignant classes. Later, the malignant classes were sub-classified into Gleason grades 3 through 5. This model was trained using
Silva-Rodriguez proposed a weakly-supervised CNN method for the semantic segmentation of prostate histology images based on the Gleason scores [17]. This method utilized global Gleason scores given by pathologists for training, eliminating the need for pixel-level annotations. The weakly supervised network performs multi-class segmentation through a global aggregation layer, providing localized cancerous pattern detection at the pixel level. Although this reduced the burden of massive data annotation, it achieved a Cohen’s quadratic kappa of only 0.67. Li et al. proposed a region-based CNN model to differentiate between low-grade and high-grade prostate cancers [18]. This model leverages a multi-task approach with two main components: an Epithelial Network Head and a Grading Network Head, each optimized for different subtasks within prostate cancer diagnosis. The Epithelial Network Head focuses on detecting cancerous epithelial cells, while the Grading Network Head performs Gleason grading by examining glandular patterns to classify cancer aggressiveness. One of the primary advantages of this multi-task R-CNN is its ability to incorporate contextual information from both network heads, significantly enhancing model performance compared to single-task models. This approach achieved an overall pixel accuracy of 89.4% for grading prostate cancer.
Hybrid networks are those that combine traditional and deep learning models. Källén et al. [19] proposed another method realizing the suitability of SVM for classifying the Gleason patterns. However, their method relied on the CNN architecture for automatic feature extraction. Then, they classified the CNN-extracted features using the SVM classifier. The SVM is traditionally a binary classifier. Therefore, they trained four SVM classifiers and combined them to perform a
Nagpal et al. [21] proposed a two-stage Gleason grading method, combining deep learning technology with traditional machine learning. In the first stage, they predicted the Gleason scores for the image patches using a CNN model. Then, the patch-wise scores were aggregated to determine the slide-level Gleason grading using a KNN model. This method utilized
The review of the existing image-driven automated Gleason grading methods reveals that traditional machine learning-based methods relied heavily on handcrafted features. These methods performed well with optimally selected features for small datasets. Although these methods achieved reasonable accuracy (e.g., 81%–88%) when trained on high-resolution images (e.g.,
Although several AI and image-guided methods were proposed for automating the Gleason grading system, most failed to achieve sufficient accuracy. Some of the methods predicted the Gleason pattern scores or excluded low-risk grades such as grade groups 1 and 2; therefore, evaluating the suitability of these methods in determining the comprehensive Gleason grade for the histopathology image is necessary. The transformer-based models were utilized on a single occasion; therefore, further investigation of their suitability for Gleason grading is necessary. Multiple studies have reported the superiority of transformer models compared to CNN models for diverse medical image classification tasks. Another major problem with the existing methods is their dependency on high-magnification images to achieve sufficient accuracy. Methods proposed by Jafari-Khouzani and Soltanian-Zadeh [6], Gummeson et al. [13] and Bulten et al. [16] achieved sufficient accuracy when trained on
In this study, we have utilized the DiagSet-A https://github.com/michalkoziarski/DiagSet (accessed on 15 May 2025) [23] dataset created by Koziarski et al., which consists of 238 WSIs annotated by expert histopathologists. This dataset contained patch-level Gleason grades for different resolutions. This is one of the significant advantages of this dataset compared to other prostate cancer datasets such as PANDA challenge https://www.nature.com/articles/s41591-021-01620-2#Sec19 (accessed on 15 May 2025) [24] and TCGA dataset https://www.cancerimagingarchive.net/collection/tcga-prad/ (accessed on 15 May 2025) [25]. We used the 10X version of this dataset. We converted the WSIs into image patches based on the annotations of histopathologists to categorize them into background (W), healthy tissue (N), artifacts (A), Gleason grade 1 (
3.2 Overview of the Proposed Method
The proposed ProGENET method determined the Gleason grades of the patients from their H&E stained WSI specimens. The Algorithm 1 shows the detailed algorithm of the proposed method and Fig. 2 shows the simplified flow chart of the method. This method utilized different resolutions of WSI for different operations to achieve sufficient Gleason grading accuracy in optimal time. Due to its vast size, processing the WSI is highly time-consuming, particularly at higher magnification. The WSI utilizes a pyramidal structure which contains different magnification of the images, starting from

Figure 2: Flowchart of the proposed Gleason grading method

The proposed ProGENET method first divided the WSI into non-overlapping image patches of
After eliminating the tissue-less patches, the proposed method processed the
After detecting and eliminating the useless patches, we graded the rest of the image patches, T, where
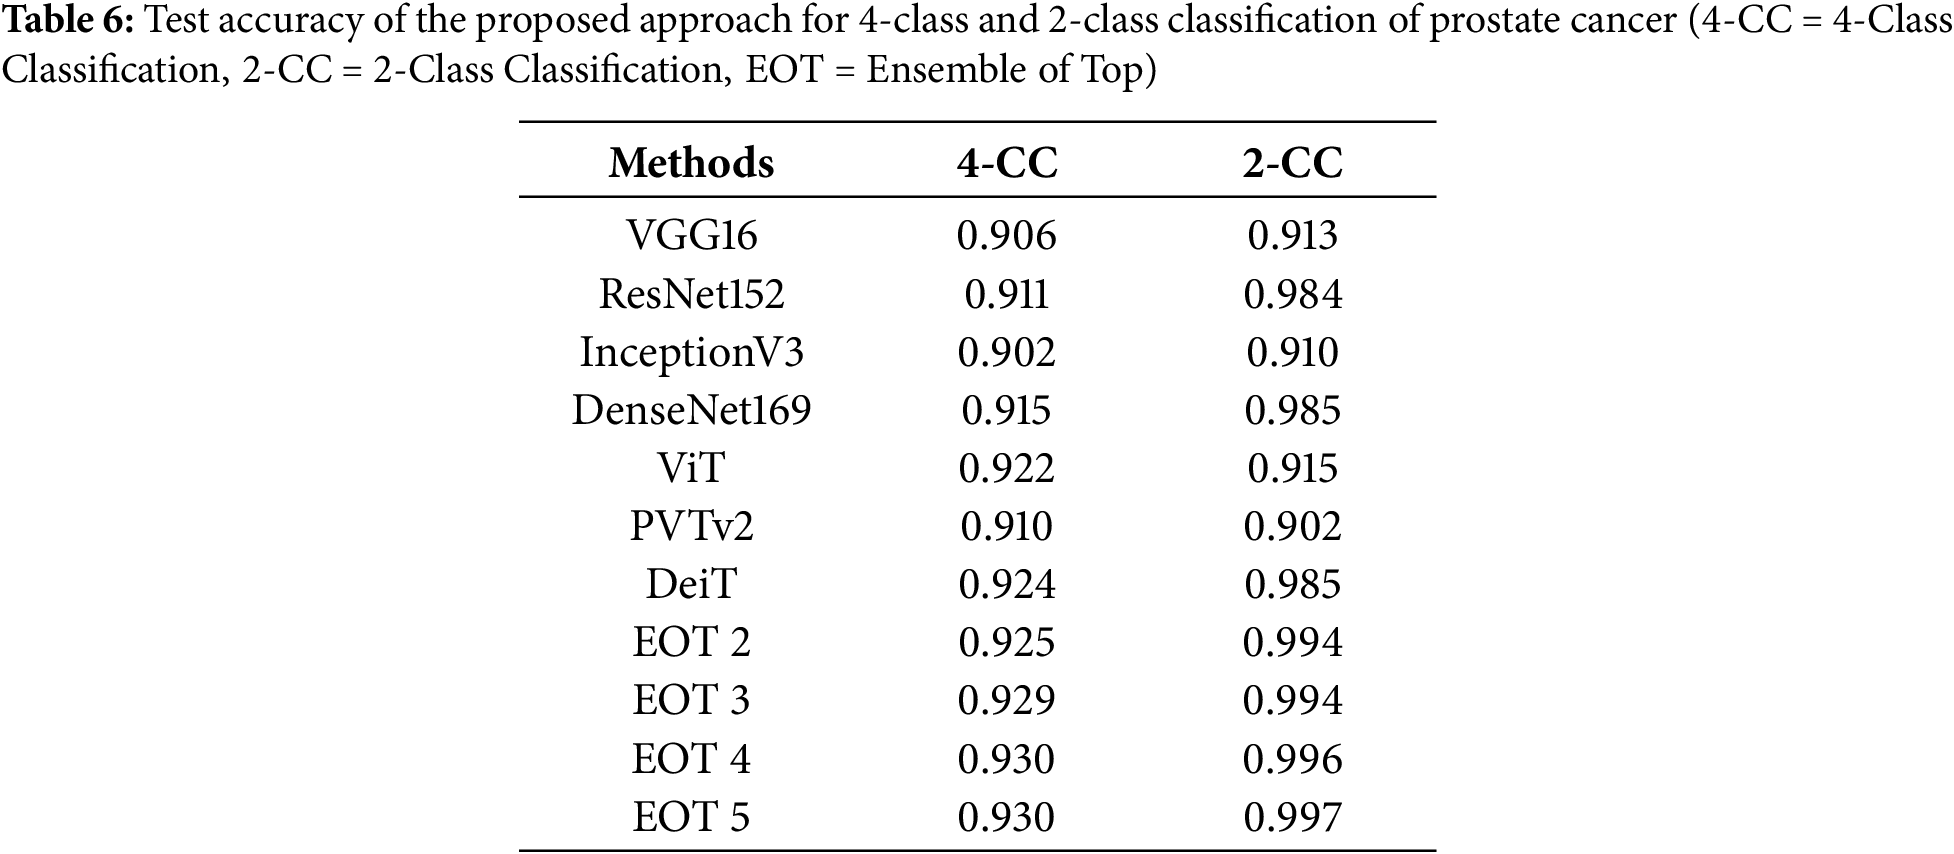
Further, in this study, we applied the proposed ensembled method for

Figure 3: Architecture of the proposed Gleason grading system leveraging digital pathology and ensembled AI
3.3 Ensemble Classifier Development
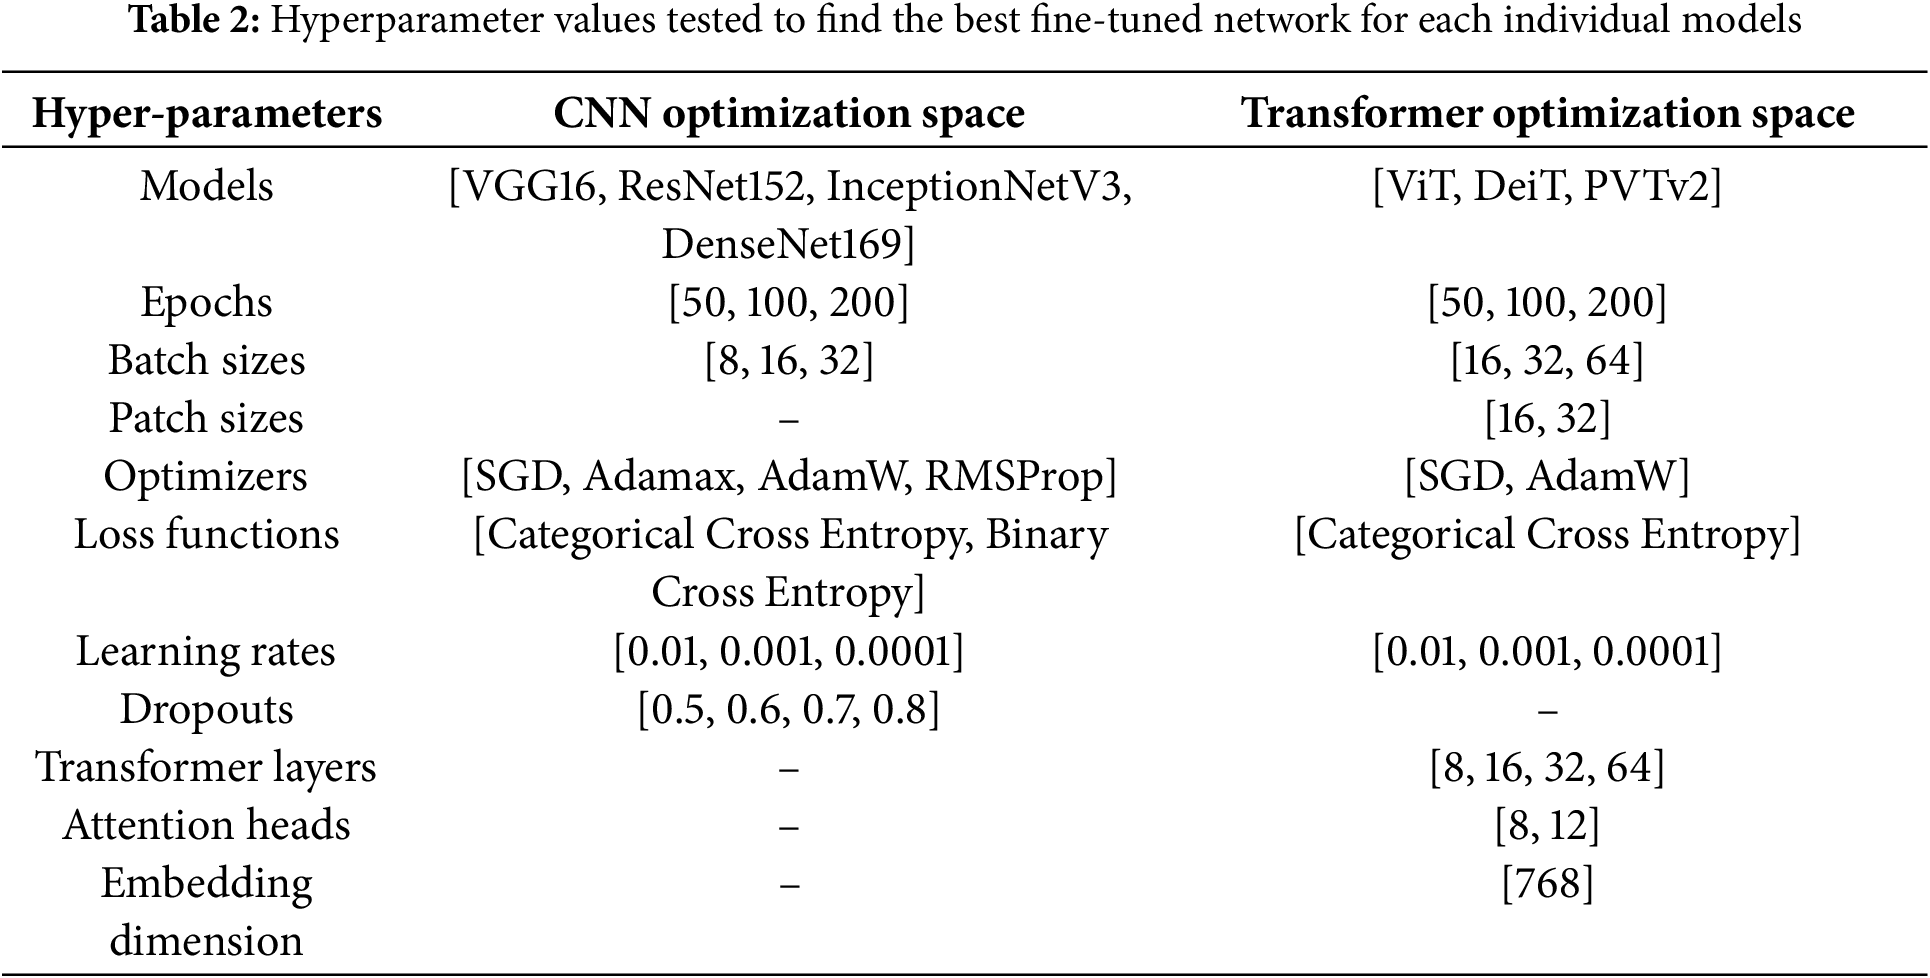
In this study, we experimented with seven individual deep-learning models and their ensemble networks to predict the patch-wise grades. The seven models included three image-based transformer models and four popular CNN models, as shown in Table 2. This table also shows the optimization space for fine-tuning each model. In our experiment, we explored different hyperparameter values through grid search to find the best combination of hyperparameters that results in the best accuracy on the test set. We utilized only 8 and 12 attention heads for the transformer models to make the model fast and less memory-consuming. A higher number of heads allows us to learn more complex patterns in the image, often leading to higher classification accuracy. The individual models were then ranked based on their test accuracy attained by their best-fine-tuned networks.
After that, we created ensemble networks by combining the individual networks. In the ensemble network, each network worked as a base model and processed the input image individually to provide a class prediction value. The class prediction values of the base models were then combined to form a feature vector, which is further processed using another simple classifier to predict the final grade for the image patch. We selected the top two, three, four and five-ranked models to create four combinations of base models for the ensemble network. On top of that, we experimented with six different meta classifiers, which included LR, SVM, RF, KNN, DT and Extreme Learning Machine (ELM) model. The best meta-classifiers were selected based on their accuracy on the test data. After that, we compared the individual networks with their ensemble networks to choose the best network for the proposed method. Then, the proposed method was compared with the state-of-the-art method.
In this study, we predicted the grades of the image patches using an ensemble network of CNN and image-based transformer models, which were finally combined to determine the patient’s grade. Firstly, the best-fine-tuned version of all models was compared based on their accuracy on the test dataset. Table 3 shows the training, validation and test accuracy of the best-fine-tuned version of all models. This table also compares the CNN and transformer models when trained and tested using the same dataset under similar conditions. Fig. 4 shows their box plot comparison. DeiT model achieved the highest test accuracy of 88.0%. The validation accuracy was also highest for DeiT (99.4%) with comparatively low validation loss (2.5%). Therefore, the DeiT model was ranked as the best model. DenseNet169 yielded the second-highest test accuracy of 86.9%. The ViT model achieved similar accuracy to DenseNet169 with lower validation loss and ranked third.
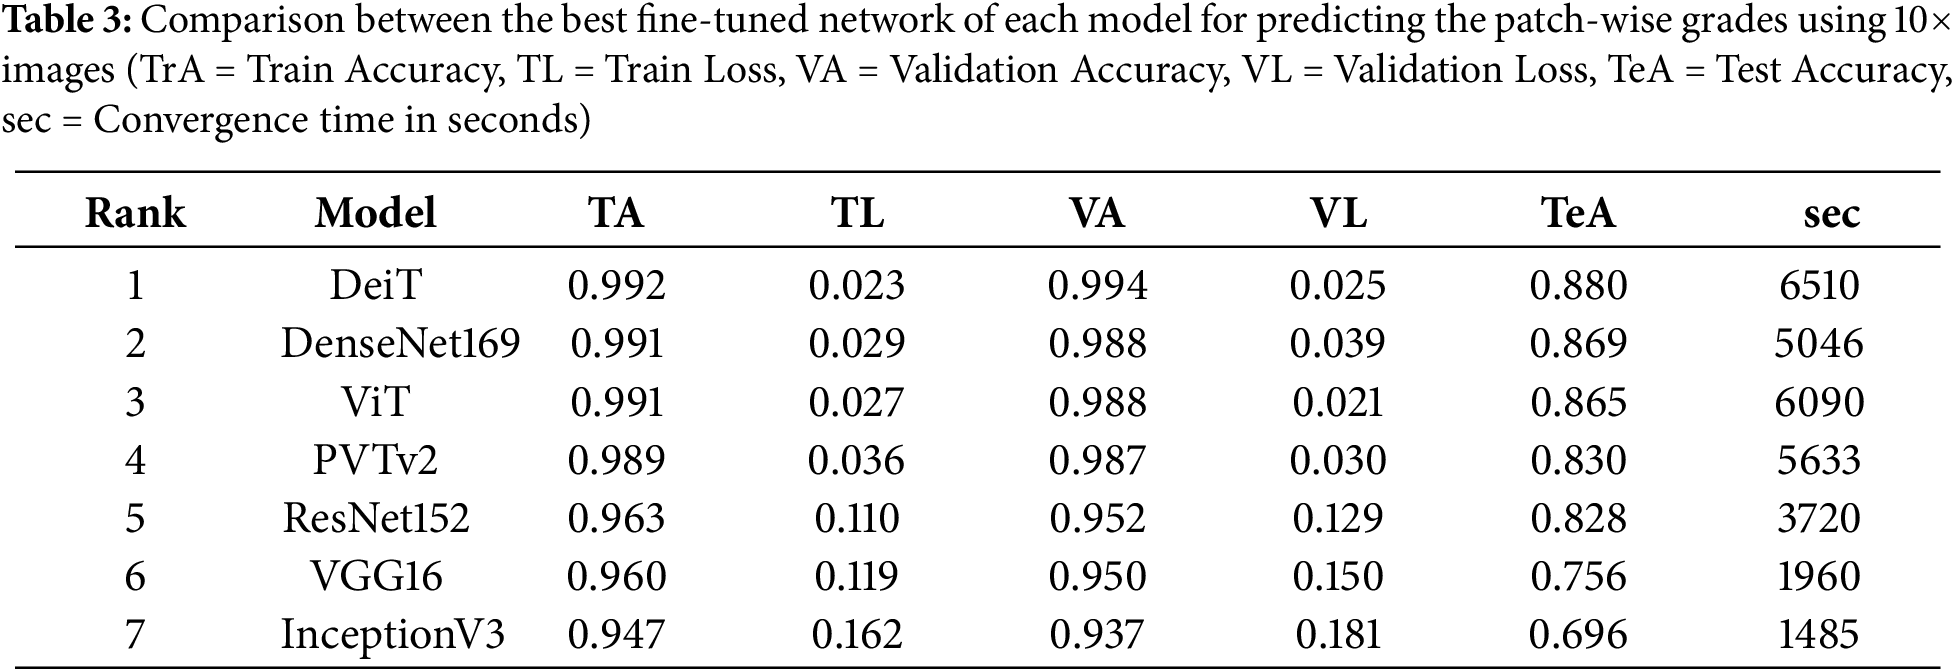

Figure 4: Comparison of the individual and ensemble models using Boxplot
Table 3 also shows the convergence time of the models. Although ViT and DenseNet169 had similar accuracies, ViT had a higher convergence time than DenseNet169. All the transformer models took a comparatively longer time to converge than CNNs when trained using the same data and computational resources; however, they had marginal differences in hyperparameters. DeiT had the highest convergence time. DenseNet169 also had a high convergence time, which could be attributed to its complex architecture and higher number of parameters. The convergence time and the accuracy for the InceptionV3 were the lowest. Figs. 5 and 6 show the validation, training accuracy, and loss curves for the top six models. However, the validation loss was comparatively lower for the CNN models than for the transformers. This indicates the data-hungry nature of transformer models, except for the DeiT model.

Figure 5: Training and validation loss of the models

Figure 6: Training and validation accuracy of the models
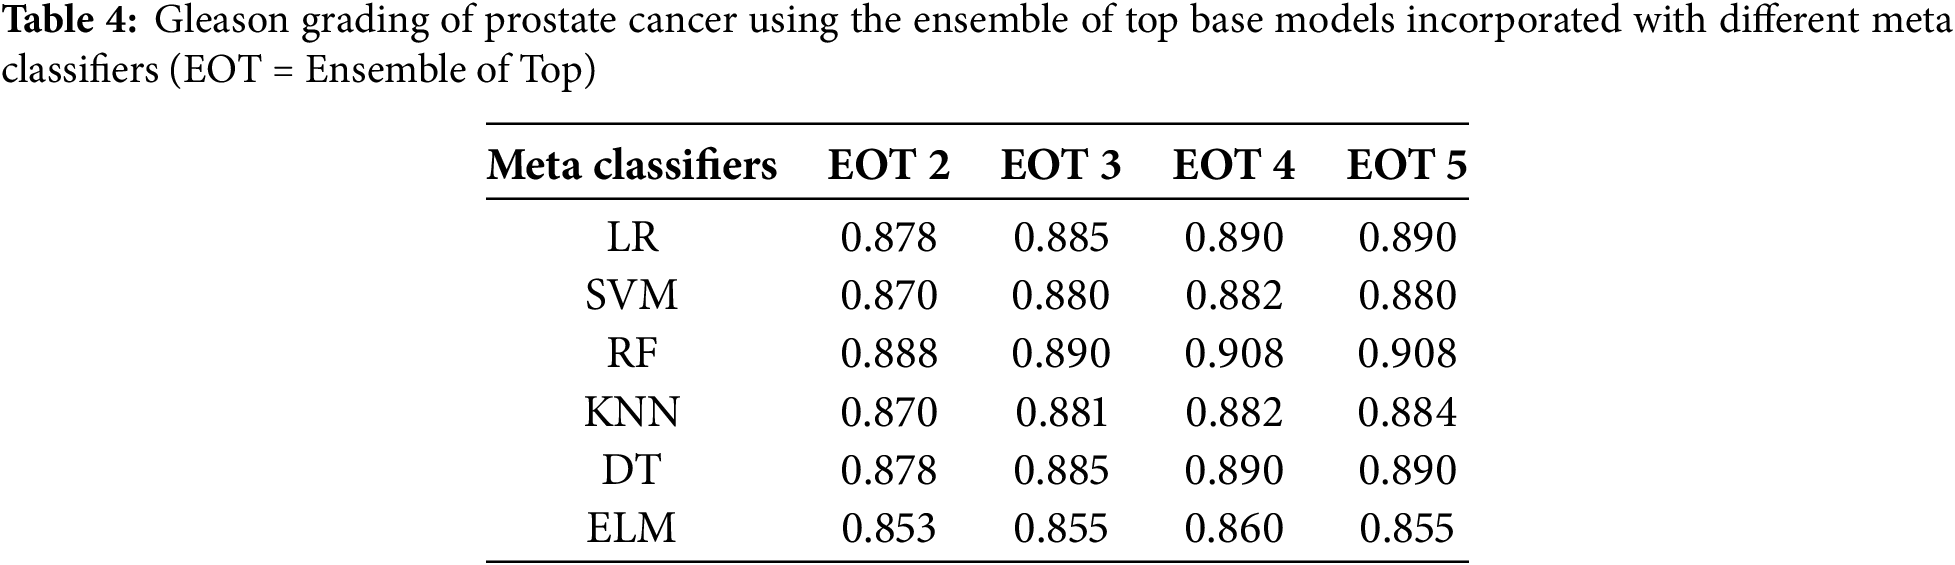
After that, we tested the accuracy of the ensemble networks for which we experimented with different combinations of base models and meta models, as shown in Table 4. Then, we also compared the test accuracy of the individual models with the ensemble models. Table 5 compares the accuracy, precision, recall, F1 score and area under the curve (AUC) on the test dataset. Table 4 shows that the test accuracy increased with the number of base models used in the ensemble network, although the increment is insignificant. The accuracy of the top 4 base models and top 5 base models is indifferentiable, regardless of the meta classifier. The table also shows that the accuracy minimally changed for the different meta-classifiers, irrespective of the combination of base models. However, we selected the RF model as the meta-classifier for the proposed ensemble network as it yielded the highest accuracy of 90.8%. We also selected the combination of the top 4 ranked models as the base model, as it produced similar results to the top 5-ranked models’ ensemble with fewer models.
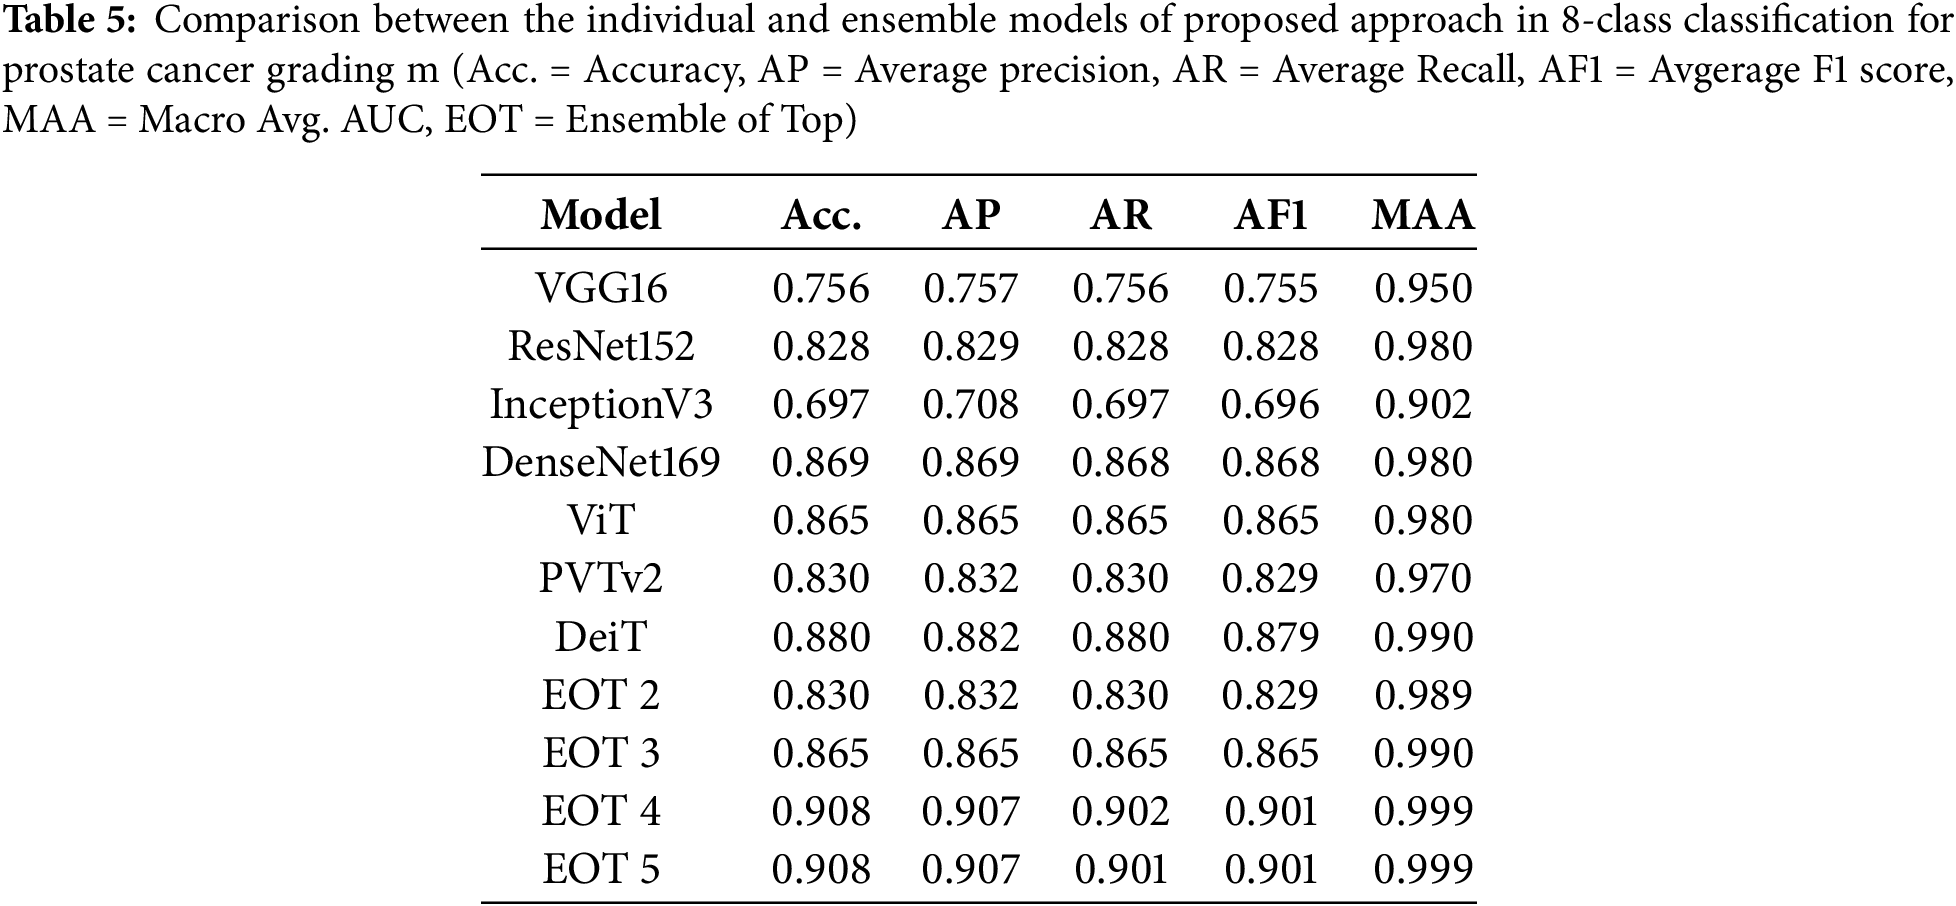
Figs. 7 and 8 show the receiver operating characteristic (ROC) curves and confusion matrices of the best individual models and best-ensembled models, accordingly. The results shown in these figures, along with Fig. 4 and Table 5, indicated that ensembling the models improves the performance of the proposed method. However, the ensemble model of the top

Figure 7: ROC curves of the best individual and ensemble models

Figure 8: Confusion matrices of the best individual and ensemble models
Then, we compared the results of our experiments with the existing methods, shown in Table 7. Firstly, we compared the proposed method with the SOTA method [23]. The best CNN-based model, best transformer-based models and best-ensembled models produced in our study significantly outperformed the corresponding best models of [23] using the same dataset and the same magnification of images. This justifies the design of the proposed method, which separates artifact detection and tissue-less area detection from Gleason grading. Finally, we compared the proposed method with the previously proposed AI and image-based Gleason grading methods, as shown in Table 8. This table shows that the proposed method achieved the highest accuracy of 90.8% for Gleason grading, considering all the Gleason grades and utilizing a low-resolution (
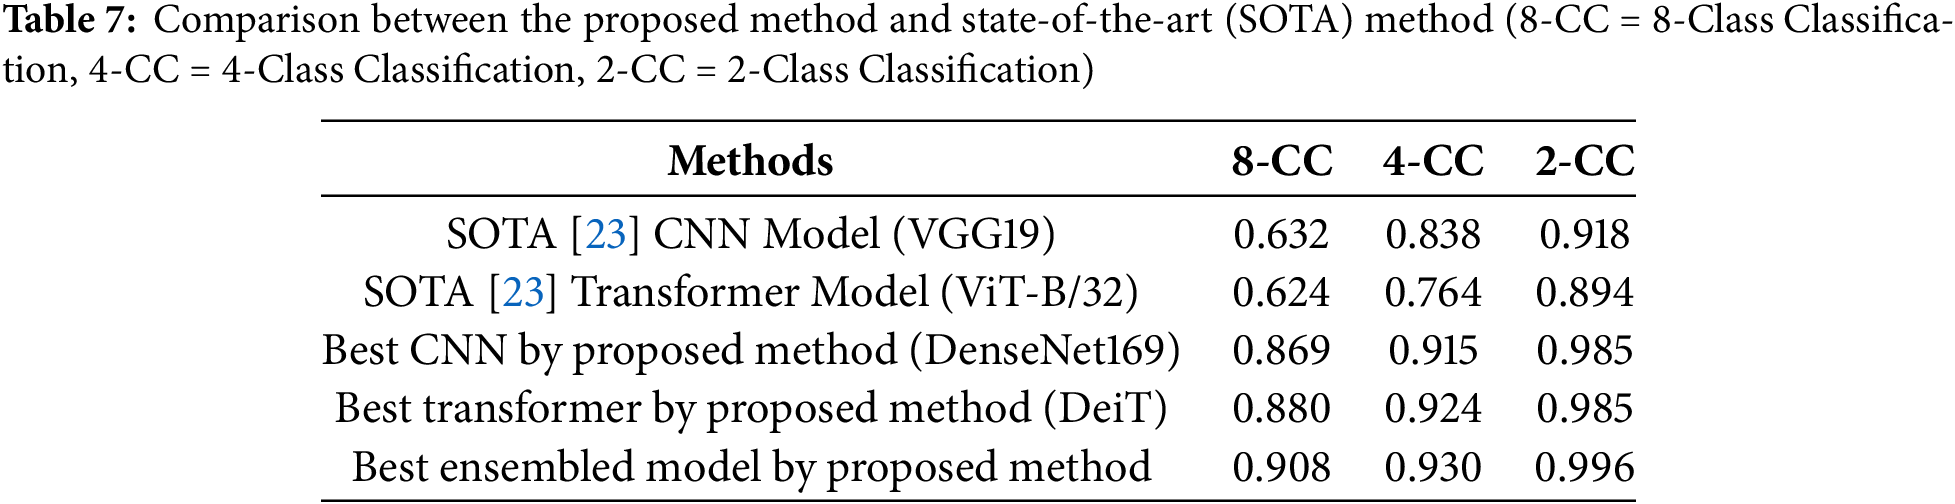

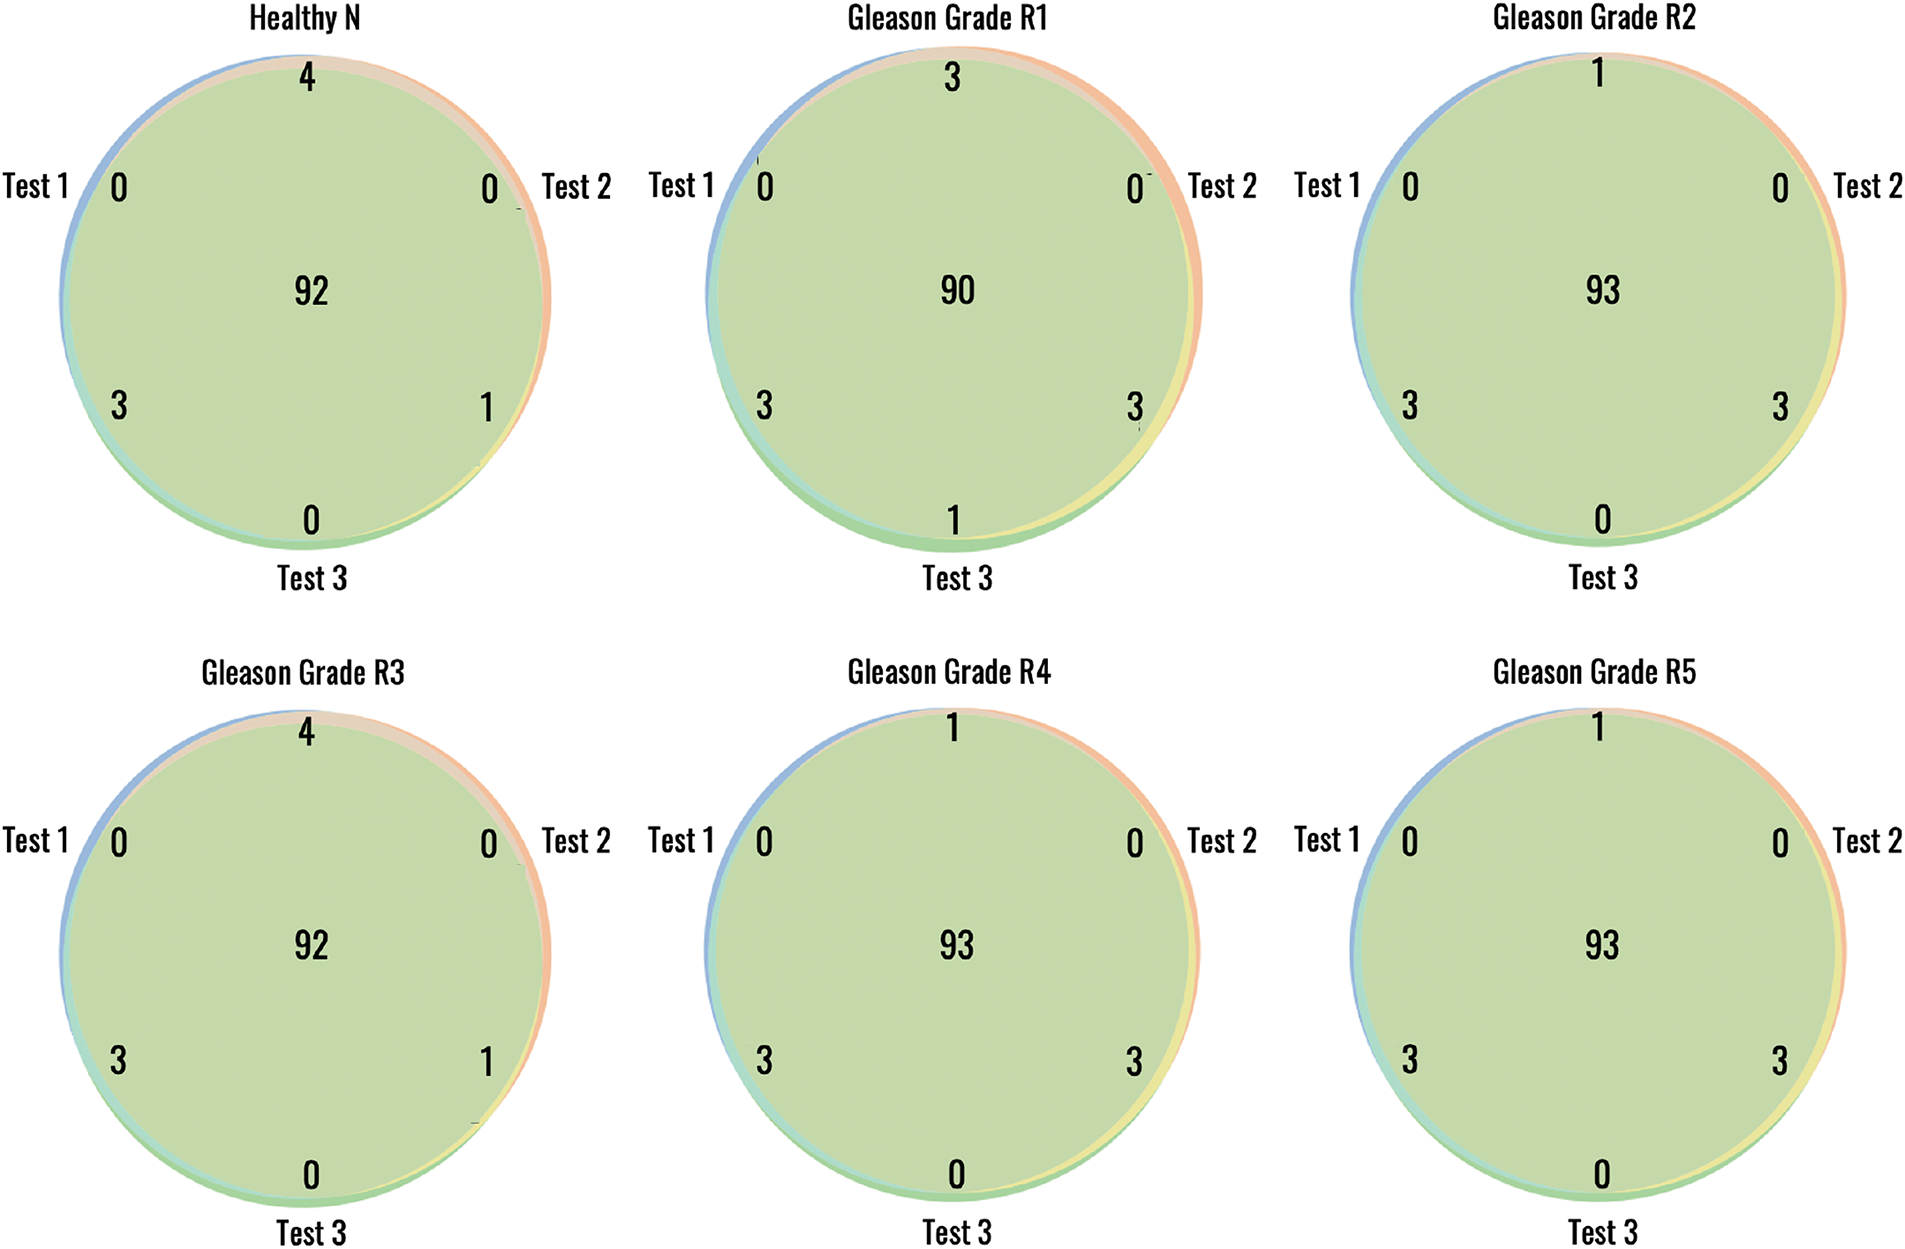
Figure 9: Reproducibility of the proposed method for patch wise Gleason grading from 10× histopathology images
Gleason grading is routinely performed to diagnose and assess the prognosis of prostate cancer patients. It evaluates the morphological pattern of prostate tissue under the microscope and assigns a score that predicts how aggressive the tumor is. However, pathologists’ traditional method of manual Gleason grading has several limitations related to subjectivity, accuracy and reproducibility. Additionally, this manual assessment is highly laborious and time-consuming and with an increasing number of patients, pathologists often need more time to handle heavy workloads, which may impact consistency. Automated AI-guided Gleason grading methods can address these challenges by offering more accurate, consistent, objective and efficient grading, reducing grading time and manual efforts. However, the existing AI-driven methods produced limited accuracy and required high-resolution biopsy images, which affected the grading time.
In this paper, we proposed an ensemble-based AI method that integrated an optimally selected CNN and transformer model to determine the Gleason grade of the patient from a low-resolution image of
The suitability of transformer models for Gleason grading remained unexplored except for the study of Koziarski et al. [23], which experimented with ViT only. In this study, we conducted a detailed survey of transformer models, including the most popular image-based transformers. It also comprehensively compared CNN and transformer models for predicting the patch-wise Gleason grades. The results of this study report that the transformer-based model achieves better accuracy than most CNN models when trained using the same dataset. However, the transformer-based models took a longer time to converge. Occasionally, transformer models are over-fitted except for the DeiT model. This study also compared the performance of individual models with the ensemble of multiple models. This study finds that the ensemble model produces higher accuracy and more consistent results than the individual models, as demonstrated by the ROC curves, confusion matrices and boxplot.
Most of the existing automated Gleason grading methods excluded grades 1 and 2 because these grades represent low-risk, non-aggressive forms of prostate cancer that are rarely diagnosed in clinical practice. However, to develop a fully automated Gleason grading system, the grading method should include all the grades regardless of their low association with aggressive cancer; it is also necessary to integrate automated background and artifact elimination methods with the grading. The proposed method incorporated background and artifact area detection and considered all grades guided by the ISUP grading scheme. This ensures the efficacy of the proposed method for automated Gleason grading for routine use.
One of the major limitations of the ProGENET method is its high computation time for training. Training an ensemble of multiple deep-learning models is time-consuming and requires high computing resources. However, ensemble models’ prediction time is not significantly higher than that of individual models. The individual transformer models were occasionally over-fitted; however, as we have utilized the ensemble, the model over-fitting is not an issue for the proposed method. Another limitation of the current study is that the proposed method was evaluated only on the DiagSet-A dataset [23]. While the results demonstrate high accuracy, further validation on external datasets such as PANDA and TCGA is necessary to assess the model’s generalizability and domain transferability. We are currently developing a clinical application of the system for hospital use, where it will undergo further evaluation in real-world deployment scenarios. This external validation and clinical testing remain a part of our future work.
To evaluate the feasibility of the proposed system for clinical use, we are currently implementing the proposed system using a standard GPU setup. In our experiments, the method required less than 10 s for a WSI, including artifact detection, tissue-less patch filtering, color normalization and patch-wise grading time. This provides a preliminary estimate of the system’s overall processing time per case. However, once the system is deployed in a clinical setting, pathologists will demonstrate it, allowing us to accurately measure the actual inference time per patient case. This will offer a more practical assessment of the system’s usability in routine diagnostic workflows. The proposed system utilizes a modular framework that can be parallelized for scalability, making it adaptable to high-throughput hospital systems. While the current implementation is optimized for research-grade GPUs, future work could explore lightweight variants of our model and techniques like tensor decomposition could be utilized. Another future work of this study includes investigating the impact of the proposed method on the effective selection of patients for therapy.
This paper presented an automated method for grading prostate cancer patients. This method can predict the grades from low-resolution WSI of
Acknowledgement: The authors express their gratitude to Dr. Sahria Bakar of Jessore Medical College for their assistance in preparing the image dataset and evaluating the results of our experiments.
Funding Statement: This work was supported by Princess Nourah bint Abdulrahman University Researchers Supporting Project number (PNURSP2025R104), Princess Nourah bint Abdulrahman University, Riyadh, Saudi Arabia.
Author Contributions: Conceptualization, Md Shakhawat Hossain and Anowar Hussen; methodology, Md Shakhawat Hossain, Md Sahilur Rahman and Munim Ahmed; software, Md Sahilur Rahman and Munim Ahmed; validation, Anowar Hussen, Zahid Ullah and Mona Jamjoom; formal analysis, Md Shakhawat Hossain; investigation, Md Sahilur Rahman; resources, Zahid Ullah; data curation, Anowar Hussen; writing—original draft preparation, Md Shakhawat Hossain and Md Sahilur Rahman; writing—review and editing, Zahid Ullah and Mona Jamjoom; supervision, Md Shakhawat Hossain; project administration, Anowar Hussen; funding acquisition, Zahid Ullah. All authors reviewed the results and approved the final version of the manuscript.
Availability of Data and Materials: The datasets used for this study are available in the Dataset link (accessed on 15 May 2025). The code used in this manuscript is available in this Code link (accessed on 15 May 2025).
Ethics Approval: Not applicable.
Conflicts of Interest: The authors declare no conflicts of interest to report regarding the present study.
References
1. National Cancer Institute. Cancer stat facts: common cancer sites. SEER [Online]. [cited 2025 May 15]. Available from: https://seer.cancer.gov/statfacts/html/common.html. [Google Scholar]
2. Li Y, Huang M, Zhang Y, Chen J, Xu H, Wang G, et al. Automated gleason grading and gleason pattern region segmentation based on deep learning for pathological images of prostate cancer. IEEE Access. 2020;8:117714–25. doi:10.1109/access.2020.3005180. [Google Scholar] [CrossRef]
3. American Cancer Society. Key statistics for prostate cancer [Online]. [cited 2025 May 15]. Available from: https://www.cancer.org/cancer/types/prostate-cancer/about/key-statistics.html. [Google Scholar]
4. Gleason D, Mellinger G. Prediction of prognosis for prostatic adenocarcinoma by combined histological grading and clinical staging. J Urology. 1974;111:58–64. doi:10.1016/s0022-5347(17)59889-4. [Google Scholar] [PubMed] [CrossRef]
5. Faraj S, Bezerra S, Yousefi K, Fedor H, Glavaris S, Han M, et al. Clinical validation of the 2005 ISUP Gleason grading system in a cohort of intermediate and high risk men undergoing radical prostatectomy. PLoS One. 2016;11:e0146189. doi:10.1371/journal.pone.0146189. [Google Scholar] [PubMed] [CrossRef]
6. Jafari-Khouzani K, Soltanian-Zadeh H. Multiwavelet grading of pathological images of prostate. IEEE Transact Biomed Eng. 2003;50:697–704. doi:10.1109/TBME.2003.812194. [Google Scholar] [CrossRef]
7. Tabesh A, Teverovskiy M, Pang H, Kumar V, Verbel D, Kotsianti A, et al. Multifeature prostate cancer diagnosis and Gleason grading of histological images. IEEE Transact Med Imag. 2007;26:1366–78. doi:10.1109/TMI.2007.898536. [Google Scholar] [PubMed] [CrossRef]
8. Alexandratou E, Atlamazoglou V, Thireou T, Agrogiannis G, Togas D, Kavantzas N, et al. Evaluation of machine learning techniques for prostate cancer diagnosis and Gleason grading. Int J Comput Intellig Bioinform Syst Biol. 2010;1:297–315. doi:10.1504/IJCIBSB.2010.031392. [Google Scholar] [CrossRef]
9. Shakhawat H, Nakamura T, Kimura F, Yagi Y, Yamaguchi M. Automatic quality evaluation of whole slide images for the practical use of whole slide imaging scanner. ITE Transact Media Technol Applicat. 2020;8(4):252–68. doi:10.3169/mta.8.252. [Google Scholar] [CrossRef]
10. Khurd P, Bahlmann C, Maday P, Kamen A, Gibbs-Strauss S, Genega E, et al. Computer-aided Gleason grading of prostate cancer histopathological images using texton forests. In: 2010 IEEE International Symposium on Biomedical Imaging: From Nano to Macro; 2010; Rotterdam, The Netherlands. p. 636–9. [Google Scholar]
11. Xu H, Park S, Hwang T. Computerized classification of prostate cancer gleason scores from whole slide images. IEEE/ACM Transact Computat Biol Bioinform. 2019;17:1871–82. doi:10.1109/TCBB.2019.2941195. [Google Scholar] [PubMed] [CrossRef]
12. Wang D, Foran D, Ren J, Zhong H, Kim I, Qi X. Exploring automatic prostate histopathology image gleason grading via local structure modeling. In: 37th Annual International Conference of the IEEE Engineering in Medicine and Biology Society (EMBC); 2015; Milan, Italy. p. 2649–52. [Google Scholar]
13. Gummeson A, Arvidsson I, Ohlsson M, Overgaard N, Krzyzanowska A, Heyden A, et al. Automatic Gleason grading of H and E stained microscopic prostate images using deep convolutional neural networks. In: Medical Imaging 2017: Digital Pathology; 2017; Orlando, FL, USA. Vol. 10140, p. 196–202. [Google Scholar]
14. Arvaniti E, Fricker K, Moret M, Rupp N, Hermanns T, Fankhauser C, et al. Automated Gleason grading of prostate cancer tissue microarrays via deep learning. Scient Rep. 2018;8:12054. doi:10.1038/s41598-018-30535-1. [Google Scholar] [PubMed] [CrossRef]
15. Ström P, Kartasalo K, Olsson H, Solorzano L, Delahunt B, Berney D, et al. Pathologist-level grading of prostate biopsies with artificial intelligence. arXiv:1907.01368. 2019. [Google Scholar]
16. Bulten W, Pinckaers H, Boven H, Vink R, Bel T, Ginneken B, et al. Automated deep-learning system for Gleason grading of prostate cancer using biopsies: a diagnostic study. Lancet Oncol. 2020;21:233–41. doi:10.1016/S1470-2045(19)30739-9. [Google Scholar] [PubMed] [CrossRef]
17. Silva-Rodriguez J, Colomer A, Naranjo V. WeGleNet: a weakly-supervised convolutional neural network for the semantic segmentation of Gleason grades in prostate histology images. Comput Med Imaging Graph. 2021;88(1):101846. doi:10.1016/j.compmedimag.2020.101846. [Google Scholar] [PubMed] [CrossRef]
18. Li W, Li J, Sarma K, Ho K, Shen S, Knudsen B, et al. Path R-CNN for prostate cancer diagnosis and gleason grading of histological images. IEEE Transact Med Imag. 2018;38:945–54. doi:10.1109/TMI.2018.2875868. [Google Scholar] [PubMed] [CrossRef]
19. Källén H, Molin J, Heyden A, Lundström C, Astrom K. Towards grading gleason score using generically trained deep convolutional neural networks. In: 2016 IEEE 13th International Symposium on Biomedical Imaging (ISBI); 2016; Prague, Czech Republic. p. 1163–7. [Google Scholar]
20. Ren J, Sadimin E, Foran D, Qi X. Computer aided analysis of prostate histopathology images to support a refined Gleason grading system. In: Medical Imaging 2017: Image Processing. 2017; Orlando, FL, USA. Vol. 10133, p. 532–9. [Google Scholar]
21. Nagpal K, Foote D, Liu Y, Chen P, Wulczyn E, Tan F, et al. Development and validation of a deep learning algorithm for improving Gleason scoring of prostate cancer. npj Digital Medicine. 2019;2:48. doi:10.1038/s41746-019-0112-2. [Google Scholar] [PubMed] [CrossRef]
22. Karimi D, Nir G, Fazli L, Black P, Goldenberg L, Salcudean S. Deep learning-based gleason grading of prostate cancer from histopathology images—role of multiscale decision aggregation and data augmentation. IEEE J Biomed Health Inform. 2019;24(5):1413–26. doi:10.1109/jbhi.2019.2944643. [Google Scholar] [PubMed] [CrossRef]
23. Koziarski M, Cyganek B, Niedziela P, Olborski B, Antosz Z, żydak M, et al. DiagSet: a dataset for prostate cancer histopathological image classification. Scient Rep. 2024;14:6780. doi:10.1038/s41598-024-52183-4. [Google Scholar] [PubMed] [CrossRef]
24. Bulten W, Kartasalo K, Chen P, Ström P, Pinckaers H, Nagpal K, et al. Artificial intelligence for diagnosis and Gleason grading of prostate cancer: the PANDA challenge. Nature Med. 2022;28:154–63. doi:10.1038/s41591-021-01620-2. [Google Scholar] [PubMed] [CrossRef]
25. Zuley ML, Jarosz R, Drake BF, Rancilio D, Klim A, Rieger-Christ K, et al. The cancer genome atlas prostate adenocarcinoma collection (TCGA-PRAD) (Version 4) [Data set]. The Cancer Imaging Archive; 2016. doi:10.7937/K9/TCIA.2016.YXOGLM4Y. [Google Scholar] [CrossRef]
26. Hossain M, Shahriar G, Syeed M, Uddin M, Hasan M, Hossain M, et al. Tissue artifact segmentation and severity assessment for automatic analysis using wsi. IEEE Access. 2023;11:21977–91. doi:10.1109/ACCESS.2023.3250556. [Google Scholar] [CrossRef]
Cite This Article
 Copyright © 2025 The Author(s). Published by Tech Science Press.
This work is licensed under a Creative Commons Attribution 4.0 International License , which permits unrestricted use, distribution, and reproduction in any medium, provided the original work is properly cited.
 Downloads
 Citation Tools