
 Submit a Paper
 Propose a Special lssue
 Open Access
REVIEW
A Comprehensive Review on File Containers-Based Image and Video Forensics
1 Hubei Key Laboratory of Intelligent Vision Based Monitoring for Hydroelectric Engineering, College of Computer and Information Technology, China Three Gorges University, Yichang, 443002, China
2 Department of Information Engineering, University of Florence, via di S. Marta 3, Firenze, 50134, Italy
* Corresponding Author: Pengpeng Yang. Email:
Computers, Materials & Continua 2025, 85(2), 2487-2526. https://doi.org/10.32604/cmc.2025.069129
Received 15 June 2025; Accepted 13 August 2025; Issue published 23 September 2025
 View Full Text
 Download PDF
Abstract
Images and videos play an increasingly vital role in daily life and are widely utilized as key evidentiary sources in judicial investigations and forensic analysis. Simultaneously, advancements in image and video processing technologies have facilitated the widespread availability of powerful editing tools, such as Deepfakes, enabling anyone to easily create manipulated or fake visual content, which poses an enormous threat to social security and public trust. To verify the authenticity and integrity of images and videos, numerous approaches have been proposed, which are primarily based on content analysis and their effectiveness is susceptible to interference from various image or video post-processing operations. Recent research has highlighted the potential of file containers analysis as a promising forensic approach that offers efficient and interpretable results. However, there is still a lack of review articles on this kind of approach. In order to fill this gap, we present a comprehensive review of file containers-based image and video forensics in this paper. Specifically, we categorize the existing methods into two distinct stages, qualitative analysis and quantitative analysis. In addition, an overall framework is proposed to organize the exiting approaches. Then, the advantages and disadvantages of the schemes used across different forensic tasks are provided. Finally, we outline the trends in this research area, aiming to provide valuable insights and technical guidance for future research.Keywords
The rapid development of social media, surveillance systems, smart devices, reportage and other fields has led to a dramatic increase in the rate of generation and dissemination of digital images and videos. According to statistics [1–5], the amount of such digital media generated and transmitted globally every year is growing exponentially, and this trend will continue in the coming years. However, the continuous progress of image and video processing technology, such as Deepfakes [6–8], makes the spread of false information more covert and difficult to identify, which poses a threat to the authenticity and integrity of multimedia content [9–12]. To overcome these challenges, the editing history behind images and videos is revealed through in-depth content analysis [13–17] and file container interpretation, which provides reliable evidence for judicial and security fields.
In recent years, there have been numerous review articles on content-based forensic analysis [18–22]. For example, Verdoliva [23] analyzes methods for verifying the integrity of visual media, specifically the detection of tampered images and videos, with a particular emphasis on deepfake detection and data-driven forensic techniques. Piva [24] presents a review on the source and authenticity of images by categorizing methods into acquisition-based, coding-based, and editing-based schemes based on the position in the history of the digital image where relevant trace is left. Yang et al. [25] provide a survey of deep learning-based source image forensics, encompassing source camera identification [26], recaptured image forensic, computer graphics image forensic, GAN-generated image detection, source social network identification, anti-forensics, and counter anti-forensics. Pasquini et al. [27] survey on source identification and integrity verification of media uploaded to social networks, provenance analysis of sharing platforms, and the evaluation of the credibility of media alongside its associated textual information. Akbari et al. [28] systematically review the technological advancements in the field of source video identification over the past decade, including PRNU and machine learning methods.
Although the methods introduced in the previously mentioned reviews perform well in specific scenarios, their effectiveness can be affected by various post-processing operations. In recent years, file containers-based methods have gradually gained attention, as they do not rely on visual content and can provide interpretable results. There are currently no review articles focusing on such technique. In order to fill this gap, we present a comprehensive review and summarizing the recent advances in image and video forensics techniques based on file containers. We propose an overall framework to systematically organize existing methods for image and video forensics. Firstly, the methods are grouped into two stages: qualitative analysis and quantitative analysis. Qualitative analysis involves examining changes in the features of these files before and after editing to determine whether they have been modified. In contrast, quantitative analysis in image forensics comprises equivalence classes, feature extraction, feature classification, and feature fusion. For video forensics, quantitative analysis includes video container parsing, symbolic representation, symbol selection, feature representation, feature classification, and feature fusion. In addition, public datasets, performance comparisons, and discussion about future directions are presented.
The remainder of this review is organized as follows. Section 2 presents the methodology we used for the literature search. Section 3 introduces an overview of JPEG file containers and their associated forensic analysis techniques. Section 4 then reviews common video containers and the corresponding video forensic schemes. Section 5 provides the public datasets on image and video forensic, parsing tools, and experimental performance comparison. Finally, in Section 6, the analyses are presented, and the conclusions are drawn.
2 Literature Search Methodology
Literature search is a critical component of academic research, not only keeping researchers informed about current trends in their field but also providing a theoretical foundation for designing new studies. The first step involves selecting an appropriate database. Given that different databases offer varied types and scopes of academic resources, choosing a field-appropriate database is essential. For this paper, we conducted our literature search using Google Scholar, leveraging its vast database which covers important journal articles, conference papers, books, and patents across diverse disciplines. This approach enabled access to the latest research findings and literature trends, ensuring the selected references were both representative and relevant, thus providing a solid foundation for this study. Next, we selected several thematic keywords in the field of image and video forensics, such as “image forensics”, “video forensics”, “file container analysis” and conducted a literature search on Google Scholar to ensure coverage of the core research areas within this field. In this step, we also performed bibliographic coupling analysis to explore the co-occurrence of the keywords and visualized these relationships, as shown in Fig. 1. Each circle in the figure represents a keyword, with closer proximity indicating a stronger relationship between the keywords. We analyzed the co-occurrence of keywords in the literature to determine their interconnections. The results show that the primary keyword is “metadata” with related keywords including “image forensics”, “forensic analysis”, “video forensics”, “digital forensics” and “source identification”.
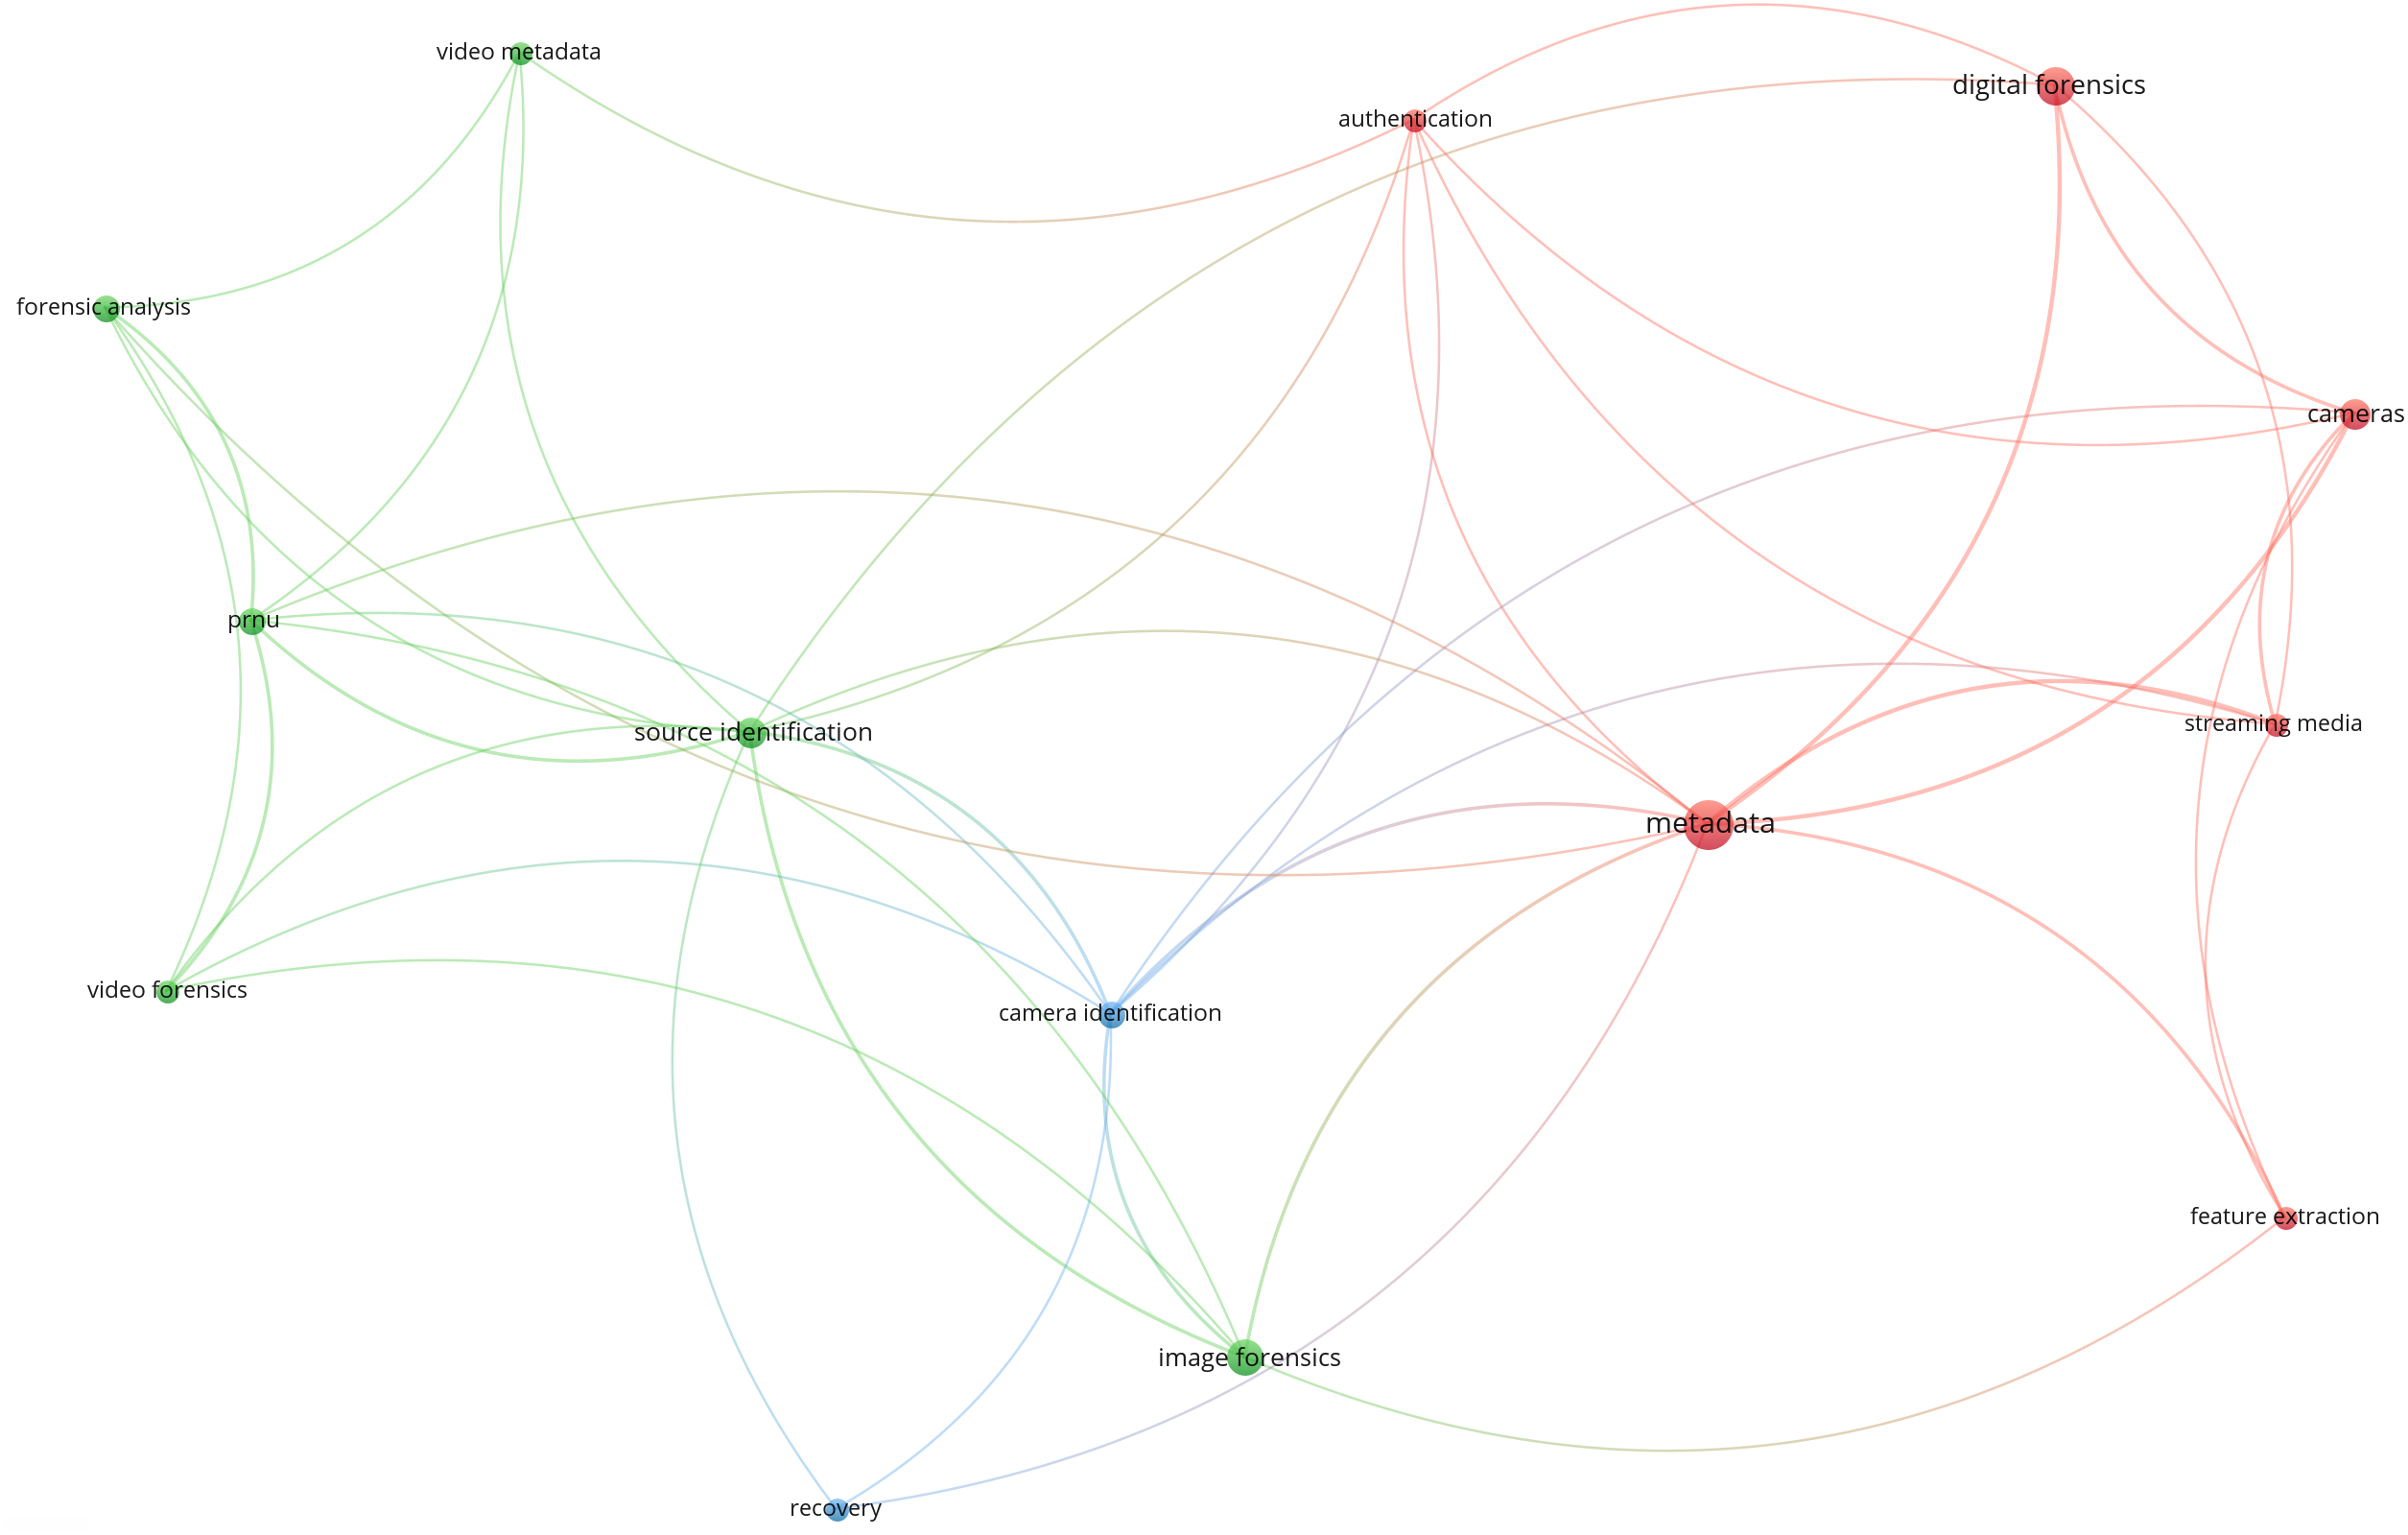
Figure 1: Visualization of keywords
Subsequently, our search was narrowed by applying temporal criteria to ensure the inclusion of the latest research findings. We therefore focused our selection on the most top-cited papers and patents from the past five years, particularly those published in high-impact journals and conferences. This process yielded a final corpus of 53 publications. Following this, we conducted an in-depth analysis of each paper’s core contributions, research motivations, and impact within the field. The final step was to organize this collection into a coherent structure. To this end, we meticulously grouped the literature based on the specific research tasks addressed within image and video forensics. This classification method provides the framework for our review, helping to clarify the application of various technologies and track their progress.
3 Image File Container Analysis and Key Technology
Image file containers adhere to specific standards, with each container characterized by a fixed file structure and data organization methodology. Each format has specific file headers, metadata, data encoding methods, and compression algorithms, which leave specific structural characteristics during the generation, storage, and transmission of images. These characteristics may change when images are modified, edited or tampered. Moreover, these containers typically contain rich metadata, which record information such as shooting time, device details, exposure time, and even traces of image editing. It can offer valuable insights for forensic. Therefore, file containers based analysis could provide powerful clues for image forensics.
At present, image forensics based on file containers primarily focuses on the following three tasks: source camera identification, image sharing chain detection, and forgery detection. For the source camera identification, since image file containers conform to specific standards, images captured by the same model should share the same container properties. Based on this, researchers have developed methods using equivalence classes. In the image sharing chain detection, because different social media platforms employ unique methods for processing images, particularly in the image compression process, researchers have attempted to utilize features such as DCT coefficients, the number of entries in EXIF data, the number of marker segments, and metadata. For the forgery detection, EXIF metadata, marker segments, quantization tables, and Huffman coding tables are susceptible to modification during the tampering process. Based on this, some researchers perform detection by comparing the differences between original and edited images. Additionally, researchers take into account image noise, as it is an inherent property introduced during the camera capture process, and tampering operations disrupt this property. They integrate noise features with EXIF metadata features, leveraging the correlation between these two elements for detection.
The following section briefly introduces the JPEG file container, as it is currently the most popular image file container. We then divide image forensics methods into two stages, qualitative analysis and quantitative analysis. As illustrated in Fig. 2. Qualitative analysis primarily focuses on forgery detection tasks, while quantitative analysis concentrates on three tasks: source camera identification, image sharing chain detection, and forgery detection.
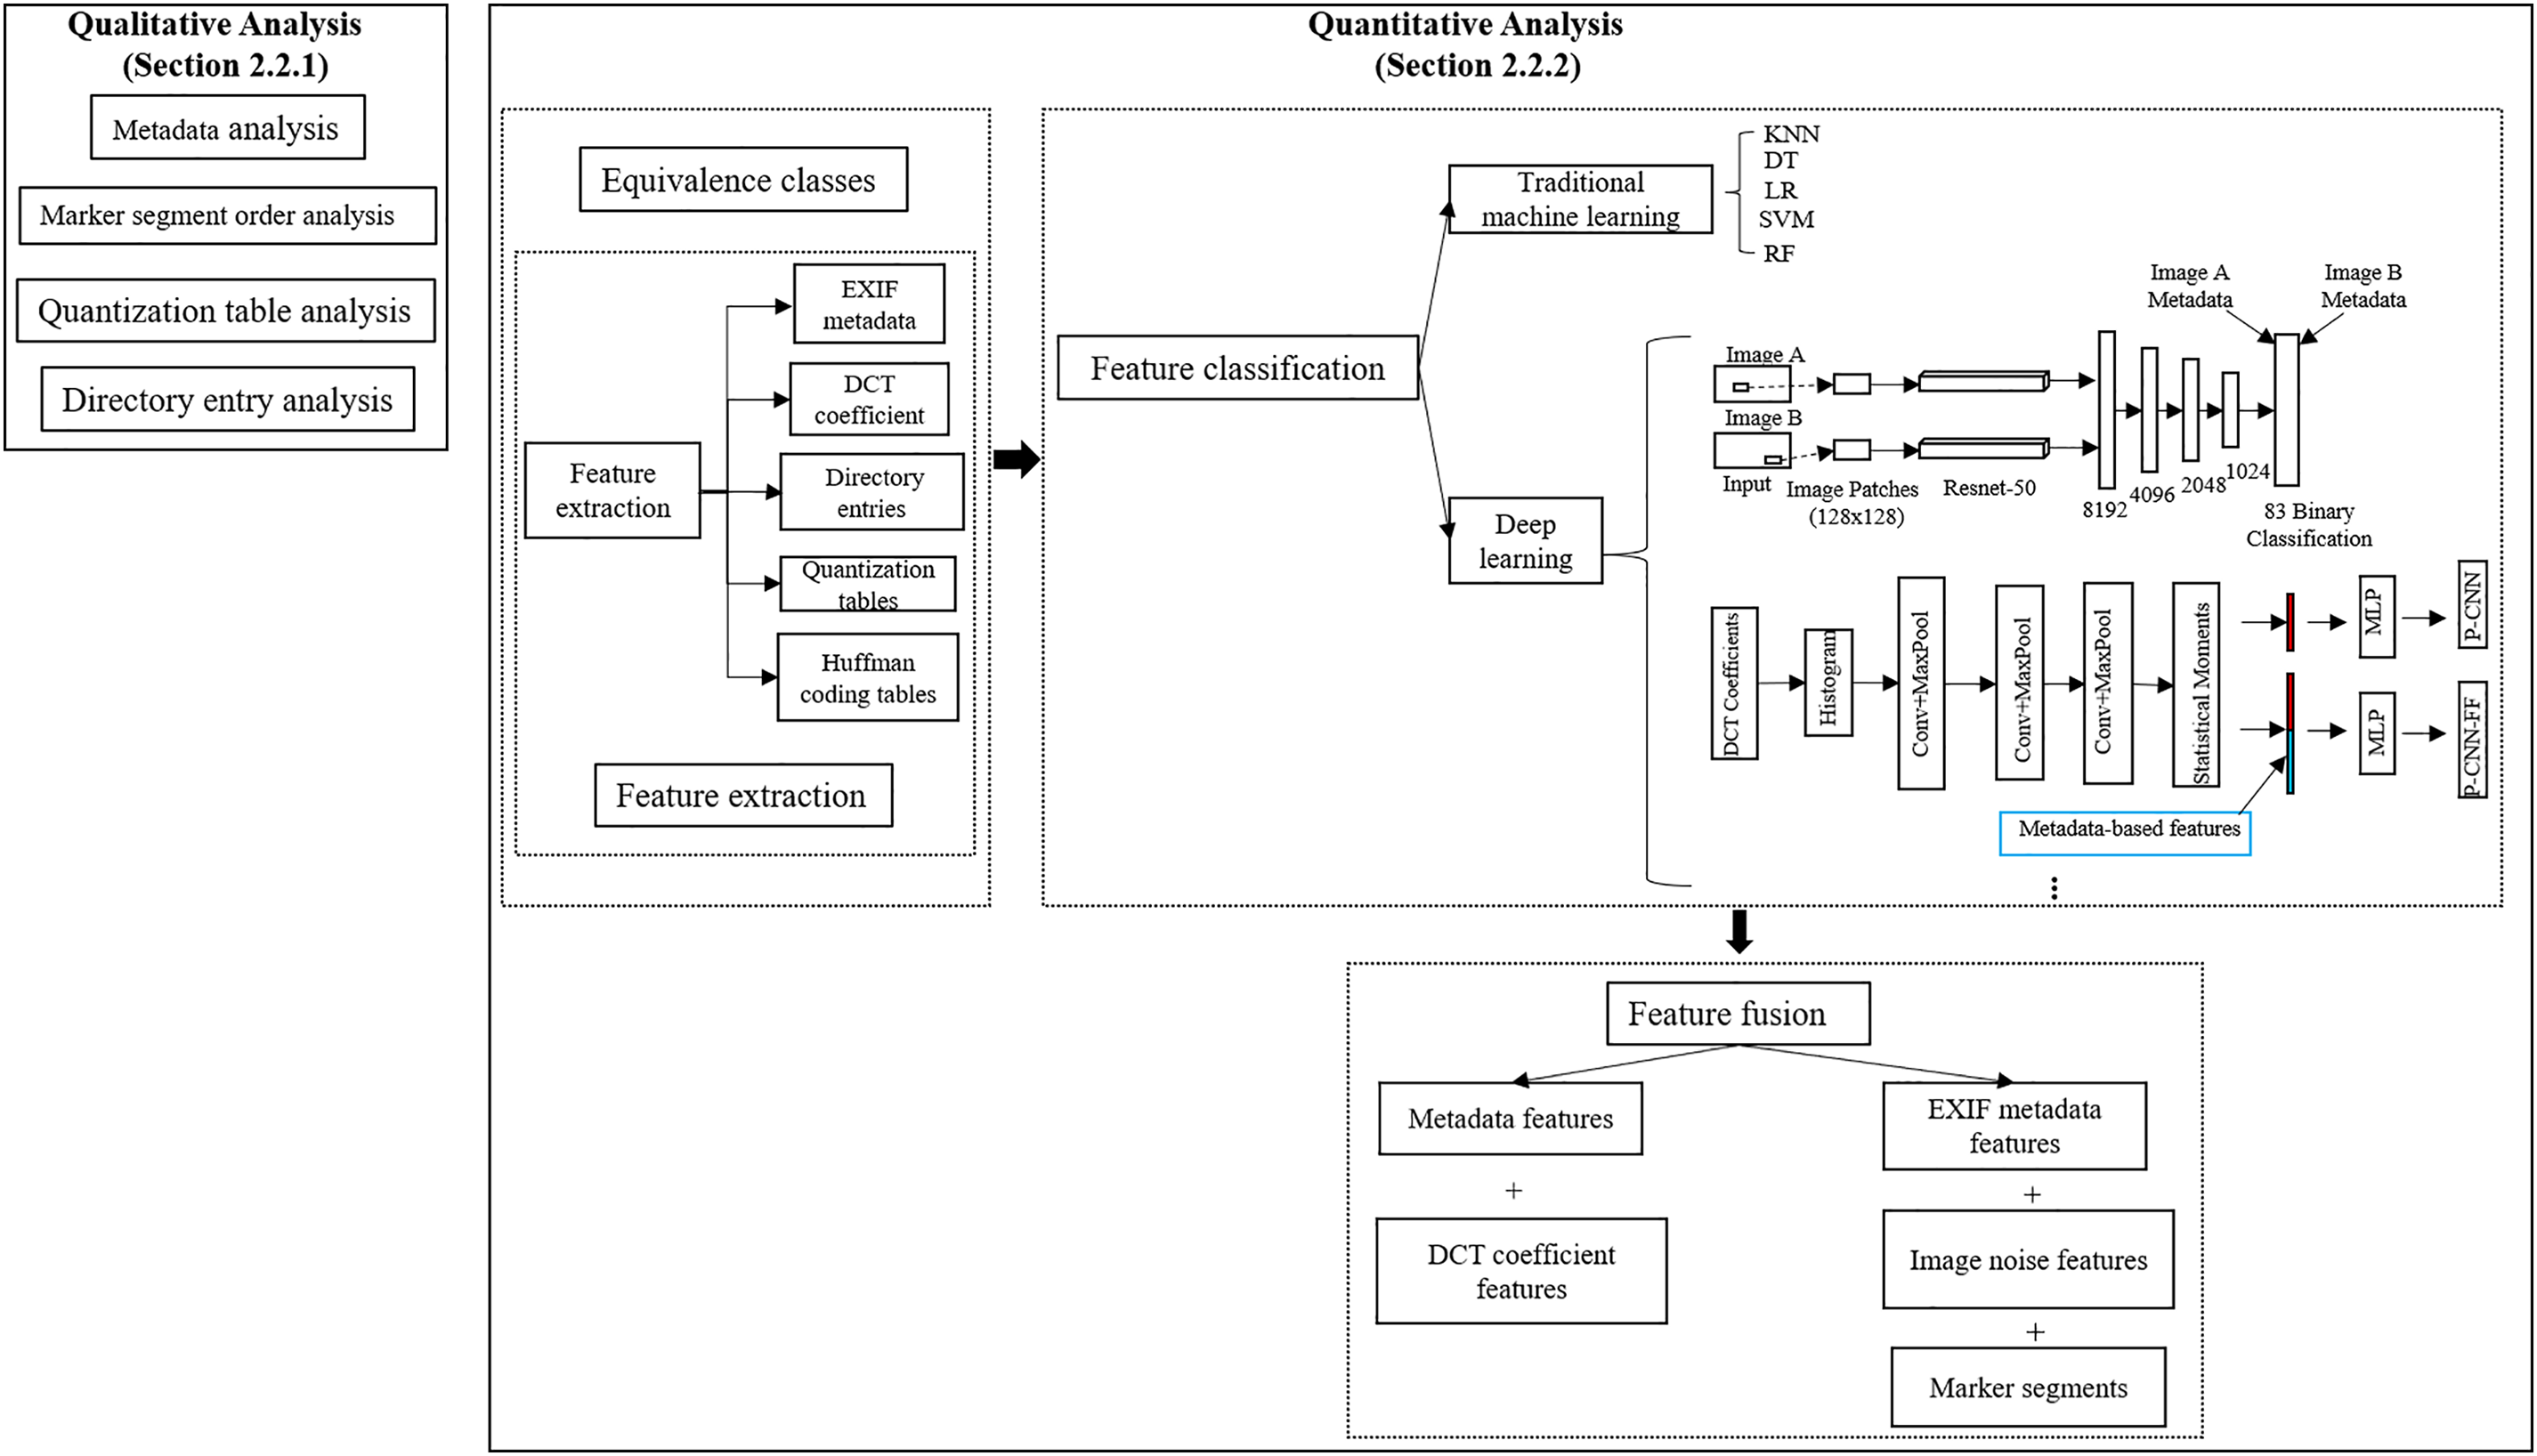
Figure 2: The framework of the image file containers-based for image forensics
JPEG (Joint Photographic Experts Group) is a widely adopted image file containers developed by ISO and CCI TT (International Telegraph and Telephone Consultative Committee). It use a compression method based on the discrete cosine transform [29,30] that maintains high image quality at small file sizes and widely supports EXIF metadata [31].
The format of JPEG files is stored in segments, these structures are called “JPEG Marker Segments” [32,33]. As shown in Fig. 3a, these segments always start with the SOI and end with the EOI. Within this structure, specific segments serve distinct roles: APP1 stores EXIF metadata, DQT holds quantization table information, DHT contains Huffman coding table data, SOF marks the image frame’s beginning, SOS signals the start of scan lines, and DRI sets the restart interval. Fig. 3b illustrates the structure of the APP1 marker segment, where IFD0 and IFD1 contain image information and thumbnail, respectively. This segment also includes EXIF data, GPS, and manufacturer information.
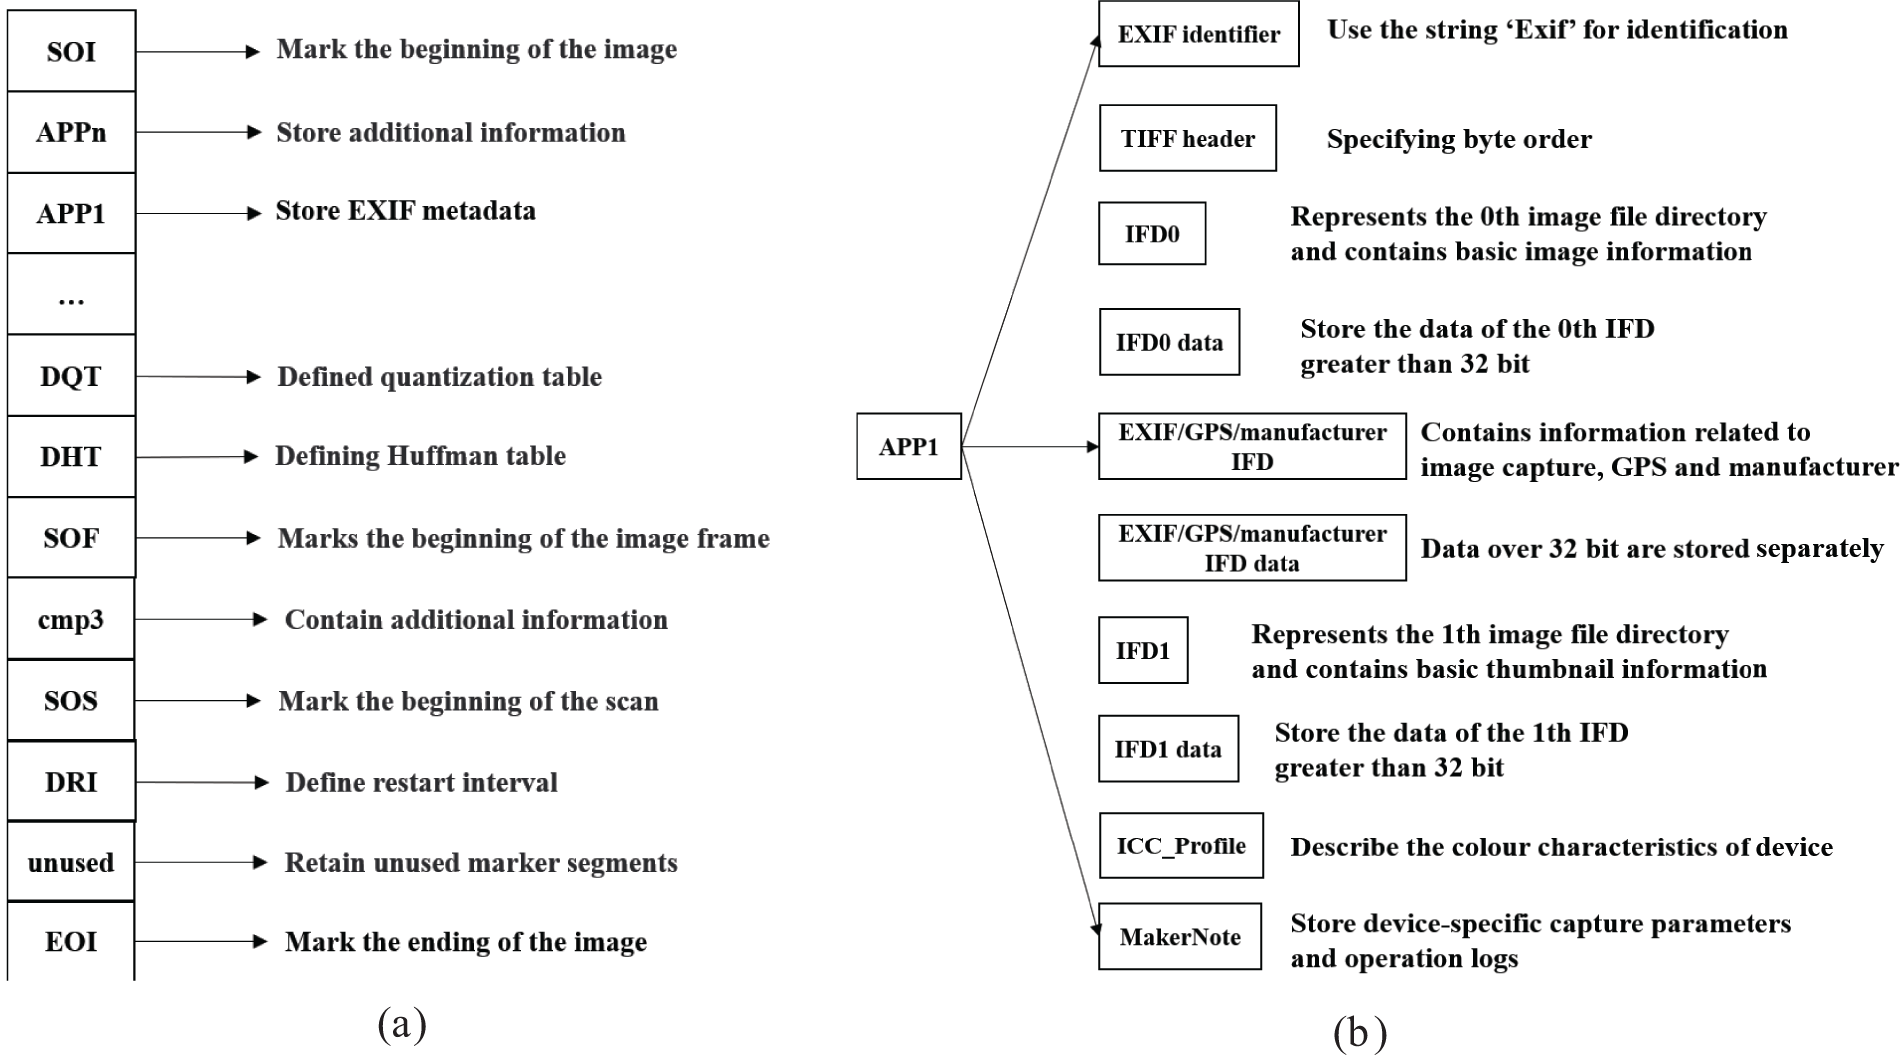
Figure 3: JPEG marker structure and the APP1 segment. (a) JPEG marker structure; (b) The standard structure of the APP1 segment
Different devices or software may employ distinct quantization tables, thus analyzing the quantization tables within an image file can assist in inferring the image’s source or verifying its integrity. JPEG files typically contain two DQT segments, one for luminance (Y values) and another for chrominance (C values). Moreover, the encoding process depends on the image content and compression settings, which implies that diverse devices or software may produce Huffman tables with varying encoding characteristics. JPEG files include two types of Huffman coding tables: one for DC (direct current) components and another for AC (alternating current) components.
3.2 Qualitative Analysis of Image File Containers
Currently, qualitative analysis primarily focuses on image forgery detection. Qualitative analysis of image file containers involves comparing metadata, quantization tables, Huffman coding tables, EXIF directory entries, JPEG Marker Segments and the order of these segments before and after editing. Because these container properties change after editing, detection can be performed by comparing the inconsistencies in these attributes. Alvarez [34] extracted information from EXIF metadata, such as camera brand, camera model, resolution, exposure time, aperture value, focal length, shooting time and modification time, then tampering detection was conducted by comparing whether these EXIF metadata were altered. Building on [34], Gangwar et al. [35] also considered two important factors: marker segments and Huffman coding tables. Since these characteristics of the image typically change during editing, they analyzed the differences in these characteristics before and after editing to determine whether the image had been tampered with. Different from the approaches described above, Gloe [36] detected image tampering by comparing the order of marker segments and the difference in the directory entry structure in EXIF metadata. Kornblum [37] discovered that quantization table parameters often change before and after image editing. Therefore, by comparing these parameters in the original and edited images, it is possible to detect whether the image has been modified.
In summary, the sequence and arrangement of elements within the JPEG file containers and EXIF metadata structures are crucial for authenticating the validity of images. Through the analysis of the marker structure in JPEG files, it is possible to effectively determine whether an image has been altered.
3.3 Quantitative Analysis of Image File Containers
Quantitative analysis provides a novel viewpoint to assist in verifying the feasibility of file container-based schemes. To explore automated forensic solutions, researchers have devised quantitative analysis methods. Current work on the quantitative analysis of image file containers encompasses the following elements: equivalence classes analysis, feature extraction, feature classification, and feature fusion.
For source camera identification, researchers design the methods based on equivalence classes, which are defined as sets of devices that possess identical image attributes. The objective is to determine whether images taken by the same device can be classified into a single equivalence class. If this equivalence class includes only images associated with one device, it demonstrates that these characteristics are effective in identifying the source camera. Conversely, if the equivalence class encompasses images linked to multiple devices, it implies that these features still necessitate additional refinement. Researchers have constructed features from image file containers such as the quantization table, Huffman coding table, resolution, thumbnail parameters, and directory entries in the EXIF file structure.
Farid [38] was the first to propose the concept of equivalence classes. He extracted the quantization table from the image and grouped devices sharing the same table into an equivalence class. Then he [39] extended the previous work and evaluated on a larger dataset, not only relying on a single quantization table feature, but also incorporating image resolution. Kee et al. [40] investigated from a thumbnail perspective, estimating thumbnail parameters by modeling the thumbnail generation process. Devices with the same thumbnail parameters, image size and quantization table parameters could be grouped into an equivalence class. On the basis of several previous works, Kee et al. [41] combined the resolution, quantization table, Huffman coding of images and thumbnails. And they also extracted the number of directory entries in EXIF file directory, the total count of additional file directories, the overall number of directory entries contained in extra file directories, and the number of parsing errors. This constitutes a total of 576 dimensional camera signatures, which are then grouped together into an equivalence classes.
In summary, the equivalence class method is highly effective in camera model identification. According to existing experimental results, equivalence classes constructed by incorporating thumbnail parameters achieved an accuracy of 72.2
For the source camera identification, Mullan et al. [42] retrieved effective information from the file container and applied a hash function to this information. They determined the number of EXIF entries and combined the values from the Y and Cb quantization tables into a single string, subsequently hashing it to derive a distinctive feature representation. In contrast to [42], they [43] constructed histograms to represent the number of key-value pairs in each EXIF directory, rather than directly utilizing the raw counts. Because histograms not only capture the total or average of metadata directory entries but also reveal the distribution characteristics of the data.
For the image sharing chain detection, social media platforms may use different quantization tables when uploading images, which leaves unique traces in the DCT coefficients, a typical way to learn statistics of DCT coefficients on each spatial frequency is computing their histogram. In addition, social media platforms apply specific processing to the marker segments during the uploading and downloading of images. Metadata features provide parameters for image encoding and storage, and these parameters vary across different social media platforms. Giudice et al. [44] represented each image as a vector
For the purpose of forgery detection, image noise is an inherent property during the camera capture process, unaltered images possess natural noise characteristics, whereas tampering operations alter these characteristics, leading to a noise distribution that does not match the original capture conditions. Researchers characterize noise by calculating its mean or standard deviation. Regarding EXIF metadata features, Bedi et al. [49] splited multivalued fields in the metadata into separate atomic fields, and then converted the string values into numerical values through encoding. In [50], the EXIF metadata is first converted to text form and then encoded using a Transformer. Appel et al. [51] employed the MultiLabelBinarizer to transform metadata into a binary format. Umair et al. [52] used a word-embeddings-based approach specifically Word2Vec to transform metadata into vector embeddings.
After extracting the features, it is also necessary to use the feature classification technology to realize the automatic forensic analysis. With respect to source camera identification, Mullan et al. [42] selected Random Forest (RF) [53] as the classifier because it effectively handles high-dimensional data and nonlinear relationships in JPEG header information, while offering robustness and being easy to implement and adjust. In [43], they utilized extremely randomized forests [54] as the classifier. Compared to the random forests employed in [42], this approach introduces additional randomness during the construction of decision trees, thereby enhancing the model’s adaptability to unknown data.
In the image sharing chain detection, Giudice et al. [44] utilized k-nearest neighbor (KNN) classification and decision tree (DT) [55] classifiers, because KNN is a non-parametric method, it does not require a complex training process, it simply stores the training data and calculates the distance to its neighbors during prediction. In contrast, DT is a rule-based classification method that generates intuitive classification rules, making it easy to understand and interpret. Compared to [44], Phan et al. [45] employed three distinct classifiers, namely Logistic Regression (LR), Support Vector Machine (SVM), and RF [53]. These three classifiers can effectively handle the high-dimensional feature space of images, and they can also handle large-scale datasets and are easy to implement. In contrast to the traditional machine learning methods previously employed, references [46–48] all adopted deep learning methods. Phan et al. [46] employed a convolutional neural network (CNN) framework, because CNN can effectively handle high-dimensional data without requiring manually engineered features, as they can automatically learn the optimal feature representation through training. Considering that the repeated sharing of the same image across multiple platforms gradually obscures historical tampering traces, while the new traces introduced by the platforms themselves provide the possibility to reconstruct the dissemination chain of digital objects, Verde et al. [47] proposed a supervised framework for the reconstruction of image sharing chains on social media platforms. The system is structured as a cascade of backtracking blocks, each of them tracing back one step of the sharing chain at a time. Unlike the two prior approaches, reference [46] relied solely on simple labels, thus overlooking the relationships between sharing chains, and reference [47] suffered from escalating computational costs as chain length increased, You et al. [48] introduced a novel image sharing chain detection framework grounded in a Seq2Seq model. This innovative approach leverages an attention-free Transformer to detect sharing chains incrementally. Transformers are adept at handling time series data such as sharing chains, capturing the sequence and dependencies of platform dissemination. Their self-attention and cross-attention mechanisms enable the model to integrate image features with sequence information, thereby enhancing detection capabilities.
For the forgery detection, Huh et al. [56] proposed a self-supervised learning algorithm that trains a model to assess the internal consistency of images by utilizing EXIF metadata, with the model further aiding tampering detection through the introduction of post-processing consistency checks. In contrast to the method in [56], which directly estimates camera properties may be prone to errors, Zheng et al. [50] indirectly distinguish differences in camera properties by comparing the embedding vectors of different image patches, they proposed a cross-modal learning model that employs contrastive learning to associate image patches with their corresponding EXIF metadata. Additionally, Bedi et al. [49] utilized metadata from both original and tampered images to train a multilayer perceptron (MLP) neural network. MLP is a simple yet effective neural network model that is widely applicable to classification problems. Building on neural networks, Vadrevu et al. [57] employed a convolutional neural network (CNN) model and an error level analysis (ELA) processor. This method leverages ELA to identify potential tampered regions in images while employing CNN to perform deeper feature learning and classification. Appel et al. [51] proposed a Transformer-based image tampering detection framework. The framework accelerated training convergence and enhances model learning efficiency through a parallel multi-head attention mechanism. Subsequently, Umair et al. [52] employed the similar distance analogy to detect inconsistencies in the non-functional metadata attributes of images.
In order to further improve the image forensics technology, researchers try to explore the strategy of multi-feature fusion. For image sharing chain detection, You et al. [48] fuse four features: feature map, DCT coefficients, metadata, and marker segment count. These features capture spatial information, frequency domain characteristics, metadata details, and file structure information, respectively, providing a comprehensive representation of the traces left by an image during its sharing process on social networks. For the forgery detection, there exists a certain physical correlation between image noise characteristics and EXIF metadata, which is determined by the imaging principle. Thus, this prior knowledge can be utilized to detect whether they are consistent by modeling the relationship between noise characteristics and EXIF metadata. Fan et al. [58] calculated the standard deviation of image noise in the nonsharp area as a feature and extracted the aperture value, shutter speed value, ISO speed value, brightness value and exposure value, then expressed them as feature vectors. Subsequently, a mathematical model was established and the error between the estimated EXIF feature value of the test image and the real image EXIF feature value was calculated. Finally, whether the image was tampered was judged according to whether the error exceeded the set threshold. In [59], they considered not only the standard deviation of the image noise but also its mean value. By using these two features at the same time, the characteristics of noise can be more comprehensively captured and the image changes can be better reflected. They also simplified the number of metadata features and selected metadata directly related to the camera settings, namely ISO, aperture and shutter speed, so as to avoid too much redundant information interference. Sun et al. [60] also adopted the approach outlined in [58,59], which involves modeling the correlation between image noise and EXIF parameters. Building on this foundation, they further proposed a block-based detection strategy that combines EXIF estimation errors across individual image blocks to identify local tampering.
In summary, the quantitative analysis phase of image file containers is primarily divided into four aspects: equivalence classes, feature extraction, feature classification, and feature fusion. Among these, equivalence classes are particularly utilized for source camera identification. To construct an effective equivalence class, both thumbnail and entry count are considered, which achieves excellent performance in camera model identification tasks. Feature extraction is tailored to three forensic tasks: source camera identification, image sharing chain detection, and forgery detection. In source camera identification, we found that by hashing the values of the quantization tables and constructing histograms to represent the number of key-value pairs in each EXIF directory, effective performance can be achieved in camera model and brand recognition tasks. For image sharing chain detection, extracting features such as DCT coefficients, metadata, and marker segment counts aids in recognizing the social media platforms. For forgery detection, image processing alters the distribution characteristics of noise, and its mean and standard deviation can capture these changes. Therefore, these statistical measures are extracted as features. For feature classification, which is also employed across the three forensic tasks. In source camera identification, choosing extremely randomized forests as the classifier can improve performance. Compared to standard random forests, it introduces more randomness in feature and split point selection, which helps reduce model overfitting and enhances generalization ability. For image sharing chain detection, we found that using Transformers can improve detection performance, as they map image features to sequence representations. The decoder then progressively predicts the sharing chain, utilizing the already decoded sharing chain information as prior knowledge to assist in subsequent detection steps. With respect to forgery detection, using contrastive learning to train the model can effectively improve performance. This is because it maps images and metadata to a joint embedding space, allowing the model to learn their similarity without directly predicting specific metadata values, resulting in better robustness and generalization ability. Feature fusion is primarily focused on forgery detection. The photon transfer curve shows a correlation between sensor noise and digital camera signal intensity (DCSI). DCSI is influenced by EXIF settings such as aperture and exposure time, while noise can be estimated from the image content. Therefore, the correlation between EXIF features and image noise characteristics can be modeled.
4 Video Container Analysis and Key Technology
In comparison to image file containers, video containers, due to their standardized packaging structure and multi-track synchronization mechanism, generally exhibit greater robustness and are more resistant to attack. A file format that encapsulates information such as video, audio, and metadata is known as a container format. Video containers store a wealth of metadata, including recording time, date, and device information, which provide critical evidence for verifying the authenticity of a video. Moreover, different container formats vary in how they encapsulate video and metadata, enabling the tracing of video origins, identification of generating tools or software, and detection of tampering through the analysis of container structures.
We first provide a brief introduction to the main container formats currently in use, specifically the AVI container and MP4-Like containers. Next, we present a discussion on qualitative analysis based on video containers, followed by a discussion on quantitative analysis. The quantitative analysis includes six steps: video container parsing, symbolic representation, symbol selection, feature representation, feature classification, and feature fusion. As shown in Fig. 4, the technical framework for container-based video forensics is clearly presented.
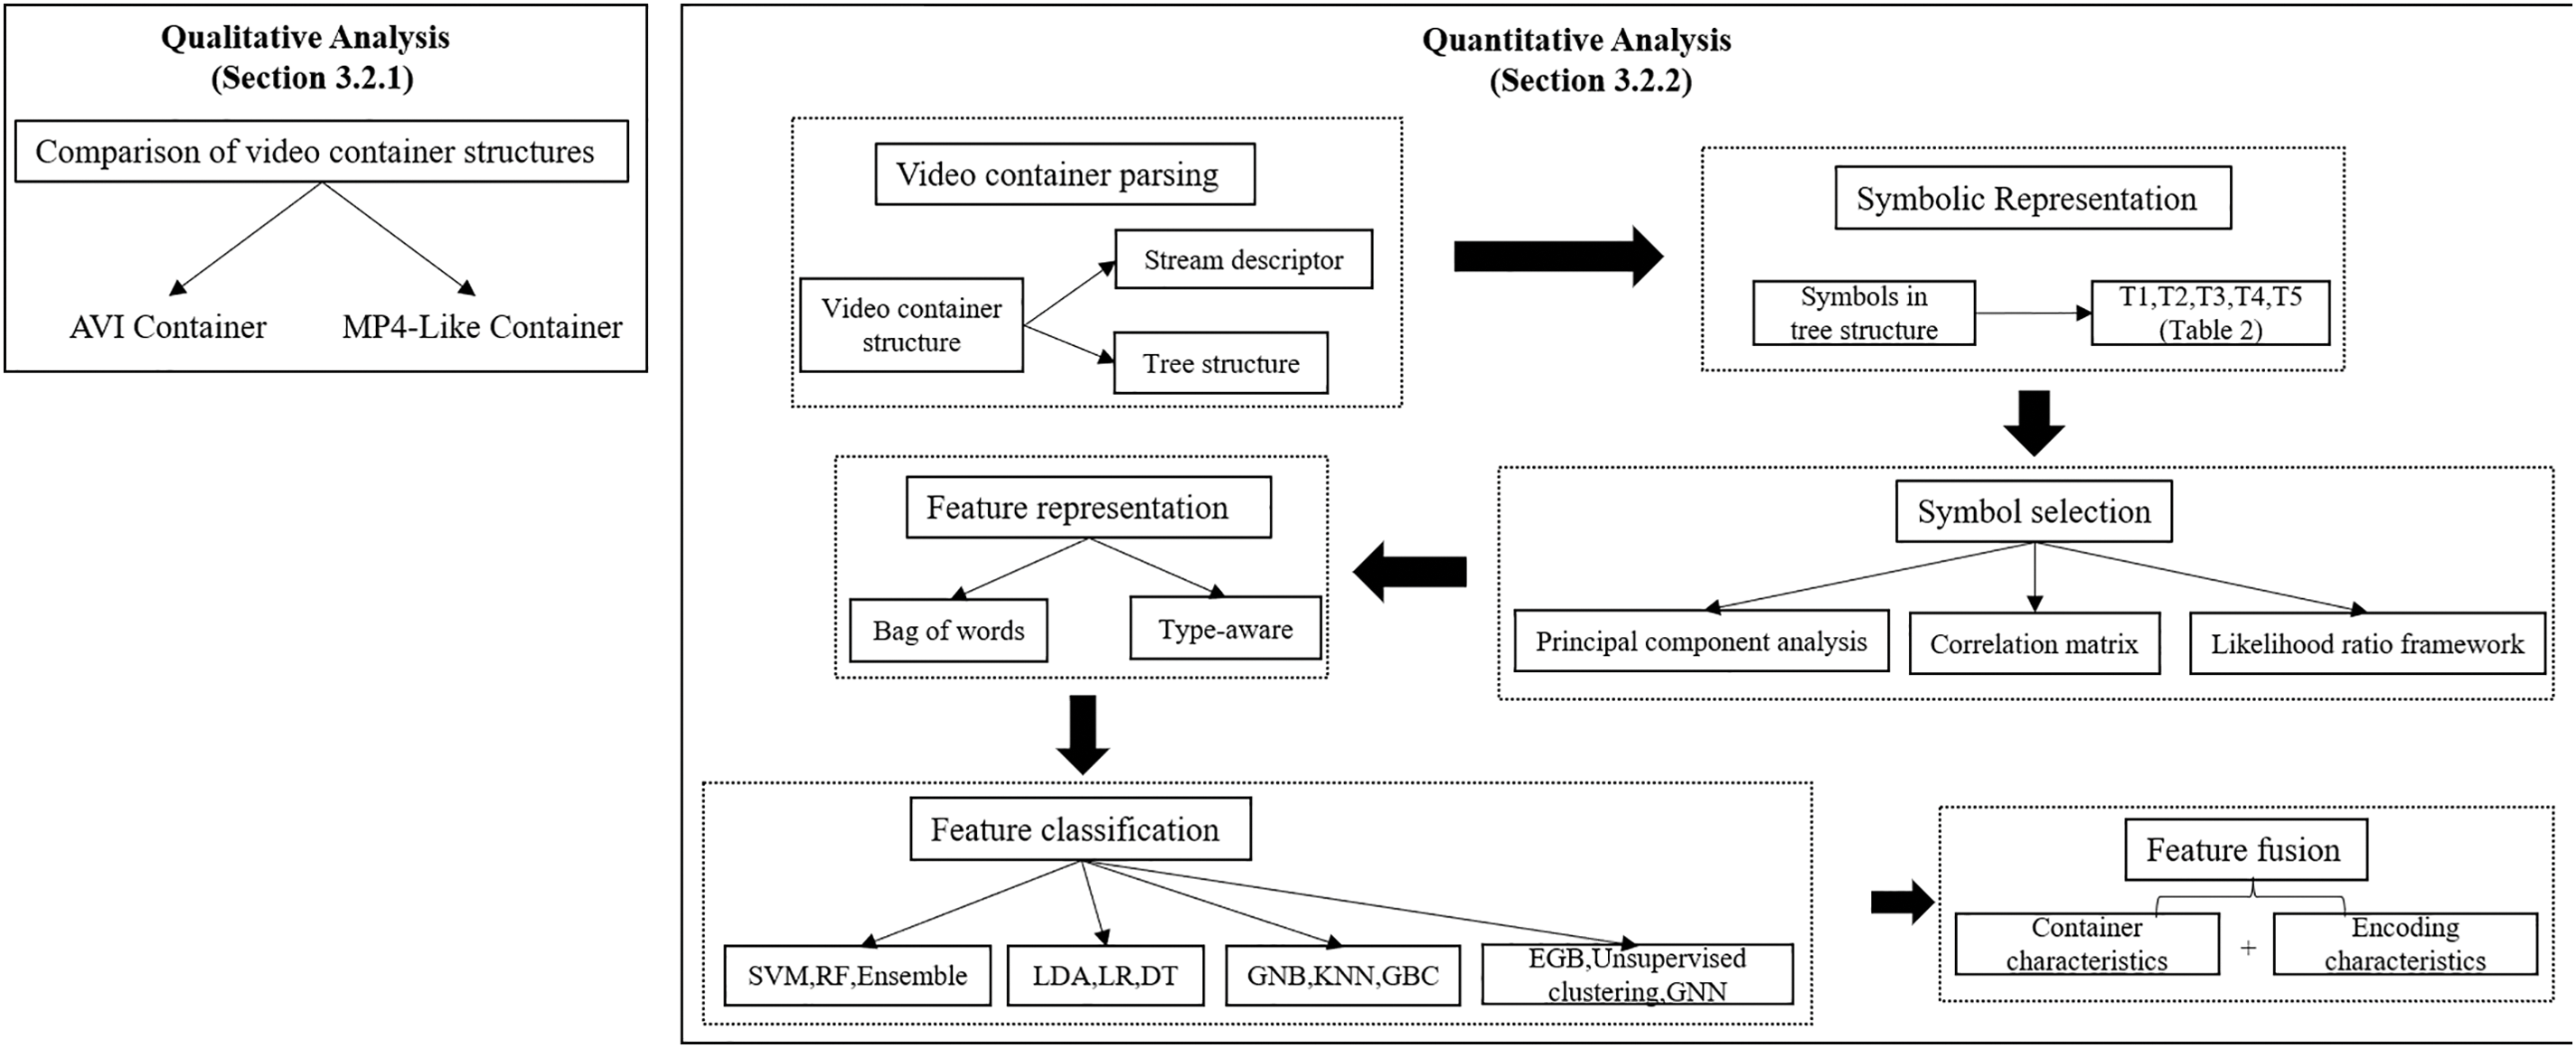
Figure 4: The framework of the video container-based for video forensics
AVI container [61] is structured into headers, bodies, and indexes, using FourCC to represent data types. Fig. 5 illustrates a generalized example of an AVI container. RIFF serves as the file header, with the remaining data organized and stored in lists and chunks. A list consists of four components: the code, data size, code type, and data. A data block is composed of three parts: the four-character code, data length, and data. Lists can also nest other lists and data blocks. Notably, different FourCC codes represent distinct meanings. Typical FourCC codes and their corresponding meanings are as follows: “hdrl” lists store audio and video information; “avih” blocks represent the main information header; “strl” lists store codec information and data; “strh” and “strf” blocks store data stream header information and stream-specific information, respectively. The “movi” list stores audio and video data, while the “idxl” blocks contains audio and video permutation index data. The “junk” block holds meaningless data used for content alignment and padding. Each block within the AVI container format serves a distinct function. By analyzing these blocks, researchers can authenticate the video’s source and detect any evidence of tampering.
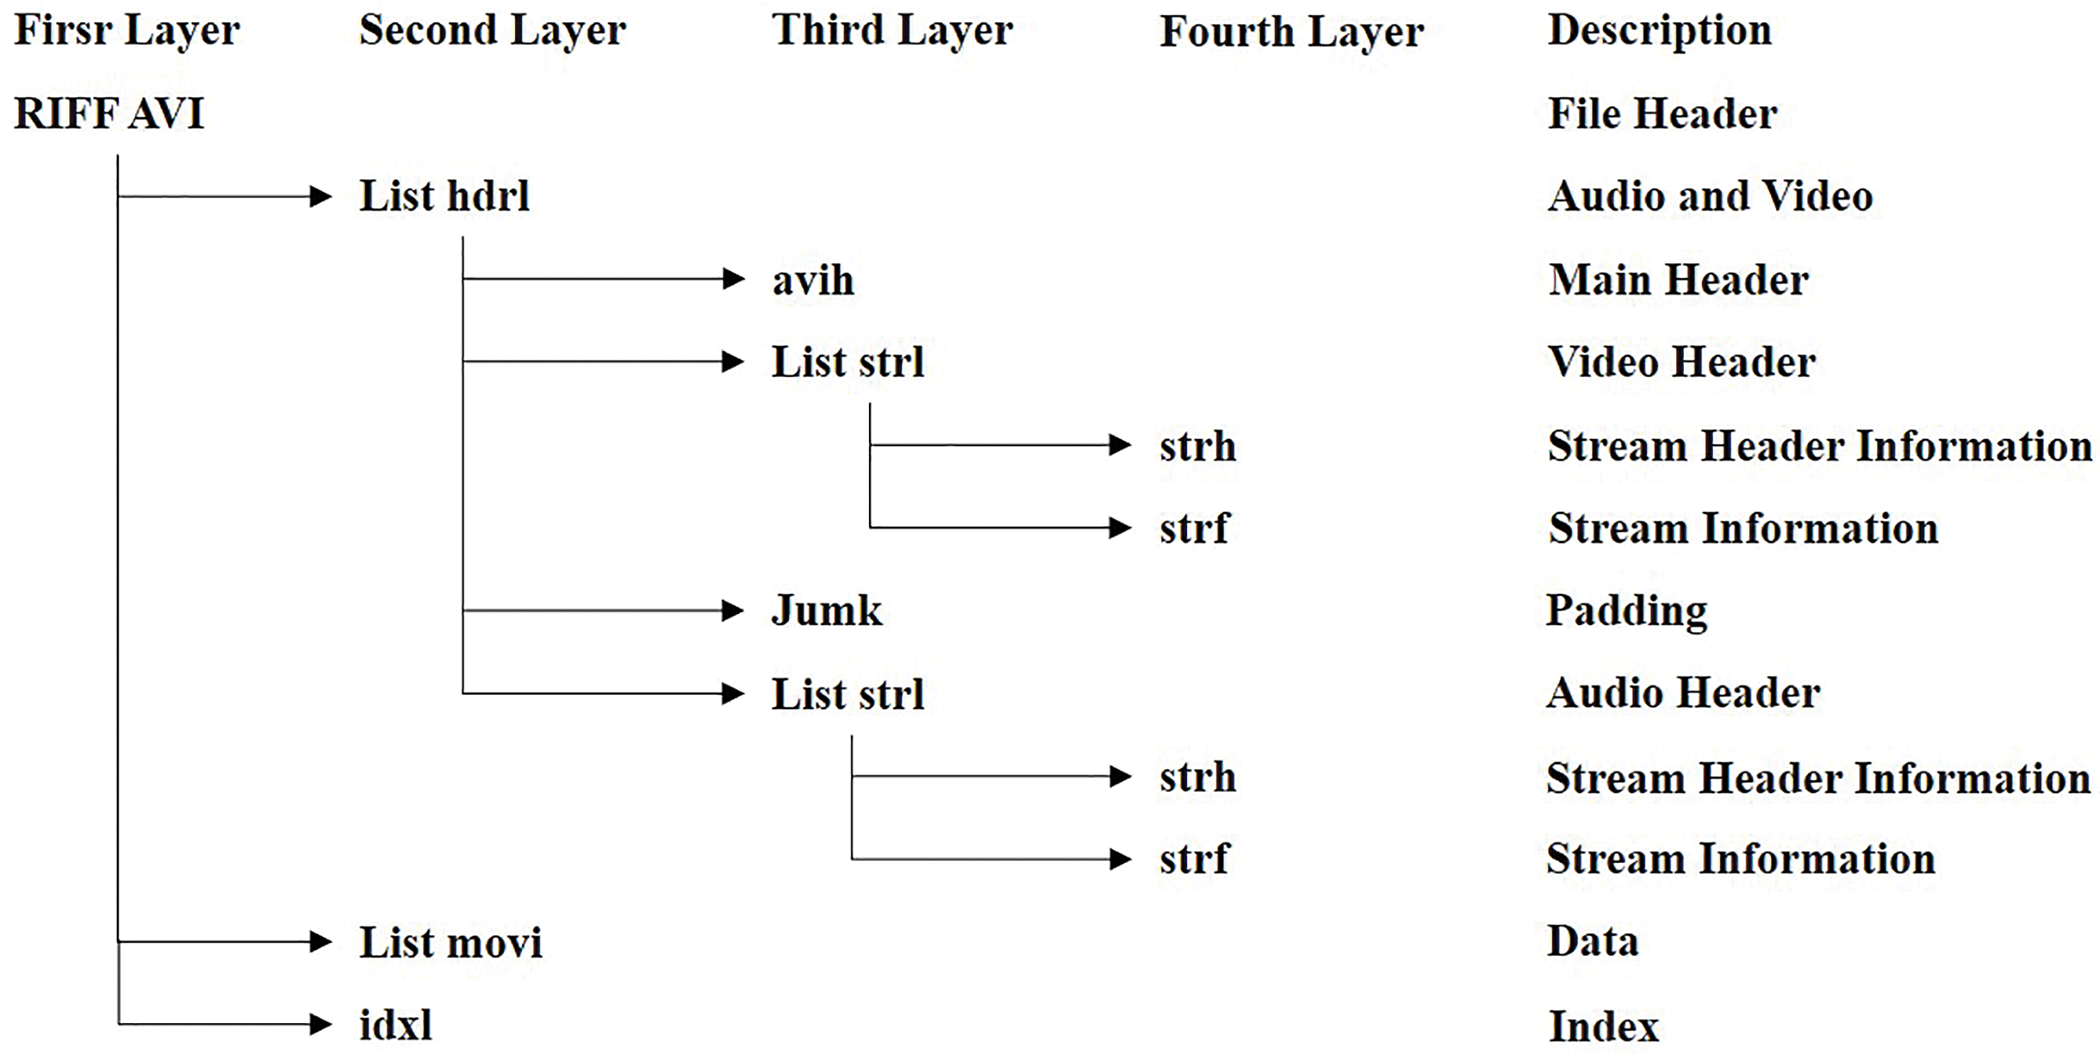
Figure 5: Example of general AVI container
To support QuickTime’s multimedia framework, Apple introduced the MOV video container format in 1991 [62,63]. This format served as the foundation for the subsequent MP4 [64] and 3GP [65] container formats. To facilitate discussion, we refer to these three encapsulation formats collectively as MP4-Like container formats. Fig. 6 illustrates a generalized MP4 container structure. The MP4-like video file is organized in a tree structure that specifies byte organization, audio-video stream synchronization, and the linkage between audio and video streams. Each node in this structure is encoded with a unique four-byte code. The tree includes a file header that outlines its role within the video container and any associated data streams. Typically, the first node, “ftyp”, specifies the standard followed by the video file, including compatibility, file format, and version details. The “moov” node contains video metadata, while the “mdat” node stores audio and video data.

Figure 6: Example of general MP4-Like container
4.2 Qualitative Analysis of Video Container
Qualitative analysis of video file containers involves comparing the attributes of containers from various sources to identify differences in their properties. Gloe et al. [66] presented the first work on video forensics based on file containers. They first parsed AVI and MP4-like video file containers, then extracted all file format structures from the videos and observed them for comparison. The tree structure reflects the nested list nature of the AVI container format, delineating the primary lists, data blocks, and their ordering relationships. Corresponding components are aligned in the same row. Analysis reveals that not all video containers share the same elements. For instance, videos from Nikon cameras use a dedicated “ncdt” code for metadata storage instead of the “IDIT” four-character code for recording dates. Furthermore, camera manufacturers employing MJPEG compression may denote the compression format in uppercase (“MJPG”) or lowercase (“mjpg”), with Canon devices typically using “mjpg”. During testing, they also found that all videos processed by video editing software left discernible traces in the file container that could not match the original video features in the database. Even for the video that undergoes undistorted editing, the difference can be found by comparing the file container structure with the reference video. Qualitative analysis of MP4-like container formats revealed that most formats begin with a “ftyp” box, with notable exceptions. Kodak videos commence with a “skip” box, while Praktica DC2070 videos start directly with an “mdat” box. Furthermore, analysis of the “major
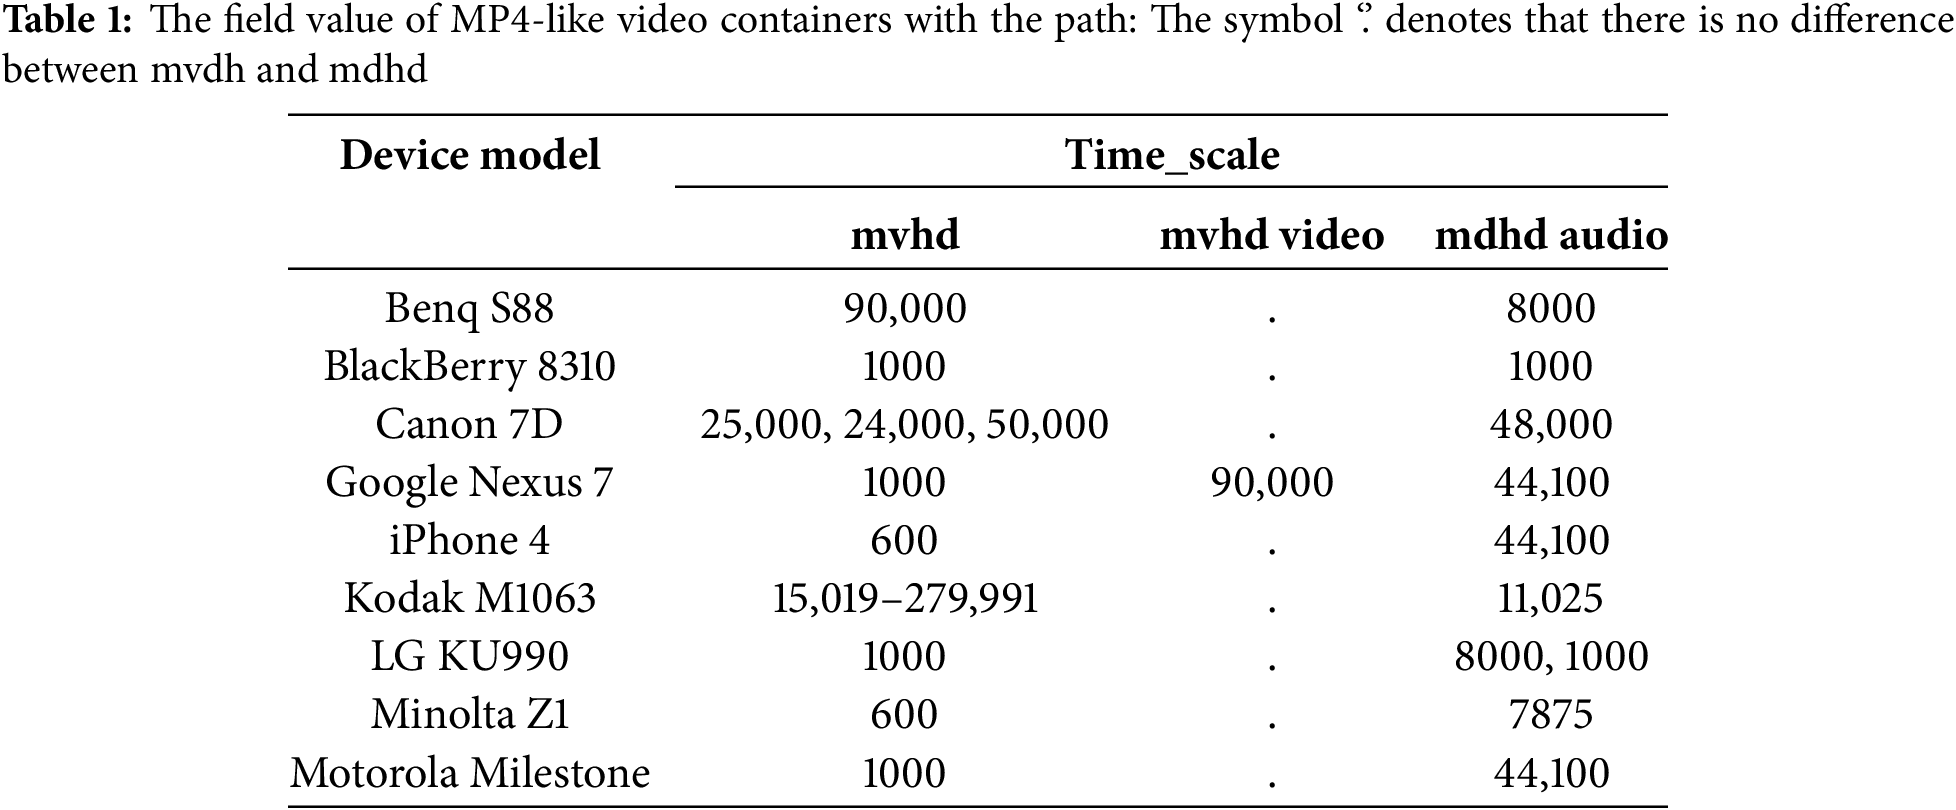
Table 1 summarizes the threshold values for several typical “timescale” parameters, which control frame rate and audio sampling rate. Analysis reveals that the combination of “mvhd” and “mdhd” threshold settings varies across devices. Furthermore, in addition to the standard “ftyp”, “mdat”, and “moov” boxes, a wide variety of nodes were observed. For instance, some MP4-like container formats store metadata in the “udta” box, while others use the “free” box for padding. Typically, the order of nodes is not strictly defined, leading to expected variations.
Song et al. [67] collected 296 unmodified AVI video files using vehicle recorder videos as the analysis source and tampered with them using popular video editing software, including Adobe Premiere CS3, CS4, CS5, CS6, CC, Sony Vegas 9, Vegas 10, Vegas 11, Vegas 12, Vegas 13, Edius 6, Edius 7, Avid MC5, MC6, and Avid Studio. Comparison revealed that only 12 distinct “four-character code” sequences were present in the 296 videos. Furthermore, video editing software consistently leaves discernible traces in the container structure. No video editing software can exactly replicate the container structure of the original video. “Four-character code” sequences and their field values are relevant to the identification of video editing software. Rudnikovich et al. [68] proposed a graphical visualization scheme to effectively compare the characteristics of video container structures. This scheme enables the complete display of a video container’s attributes within a single image.
4.3 Quantitative Analysis of Video Container
Qualitative analysis can be useful under small-scale data conditions, but when dealing with large-scale data, manually comparing videos for forensic purposes is not practical. As a result, researchers have proposed quantitative analysis approaches. Currently, the quantitative analysis of video containers primarily focuses on MP4-Like containers, involving several key steps: video file parsing, symbolic representation of the container, symbol selection, feature representation, and feature classification.
Güera et al. [69] analyzed the video file container and extracted the multimedia stream descriptors from it. However, this scheme ignores the structural information of the file container. Iuliani et al. [70] parsed the video container into a tree-like structure representation. Fig. 7 presents a parsed tree structure, from which node information and all field values can be obtained. The “ftyp” is used to identify the file format and compatibility information, while “moov” contains metadata about the video file, describing the overall structure of the video. The “free” segment represents unused portions of the file, typically used for padding, and “mdat” contains the actual video and audio data in the file.
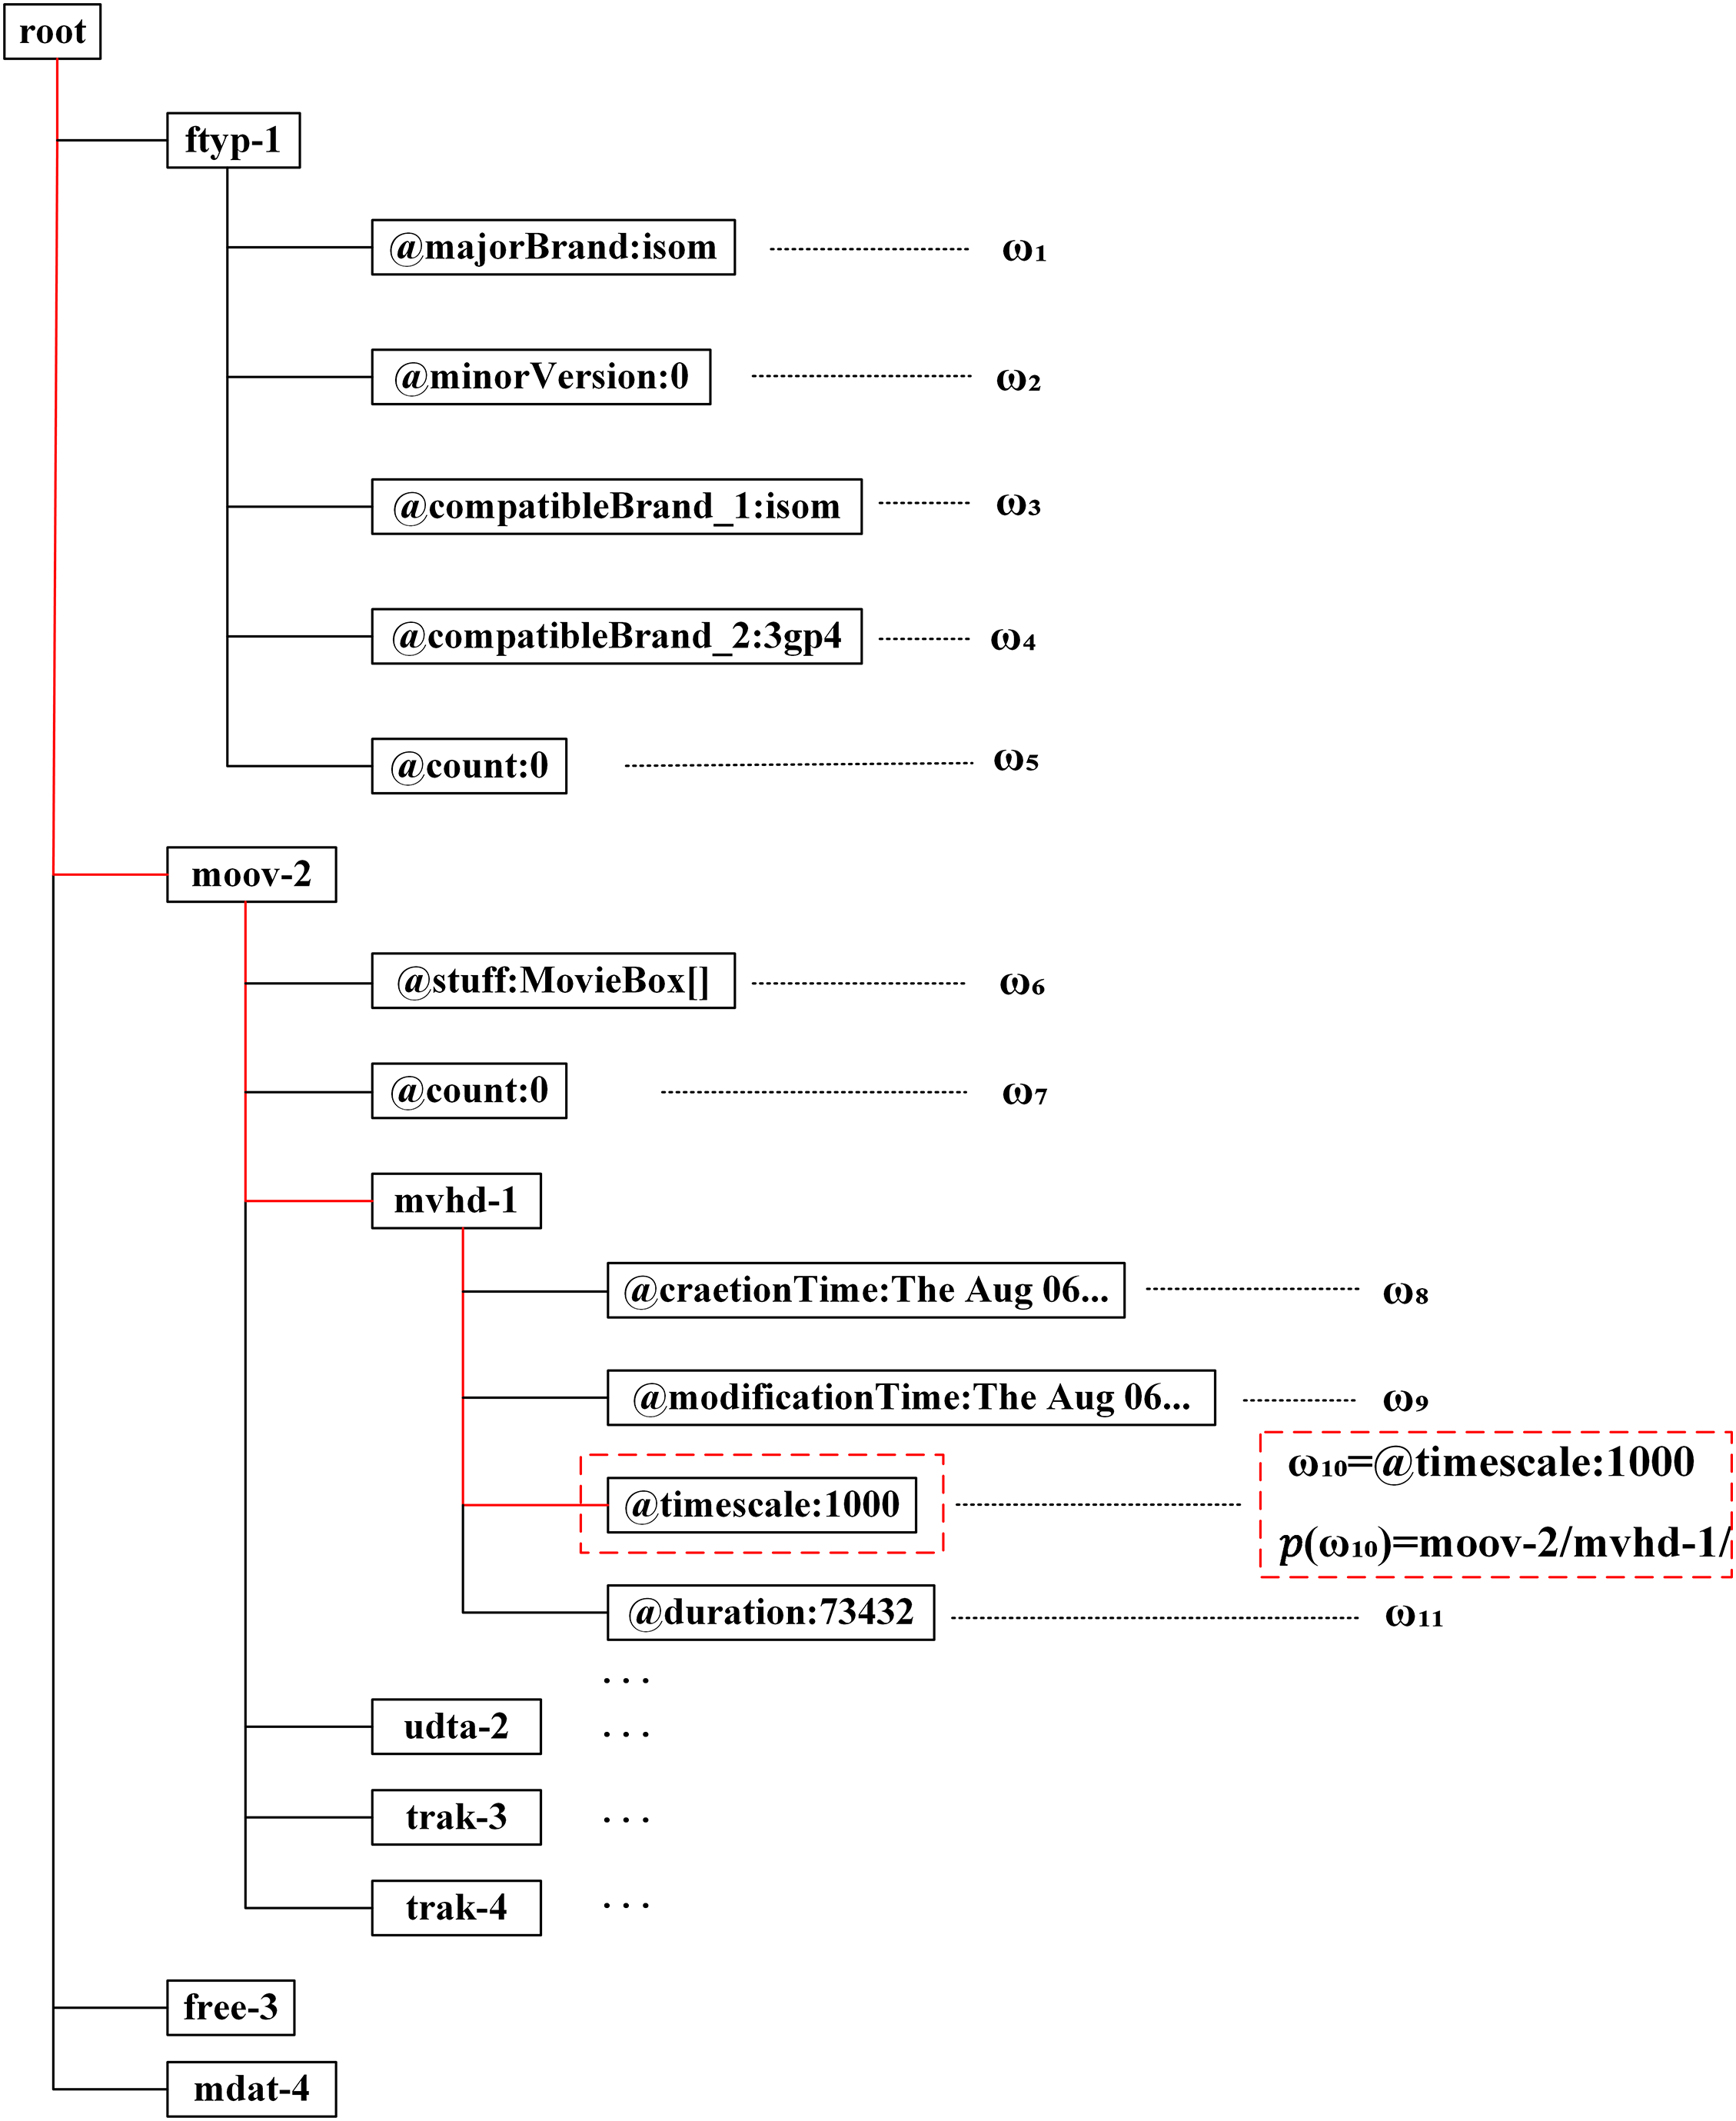
Figure 7: Tree representation of MP4-like video container. The red dashed boxes represent one of the examples, and its path is indicated by a solid red line
Effective feature representation of parsed files is a key technology in video forensics. The primary challenge at this stage is how to effectively model the symbolic representations within the tree-structured parse file. Iuliani et al. [70] model a video container as a set of field values and their corresponding paths, as illustrated in Eqs. (1) and (2).
In the above equation, X and P represent the feature representations of the video container, where X denotes the set of field values and P indicates the paths of these field values within the tree structure, with
Huamán et al. [71] consider a unified representation of the field and its paths, as shown in Eq. (5).
Yang et al. [72] observed that the location of field values within a video container varies more than the field values themselves. For example, the Exiftool software embeds identical field information in different locations within the video file container. Based on this observation, they proposed a novel feature representation approach. They represent video containers as field symbols and value symbols, thereby eliminating the influence of the field value paths, as demonstrated in Eqs. (6) and (7).
Gelbing et al. [73] conducted a comparative analysis of the two previously mentioned approaches and introduced a symbolic representation method that is robust to field insertion operations. This method annotates the order in which identical fields appear under the same parent node, as illustrated in Eqs. (8) and (9).
López et al. [74] constructed four forms of symbolic representation, which are unordered field symbols, unordered value symbols, ordered field symbols and ordered value symbols, as shown in Eqs. (10)–(13).
To better preserve the structural information of the video container, Xiang et al. [75] categorized the symbolic representation into two types. The first type focuses solely on the node and its path information, while the second type incorporates the field value and its corresponding path information, as illustrated in Eqs. (14) and (15). Additionally, they treat the “trak” node separately. The order in which the “trak” node appears under each parent node is annotated during the symbolic representation process.
The methods outlined above are based on the MP4 video container. For the AVI video container structure, Song et al. [67] observed that different video editing software exhibit distinct field structures. Various video editing software create unique metadata field structures when handling AVI files, depending on their encoding techniques. These structures are unrelated to the original video file’s format. Consequently, analyzing these field structures can help determine whether the video has been modified using such software.
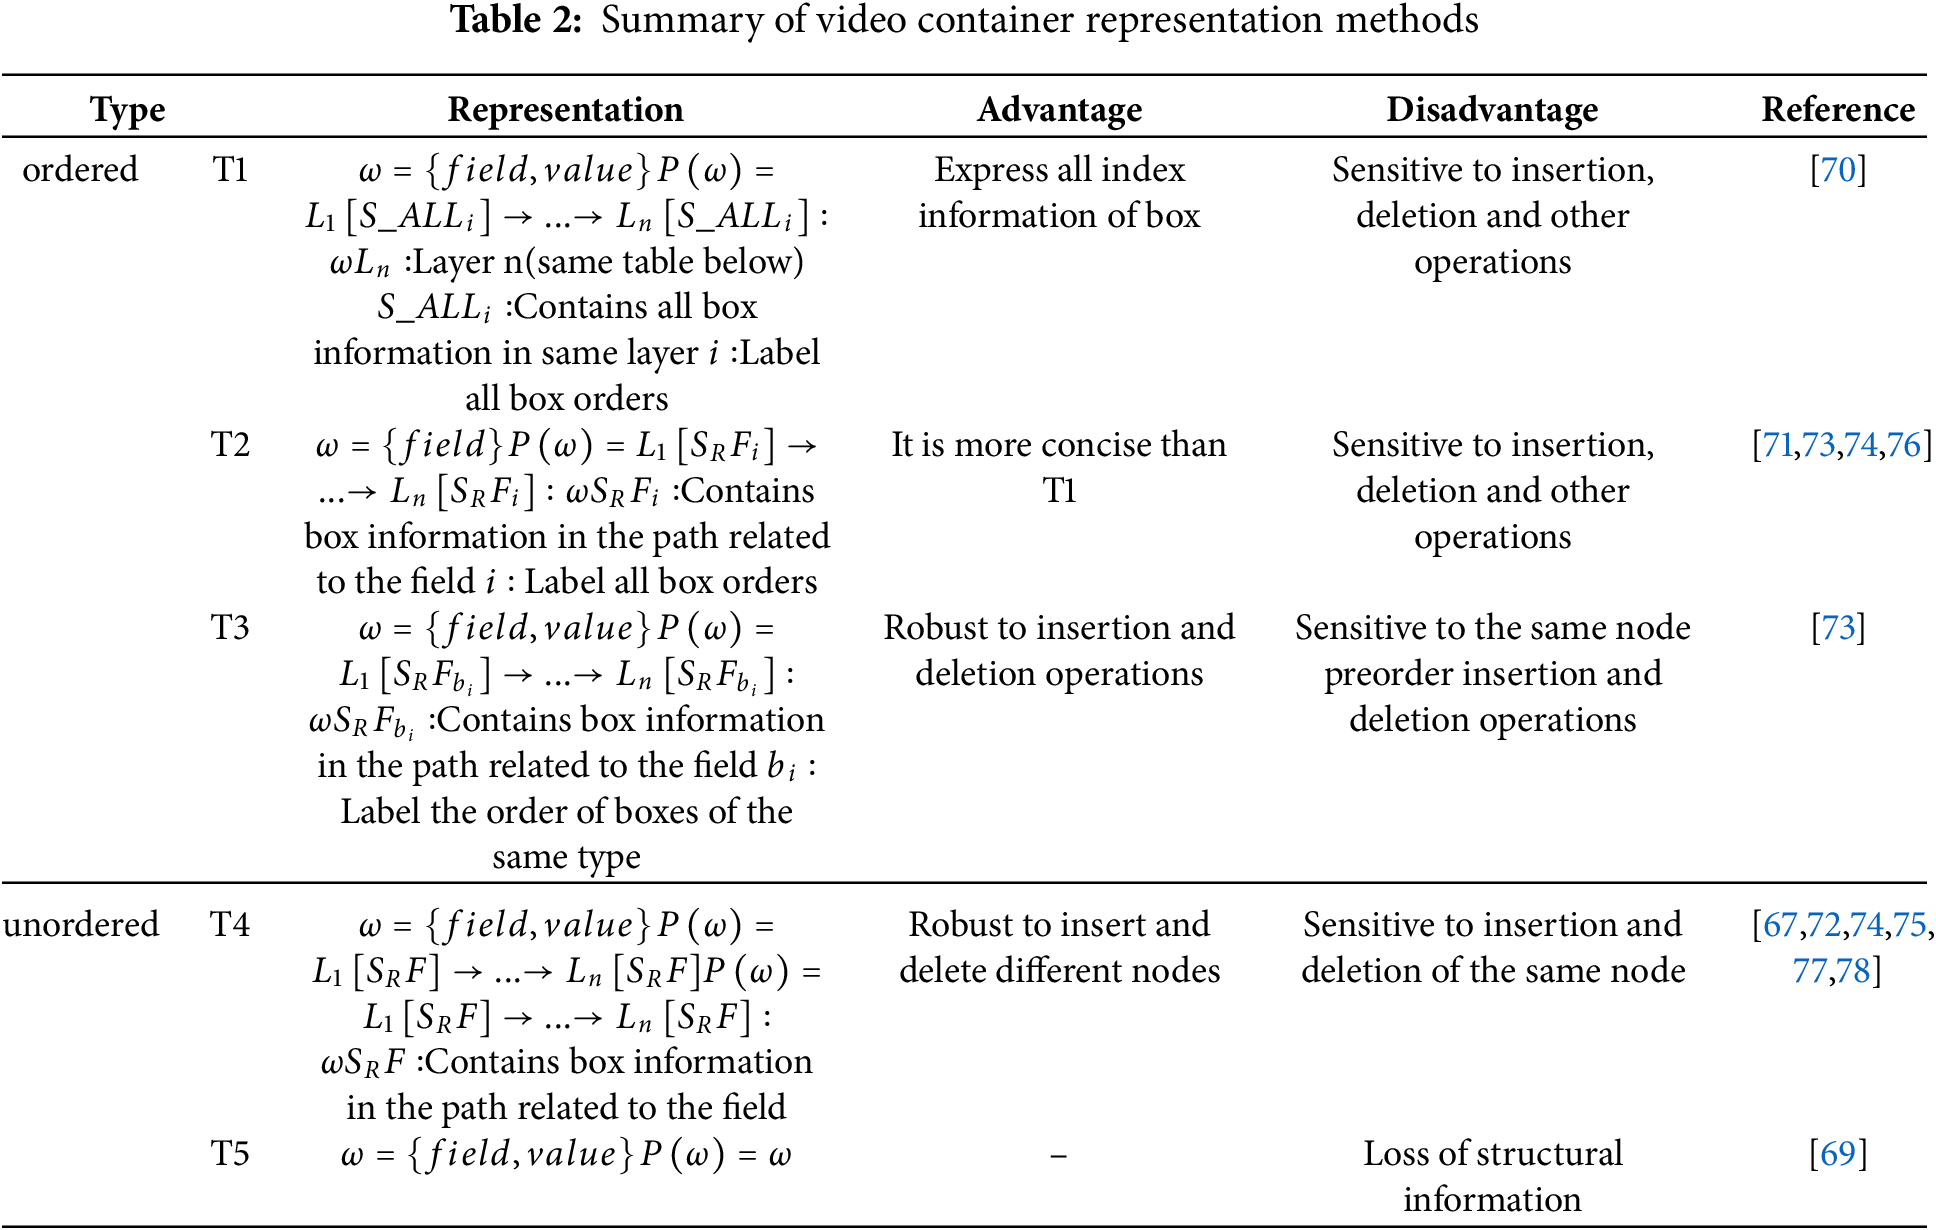
Table 2 summarizes the previously discussed video file container representation methods, which are primarily categorized into ordered and unordered approaches, along with their respective advantages and disadvantages. The ordered methods are further divided into three categories, denoted as T1, T2, and T3. T1 retains all box information preceding the field and sequentially labels all boxes. Building upon T1, T2 preserves only the box information relevant to the field’s path while similarly labeling all boxes sequentially. T3 refines the labeling approach of T2 by sequentially labeling identical boxes. The unordered methods are classified into two categories, denoted as T4 and T5. T4 maintains the same box information as T2 and T3 but disregards the order. T5 exclusively retains the final field information. It is evident that T3 currently represents the optimal method; however, the symbolic representation for preorder insertion and deletion operations on the same node remains unresolved.
In the context of large-scale video datasets, the aforementioned methods for constructing symbol sets often lead to an explosion in the cardinality of the symbol set, resulting in high-dimensional redundant feature vectors. In such scenarios, feature selection plays a crucial role. By applying feature selection techniques, effective symbols can be filtered out, leading to the construction of more compact feature vectors. Huamán et al. [71] proposed a straightforward approach that utilizes principal component analysis to identify and remove irrelevant symbols. Xiang et al. [75] introduced a correlation matrix to measure the similarity between symbol features and selected those with positive correlations. Yang et al. [72] proposed a likelihood ratio framework for the automatic removal of irrelevant symbol features. Assuming two given datasets, the logarithmic likelihood ratio for a symbol is calculated as shown in Eq. (16).
In the equation,
After determining the method of symbolic representation, it is necessary to characterize the symbolic representation through feature representation. The most commonly used feature representation technique is based on the bag of words model. Specifically, this involves counting the frequency of each symbol in the video container and using these counts to construct a feature vector. As an alternative to this approach, Xiang et al. [75] proposed a symbol type-aware feature representation technique. This method handles cases where the field value in value symbols is a continuous value by directly extracting the field value as the feature for that symbol. This approach reduces the dimensionality of the feature space.
Following the feature representation of the video container, it is crucial to apply feature classification techniques to enable automated forensic analysis of the video. Iuliani et al. [70] proposed two schemes: one for analyzing video integrity and another for identifying and classifying video source devices. Firstly, in order to verify the integrity of the video, they defined a video container similarity function based on the constructed symbolic features. The similarity measurement can effectively distinguish the original video from the tampered version. Secondly, they used binary hypothesis testing for video source device identification and classification. Güera et al. [69] used Support Vector Machine, Random Forest, and Ensemble classification to detect video tampering. Xiang et al. [75] applied Linear Discriminant Analysis for feature classification. Orozco et al. [76] tested several classifiers, including Logistic Regression, Support Vector Machine, Decision Tree, Linear Classifier, Gaussian Naive Bayes, K-Nearest Neighbor, Random Forest, Gradient Boosting Classifier, and Extreme Gradient Boosting. Unlike the aforementioned methods, which directly evaluate the performance of feature classification algorithms, Yang et al. [72] used decision tree classifier to interpret the classification results. As illustrated in the example shown in Fig. 8, the discrimination between the original video and a version tampered with Exiftool software can be achieved with a single symbol. López et al. [74] addressed the issue of video source identification in an open set and proposed an unsupervised clustering solution, incorporating hierarchical clustering and density clustering algorithms. Finally, Xiang et al. [78] proposed MP4 tree network by using self-supervised learning for training based on end-to-end Graph Neural Networks (GNN), which generates embeddings to preserve semantic nodes and improves robustness against deletion operations.

Figure 8: Decision-tree model for distinguishing between the original video and the video tampered with Exiftool
To further enhance the reliability of video forensics techniques, researchers have explored strategies for multi-feature fusion. Altinisik et al. [77] were the first to propose a scheme that integrates video file container characteristics with encoding features. For the feature representation of video file container analysis, they adopted the approach proposed by Xiang et al. [75]. Regarding encoding features, they conducted a specificity analysis of encoding parameters and extracted symbolic representations from the Sequence Parameter Set (SPS), Picture Parameter Set (PPS), and Video Usability Information (VUI). Ultimately, they fused these two video forensics clues to construct a tree diagram and employed a decision tree classifier for feature classification.
In summary, the video container parsing is essential in file container-based video forensic tasks. The current mainstream methods typically rely on publicly available video parsing tools. However, due to the incomplete information provided by these tools, the subsequent performance tends to be unstable. Therefore, there is a need for a tool that can extract as much complete information as possible. The more comprehensive the parsed data, the higher the reliability of the subsequent forensic tasks. For symbolic representation, it is essential to retain the structural information of the container. As a result, a representation method that is robust to insertion and deletion operations is required. The use of symbol selection techniques effectively removes feature redundancy, leading to reduced computational complexity and increased processing speed. The most widely used classifier in video container-based forensic tasks is the decision tree, as it balances both interpretability and detection performance. In addition, leveraging effective feature fusion techniques to integrate container information, encoding information, and additional video-related clues is a promising research direction for the future.
5 Datasets and Performance Evaluation
5.1.1 Source Camera Identification
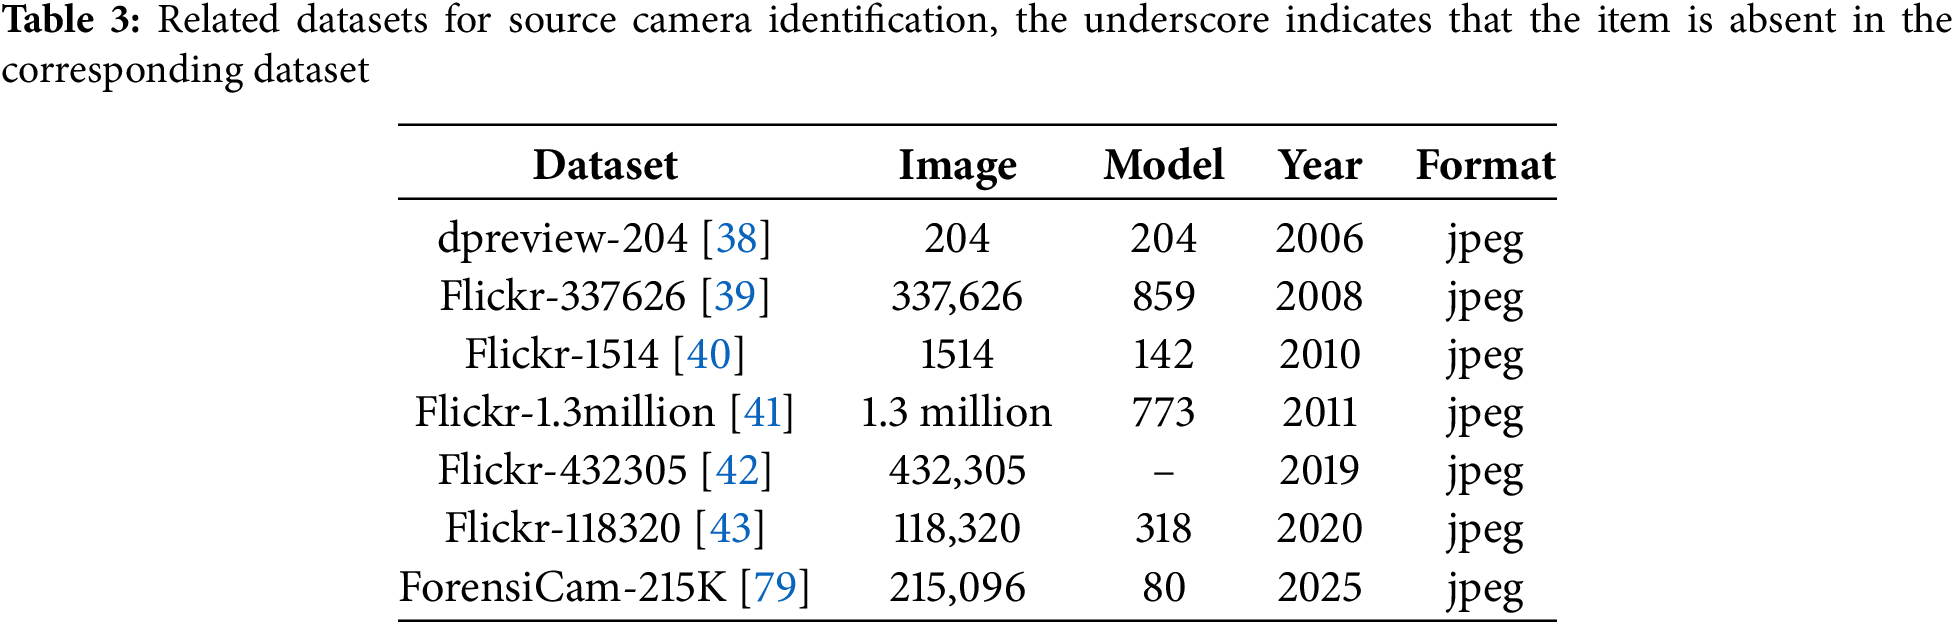
Based on different image forensics tasks, Table 3 introduces public datasets for source camera identification. The dpreview-204 dataset [38] was introduced in 2006 and was one of the earliest datasets provided for camera source identification. It consists of images captured by 204 digital cameras chosen from the dpreview website, with one image of the highest quality picked from each camera, resulting in a final dataset of 204 images. The Flickr-337626 dataset [39] was introduced in 2008 by expanding the dataset presented in [38]. It consists of 337,626 images from 859 different camera models, selected based on specific criteria. The selection criteria were as follows: only images marked as “original” were retained. Then, for each image, a combination was derived from the camera manufacturer, camera model, resolution, and quantization table. Only those combinations that appeared in at least five images were included in the final dataset. The Flickr-1514 dataset [40], presented in 2010. It consists of 1514 unmodified original images downloaded from the Flickr website, encompassing 142 different brands and models of cameras. Compared to datasets utilized in prior studies [38,39], it incorporates additional thumbnail information. The Flickr-1.3 million dataset [41] was proposed in 2011 as an expansion of the dataset presented in [40]. Initially, 10 million images were collected from the Flickr website. These images were then filtered based on specific criteria, resulting in a reduced set of 2.2 million images. From the metadata of these images, information regarding the camera manufacturer, model, and signature was extracted. Only those combinations of manufacturer, model, and signature that were associated with at least 25 images were retained. The final dataset comprises 1.3 million images, representing 773 distinct camera and phone models. The Flickr-432305 dataset [42] was created in 2019. It was optimized according to the filtering rules outlined in [41]. Initially, approximately one million images were obtained from the Flickr website. Subsequently, during the creation process, time range restrictions and user records were incorporated. Ultimately, 432,305 images were retained, encompassing 216,852 unique users. The Flickr-118320 dataset [43], proposed in 2020, was collected from the Flickr website. Unlike the dataset in [42], it retains only those images where the software field in the EXIF metadata is empty, thereby excluding postprocessed images. As a result, it comprises 9 brands and 318 models, encompassing a total of 118,320 images. The included brands are Canon, Nikon, Apple, Sony, Olympus, Panasonic, Samsung, HTC, and Ricoh. In addition, the dataset includes images processed by 27 app software and 121 desktop software. The datasets mentioned above are mostly collected using Flickr, an online image-sharing platform, which inevitably leads to some labeling errors. To address this issue, recently, Du et al. [79] constructed a new large-scale image dataset, comprising 215,096 images collected under controlled conditions from 130 devices, 80 models, and 10 brands.
5.1.2 Image Sharing Chain Detection
Table 4 summarizes the image datasets used for image sharing chain detection. The dataset2017 [44] was proposed in 2017. It consists of images captured by eight devices and uploaded to ten different social media platforms. Specifically, 2400 images were collected via web browsers and 320 via mobile applications, totaling 2720 images. The VISION-2100 dataset [45], presented in 2018. It is based on 35 different devices from the VISION [80]. Ten images were selected from each device, and each image was uploaded to Facebook Messenger, Telegram, and WhatsApp via both Android and iOS systems. Thus, a total of 2100 images were generated. The E-VISION [45] dataset was introduced in 2018. It extends the previous VISION-2100 dataset by incorporating images that have been shared twice. Specifically, each of the 350 original images was first shared through one of three social media applications and then shared again through another application. To prevent the dataset from becoming excessively large, the operating system combinations for secondary sharing were limited to two sequences: iOS to Android or Android to iOS. Through this method, a total of 6300 secondary shared images were generated. Along with the original 350 images, the dataset comprises a total of 6650 images. The J-VISION [45] dataset is constructed by merging the VISION-2100 and E-VISON datasets, encompassing original images, single shared images, and double shared images, with a total of 8750 images. Unlike previous datasets, R-SMUD and V-SMUD include images that have been shared on social media platforms up to three times. The R-SMUD [46–48] dataset was proposed in 2019. It is based on the RAISE dataset [81]. Initially, 50 raw images were selected and then cropped to generate images with resolutions of 377
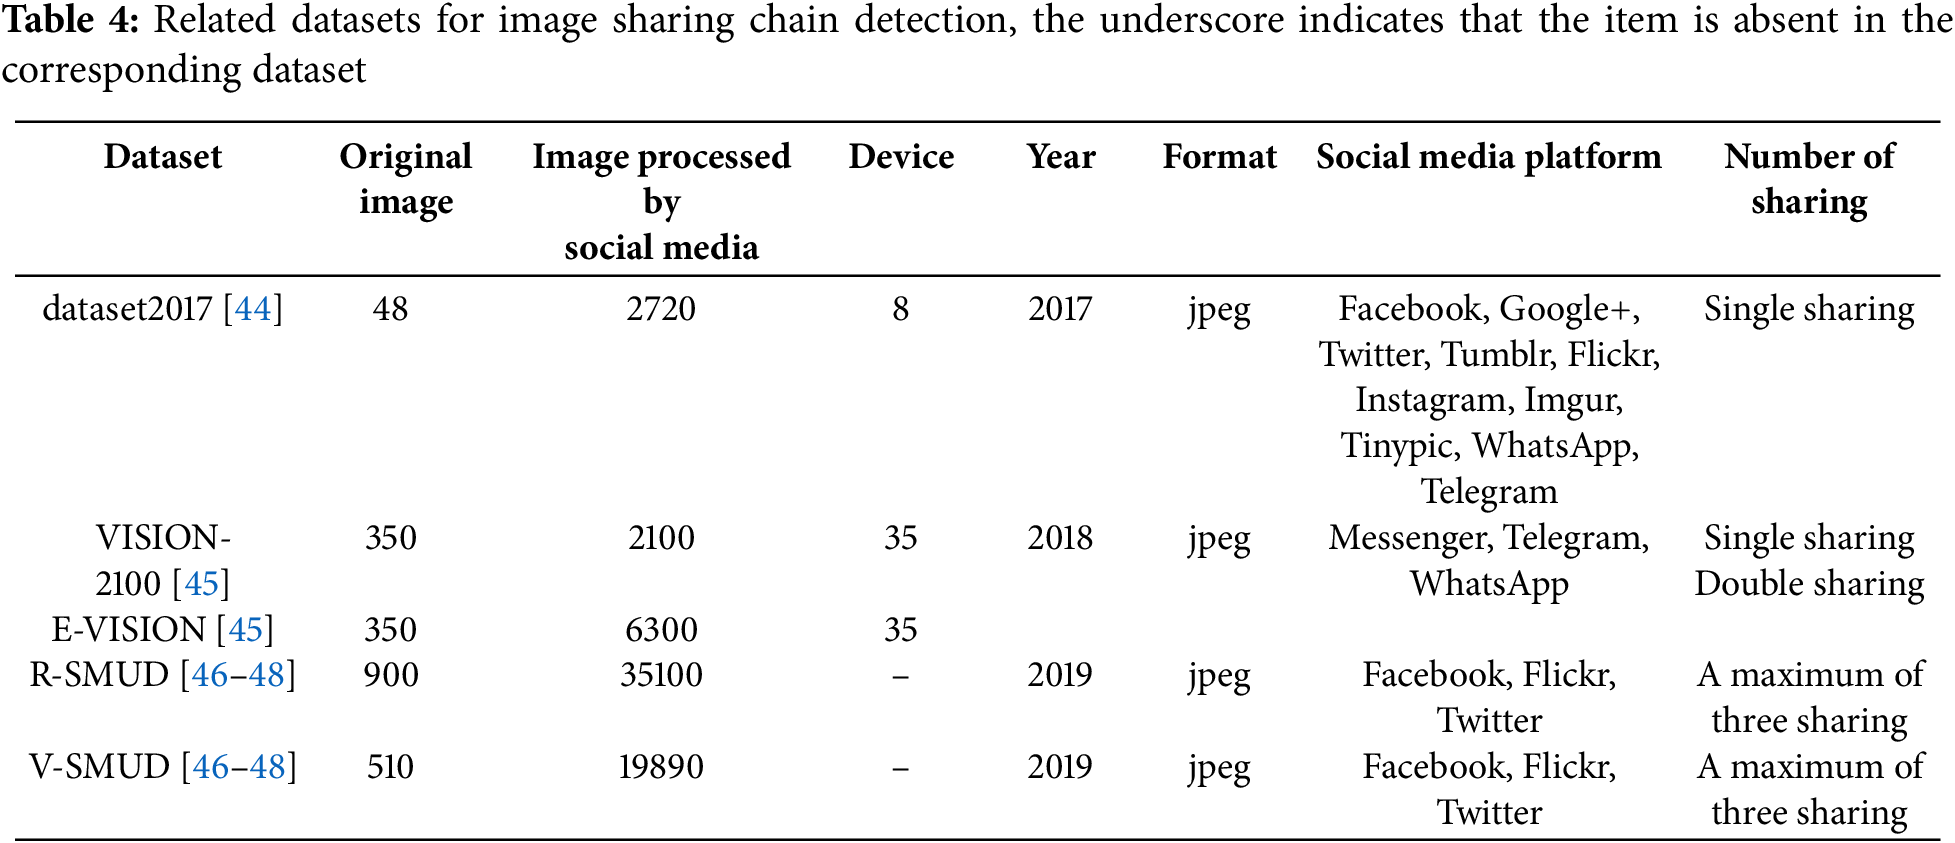
Table 5 presents datasets related to forgery detection. First, we present datasets containing images whose semantic content remains unaltered. The Olympus-1600 [58] dataset was proposed in 2011 and consists of 1600 images. It was created by randomly selecting 200 images from 400 default images captured by the Olympus E500 camera for learning regression weights, while the remaining 200 images were subjected to six adjustment operations: brightness increase and decrease, gamma compression and expansion, inverse S curve, and S curve, resulting in 1400 images for testing. The Canon/Olympus-8400 [59] dataset was developed in 2013 as an extension of the Olympus-1600 [58]. It includes images captured by three different cameras: the Canon 450D, Canon 10D, and Olympus E500, totaling 1200 default images. Using the same tampering method as in the Olympus-1600 dataset [58], 7200 tampered images were generated, resulting in a total of 8400 images in the entire dataset. The Canon-400 dataset [60] was introduced in 2015. It differs from previous datasets because its primary purpose is to investigate methods for detecting local tampering. Consequently, it comprises 400 images captured by the Canon IXUS-105, which are categorized into four types: original images, blurred images, curved images, and sharpened images. The Adobe/Scape dataset [49] was launched in 2020. It includes metadata from both original and modified images. The original images, totaling 1683, were captured using two camera devices. Modifications were performed using Adobe Photoshop or PhotoScape software, resulting in a total of 21,828 image metadata samples, 1683 from original images and 20,145 from modified ones. Unlike previous datasets, it incorporates metadata from both original and tampered images.
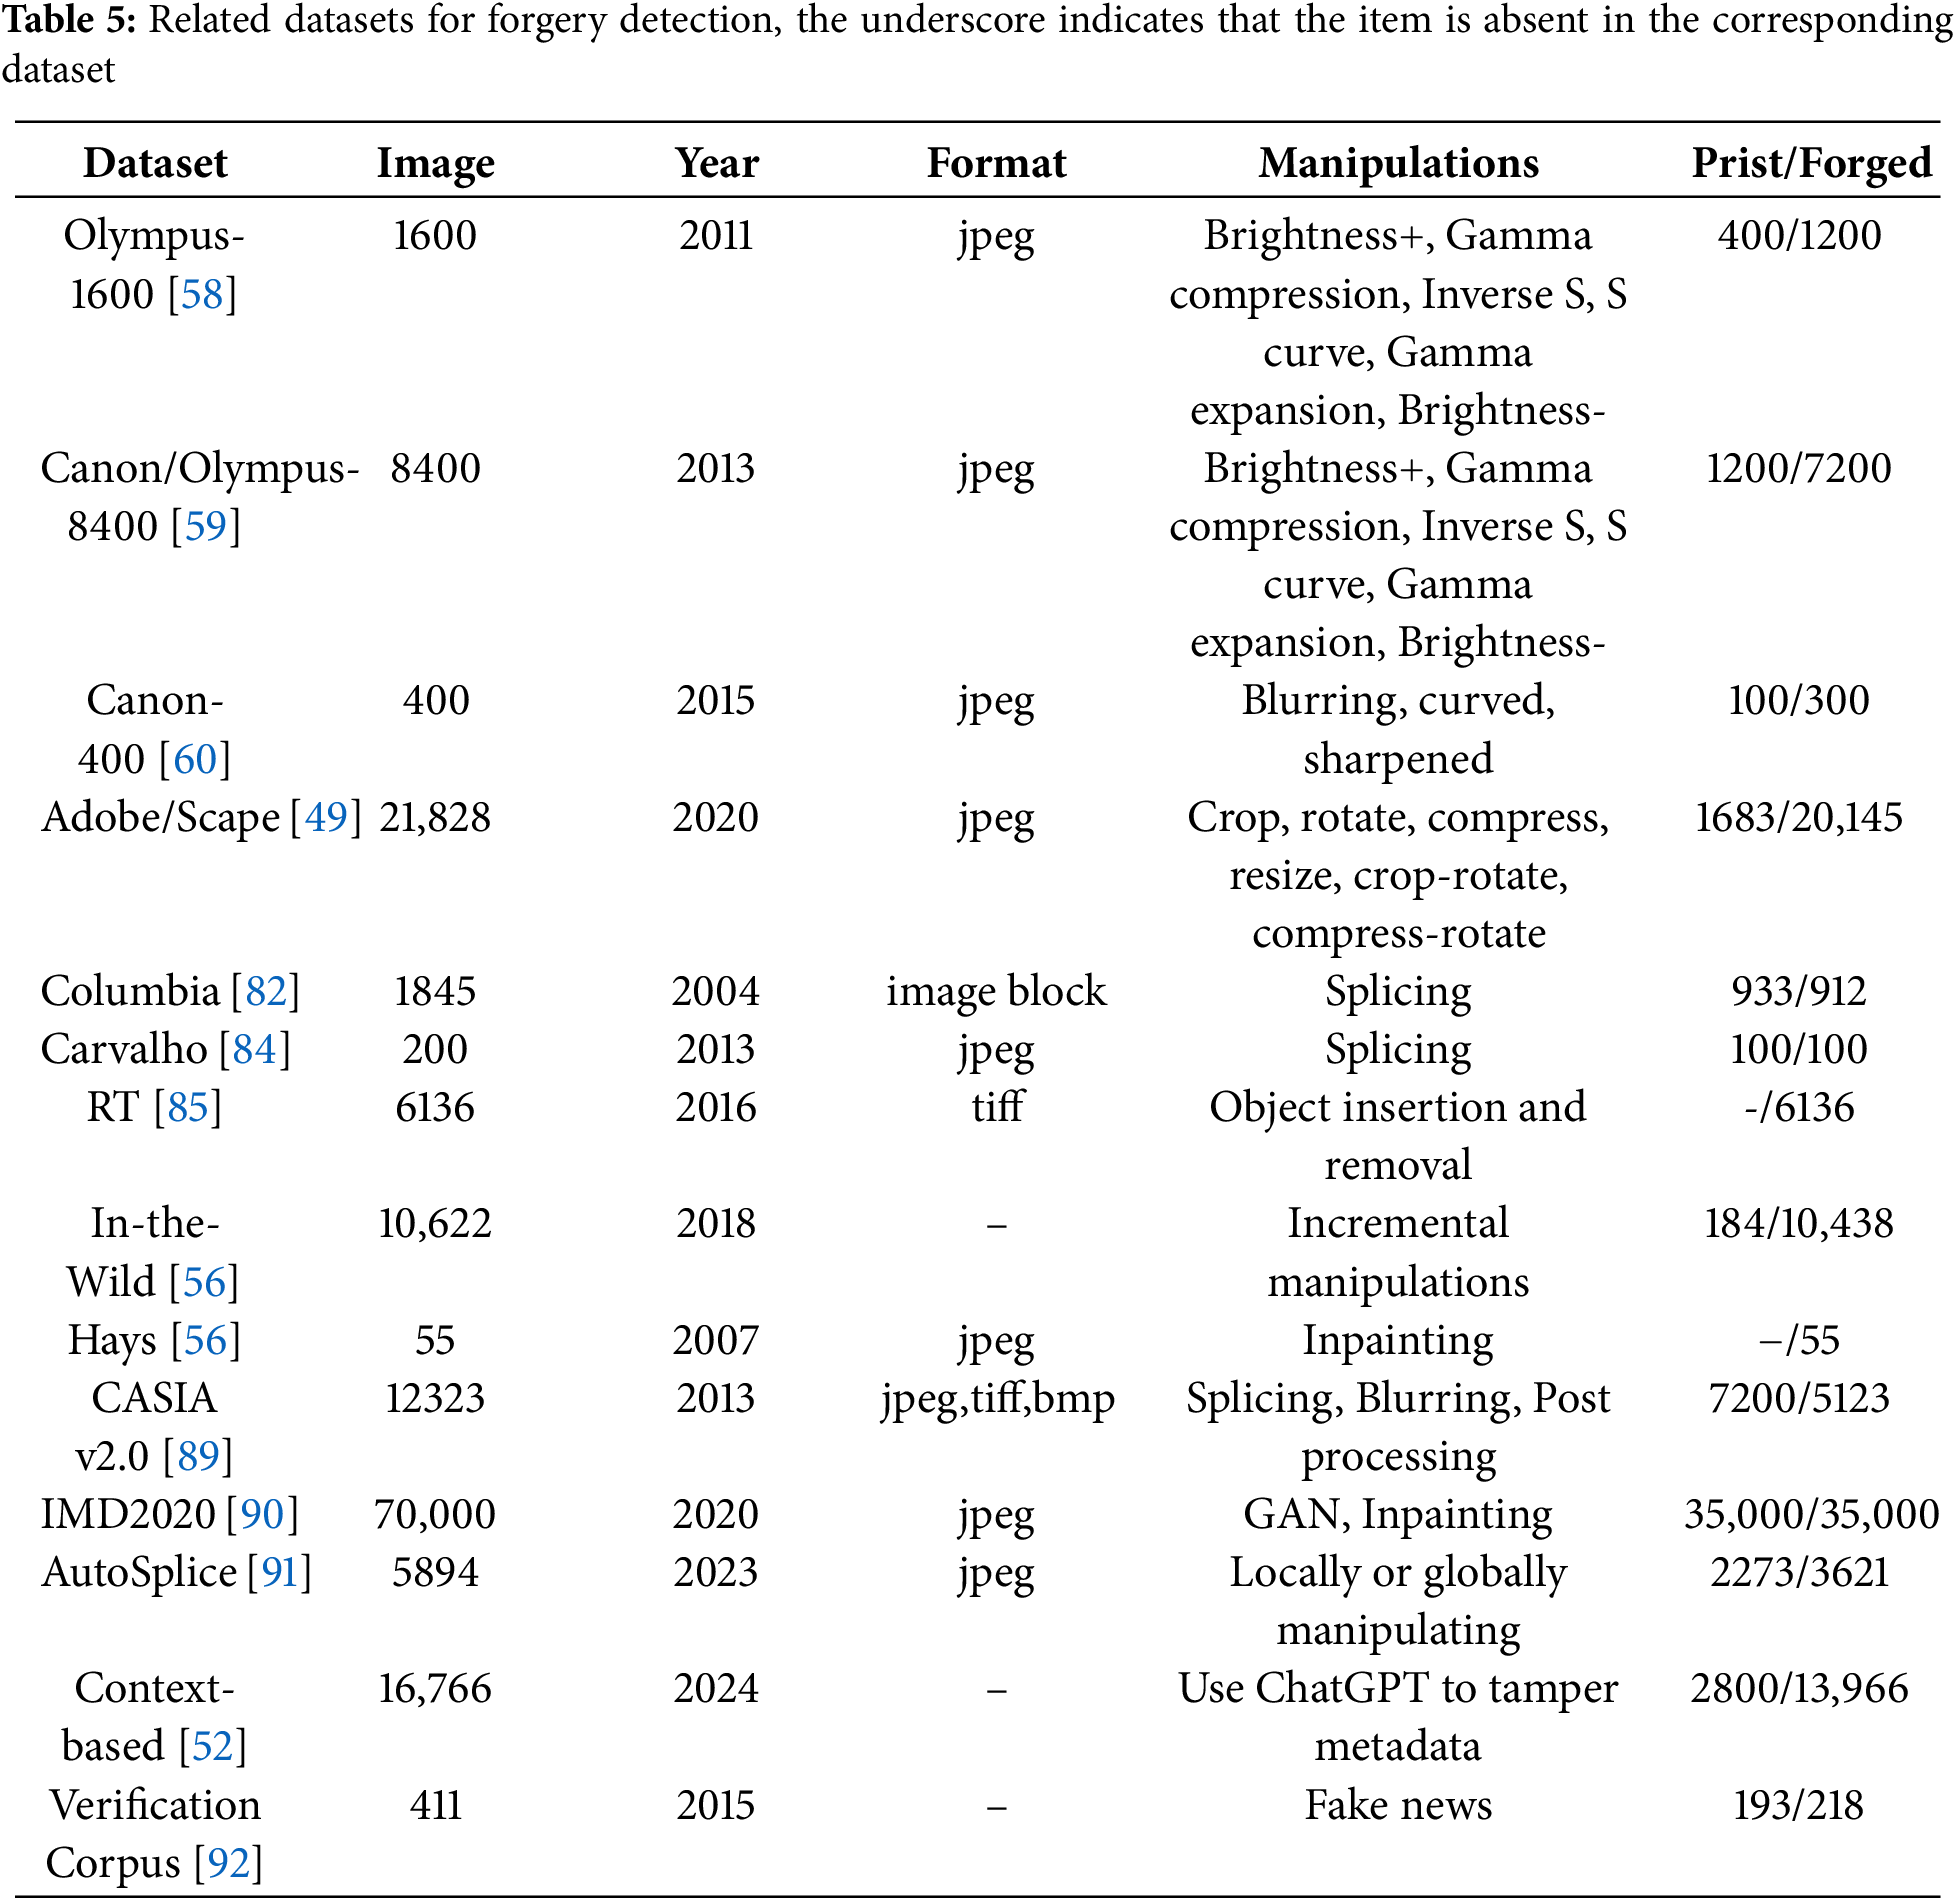
Next, we introduce datasets where the semantic content of images has been altered. The Columbia dataset [82], proposed in 2004, includes 1845 image blocks, each measuring 128
Table 6 summarizes the datasets related to video forensics. The VEDR dataset [67] was introduced in 2016 and consists of 296 original videos. These videos were subsequently modified using Adobe Premiere, Sony VEGAS, Avid MC, Edius, and Avid Studio, resulting in a comprehensive collection of 305,981 tampered videos. The ACID dataset [93], launched in 2019, consists of 12,173 videos collected from 46 devices, spanning 36 unique camera models across 18 distinct camera brands. Tailored specifically for camera source identification tasks, this dataset incorporates videos from a wider variety of devices compared to previous datasets. The SOCRatES dataset [94], proposed in 2019, is tailored for smartphone source camera identification. Encompassing 1000 videos from 103 unique smartphones across 15 brands and 60 models, it also holds the record for the highest number of sensors in source camera identification datasets. The VISION dataset [80], released in 2017, includes 648 original videos captured by 35 devices across 29 models from 11 brands. Among these, 622 videos were shared on YouTube at the highest resolution, and 644 were shared via WhatsApp, culminating in a total of 1914 videos. Compared to previous datasets, it includes videos that have been processed by social media platforms. The EVA-7K dataset [72] is a newly developed video dataset, built upon the foundation of the VISION dataset [80] and introduced in 2020. It comprises videos sourced from 11 brands and 35 devices, with 4 videos selected from each device, yielding a total of 140 original videos. A portion of these videos was automatically generated using ffmpeg and Exiftool, while another portion was manually edited using tools such as Kdenlive, Avidemux, and Adobe Premiere, resulting in 1260 tampered videos. Subsequently, both the original and tampered videos were disseminated across four social media platforms, namely YouTube, Facebook, TikTok, and Weibo, culminating in a total of 7000 videos. Compared to the earlier VISION dataset [80], EVA-7K stands out for its inclusion of tampered videos and its representation of a more diverse array of social media platforms. The DISIA-V2 dataset [71], published in 2020, includes 1957 original videos generated by 86 devices from 11 brands and 66 models. These videos were then shared across nine social media platforms: Facebook, YouTube, Flickr, LinkedIn, Instagram, Twitter, Tumblr, WhatsApp, and Telegram, resulting in a total of 3682 videos. Additionally, the dataset includes 721 tampered videos that were modified using five editing software tools: Adobe Premiere, Camtasia, FFmpeg, Lightworks, and Movie Maker. Compared to previous datasets, DISIA-V2 encompasses videos from a larger number of devices and has been shared across a greater variety of social media platforms.

5.3 Image and Video Parsing Tools
The storage mode of image and video files is usually highly complex. Different formats of files follow specific standards, which produce different traces in the process of image and video file generation, storage and compression. Therefore, professional image and video parsing tools can be used to parse these files more deeply and extract information effectively. As shown in Table 7, we have sorted out the existing public image and video file parsing tools and explained the attributes of four aspects: categories of software, compatible format, file parsing structure and file analysis approach.
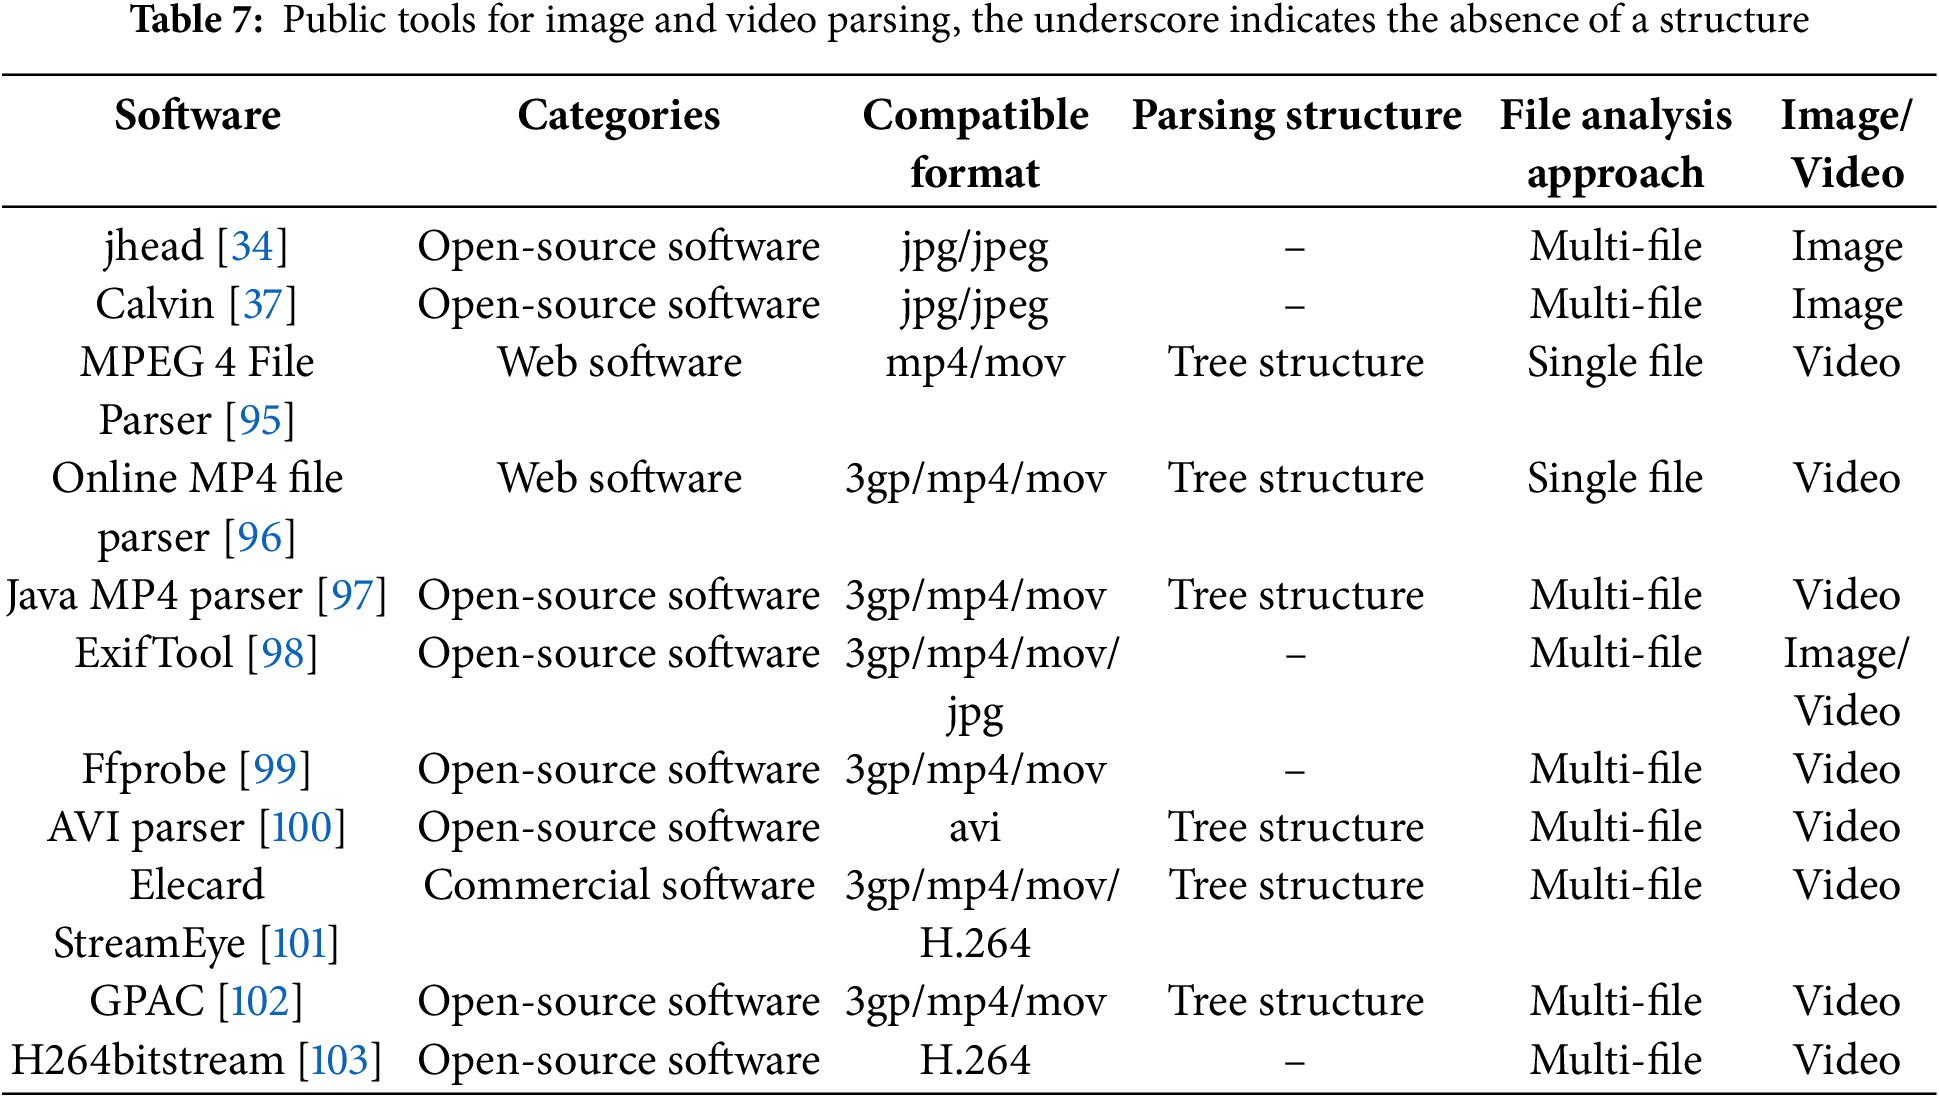
According to the summary of Table 7, the existing public parsing tools are mainly divided into three categories: open-source software, web software and commercial software, covering JPEG, MP4, AVI, H.264 and other formats. Open-source tools have become the mainstream choice in research and practice due to their flexibility and customizability. For example, jhead [34] and Calvin [37] focus on parsing jpg/jpeg format and support batch processing through multi-file analysis method, which is suitable for metadata extraction scenarios. ExifTool [98] further extends its compatibility by supporting the parsing of video formats such as 3GP, MP4, and MOV, as well as JPEG images. Its multi-file analysis ability makes it an efficient tool for cross-media type metadata extraction. For video files, both Java MP4 Parser [97] and GPAC [102] adopt tree structure to parse 3gp/MP4/MOV format and support multi-file analysis. Furthermore, H26dbitstream [103] specializes in bitstream parsing for H.264 encoding, providing essential technical support for research in video compression. As an integral part of the FFmpeg toolchain, Ffprobe [99] supports multi-file analysis of video formats such as 3GP, MP4 and MOV. Its open-source nature and command-line interface have made it widely used in multimedia processing pipelines.
Web tools are characterized by their lightweight nature and convenience, making them suitable for rapid online analysis. Both the MPEG 4 File Parser [95] and the Online MP4 File Parser [96] visualize the hierarchical structure of MP4/MOV files using a tree structure, with the latter also supporting the 3GP format, thereby extending its applicability. Commercial tools, such as Elecard StreamEye [101], are designed for professional video analysis needs, offering compatibility with 3GP, MP4, MOV and H.264 formats. They utilize a tree structure to enable in-depth analysis of video encoding parameters.
5.4 Performance Evaluation and Analysis
According to the latest research results, image and video forensics tasks based on file containers characteristics have achieved excellent detection performance. Currently, the widely used performance evaluation metrics include: Accuracy (ACC), Balanced accuracy (B-ACC),Precision, Recall, F1, Mean Average Precision (mAP), Permuted mean Average Precision (p-mAP) and Class-balanced Intersection over Union (cIOU). The calculation formula is given below.
In the above equation, TP, TN, FP and FN represent true positive, true negative, false positive and false negative. True Positive Rate (TPR) refers to the proportion of actual positive samples that are correctly identified by the classifier and False Positive Rate (FPR) refers to the proportion of actual negative samples that are incorrectly classified as positive by the classifier. The ROC curve, a statistical graph used to evaluate classifier performance, is obtained by plotting the relationship between the True Positive Rate and the False Positive Rate. The area under the ROC curve, known as the AUC, reflects the overall capability of the classifier. The AUC value ranges from 0 to 1, with a value closer to 1 indicating better model performance. mAP is the average of AP across all classes and is an important metric to measure the overall performance of the model. p-mAP is an improved mAP measure, which adjusts the mAP by category permutation to ensure that the weight of each class is more balanced in the calculation. cIOU is a variant of the standard IOU. It is optimized for class imbalance, so that small splicing regions and large splicing regions have relatively balanced weights when calculating IOU.
5.4.1 Image Source Camera Identification
Table 8 compares the performance of various source camera identification methods, with [38–42] addressing model-level identification and [43] addressing brand-level identification. As observed from the table, these methods are primarily based on equivalence class schemes. The earliest approach, introduced in [38], groups devices that share the same quantization table into a single equivalence class. Subsequent methods built upon this foundation by incorporating additional conditions to refine the classification of equivalence classes. From the table, it can be seen that in [38], when classifying 204 images based on their quantization tables, yielding 62 equivalence classes of size 1. Each image is sourced from a single device, resulting in a total of 204 devices. This means that 62 devices have corresponding unique quantization tables, which can be used to identify the device by examining the quantization table. In contrast, the remaining 142 cameras share their quantization tables with other cameras, indicating that the images from these cameras cannot be precisely attributed to a specific camera. In [39], a dataset with a significantly larger number of images compared to [38] is used, totaling 337,626 images. The study finds that the number of equivalence classes with a size of 1 is 2704, which accounts for 26.6

5.4.2 Image Sharing Chain Detection
Table 9 shows the performance comparison of image sharing chain detection algorithms. As shown in the table, for the image single-sharing problem, reference [44] achieved a classification accuracy of 0.960 using K-Nearest Neighbors (KNN) and decision trees classifiers. This result demonstrates that by extracting features from image marker segments, image dimensions, the number of EXIF metadata entries, and quantization table numerical features, an effective discriminative representation can be constructed. In [45], the performance of three classifiers was systematically evaluated: logistic regression (LR), support vector machine (SVM), and random forest (RF). The experimental design encompassed three scenarios: single sharing, double sharing, and a combination of single and double sharing. The results indicate that in both single and double sharing environments, the SVM classifier achieved superior performance, with an accuracy of 1.00 on the VISION-2100 dataset. Conversely, under the combined single and double sharing scenario on the J-VISION dataset, the RF classifier demonstrated slightly better performance compared to the other two classifiers. The results demonstrate that the method combining DCT coefficients and metadata achieves notable performance in social media platform detection, with accuracy reaching 1 in some cases. This indicates that DCT coefficients and metadata are promising features for this task, and future research can build upon this approach to further improve performance. reference [46–48] conducted experiments on the R-SMUD and V-SMUD datasets, respectively. Notably, reference [46] utilized a CNN-based framework to combine the DCT coefficients and metadata. Unlike previous approaches, it includes accuracy metrics for triple sharing. As can be seen from the table, the accuracy for single sharing in the R-SMUD and V-SMUD datasets reached an impressive 0.998 and 1, respectively. Although the performance for triple sharing was not as outstanding in these two datasets, this is merely a beginning, and it provides new directions for future research. In addition to using DCT coefficients and metadata, [47] further included JPEG Marker Segment counts as features. As shown in the table, adding this new feature significantly improved performance, particularly in scenarios involving double and triple sharing. Compared to [47], reference [48] incorporated feature map as an additional feature, further enhancing performance in both double and triple sharing scenarios. Based on the comparison of the approaches utilized in [46–48], it can be summarized that the method integrating image content, DCT coefficients, metadata, and JPEG Marker Segments with a Transformer model achieves the best performance across three sharing scenarios. In contrast to traditional classification methods, the Transformer employs an encoder-decoder architecture to progressively detect sharing chains. This approach exhibits particular effectiveness in double and triple sharing environments. Specifically, in double sharing scenarios, it attains performance metrics of 0.821 and 0.851 across two datasets, respectively, while in triple sharing scenarios, it achieves performance metrics of 0.556 and 0.616 across the same datasets, respectively.

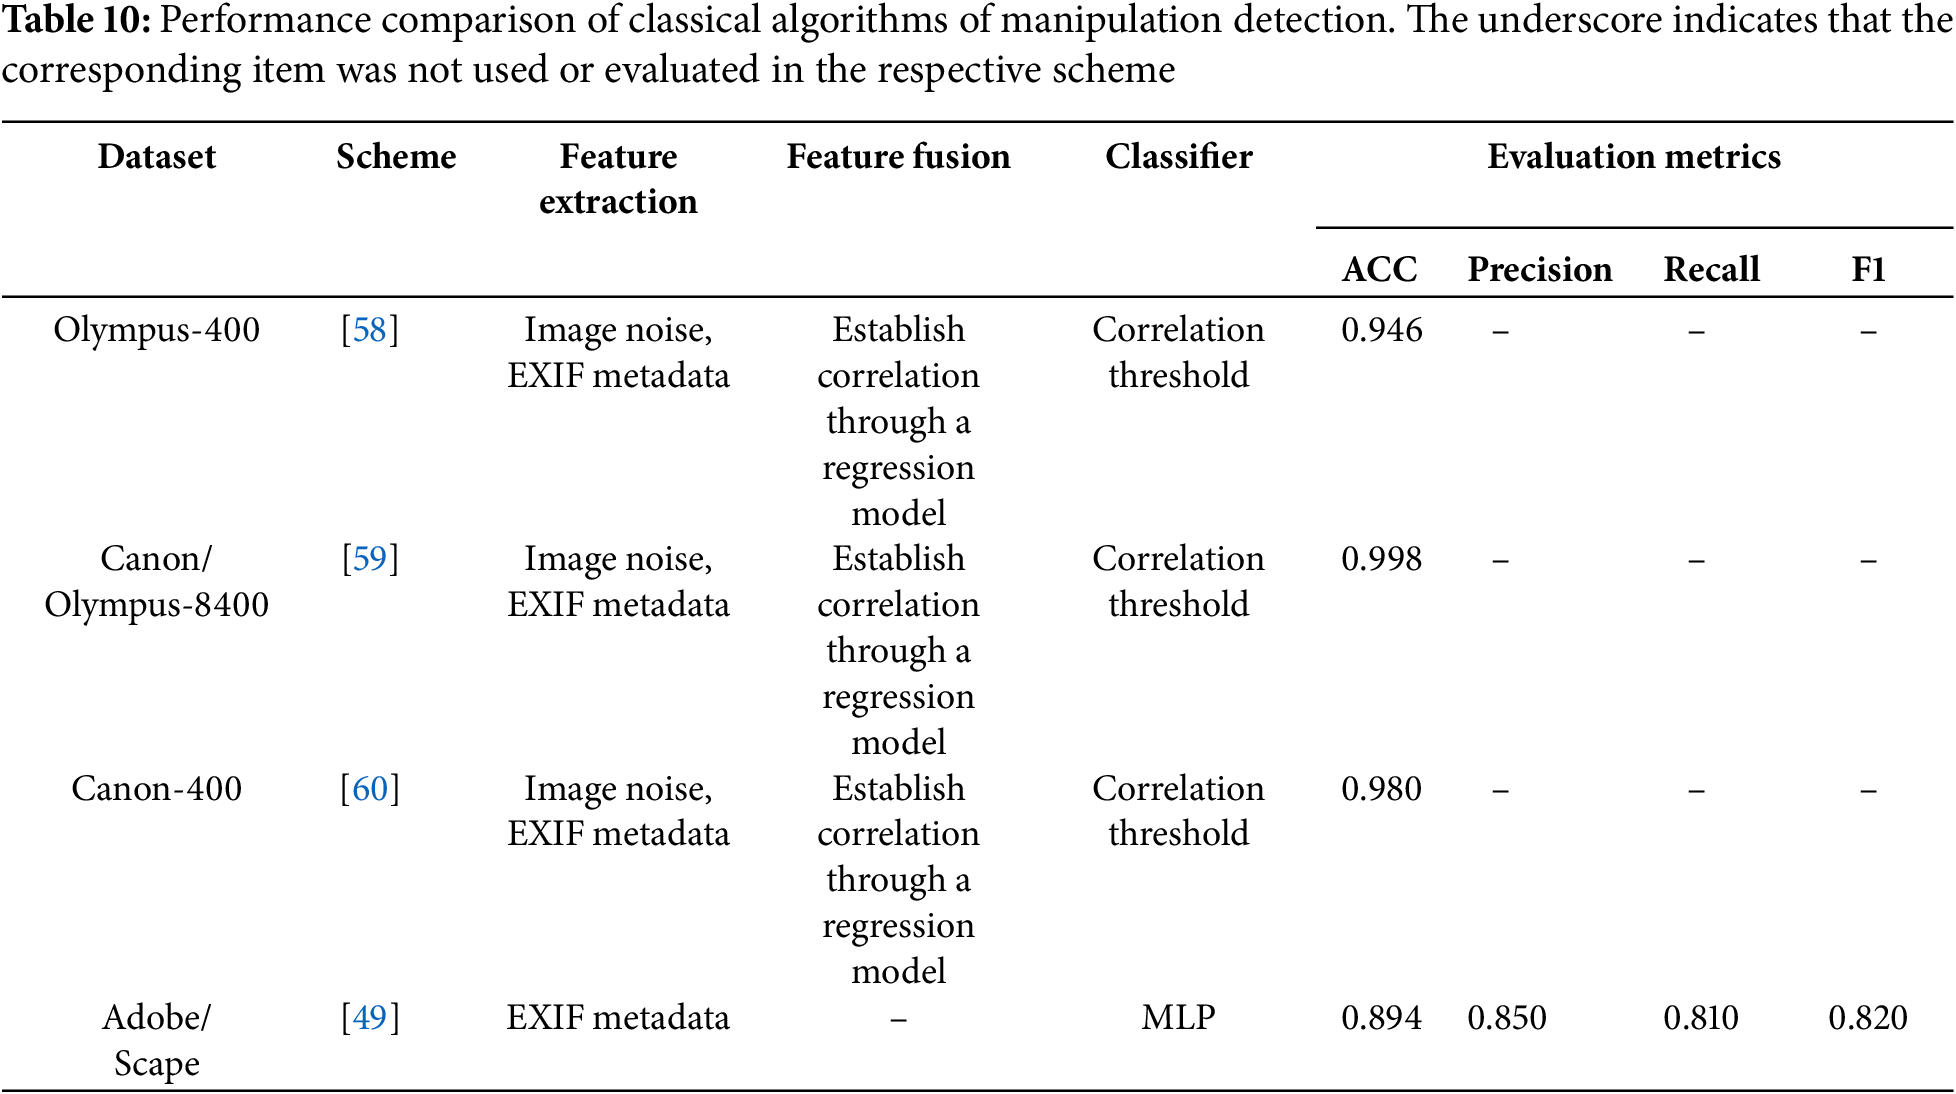
For the manipulation detection, Table 10 presents the performance achieved by various methods. It can be seen that the methods proposed by [58–60] achieved comparable performance on different datasets. They all utilize image noise features and EXIF metadata features to build models for detection. As evident from the table, reference [59] achieved better performance compared to [58], reaching 0.998. This improvement stems from the approach in [59], where both the mean and standard deviation are used for noise features, while for EXIF metadata, only three features directly influencing image noise levels are selected: aperture, shutter speed, and ISO. In contrast, reference [60] not only detects forgery in the entire image but also specifically designs a detection process for local tampering. For global image forgery detection, it reports ACC for original, blurred, curved, and sharpened images. To enable a more straightforward comparison, we compute the average of these results, obtaining an overall ACC of 0.980.
For the forgery detection, Table 11 presents the performance results obtained by different methods. Currently, due to the use of different evaluation metrics across various datasets and approaches for forgery detection, it is relatively difficult to compare different forensic solutions. In this section, we compare solutions that use the same evaluation metrics and similar approaches, providing a performance analysis. As reported by [50,56] the application of contrastive learning method improves the performance in the three metrics of mAP, p-mAP and cIOU. We can observe from the table that the contrastive learning method achieves superior results compared to the Siamese network method across multiple datasets, with the exception of the RT dataset, where it does not outperform previous methods. In the RT dataset, the mAP reaches 0.550, and the cIOU reaches 0.750. This is due to the fact that the RT dataset is an image dataset encompassing various types of tampering, with more diverse tampering operations, thereby increasing the difficulty of detection. Specifically, the contrastive learning method enhances detection efficiency by training the model to learn the intrinsic connections between images and their corresponding EXIF metadata through matching. In [49] and [51], the datasets utilized consist of image metadata. We observe that the detection results obtained using the Transformer model exhibit a slight improvement in ACC, precision, recall, and F1 score. This enhancement can likely be attributed to the Transformer’s multi-head attention mechanism, which allows the model to simultaneously focus on different parts of the input data. Additionally, through its positional encoding mechanism, the model is able to understand the order and structured relationships of elements within the metadata.
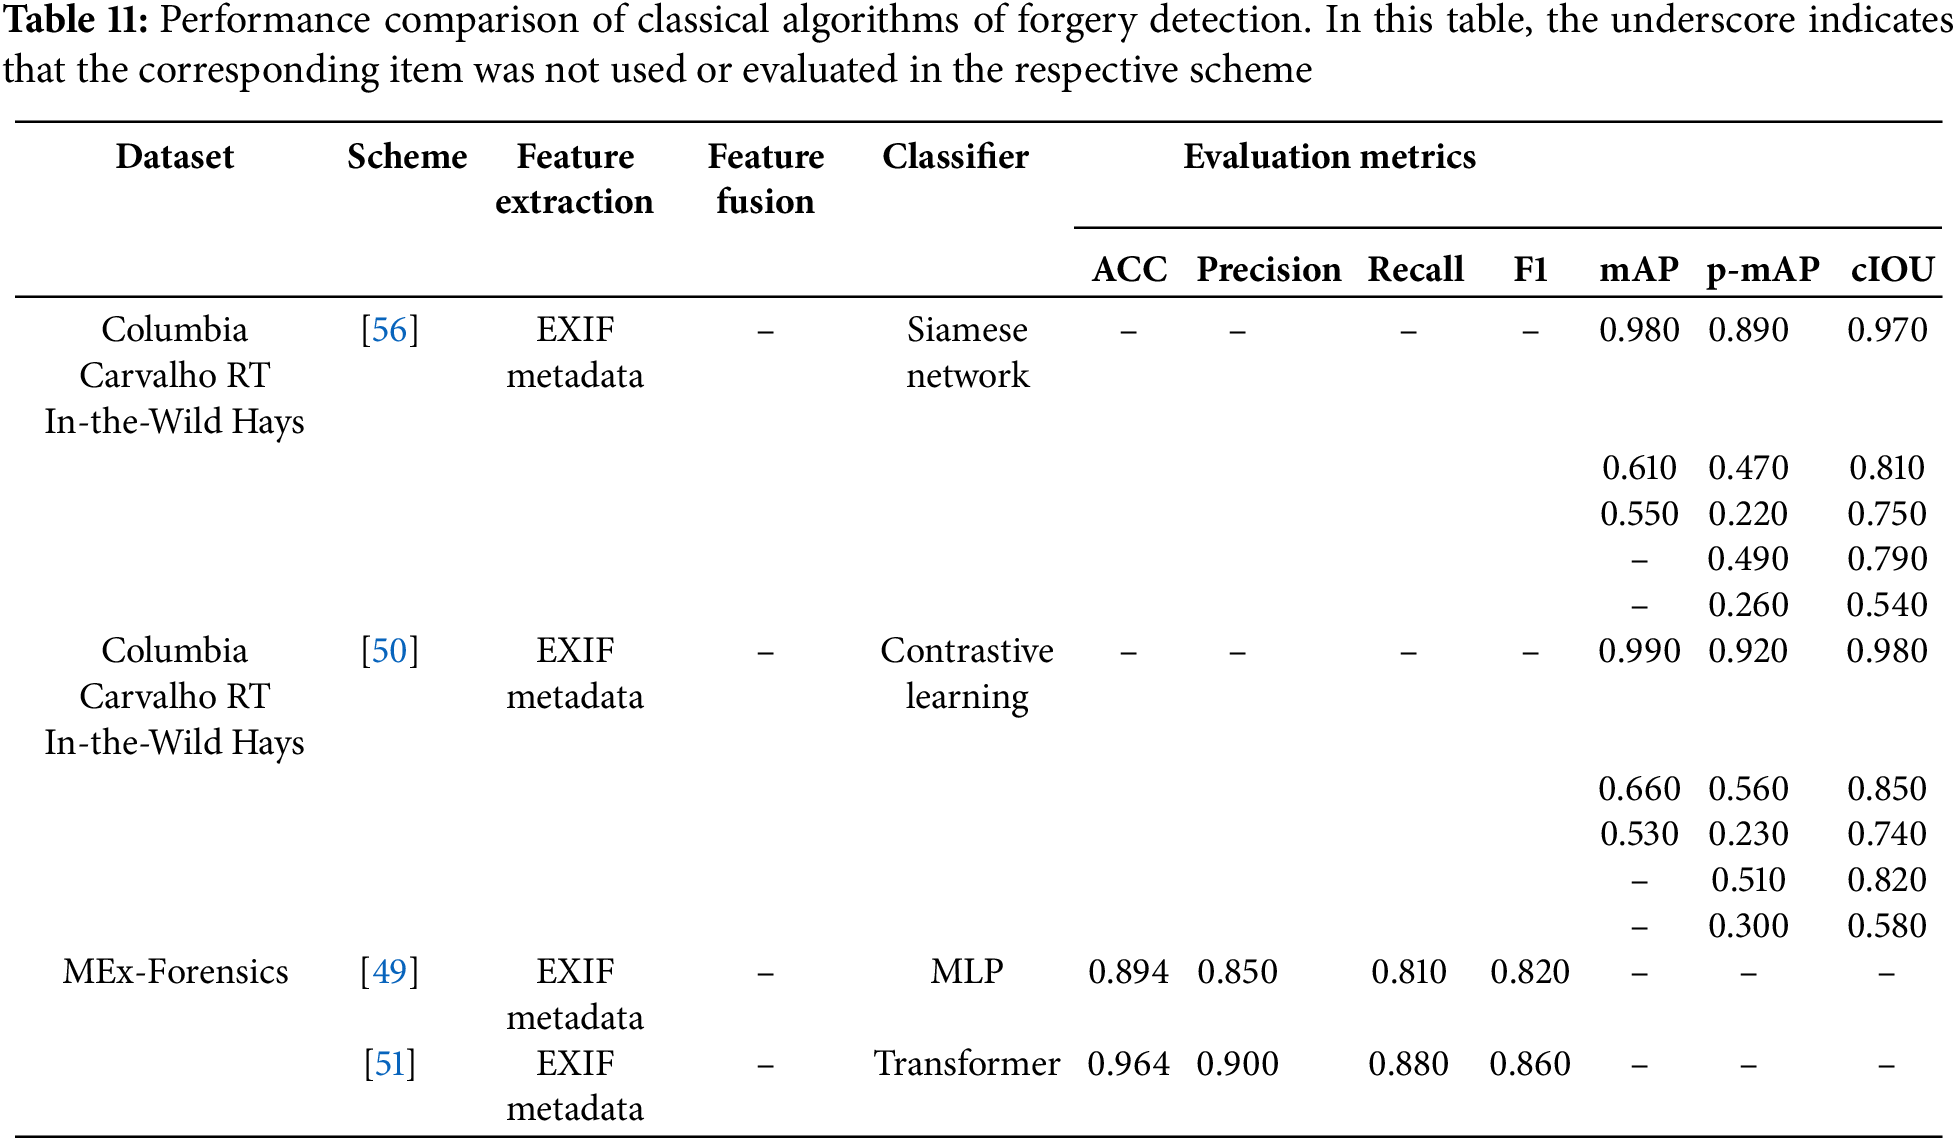
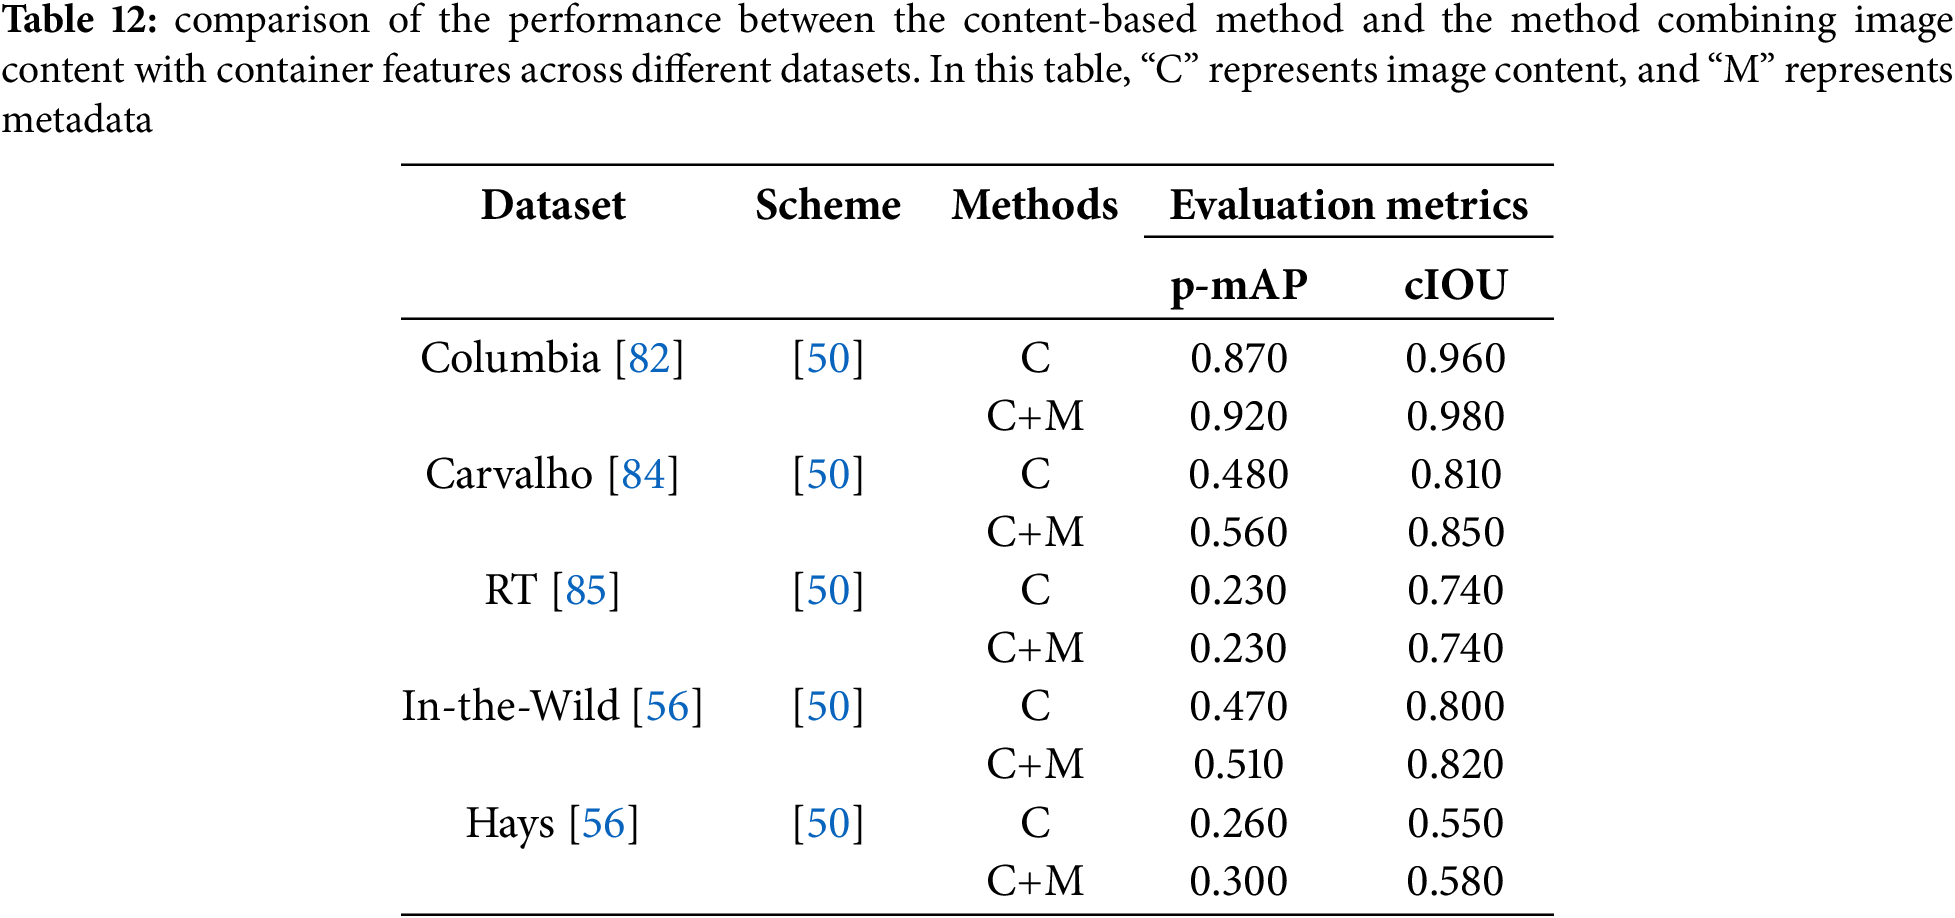
Table 12 compares performance between content-based methods and hybrid approaches incorporating both image content and file container features across multiple datasets. The table demonstrates consistent performance gains from feature fusion. For example, on the Columbia [82] dataset, the hybrid method achieved 0.920 p-mAP, a significant improvement over the 0.870 obtained using image content alone. Similarly, cIOU increased from 0.960 to 0.980 with feature integration. This pattern persists across all datasets, where hybrid approaches consistently yield higher p-mAP and cIOU values, confirming that file container features enhance model performance.
5.4.4 Video Social Network Attribution
As can be seen from Table 13, the identification of social network attribution primarily involves two symbolic representation methods, T2 and T4, as well as two feature representation approaches, the bag of words model and type-aware representation. Across two different datasets, all methods achieved an F1 score above 0.97, except for the LDA classifier, which only reached 0.876. This indicates that regardless of the symbolic representation or feature representation method used, video container-based approaches can achieve excellent performance.

5.4.5 Video Manipulation Tool Identification
Table 14 shows the performance comparison of manipulation tool identification algorithms. As shown in the table, the T1 symbolic representation method achieved an AUC of only 0.820 on the VISION dataset, making it the least effective among all compared approaches. This is because T1 analyzes all field values by combining each value with its corresponding node path to form a symbolic representation. However, when identical content is inserted at different nodes, this representation fails to effectively distinguish between them. In contrast, the T4 representation consistently yielded strong results across different datasets. Notably, when using the T2 method, all configurations except for the LDA classifier achieved 1. Through the performance comparison of schemes [72,75,77] on EVA-7K database, it is found that the feature fusion scheme can improve the detection accuracy and the performance of type-aware feature representation is better than that of the bag of words.

5.4.6 Video Source Camera Identification
Table 15 shows the performance comparison of several schemes. By comparing the detection performance of the three schemes in [69,70,72] on the EVA-7K database, it is evident that the T4 symbol representation outperforms both T1 and T5. When faced with large-scale forensic datasets, the symbolic representation method T3 achieves better performance than T2. For example, the performance comparison results of scheme [73] on two databases ACID and VISION show that T3 representation method is more robust. The bag of words model and type-aware feature representation methods were tested in [77]. It can be seen that the type-aware method generally achieves better performance than the bag of words. Similarly, results from scheme [77] indicate that, under the same feature representation strategy, feature fusion can greatly improve the performance of the algorithm.

5.4.7 Video Manipulation Detection
Table 16 summarizes the comparison of the performance of classical algorithms for the video manipulation detection. As shown in the table, within the same dataset, the T4 symbolic representation outperforms both T1 and T5. Additionally, using type-aware feature representation is more effective than the bag of words model. According to [78], the use of GNN-based methods can achieve perfect performance.

In summary, video manipulation detection, manipulation tool identification, and social network attribution based on video containers all achieve F1 and ACC scores above 0.99, while the performance of source camera identification still requires improvement. In addition, social media platforms re-encapsulate video containers when processing uploaded videos, making it challenging to extract effective features from the video container to verify the authenticity of the video. Regarding symbolic representation methods, we can observe that T1 and T5 exhibit relatively poor performance, while T2, T3, and T4 demonstrate better detection performance. For symbol selection, it filters out redundant features, thereby constructing a more compact feature vector. The two feature representation methods currently used are type-aware and bag of words models. From the results in the table, it is evident that the type-aware method outperforms the bag of words model. Additionally, for classifiers, decision trees prove to be a good choice, as they not only ensure reliable forensic performance but also provide interpretable results through their inherent visualization capability. It is also observed that GNN achieved the best performance in forgery detection tasks, achieving perfect accuracy. However, in other forensic tasks, the performance of GNN is comparable to that of other classifiers. Finally, integrating information from different modalities through fusion can effectively improve performance.
In addition, the use of video container scheme has efficient execution efficiency. As shown in Table 17, Güera et al. [69] achieved a B-ACC of 0.670, with a training time of 347 s and a testing time of less than 1 second. Compared to [69], Iuliani et al. [70] demonstrated a noticeable improvement in accuracy, although their testing time was slightly longer. Meanwhile, Yang et al. [72] achieved the best performance in terms of accuracy, with 0.980, while also having a shorter training time and high testing efficiency.

In this paper, we provide a comprehensive review of file containers-based image and video forensics, covering both qualitative and quantitative analyses. The qualitative analysis offers a solid foundation for the quantitative analysis, thus facilitating the realization of automated decisions. Quantitative analysis in image forensics is divided into four aspects: equivalence classes, feature extraction, feature classification, and feature fusion. When constructing an effective equivalence class, combining EXIF data, thumbnails, and entry count can yield excellent results in camera model identification. The feature extraction step is important, as it utilizes different extraction methods for various tasks. In feature classification, traditional methods such as Extremely Randomized Forests achieve good performance while providing interpretable decision-making insights. On the other hand, deep learning approaches like Transformers accelerate convergence and enhance model training efficiency through the parallel multi-head attention mechanism. The feature fusion step should combine EXIF data with image-related information to further enhance performance. However, image file container are susceptible to attacks and easily tampered with, which limits the performance achievable using this method. Although file containers-based image forensics methods are vulnerable to attacks, they have garnered widespread attention from researchers in recent years, primarily because they offer a new forensic perspective through the use of self-supervised learning.
For video forensics, quantitative analysis consists of six components: video container parsing, symbolic representation, symbol selection, feature representation, feature classification, and feature fusion. Video container parsing plays a crucial role in forensic tasks. Current methods rely on publicly available parsing tools, but incomplete information from these tools can affect performance. Therefore, a more comprehensive tool is needed to extract complete information, thus improving the reliability of forensic tasks. Symbolic representation must retain the structural information of the container, requiring the selection of a method that is robust to insertion and deletion operations. Symbol selection techniques effectively reduce feature redundancy, lowering computational complexity. Currently, decision trees are the most commonly used classifiers because they balance interpretability and detection performance. Future research should focus on integrating container information, encoding parameters, and additional video-related clues through feature fusion.
Acknowledgement: Pengpeng Yang would like to acknowledge the China Scholarship Council, State Scholarship Fund, that supports his postdoctoral fellowship program.
Funding Statement: This work was supported in part by Natural Science Foundation of Hubei Province of China under Grant 2023AFB016, the 2022 Opening Fund for Hubei Key Laboratory of Intelligent Vision Based Monitoring for Hydroelectric Engineering under Grant 2022SDSJ02, and the Construction Fund for Hubei Key Laboratory of Intelligent Vision Based Monitoring for Hydroelectric Engineering under Grant 2019ZYYD007.
Author Contributions: The authors confirm contribution to the paper as follows: study conception and design: Pengpeng Yang; draft manuscript preparation: Pengpeng Yang, Chen Zhou, Lanxi Liu; funding acquisition and supervision: Pengpeng Yang; review: Pengpeng Yang, Dasara Shullani, Daniele Baracchi. All authors reviewed the results and approved the final version of the manuscript.
Availability of Data and Materials: The article reviews existing studies only, which are available online on different online on different platforms.
Ethics Approval: Not applicable.
Conflicts of Interest: The authors declare no conflicts of interest to report regarding the present study.
References
1. Reinsel D, Gantz J, Rydning J. The digitization of the world: from edge to core. IDC White Paper; 2018. [cited 2025 Aug 12]. Available from: https://www.seagate.com/files/www-content/our-story/trends/files/idc-seagate-dataage-whitepaper.pdf. [Google Scholar]
2. Systems C. Cisco Annual Internet Report (2018–2023); 2023. [cited 2023 Oct 1]. Available from: https://www.cisco.com/c/en/us/solutions/executive-perspectives/annual-internet-report/index.html. [Google Scholar]
3. Department SR. Number of Social Media Users Worldwide from 2017 to 2027; 2023. [cited 2023 Oct 1]. Available from: https://www.statista.com/statistics/278414/number-of-worldwide-social-network-users/. [Google Scholar]
4. Corp P. Video Marketing in 2024: trends and Statistics You Can’t Afford to Ignore; 2024. [cited 2025 Aug 12]. Available from: https://personifycorp.com/blog/video-marketing-in-2024-trends-and-statistics-you-cant-afford-to-ignore/. [Google Scholar]
5. DataReportal. Digital Around the World—DataReportal–Global Digital Insights; 2025. [cited 2025 Aug 12]. Available from: https://datareportal.com/global-digital-overview. [Google Scholar]
6. Bao Y, Lu T, Du Y. Overview of deepfake video detection technology. Comput Sci. 2020;47(9):289–98. [Google Scholar]
7. Zhou WB, Zhang WM, Yu NH, Zhao HQ, Liu HG, Wei TY. An overviw of Deepfake forgery and defense techniques. J Signal Process. 2021;37(12):2338–55. [Google Scholar]
8. Wang R, Chu B, Yang Z, Zhou L. An overview of visual DeepFake detection techniques. J Image Graph. 2022;27(1):0043–62. [Google Scholar]
9. Seow JW, Lim MK, Phan RC, Liu JK. A comprehensive overview of Deepfake: generation, detection, datasets, and opportunities. Neurocomputing. 2022;513(1):351–71. doi:10.1016/j.neucom.2022.09.135. [Google Scholar] [CrossRef]
10. Abbas F, Taeihagh A. Unmasking deepfakes: a systematic review of deepfake detection and generation techniques using artificial intelligence. Expert Syst Appl. 2024;252(1):124260. doi:10.1016/j.eswa.2024.124260. [Google Scholar] [CrossRef]
11. Wang T, Liao X, Chow KP, Lin X, Wang Y. Deepfake detection: a comprehensive survey from the reliability perspective. ACM Comput Surv. 2024;57(3):1–35. doi:10.1145/3699710. [Google Scholar] [CrossRef]
12. Amerini I, Barni M, Battiato S, Bestagini P, Boato G, Bruni V, et al. Deepfake media forensics: status and future challenges. J Imaging. 2025;11(3):73. doi:10.3390/jimaging11030073. [Google Scholar] [PubMed] [CrossRef]
13. Castillo Camacho I, Wang K. A comprehensive review of deep-learning-based methods for image forensics. J Imaging. 2021;7(4):69. doi:10.3390/jimaging7040069. [Google Scholar] [PubMed] [CrossRef]
14. Casino F, Dasaklis TK, Spathoulas GP, Anagnostopoulos M, Ghosal A, Borocz I, et al. Research trends, challenges, and emerging topics in digital forensics: a review of reviews. IEEE Access. 2022;10(4):25464–93. doi:10.1109/ACCESS.2022.3154059. [Google Scholar] [CrossRef]
15. Li X, Yu N, Zhang X, Zhang W, Li B, Lu W, et al. Overview of digital media forensics technology. J Image Graph. 2021;26(6):1216–26. doi:10.11834/jig.210081. [Google Scholar] [CrossRef]
16. Zhou LN, Yang Z, Chu BL, Wang RY, Mao YZ, Chen XH. Overview of multimedia cognition security. J Signal Process. 2021;37:2440–56. [Google Scholar]
17. Gupta S, Mohan N, Kaushal P. Passive image forensics using universal techniques: a review. Artif Intell Rev. 2022;55(3):1629–79. doi:10.1007/s10462-021-10046-8. [Google Scholar] [CrossRef]
18. Nabi ST, Kumar M, Singh P, Aggarwal N, Kumar K. A comprehensive survey of image and video forgery techniques: variants, challenges, and future directions. Multime Syst. 2022;28(3):939–92. doi:10.1007/s00530-021-00873-8. [Google Scholar] [CrossRef]
19. Bhagtani K, Yadav AKS, Bartusiak ER, Xiang Z, Shao R, Baireddy S, et al. An overview of recent work in multimedia forensics. In: 2022 IEEE 5th International Conference on Multimedia Information Processing and Retrieval (MIPR); 2022 Aug 2–4; Virtual. p. 324–9. doi:10.1109/MIPR54900.2022.00064. [Google Scholar] [CrossRef]
20. Kaur G, Singh N, Kumar M. Image forgery techniques: a review. Artif Intell Rev. 2023;56(2):1577–625. doi:10.1007/s10462-022-10211-7. [Google Scholar] [CrossRef]
21. Ngharamike E, Ang LM, Seng KP, Wang M. ENF based digital multimedia forensics: survey, application, challenges and future work. IEEE Access. 2023;11:101241–72. doi:10.1109/ACCESS.2023.3312181. [Google Scholar] [CrossRef]
22. Nayerifard T, Amintoosi H, Bafghi AG, Dehghantanha A. Machine learning in digital forensics: a systematic literature review. arXiv:2306.04965. 2023. doi:10.48550/arxiv.2306.04965. [Google Scholar] [CrossRef]
23. Verdoliva L. Media forensics and deepfakes: an overview. IEEE J Select Topics Signal Process. 2020;14(5):910–32. doi:10.1109/JSTSP.2020.3002101. [Google Scholar] [CrossRef]
24. Piva A. An overview on image forensics. Int Sch Res Notices. 2013;2013(1):496701. doi:10.1155/2013/496701. [Google Scholar] [CrossRef]
25. Yang P, Baracchi D, Ni R, Zhao Y, Argenti F, Piva A. A survey of deep learning-based source image forensics. J Imaging. 2020;6(3):9. doi:10.3390/jimaging6030009. [Google Scholar] [PubMed] [CrossRef]
26. Bernacki J, Scherer R. Algorithms and methods for individual source camera identification: a survey. Sensors. 2025;25(10):3027. doi:10.3390/s25103027. [Google Scholar] [PubMed] [CrossRef]
27. Pasquini C, Amerini I, Boato G. Media forensics on social media platforms: a survey. EURASIP J Inf Secur. 2021;2021(1):4. doi:10.1186/s13635-021-00117-2. [Google Scholar] [CrossRef]
28. Akbari Y, Al-Máadeed S, Elharrouss O, Khelifi F, Lawgaly A, Bouridane A. Digital forensic analysis for source video identification: a survey. Foren Sci Int Dig Investigat. 2022;41:301390. doi:10.1016/j.fsidi.2022.301390. [Google Scholar] [CrossRef]
29. ITU-T T. Digital Compression and Coding of Continuous-tone Still Images-Part 1: requirements and guidelines. Recommendation; 1993. [cited 2025 Aug 12]. Available from: https://www.itu.int/rec/T-REC-T.81/en. [Google Scholar]
30. Wallace GK. The JPEG still picture compression standard. Communicat ACM. 1991;34(4):30–44. doi:10.1145/103085.103089. [Google Scholar] [CrossRef]
31. JEITA CP-3451. Exchangeable image file format for digital still cameras: Exif Version 2.2. Tokyo, Japan: Standard of Japan Electronics and Information Technology Industries Assocaition; 2002. [Google Scholar]
32. Commission IE et al. Information technology: digital compression and coding of continuous-tone still images 2009. [cited 2025 Aug 12]. Available from: http://www.dspace.cam.ac.uk/handle/1810/219520. [Google Scholar]
33. Fernandez JJ, Pandian N. Jpeg metadata: a complete study. In: 2018 International Conference on Recent Trends in Advance Computing (ICRTAC);2018 Sep 10–11; Chennai, India. IEEE; 2018. p. 34–40. doi:10.1109/ICRTAC.2018.8679322. [Google Scholar] [CrossRef]
34. Alvarez P. Using extended file information (EXIF) file headers in digital evidence analysis. Intl J Dig Evid. 2004;2(3):1–5. [Google Scholar]
35. Gangwar D, Pathania A. Authentication of digital image using exif metadata and decoding properties. Int J Scient Res Comput Sci Eng Inform Technol (IJSR CSEIT). 2018;3(8):335–41. doi:10.32628/CSEIT183815. [Google Scholar] [CrossRef]
36. Gloe T. Forensic analysis of ordered data structures on the example of JPEG files. In: 2012 IEEE international workshop on information forensics and security (WIFS); 2012 Dec 2–5; Costa Adeje, Spain. IEEE; 2012. p. 139–44. doi:10.1109/wifs.2012.6412639. [Google Scholar] [CrossRef]
37. Kornblum JD. Using JPEG quantization tables to identify imagery processed by software. Digit Invest. 2008;5(2):S21–5. doi:10.1016/j.diin.2008.05.004. [Google Scholar] [CrossRef]
38. Farid H. Digital Image Ballistics from JPEG Quantization; 2006. [cited 2025 Aug 12]. Available from: https://api.semanticscholar.org/CorpusID:116752184. [Google Scholar]
39. Farid H. Digital image ballistics from JPEG quantization: a followup study; 2008. [cited 2025 Aug 12]. Available from: https://digitalcommons.dartmouth.edu/cgi/viewcontent.cgi?article=1322&context=cs_tr. [Google Scholar]
40. Kee E, Farid H. Digital image authentication from thumbnails. In: Media forensics and security II. Vol. 7541. San Jose, CA, USA: SPIE; 2010. p. 139–48. doi:10.1117/12.838834. [Google Scholar] [CrossRef]
41. Kee E, Johnson MK, Farid H. Digital image authentication from JPEG headers. IEEE Transact Inform Foren Secur. 2011;6(3):1066–75. doi:10.1109/TIFS.2011.2128309. [Google Scholar] [CrossRef]
42. Mullan P, Riess C, Freiling F. Forensic source identification using JPEG image headers: the case of smartphones. Digit Invest. 2019;28(1):S68–76. doi:10.1016/j.diin.2019.01.016. [Google Scholar] [CrossRef]
43. Mullan P, Riess C, Freiling F. Towards open-set forensic source grouping on JPEG header information. Foren Sci Int Digital Investigat. 2020;32:300916. doi:10.1016/j.fsidi.2020.300916. [Google Scholar] [CrossRef]
44. Giudice O, Paratore A, Moltisanti M, Battiato S. A classification engine for image ballistics of social data. In: Image Analysis and Processing-ICIAP 2017: 19th International Conference; 2017 Sep 11–15; Catania, Italy. p. 625–36. doi:10.1007/978-3-319-68548-9_57. [Google Scholar] [CrossRef]
45. Phan QT, Pasquini C, Boato G, De Natale FG. Identifying image provenance: an analysis of mobile instant messaging apps. In: 2018 IEEE 20th International Workshop on Multimedia Signal Processing (MMSP); 2018 Aug 29–31; Vancouver, BC, Canada. IEEE; 2018. p. 1–6. doi:10.1109/MMSP.2018.8547050. [Google Scholar] [CrossRef]
46. Phan QT, Boato G, Caldelli R, Amerini I. Tracking multiple image sharing on social networks. In: ICASSP 2019-2019 IEEE International Conference on Acoustics, Speech and Signal Processing (ICASSP); 2019 May 12–17; Brighton, UK. IEEE; 2019. p. 8266–70. doi:10.1109/ICASSP.2019.8683144. [Google Scholar] [CrossRef]
47. Verde S, Pasquini C, Lago F, Goller A, De Natale F, Piva A, et al. Multi-clue reconstruction of sharing chains for social media images. IEEE Transact Multim. 2023;25(1):9491–505. doi:10.1109/TMM.2023.3253389. [Google Scholar] [CrossRef]
48. You J, Li Y, Liang R, Tan Y, Zhou J, Li X. Image sharing chain detection via sequence-to-sequence model. In: ICASSP 2023-2023 IEEE International Conference on Acoustics, Speech and Signal Processing (ICASSP); 2023 Jun 4–10; Rhodes Island, Greece. IEEE; 2023. p. 1–5. doi:10.1109/ICASSP49357.2023.10095000. [Google Scholar] [CrossRef]
49. Bedi P, Mittal A, Gangwar M, Dua A. Identifying forged images using image metadata. In: Proceedings of ICETIT 2019: Emerging Trends in Information Technology. Cham: Springer; 2020. p. 1071–81. doi:10.1007/978-3-030-30577-2_94. [Google Scholar] [CrossRef]
50. Zheng C, Shrivastava A, Owens A. Exif as language: learning cross-modal associations between images and camera metadata. In: Proceedings of the IEEE/CVF Conference on Computer Vision and Pattern Recognition; 2023 Jun 17–24; Vancouver, BC, Canada. p. 6945–56. doi:10.48550/arXiv.2301.04647. [Google Scholar] [CrossRef]
51. Appel Mahmud Pranto M, Asad NA, Yousuf MA, Uddin MN, Moni MA. Enhancing image forensics with transformer: a multi-head attention approach for robust metadata analysis. In: International Conference on Trends in Electronics and Health Informatics. Singapore: Springer; 2023. p. 655–69. doi:10.1007/978-981-97-3937-0_45. [Google Scholar] [CrossRef]
52. Umair M, Bouguettaya A, Lakhdari A, Ouzzani M, Liu Y. Exif2Vec: a framework to ascertain untrustworthy crowdsourced images using metadata. ACM Transact Web. 2024;18(3):1–27. doi:10.1145/3645094. [Google Scholar] [CrossRef]
53. Breiman L. Random forests. Mach Learn. 2001;45:5–32. [Google Scholar]
54. Geurts P, Ernst D, Wehenkel L. Extremely randomized trees. Mach Learn. 2006;63(1):3–42. doi:10.1007/s10994-006-6226-1. [Google Scholar] [CrossRef]
55. Quinlan JR. Induction of decision trees. Mach Learn. 1986;1(1):81–106. doi:10.1007/BF00116251. [Google Scholar] [CrossRef]
56. Huh M, Liu A, Owens A, Efros AA. Fighting fake news: image splice detection via learned self-consistency. In: Proceedings of the European Conference on Computer Vision (ECCV). Cham, Switzerland: Springer; 2018. p. 101–17. doi:10.48550/arXiv.1805.04096. [Google Scholar] [CrossRef]
57. Vadrevu A, Rajeshwari R, Pabbathi L, Sirimalla S, Vodnala D. Image forgery detection using metadata analysis and ELA processor. In: Innovations in Computer Science and Engineering: Proceedings of the Ninth ICICSE, 2021. Singapore: Springer; 2022. p. 579–86. doi:10.1007/978-981-16-8987-1_62. [Google Scholar] [CrossRef]
58. Fan J, Kot AC, Cao H, Sattar F. Modeling the EXIF-image correlation for image manipulation detection. In: 2011 18th IEEE International Conference on Image Processing; 2011 Sep 11–14; Brussels, Belgium. p. 1945–8. doi:10.1109/ICIP.2011.6115853. [Google Scholar] [CrossRef]
59. Fan J, Cao H, Kot AC. Estimating EXIF parameters based on noise features for image manipulation detection. IEEE Transact Informa Foren Secur. 2013;8(4):608–18. doi:10.1109/TIFS.2013.2249064. [Google Scholar] [CrossRef]
60. Sun X, Li Y, Niu S, Huang Y. The detecting system of image forgeries with noise features and EXIF information. J Syst Sci Complex. 2015;28(5):1164–76. doi:10.1007/s11424-015-4023-2. [Google Scholar] [CrossRef]
61. Microsoft. AVI RIFF File Reference; 2024. EB/OL. [cited 2025 Aug 12]. Available from: https://learn.microsoft.com/en-us/windows/win32/directshow/avi-riff-file-reference. [Google Scholar]
62. ISO. ISO/IEC 14496-12: 2020-Information technology—Coding of audio-visual objects—Part 12: ISO base media file format; 2024. EB/OL. [cited 2025 Aug 12]. Available from: https://www.iso.org/standard/74428.html. [Google Scholar]
63. Apple. QuickTime File Format Specification; 2024. EB/OL. [cited 2025 Aug 12]. Available from: https://developer.apple.com/documentation/quicktime-file-format. [Google Scholar]
64. ISO. ISO/IEC 14496-14: 2020-Information technology—Coding of audio-visual objects—Part 14: MP4 file format; 2024. EB/OL. [cited 2025 Aug 12]. Available from: https://www.iso.org/standard/79110.html. [Google Scholar]
65. ISO. International Organization for Standardization, 3GP file format; 2024. EB/OL. [cited 2025 Aug 12]. Available from: https://www.iso.org/standard/83102.html. [Google Scholar]
66. Gloe T, Fischer A, Kirchner M. Forensic analysis of video file formats. Digit Invest. 2014;11:S68–76. doi:10.1016/j.diin.2014.03.009. [Google Scholar] [CrossRef]
67. Song J, Lee K, Lee WY, Lee H. Integrity verification of the ordered data structures in manipulated video content. Dig Investigat. 2016;18(3):1–7. doi:10.1016/j.diin.2016.06.001. [Google Scholar] [CrossRef]
68. Rudnikovich AS, Rylov KA. Methods for graphic visualization of video file structure and determining the origin in forensics. In: 2019 International Multi-Conference on Engineering, Computer and Information Sciences (SIBIRCON); 2019 Oct 21–27; Novosibirsk, Russia. IEEE. p. 436–41. doi:10.1109/SIBIRCON48586.2019.8958228. [Google Scholar] [CrossRef]
69. Güera D, Baireddy S, Bestagini P, Tubaro S, Delp EJ. We need no pixels: video manipulation detection using stream descriptors. arXiv:1906.08743. 2019. doi:10.48550/arxiv.1906.08743. [Google Scholar] [CrossRef]
70. Iuliani M, Shullani D, Fontani M, Meucci S, Piva A. A video forensic framework for the unsupervised analysis of MP4-like file container. IEEE Transact Inform Foren Secur. 2018;14(3):635–45. doi:10.1109/TIFS.2018.2859760. [Google Scholar] [CrossRef]
71. Huamán CQ, Orozco ALS, Villalba LJG. Authentication and integrity of smartphone videos through multimedia container structure analysis. Future Generat Comput Syst. 2020;108(4):15–33. doi:10.1016/j.future.2020.02.044. [Google Scholar] [CrossRef]
72. Yang P, Baracchi D, Iuliani M, Shullani D, Ni R, Zhao Y, et al. Efficient video integrity analysis through container characterization. IEEE J Select Top Signal Process. 2020;14(5):947–54. doi:10.1109/JSTSP.2020.3008088. [Google Scholar] [CrossRef]
73. Gelbing E, Würsching L, Zmudzinski S, Steinebach M. Video source identification from mp4 data based on field values in atom/box attributes. Elect Imag. 2021;33(4):1–7. doi:10.2352/ISSN.2470-1173.2021.4.MWSF-337. [Google Scholar] [CrossRef]
74. López RR, Luengo EA, Orozco ALS, Villalba LJG. Digital video source identification based on container’s structure analysis. IEEE Access. 2020;8:36363–75. doi:10.1109/ACCESS.2020.2971785. [Google Scholar] [CrossRef]
75. Xiang Z, Horváth J, Baireddy S, Bestagini P, Tubaro S, Delp EJ. Forensic analysis of video files using metadata. In: Proceedings of the IEEE/CVF Conference on Computer Vision and Pattern Recognition; 2021 Jun 19–25; Nashville, TN, USA. p. 1042–51. doi:10.48550/arXiv.2105.06361. [Google Scholar] [CrossRef]
76. Orozco ALS, Huamán CQ, Álvarez DP, Villalba LJG. A machine learning forensics technique to detect post-processing in digital videos. Fut Generat Comput Syst. 2020;111(3):199–212. doi:10.1016/j.future.2020.04.041. [Google Scholar] [CrossRef]
77. Altinisik E, Sencar HT, Tabaa D. Video source characterization using encoding and encapsulation characteristics. IEEE Transact Inform Foren Secur. 2022;17(9):3211–24. doi:10.1109/TIFS.2022.3204210. [Google Scholar] [CrossRef]
78. Xiang Z, Yadav AKS, Bestagini P, Tubaro S, Delp EJ. MTN: forensic analysis of MP4 video files using graph neural networks. In: Proceedings of the IEEE/CVF Conference on Computer Vision and Pattern Recognition; 2023 Jun 17–24; Vancouver, BC, Canada. p. 963–72. doi:10.1109/CVPRW59228.2023.00103. [Google Scholar] [CrossRef]
79. Du S, Yang P, Baracchi D, Jin J, Shullani D, Piva A. ForensiCam-215K: a large scale image and video dataset for forensic analysis. In: ICASSP 2025-2025 IEEE International Conference on Acoustics, Speech and Signal Processing (ICASSP); 2025 Apr 6–11; Hyderabad, India. IEEE. p. 1–5. doi:10.1109/ICASSP49660.2025.10890764. [Google Scholar] [CrossRef]
80. Shullani D, Fontani M, Iuliani M, Shaya OA, Piva A. Vision: a video and image dataset for source identification. EURASIP J Inf Secur. 2017;2017(1):15. doi:10.1186/s13635-017-0067-2. [Google Scholar] [CrossRef]
81. Dang-Nguyen DT, Pasquini C, Conotter V, Boato G. Raise: a raw images dataset for digital image forensics. In: Proceedings of the 6th ACM Multimedia Systems Conference. Portland, OR, USA: ACM; 2015. p. 219–24. doi:10.1145/2713168.2713194. [Google Scholar] [CrossRef]
82. Ng TT, Chang SF, Sun Q. A data set of authentic and spliced image blocks. In: ADVENT technical report. New York, NY, USA: Columbia University; 2004. [Google Scholar]
83. CalPhotos. A database of photos of plants, animals, habitats and other natural history subjects; 2000. [cited 2025 Aug 12]. Available from: https://calphotos.berkeley.edu/. [Google Scholar]
84. de Carvalho TJ, Riess C, Angelopoulou E, Pedrini H, de Rezende Rocha A. Exposing digital image forgeries by illumination color classification. IEEE Transact Inform Foren Secur. 2013;8(7):1182–94. doi:10.1109/TIFS.2013.2265677. [Google Scholar] [CrossRef]
85. Korus P, Huang J. Multi-scale analysis strategies in PRNU-based tampering localization. IEEE Transact Inform Foren Secur. 2016;12(4):809–24. doi:10.1109/TIFS.2016.2636089. [Google Scholar] [CrossRef]
86. Kaggle. Real versus Fake—Turkey Earthquake; 2023. [cited 2023 Aug 21]. Available from: https://www.kaggle.com/datasets/merveakdogan/real-vs-fake-turkey-earthquake?rv=1. [Google Scholar]
87. Kaggle. Mango Pests; 2023. [cited 2023 Aug 21]. Available from: https://www.kaggle.com/datasets/muhammadarslanajmal/mango-pests. [Google Scholar]
88. Kaggle. Sport celebrity image classification; 2023. [cited 2023 Aug 23]. Available from: https://www.kaggle.com/datasets/yaswanthgali/sport-celebrity-image-classification?rv=1. [Google Scholar]
89. Dong J, Wang W, Tan T. CASIA image tampering detection evaluation database. In: 2013 IEEE China Summit and International Conference on Signal and Information Processing; 2013 Jul 6–10; Beijing, China. p. 422–6. doi:10.1109/ChinaSIP.2013.6625374. [Google Scholar] [CrossRef]
90. Novozamsky A, Mahdian B, Saic S. IMD2020: a large-scale annotated dataset tailored for detecting manipulated images. In: Proceedings of the IEEE/CVF Winter Conference on Applications of Computer Vision Workshops; 2020 Mar 1–5; Snowmass Village, CO, USA. p. 71–80. [Google Scholar]
91. Jia S, Huang M, Zhou Z, Ju Y, Cai J, Lyu S. Autosplice: a text-prompt manipulated image dataset for media forensics. In: Proceedings of the IEEE/CVF Conference on Computer Vision and Pattern Recognition; 2023 Jun 17–24; Vancouver, BC, Canada. p. 893–903. [Google Scholar]
92. Boididou C, Papadopoulos S, Zampoglou M, Apostolidis L, Papadopoulou O, Kompatsiaris Y. Detection and visualization of misleading content on Twitter. Int J Multim Inform Retr. 2018;7(1):71–86. doi:10.1007/s13735-017-0143-x. [Google Scholar] [CrossRef]
93. Hosler BC, Zhao X, Mayer O, Chen C, Shackleford JA, Stamm MC. The video authentication and camera identification database: a new database for video forensics. IEEE Access. 2019;7:76937–48. doi:10.1109/ACCESS.2019.2922145. [Google Scholar] [CrossRef]
94. Galdi C, Hartung F, Dugelay JL. SOCRatES: a database of realistic data for source camera recognition on smartphones. In: Proceedings of the 8th International Conference on Pattern Recognition Applications and Methods; 2019 Feb 19–21; Prague, Czech Republic. SCITEPRESS-Science and Technology Publications; 2019. p. 648–55. doi:10.5220/0007403706480655. [Google Scholar] [CrossRef]
95. ITU. Advanced video coding for generic audiovisual services; 2024. EB/OL. [cited 2025 Aug 12]. Available from: https://www.itu.int/rec/T-REC-H.264/. [Google Scholar]
96. Online Mp4 Parser; 2024 [Online]. [cited 2024 Apr 11]. Available from: https://www.onlinemp4parser.com/. [Google Scholar]
97. A Java API to read, write and create MP4 files; 2024 [Online]. [cited 2024 Apr 11]. Available from: https://github.com/sannies/mp4parser. [Google Scholar]
98. ExifTool by Phil Harvey; 2024 [Online]. [cited 2024 Apr 11]. Available from: https://exiftool.org/. [Google Scholar]
99. ffprobe Documentation; 2024. EB/OL. [cited 2025 Aug 12]. Available from: https://www.ffmpeg.org/ffprobe.html. [Google Scholar]
100. Python AVI parser; 2024 [Online]. [cited 2024 Apr 11]. Available from: https://github.com/aurelpjetri/python_avi_parser. [Google Scholar]
101. Elcard StreamEye; 2024 [Online]. [cited 2024 Apr 11]. Available from: https://www.elcard.com/. [Google Scholar]
102. Gpac nightly builds—gpac; 2024 [Online]. [cited 2024 Apr 11]. Available from: https://gpac.wp.imt.fr/downloads/gpac-nightly-builds/. [Google Scholar]
103. GitHub-aizvorski/h264bitstream; 2024 [Online]. [cited 2024 Apr 11]. Available from: https://github.com/aizvorski/h264bitstream. [Google Scholar]
Cite This Article
 Copyright © 2025 The Author(s). Published by Tech Science Press.
This work is licensed under a Creative Commons Attribution 4.0 International License , which permits unrestricted use, distribution, and reproduction in any medium, provided the original work is properly cited.
 Downloads
 Citation Tools