
 Submit a Paper
 Propose a Special lssue
 Open Access
ARTICLE

Multi-Criteria Discovery of Communities in Social Networks Based on Services
1 Laboratory of Computer Systems, University of Sciences and Technology Houari Boumediene (USTHB), Algiers, 16009, Algeria
2 Laboratory of Advanced Electronic Systems (LSEA), University of Medea, Medea, 26000, Algeria
* Corresponding Author: Hamza Kheddar. Email:
Computers, Materials & Continua 2026, 86(3), 39 https://doi.org/10.32604/cmc.2025.071532
Received 06 August 2025; Accepted 17 October 2025; Issue published 12 January 2026
 View Full Text
 Download PDF
Abstract
Identifying the community structure of complex networks is crucial to extracting insights and understanding network properties. Although several community detection methods have been proposed, many are unsuitable for social networks due to significant limitations. Specifically, most approaches depend mainly on user–user structural links while overlooking service-centric, semantic, and multi-attribute drivers of community formation, and they also lack flexible filtering mechanisms for large-scale, service-oriented settings. Our proposed approach, called community discovery-based service (CDBS), leverages user profiles and their interactions with consulted web services. The method introduces a novel similarity measure, global similarity interaction profile (GSIP), which goes beyond typical similarity measures by unifying user and service profiles for all attributes types into a coherent representation, thereby clarifying its novelty and contribution. It applies multiple filtering criteria related to user attributes, accessed services, and interaction patterns. Experimental comparisons against Louvain, Hierarchical Agglomerative Clustering, Label Propagation and Infomap show that CDBS reveals the higher performance as it achieves 0.74 modularity, 0.13 conductance, 0.77 coverage, and significantly fast response time of 9.8 s, even with 10,000 users and 400 services. Moreover, community discovery-based service consistently detects a larger number of communities with distinct topics of interest, underscoring its capacity to generate detailed and efficient structures in complex networks. These results confirm both the efficiency and effectiveness of the proposed method. Beyond controlled evaluation, communities discovery based service is applicable to targeted recommendations, group-oriented marketing, access control, and service personalization, where communities are shaped not only by user links but also by service engagement.Keywords
Community discovery is a long standing challenge at the heart of complex network research, with successful applications spanning various scientific fields such as physics, biology, sociology, social sciences, mathematics, and computer science. Research efforts have been devoted to developing methods and algorithms that can effectively reveal this hidden structure of a network [1,2].
Over the last decade the literature has advanced along several complementary directions. Classical topology-based algorithms and modularity-maximization methods emphasize structural cohesion but ignore node attributes and semantics [1,3]. Spectral and embedding approaches incorporate attribute or typed-edge information via low-dimensional representations, improving detection when rich node features exist but often increasing computational cost and sensitivity to class imbalance [2,4]. Probabilistic and generative models tackle edge formation and attribute likelihoods in a principled way (e.g., reciprocity-aware models), yet they commonly assume binary or stationary networks and face scalability limits [5]. Hybrid content+structure methods that add textual or topical signals recover semantically coherent groups but tend to be computationally intensive and domain-sensitive [6,7]. Other research streams explore graph compression and coarsening for large networks [8], random-walk/evolutionary optimisers [9], and motif/hypergraph refinements and Ricci-flow approaches to capture higher-order structure [10,11]; each reduces specific failure modes but introduces trade-offs in cost, parameter sensitivity, or restricted applicability. Across these strands the recurring gaps are clear: many methods (i) rely mainly on user–user topology and thus miss cohorts formed by shared service usage [4,12] (for example, customers of the same product or students of the same course), (ii) do not natively handle heterogeneous, multi-valued and semantic attributes together, (iii) provide limited task-driven filtering or interpretability, and (iv) face a scalability vs. expressiveness trade-off that complicates deployment on service-rich platforms. These open problems motivate a service-aware, multi-criteria, and interpretable discovery framework. To address these shortcomings, CDBS explicitly constructs a user–service bipartite view and introduces the global similarity interaction profile (GSIP): a single, interpretable, multi-criteria similarity that fuses numeric, categorical, multi-valued, access-intensity, and semantic/textual signals. Unlike standard measures such as Jaccard or cosine, GSIP supports attribute weighting, tolerates missing values without heavy preprocessing, and provides per-attribute interpretability—enabling discovery of semantically coherent communities even when direct user–user ties are weak or absent.
To summarize, this paper introduces CDBS, a novel approach that detects communities from user interactions with web services. The main contributions of the proposed CDBS are as follows:
• The CDBS framework for service-aware community discovery that integrates user profiles, service profiles, and access interactions with flexible multi-criteria filtering.
• To the best of the authors’ knowledge, GSIP is introduced here for the first time as a novel similarity metric, which handles heterogeneous attribute types (including semantic text via linked open data (LOD)-based similarity measure approach), supports attribute weighting, and tolerates missing values without costly transformations.
• Efficient graph-construction and filtering procedures that preserve interpretability (communities tied to service domains) and improve scalability for large datasets.
• A comprehensive experimental evaluation and comparison with established baselines (Louvain, HAC), demonstrating improved discovery granularity, stronger modularity, and competitive runtime on large scenarios.
By bridging these dimensions, CDBS provides a more realistic framework for community discovery in modern social platforms, especially in online social networks.
The paper is structured into five sections: Section 2 presents some similar work to show the evolution of research in this area and the difference between these works. Section 3 details the architecture processes of the proposed approach for discovering communities CDBS. In Section 4, the idea is implemented on a platform to observe the actual results of this approach and compare it with robust algorithms in the field of community discovery. Finally, a conclusion and some perspectives close this paper in Section 5.
With the development of service computing, searching communities’ discovery in social networks according to users’ interaction is becoming a significant research topic. The work [13,14] provides a comprehensive review of community detection methods. Reference [13] presents a classification of community detection algorithms in social networks, evaluating their performance on real datasets, and highlighting future research paths. Moving on, the research in [14] focuses on quality metrics for community detection, discussing limitations in current metrics and the need for more robust ones, especially for handling small communities and scalability challenges in large networks.
In the context of community discovery, Akachar et al. in [6] propose a method for community discovery in social networks that integrates both content and structural information. It exploits user-generated texts to determine topics of interest using statistical and semantic metrics such as the Chir statistic and conditional mutual information. These topics are used to divide users into distinct groups, each representing a specific topic. Within each group, a static algorithm like Louvain is applied to detect tightly interconnected users. This hybrid approach enhances detection accuracy, but may struggle with vague or domain-specific terms and can be computationally intensive due to the need for semantic analysis and clustering of large amounts of text.
In the context of community detection, research on has explored diverse strategies to balance scalability, accuracy, and adaptability. Zhao et al. [8] introduced a graph compression approach that reduces network size by merging low-degree vertices, offering competitive performance on large-scale networks. However, its focus on undirected graphs and the loss of structural nuances limit its applicability to more complex scenarios. Moving on, Alfaqeeh and Skillicorn [4] advanced this concept by embedding typed graphs to unify multiple attribute modalities; while effective on large, rich datasets like Instagram, this method incurs high computational overhead and may underperform on smaller or imbalanced data.
Other studies shifted toward probabilistic and attribute-aware models. Contisciani et al. [5] developed a probabilistic generative model leveraging reciprocity, achieving strong edge prediction but remaining constrained to binary networks. Cai et al. [7] addressed structural and attribute integration through a novel similarity measure, termed an importance score, which reflects the density around each node. This approach improves detection accuracy but comes at the cost of computational scalability, particularly for large networks or noisy attributes.
Amin et al. [15] introduced a global-local model with Eigen-based influential node detection and label propagation, eliminating the need for predefined parameters. Although efficient in many scenarios, the randomness inherent to label propagation introduces instability and reduces accuracy for overlapping communities in large networks. Similarly, Dabaghi-Zarandi and KamaliPour [16] proposed a hybrid local-global approach for community merging, which improved modularity and density metrics but relied heavily on fixed thresholds, making it less flexible for networks with overlapping or ambiguous boundaries.
Recent approaches have also combined structural, interaction-based, and topological refinements to improve accuracy and robustness. Sayari et al. [17] introduced a robust community detection method combining user interaction degree, structural similarity, and frequent pattern mining. Experiments showed superior accuracy, robustness, and performance compared to five existing approaches. However, this method is sensitive to parameter settings, and assumes static networks. Later, the same authors proposed CDILPV [18], a robust community detection method that integrates user interactions and structural measures, introducing vertical pattern mining and a hybrid metric for direct and indirect membership calculation to generate denser and more resilient communities, outperforming existing approaches in accuracy and robustness. Nonetheless, CDILPV remains limited to static snapshots, underexplored across diverse domains, and dependent on high-quality interaction data. Dabaghi-Zarandi et al. [9] employed random walks and evolutionary optimization to refine partitions, achieving higher modularity and NMI scores. Although both methods [9,18] enhance detection performance, they remain computationally demanding and parameter-sensitive, with the former further constrained by its reliance on large-scale interaction data and the latter restricted to non-overlapping communities. Likewise, Karampour et al. [10] applied discrete Ricci flow with spatial–temporal features to capture geometric and fine-grained patterns, while Madhulika et al. [19] stabilized label propagation using motif-based hypergraph reweighting and similarity-driven propagation. These methods achieve high modularity, robustness, and stability but remain computationally intensive and less scalable, especially in large or sparse networks. Finally, Khawaja et al. [11] proposed a common-neighbor based refinement for overlapping community detection, improving flexibility and robustness in detecting subtle overlaps, though it is sensitive to threshold tuning and computationally costly due to repeated similarity calculations.
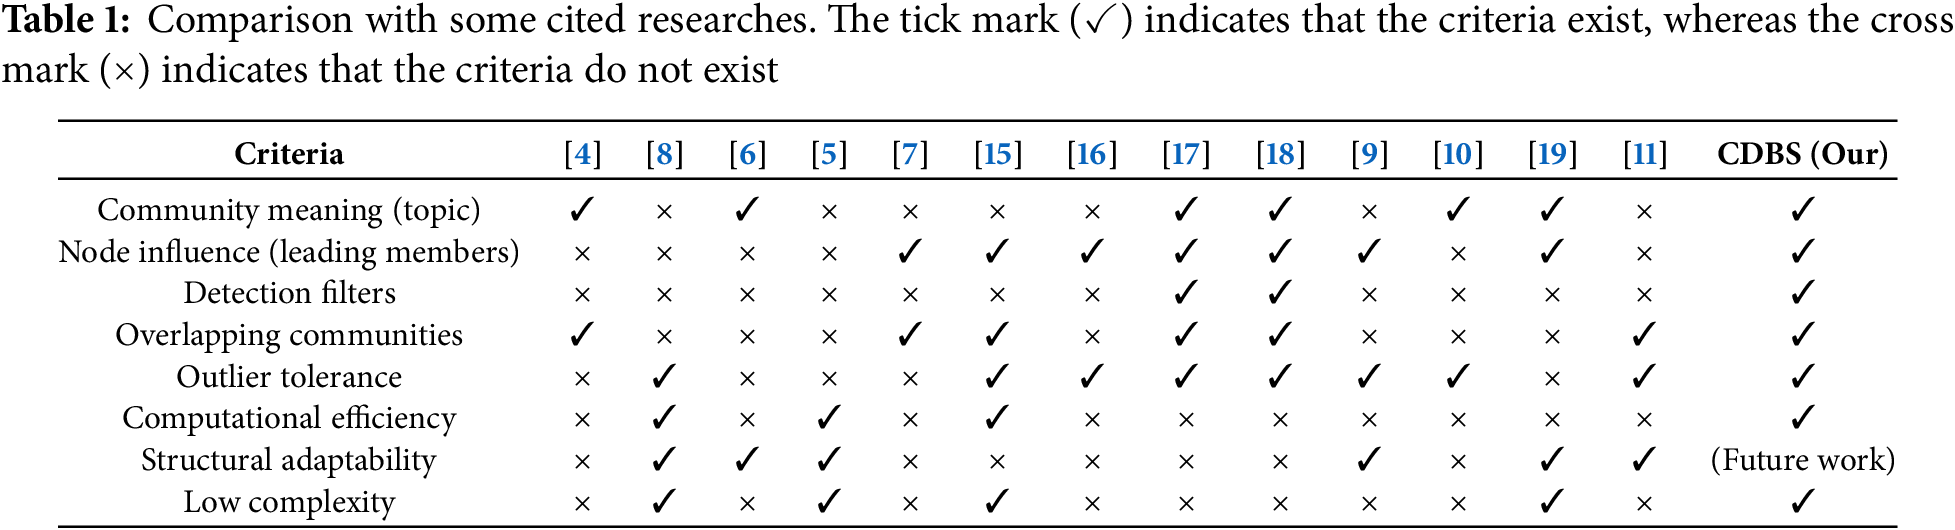
The discussed works previously explore various community detection methods, each exhibiting varying degrees of efficiency depending on specific application criteria, including: (1) Community meaning—the ability of the approach to uncover semantically meaningful themes or topics within detected communities; (2) Node influence—the capacity to recognize key or influential nodes that play central roles within their respective communities; (3) Detection filters—the use of filtering mechanisms that enhance the precision and selectivity of the detection process; (4) Overlapping communities—the capability to detect nodes that belong to multiple communities simultaneously, reflecting complex real-world relationships; (5) Outlier tolerance—the robustness of the method in handling noisy or anomalous data without degrading the overall detection quality; (6) Computational efficiency—how quickly a method can discover communities, which is particularly crucial in time-sensitive; (7) Structural adaptability—the effectiveness of the method across diverse network types, including social, biological, and information networks; (8) Low complexity—the scalability of the approach in terms of handling networks of varying sizes and densities with minimal computational resources.
Table 1 indicates that CDBS generally excels in most categories, especially in using filters, detecting overlapped communities, handling outliers, running efficiently, and maintaining low complexity, although it may require further development to support all network structures. This shows a well-rounded approach that balances performance, community structure detail, and computational efficiency.
Service providers offer many services published in the Universal, Description, Discovery, and Integration (UDDI) registration directory that are accessible to users. Users search for services in this directory that meet their requests. Once a service is selected, a link is established between the service and the user, meaning the user accesses this service. Our solution aims to discover communities based on user interactions with services. We also consider various criteria to filter this relationship. The interaction between services and users using a bipartite graph (also known as a two-mode graph) is that the first subset of vertices corresponds to user profiles, while the second subset represents service profiles. Each edge in the graph connects a service to a user if the user accesses the service.
The proposed strategy is divided into four primary stages, as illustrated in Fig. 1. The first step involves conducting a comprehensive study to define the characteristics of both user and service profiles. Consequently, a user profile is defined that consists of multiple attributes. Subsequently, we align each attribute within the user profile with a corresponding element in the web service profile. After creating the profiles, a novel similarity measure is proposed, known as GSIP, to identify web services similar to the users. This process establishes a connection between the user and the web service which is used to construct a web service discovery graph. In the third step, CDBS responds to queries by filtering the graph based on various criteria related to the user or service, such as age, localization, interests, language, gender, etc. Finally, the last step involves applying a new community detection algorithm to discover similar user groups, representing the communities according to predefined standards.
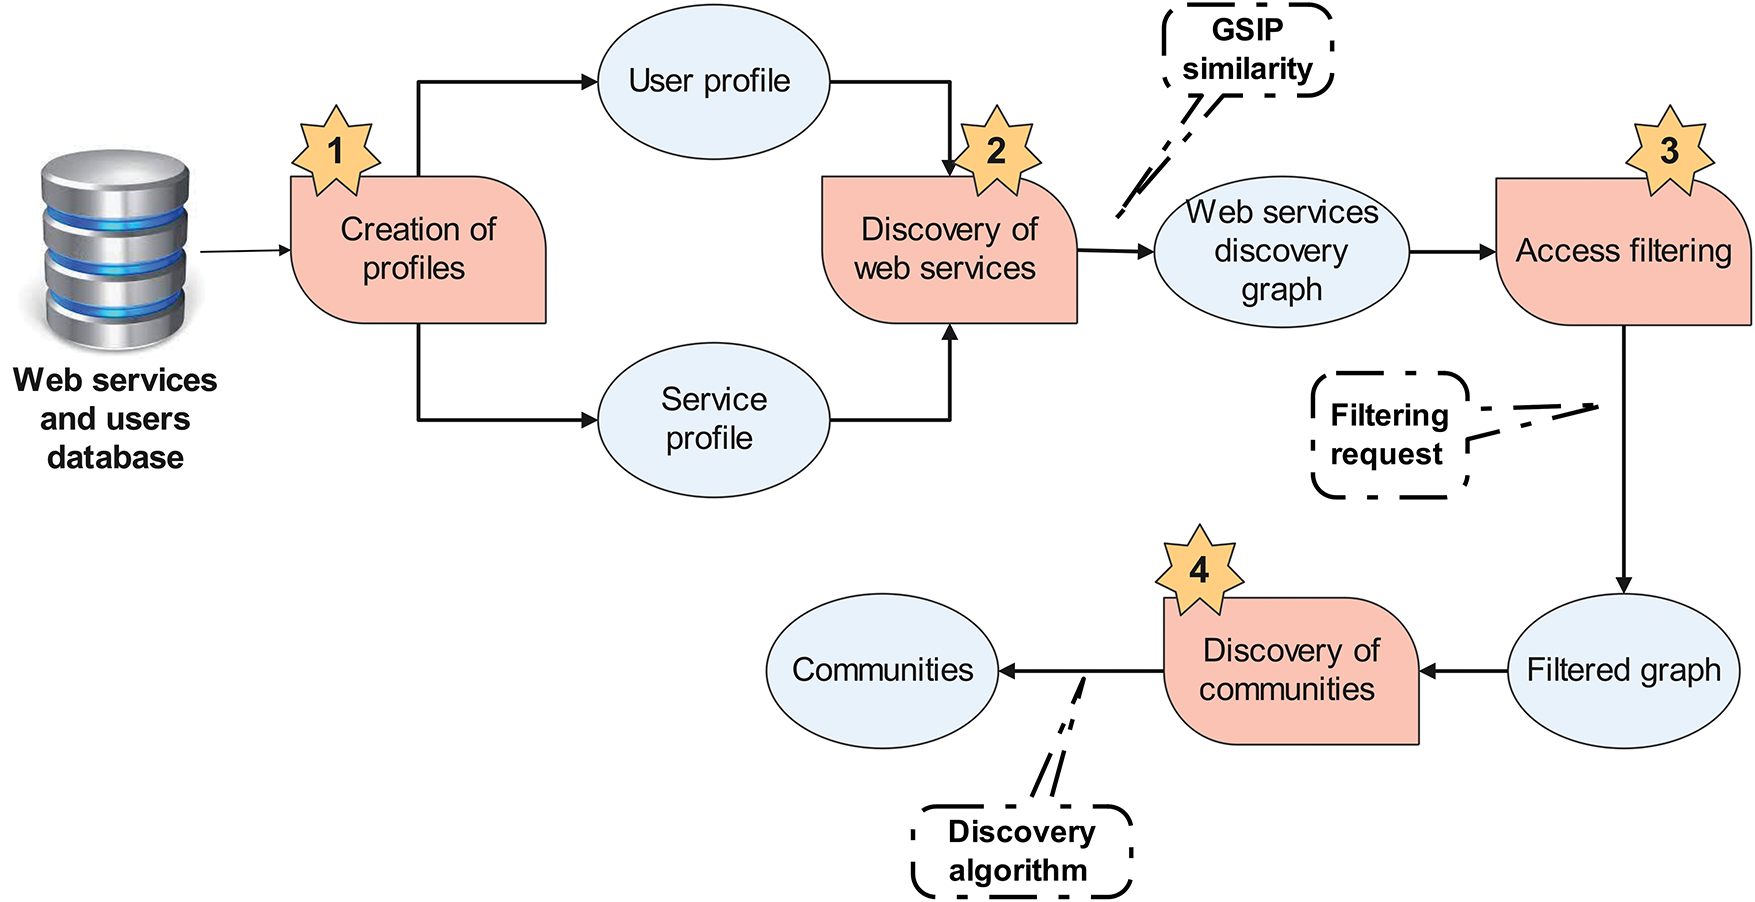
Figure 1: Proposed CDBS architecture
3.1 Creation of Profile for User or Service
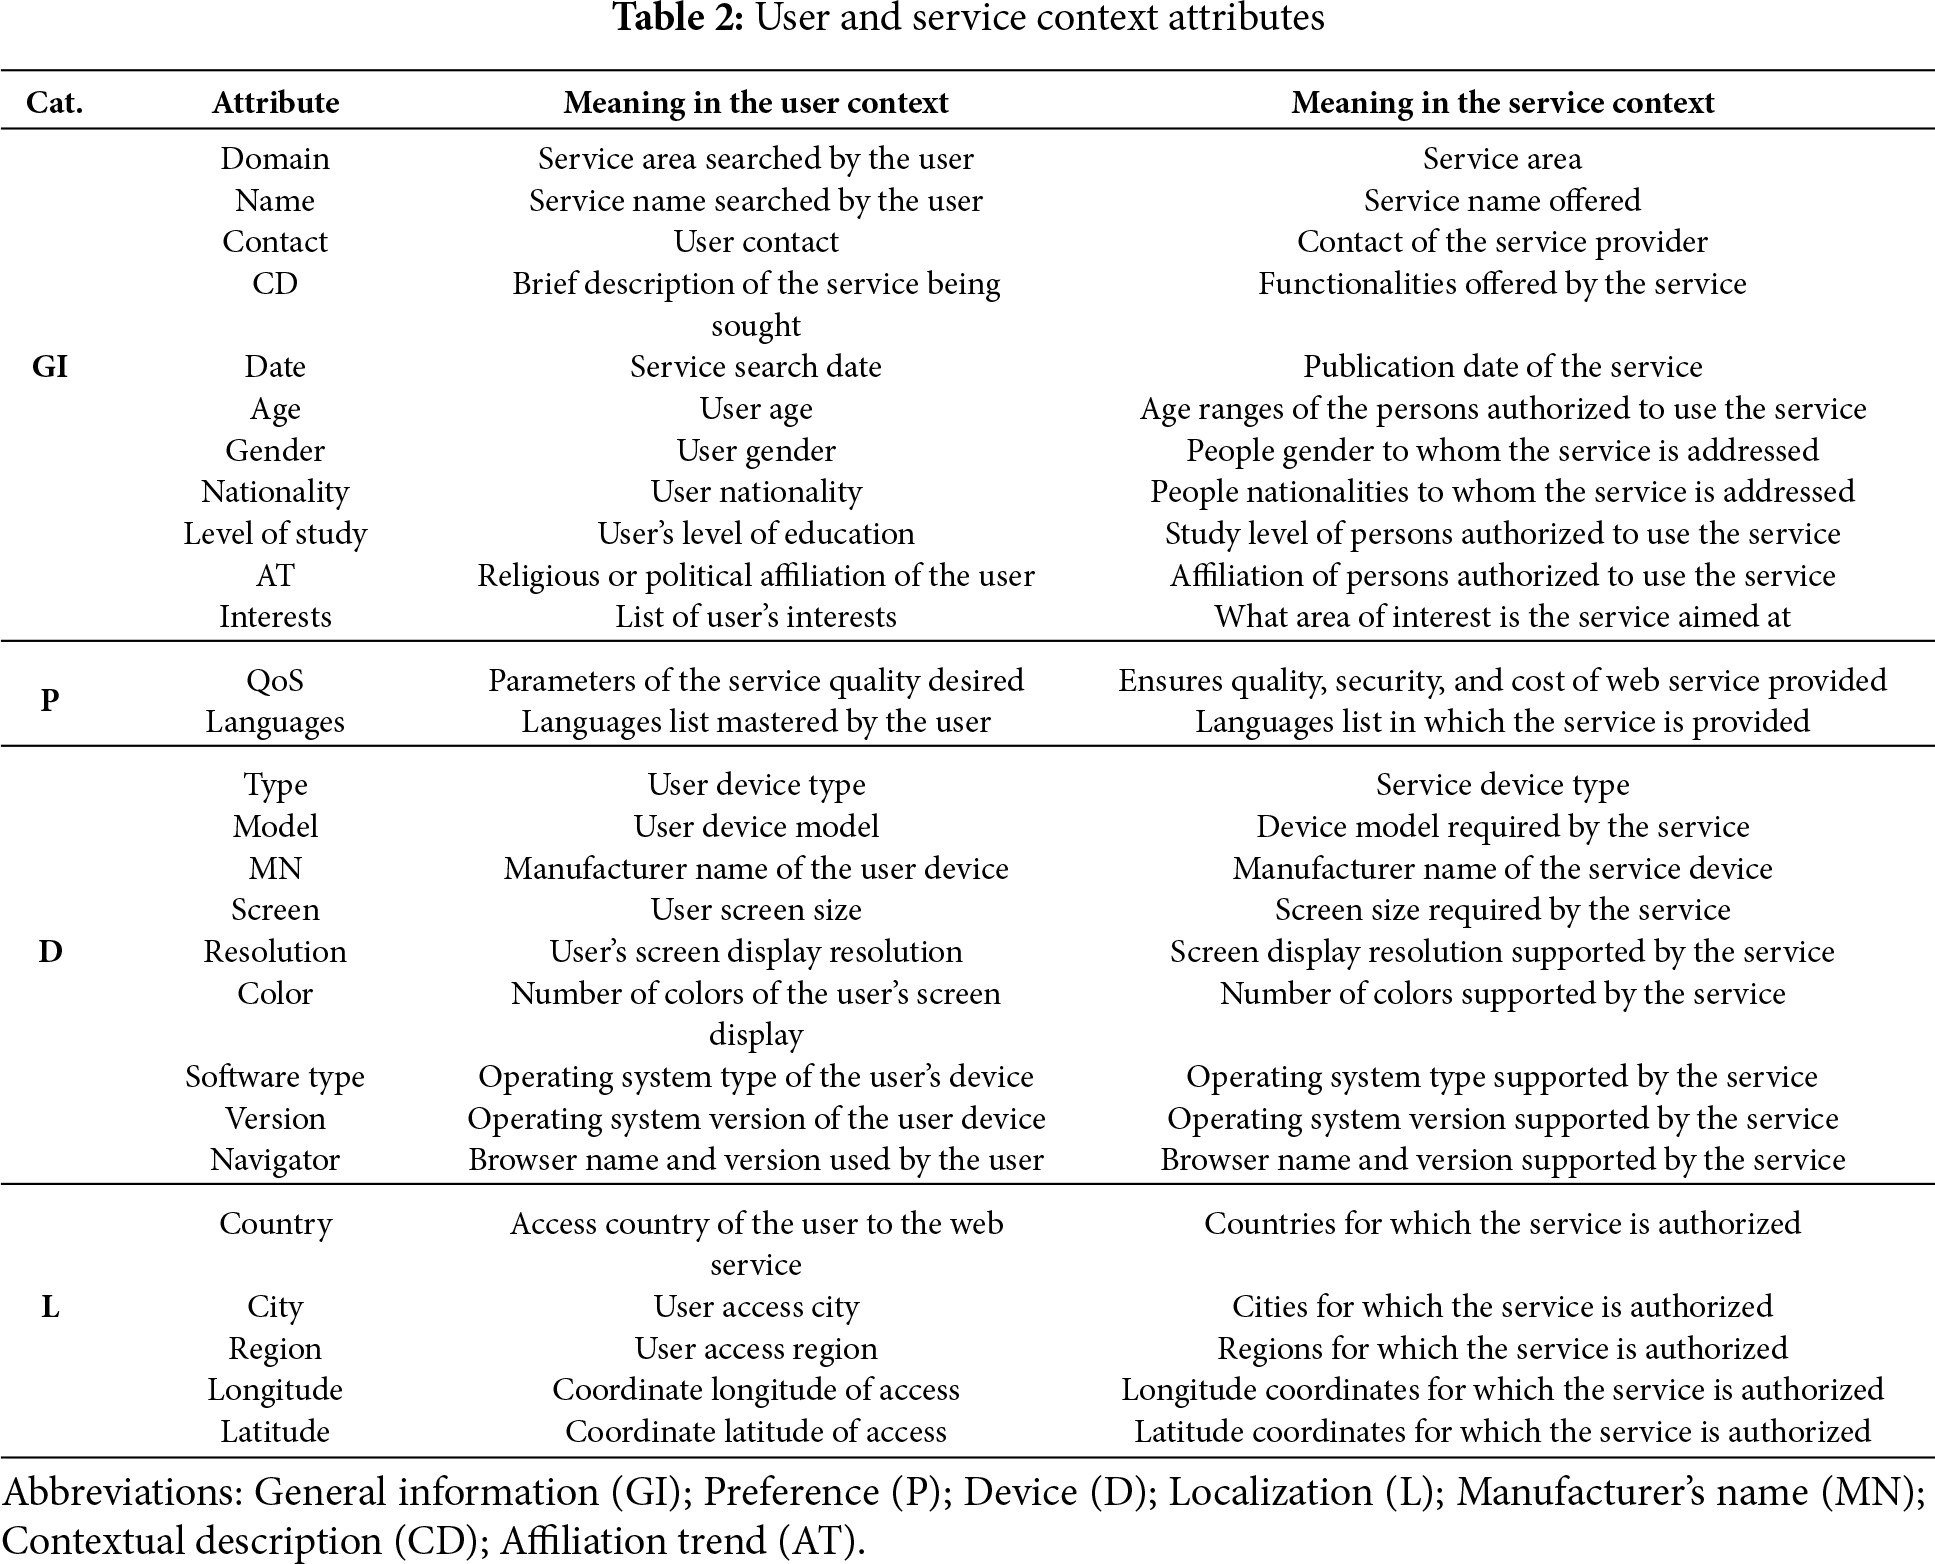
Each user on the web has a profile where his information is registered (name, first name, date of birth, location, preference, device used, etc.). All of this information forms its digital identity. The user profile is also defined by information found in computer systems and by his interests in one or more fields (e.g., culture, sports), which may vary depending on contextual information (e.g., time, location). In contrast, the service profile is defined by parameters such as service quality, service usage cost, and geographical restrictions covered by the service. To model user and service profiles, the user profile format defined in [20] is extended by adding several quantitative and qualitative characteristics. This extension establishes a common profile structure for both the user and the service. Furthermore, the unique identifier denoted by the identity, Table 2 exhibits all the profile elements clasified by their meaning in the user/service profile. To enable a meaningful comparison between user and service entities, we define a shared attribute schema that aligns semantically related fields across the two profiles. For example, a user’s age is matched to the authorized age range of the service, the declared languages correspond to the supported service languages, and the device model/operating system specified in the user profile is in line with the requirements of the service platform. Similarly, the geographical location of a user is matched against the service availability region, while interests and domain preferences are mapped to the service domain classification. Finally, the textual description provided by the user is evaluated against the semantic description of the service using ontology-based similarity. Through this aligned schema, user-service compatibility can be quantified consistently across multiple attribute types, as formally expressed in Eq. (1). The elements were divided into four primary categories based on the type of information provided.
After defining both the user and service profiles, the goal is to find the most appropriate web services for each user, i.e., to find the web services similar to each user’s profile. The discovery process, bipartite graph construction, will be based on a similarity measure that uses the interaction between users and web services. The similarity calculation between the two profiles supports all previously defined elements in Table 2. The challenge is that these attributes are of different types, as the similarity measure for numeric attributes is not applicable to string attributes. Most existing similarity measures do not address this type of problem [21]. To meet this constraint, we have created a new similarity measure called GSIP, adapted to all attributes type. GSIP assigns variable weights to each attribute based on its intervention in the similarity calculation, depending on the nature of the study.
GSIP similarity is calculated according to the following formula (Eq. (1)):
where, X and Y represent a user and a service, respectively.
The function ASim returns a real value in the interval
a) ASim for numerical attributes: The numerical attributes included in the ASim similarity calculation are mostly related to quantitative properties. Their values can be real values or numerical intervals. For real values, the ASim calculation is based on atomic similarity. Mathematically, it is defined as follows (Eq. (2)):
For numerical intervals, we consider the well-known allen temporal formalism called the Allen interval algebra [22]. This formalism includes thirteen fundamental relationships between these intervals, which are used to model the various qualitative situations between temporal entities.
Based on Allen algebra, ASim is defined mathematically as follows (Eq. (3)):
If
b) ASim for enumerated value attributes: An enumerated value field takes one value for the user from a defined collection of values for the service. Formula (5) calculates the ASim similarity for this attribute type:
c) ASim for multi-valued attributes: These attributes can have multiple values (list of values) for the same user instance from a collection of service values. The ASim similarity for this type of attribute is calculated using Formula (6) as follows:
d) ASim for string type attributes: Several formulas exist for calculating a similarity between two strings (such as two texts) (Levenshtein distance, Jaro-Winkler distance, Sorensen-Dice coefficient, N-gram distance, etc.). However, these distances do not consider the semantic and multi-language comparison between the two strings. Similarity based on LOD offers a robust solution for this issue because the data is already structured and easily retrievable through SPARQL access points. Many similar calculation formulas use LOD [23]. We explore and modify the LOD-based similarity measure (LODS) as detailed in [24] to compare descriptions in user and web service profiles. To achieve this, the descriptions must be formatted to consist of a set of keywords by eliminating spaces and irregular expressions. Each user/service description will be associated with a set of terms (keywords)
This similarity uses a classical measure of aggregation that enables two objects annotated with semantic concepts to be compared according to the following two steps:
1. Sums the scores obtained by applying the LODS measurement to each combination of the Cartesian product of the two sets being compared.
2. Then, it divides the sum by the number of combinations to get a final score normalized in the interval [0, 1].
3.2.2 Caracteristics and Evaluation of GSIP Similarity
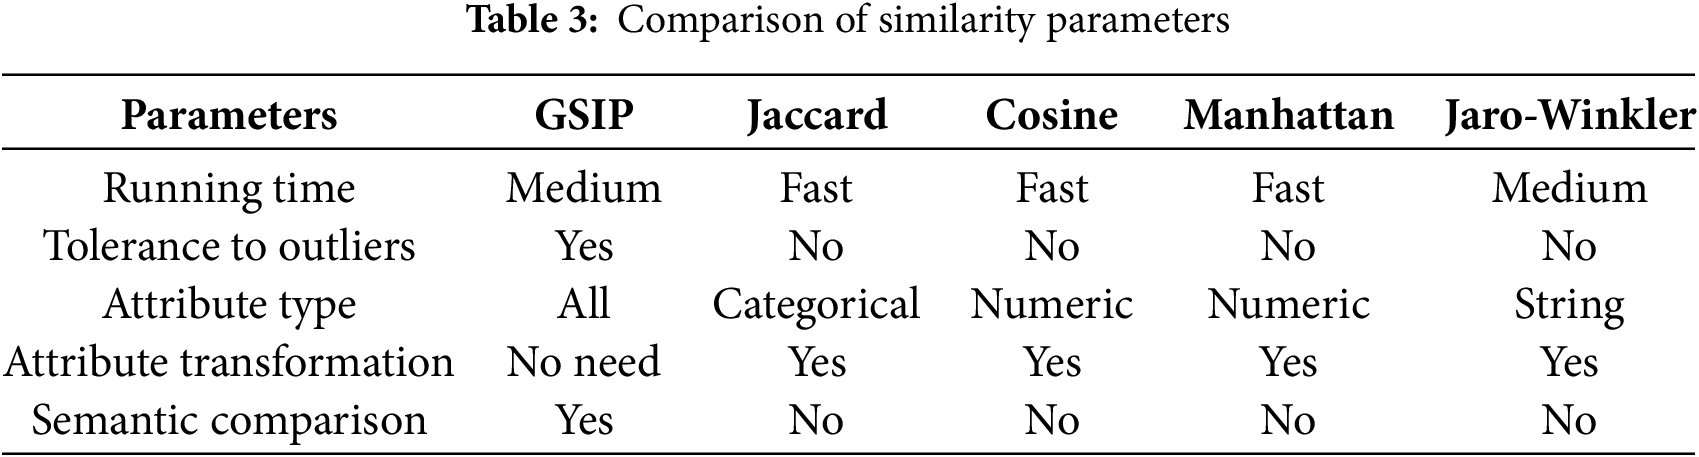
Our comparison is not to promote a single similarity measure that fits all situations but to clarify and illuminate the important differences between five similarity measures. The decision on which similarity measure to apply depends on the nature of the data used, the observations we want to make, and on each individual definition of similarity. The conceptual, theoretical, and experimental characteristics of the most popular measures are a fundamental evidence-base for making that decision. GSIP similarity is used to match user profiles with web services, mainly in social domain applications. This similarity supports all types of attributes, making it challenging to compare with other similarity measures that are specific to certain data types or require transformations of attribute types. Unlike GSIP, most existing similarities are methods for measuring the proximity between two vectors in a vector space, using only atomics values. This is a major value addition for our similarity. Additionally, the results of GSIP vary according to the attribute parameters chosen, such as the weight of each attribute based on its importance, which heavily influences the results obtained. This proves that GSIP can handle missing values in the data without significantly affecting the results. Furthermore, GSIP supports symantic textual comparison when calculating the description similarity of user and web service profiles. It uses the LOD-based similarity measure approach [24], as presented in the previous subsection. Although GSIP is a comprehensive multi-criteria framework, we compare it here only on the individual similarity level to isolate the contribution of each component. A more extensive comparison with other multi-criteria frameworks remains future work. We compare GSIP with four well-known similarity measures: Jaro-Winkler [25], Jaccard [26], Cosine [27], Manhattan [28]. This comparison is based on different parameters: the execution time of similarity (running time), dependency on data quality with missing values (tolerance to outliers), the type of values supported: continuous, categorical, numeric, string, etc. (attribute type), the need to transform attribute or preprocess data (attribute transformation), and the support for semantics in comparison (semantic comparison).
Table 3 shows that the performance of the different similarity measures varies depending on the desired characteristics. GSIP’s support for several vectors during the comparison clearly influences its calculation time which remains higher compared to other similarity measures. However, this difference is negligible considering that GSIP does not require attribute transformation, simplifying its use in raw data scenarios. The other measures need some form of data preprocessing or transformation, which adds a step to the data preparation process. For the other characteristics, GSIP shows superiority compared to the other similarities for social applications. GSIP similarity evaluates attributes independently and normalizes over the available fields, ensuring that missing profile information does not bias the result. Ambiguous or noisy LOD annotations are down-weighted during semantic comparison, limiting their influence on the overall similarity score. Moreover, because the bipartite user–service graph is inherently sparse, applying minimum access and similarity thresholds suppresses weak or uninformative links and preserves only meaningful interactions. This process also mitigates imbalance issues and enables users or services to be integrated in the cold-start through profile-based similarity rather than relying on historical interaction data.
The GSIP similarity has a complexity of
3.2.3 Construction of the Web Services Discovery Graph
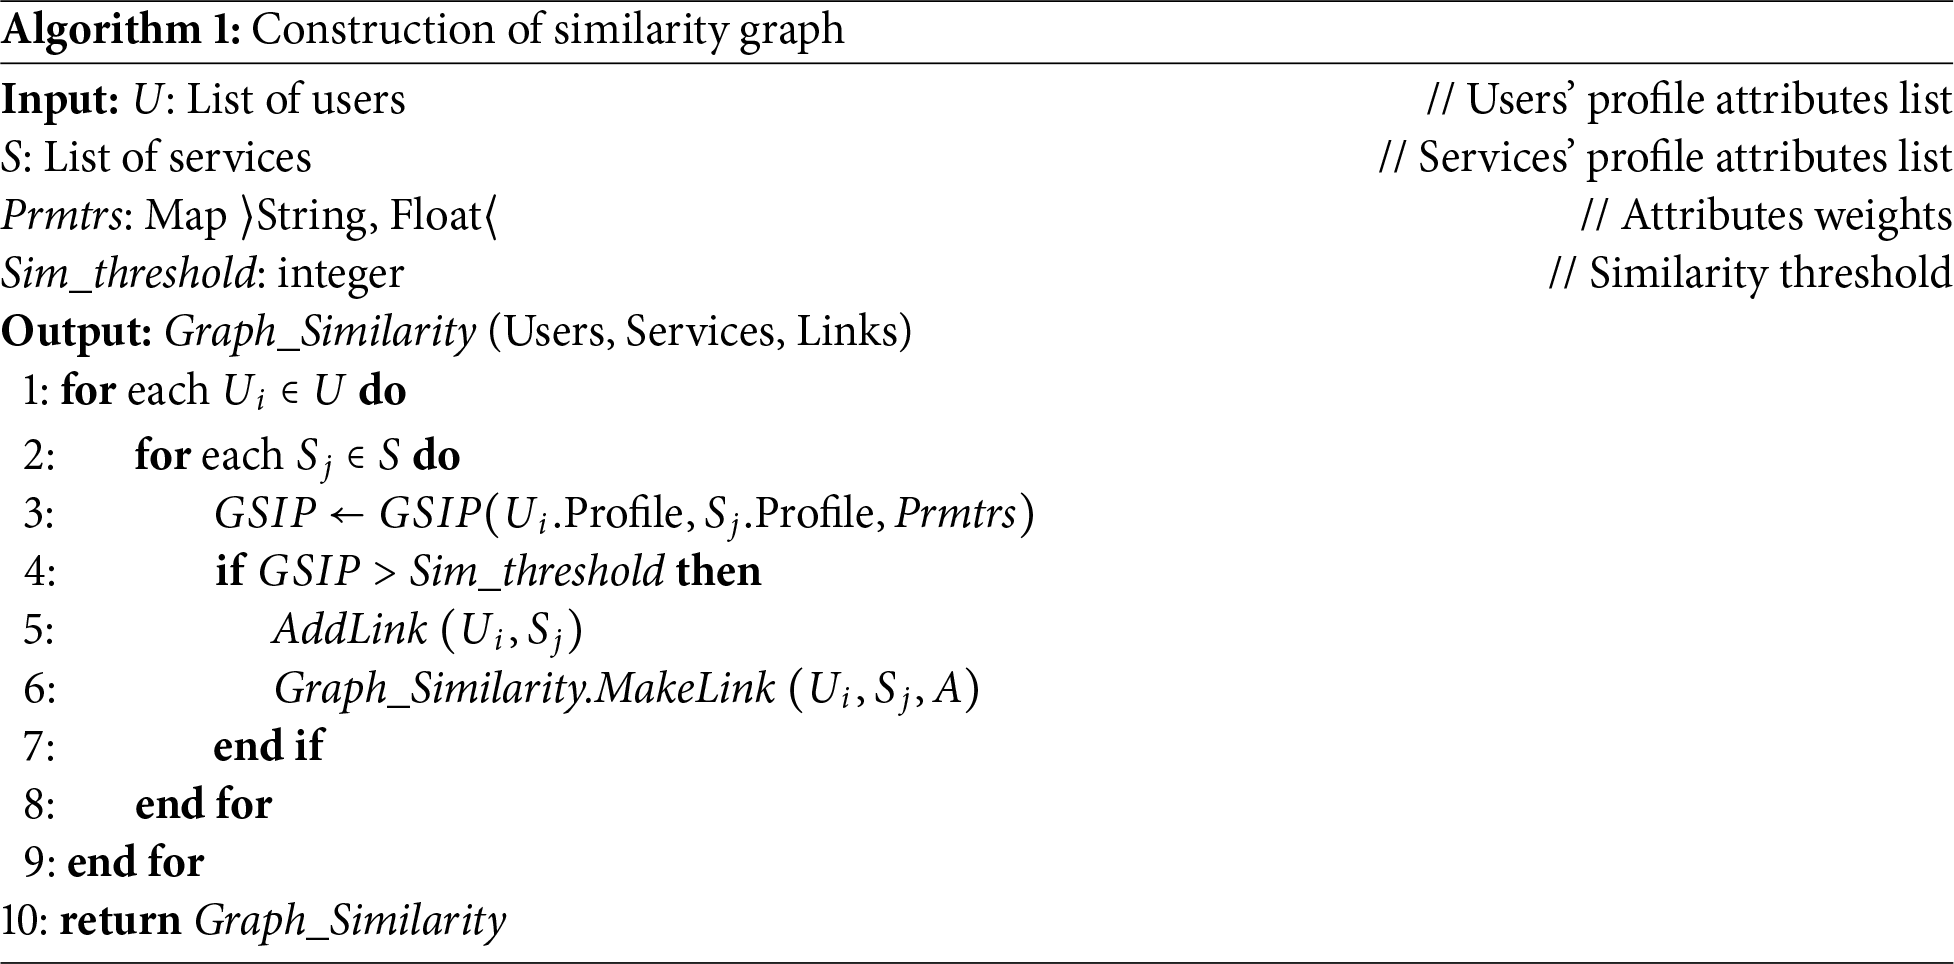
After calculating the similarity between each user and service profile, a link is established between the profiles where the similarity exceeds a predefined threshold. This results in a bipartite similarity graph. Algorithm 1 elucidates the approach for constructing this graph, with comments indicated by:
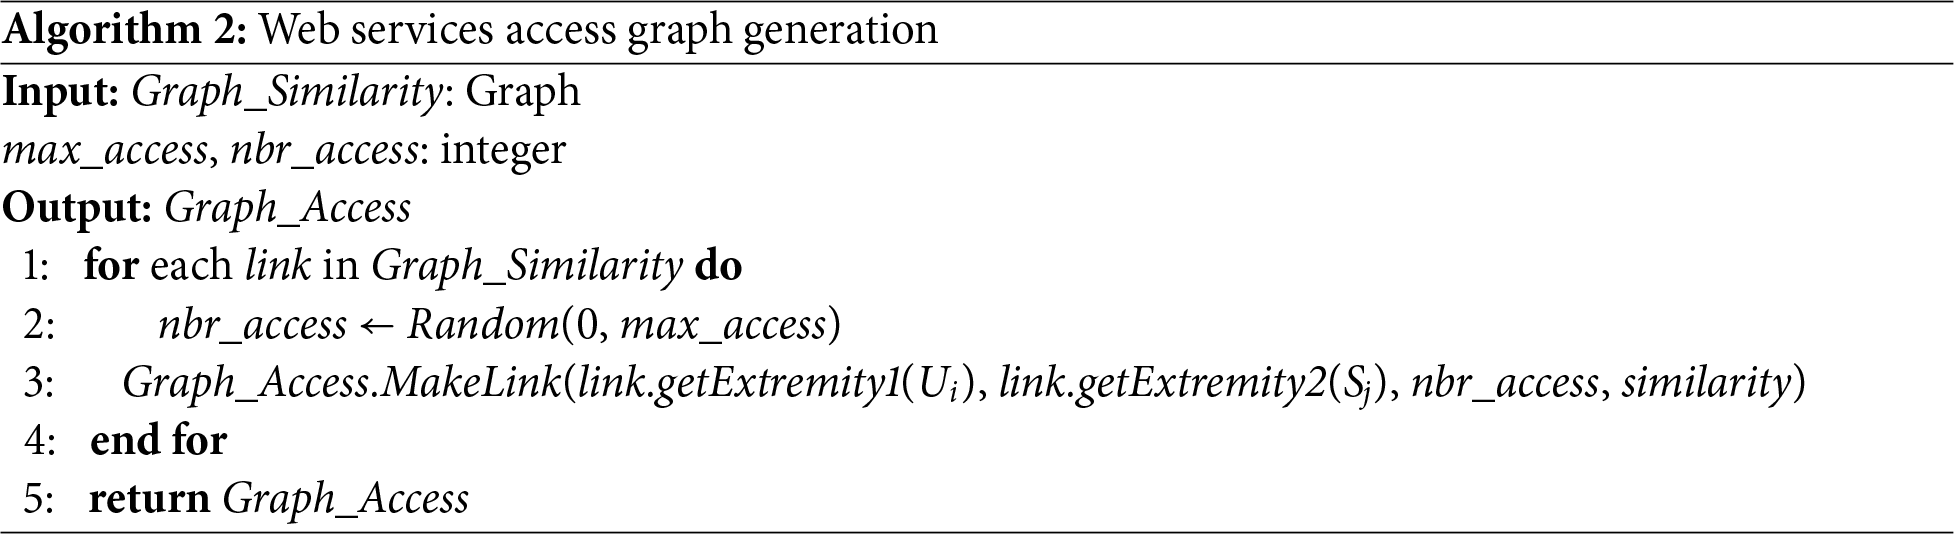
A similarity between user and service profiles does not necessarily imply that the user accesses a similar service. A user might engage with a service out of curiosity or by mistake. To validate the link and eliminate intruders, the number of accesses for each pair of profiles must be constrained by a lower bound. To achieve this, we have devised a method where multiple accesses are created for each link between a user and a service, occurring in different locations, on different dates, and with varying durations of access. Algorithm 2 illustrates the construction of web services discovery graph.
3.3 Filtering of Web Services Discovery Graph
The proposed approach is centered around community discovery, incorporating various filters pertaining to users, web services, and user access to web services. A query can define the filters to be applied to the web services access graph, providing substantial insights into the discovered communities. User filters encompass interests, localization, age, and gender, alongside additional filters such as affiliation, level of study, and language. Filters associated with the service include primarily the domain, which is a mandatory filter and contributes significantly to the interpretation of the discovered communities, particularly when combined with other filters such as service location. Moreover, we divide filters concerning user access to web services into three main sub-filters: (i) “Access date” sub-filter, (ii) “Access duration” sub-filter, and (iii) “Access location” sub-filter. These three criteria were selected because they collectively provide a comprehensive view of user behavior in terms of temporal patterns (access date), engagement levels (access duration), and geographical context (access location). Including these dimensions allows for more detailed analysis of community discovery and user interaction with web services.
The purpose of this filter is to restrict user access to services based on clearly defined time constraints and to address various temporal considerations. Users access services on different dates; for example, the use of tourist services typically increases during vacation periods, while demand for defense, information, and communication services may spike during times of conflict. This pattern applies broadly to many other types of services. By analyzing access dates, it becomes possible to identify temporal trends and seasonal variations, which are critical for understanding user behavior and community dynamics. This criterion captures the temporal dimension of service usage, enabling the identification of patterns such as daily, weekly, or monthly peaks, insights that are essential for effective resource allocation and service optimization.
Drawing inspiration from Allen’s algebra model of time [22], the “access date” sub-filter involves retrieving all accesses occurring between or outside two defined dates. Additionally, it involves retrieving accesses on a specific date or before/after that date.
3.3.2 Access Duration Sub-Filter
The “access duration” sub-filter enables the retrieval of accesses that fall within a predefined time interval. The length of time users spend accessing a service indicates their level of engagement and commitment. Longer access durations may suggest greater user interest or the complexity of the service being used. For example, longer durations in accessing educational services might reflect intensive study sessions or prolonged use of learning resources. By examining the duration of the access, the developer can differentiate between casual users and dedicated users, which helps to identify key users or influencers within a community. This information is valuable for tailoring services and improving user experience.
3.3.3 Access Localization Sub-Filter
The user accesses a service from various locations, necessitating the preservation of the user’s global positioning system (GPS) access coordinates. The purpose of this filter is to confine the geographical scope of user community discovery, addressing different location-related constraints. The geographical location from which users access services provides context about their physical environment and potential constraints or preferences. For example, users who access services from urban areas may have different needs compared to those from rural areas. In addition, location data can reveal regional trends and the spatial distribution of service usage. Understanding access location helps address location-specific issues and tailoring services to meet regional demands. It also enables the identification of local communities and the analysis of geographic factors influencing service adoption and usage. Two scenarios may arise upon request:
• Filtering users who access a service from a specific location within a designated area.
• Filtering users located within a geographic region defined by a central point and radius, forming a circular area. The Haversine distance formula [29] is ideal for this purpose, as it calculates the shortest distance along the great circle between two points.
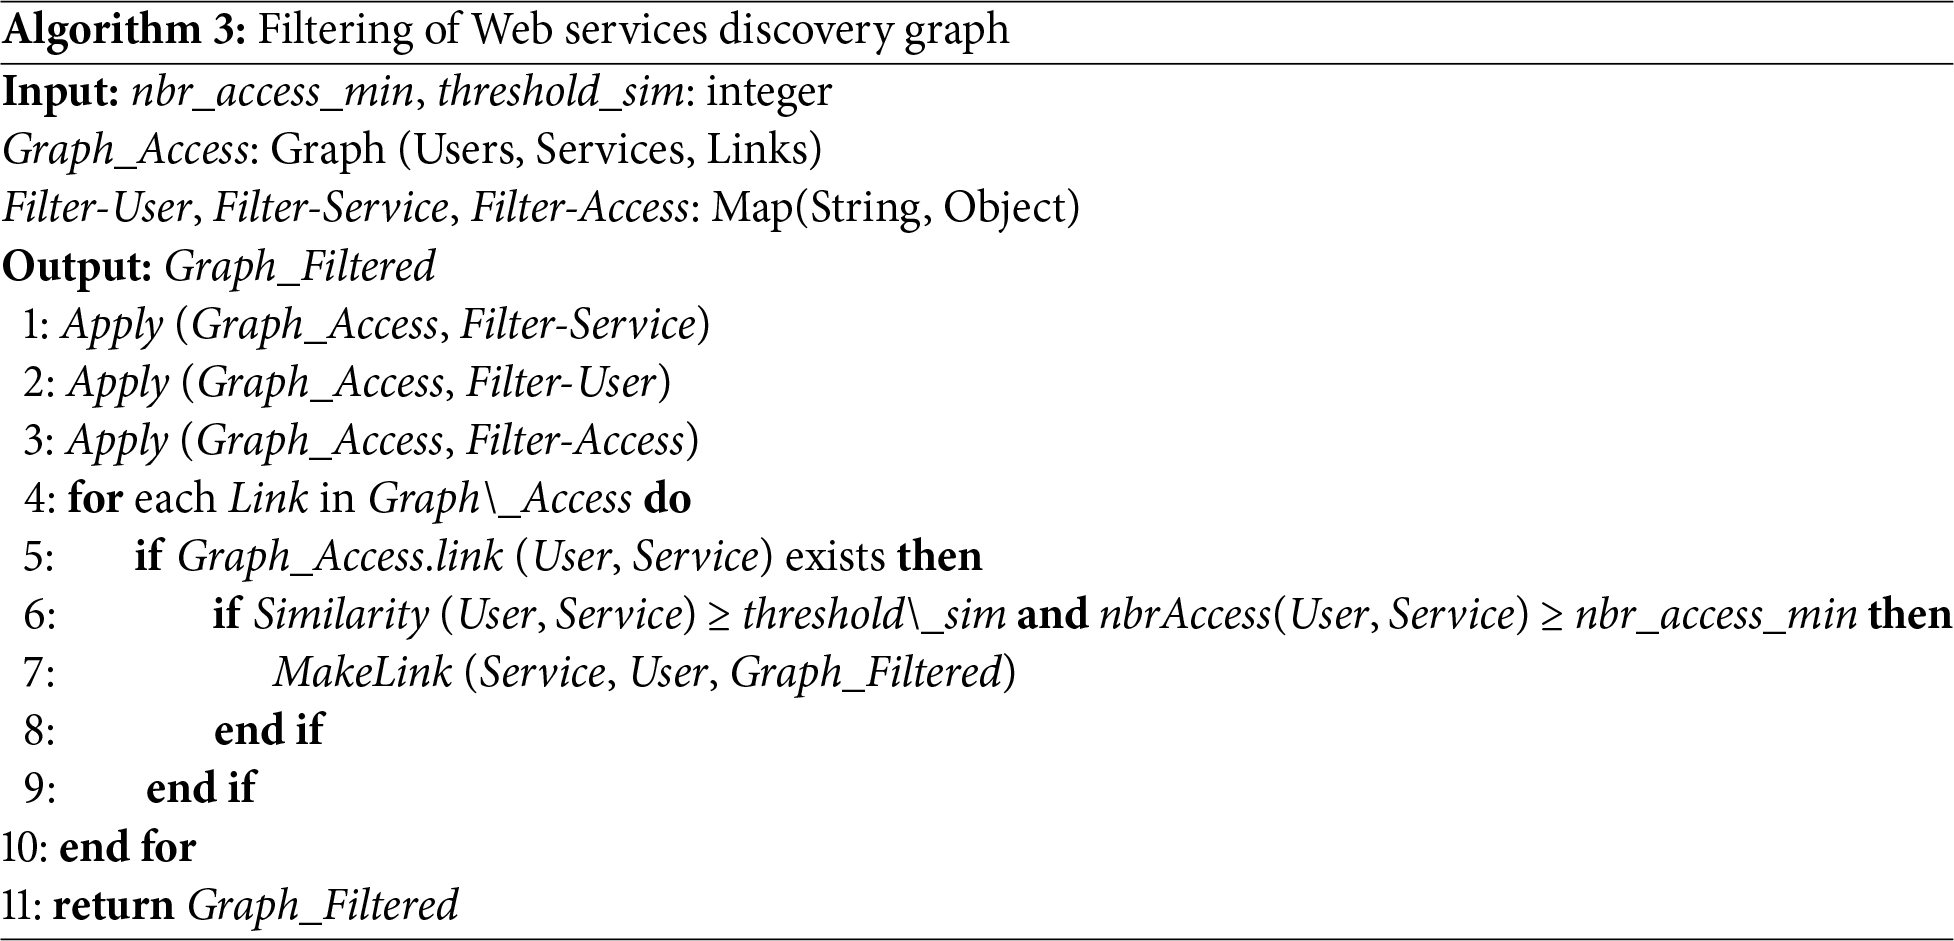
Filter parameters are flexible and adjustable according to the task requirements. Low-activity users/services are removed by defining a threshold access parameter nbr_access_min. The services are significant to discovery if accessed by at least 50 users. Candidate pairs are retained only if their GSIP similarity exceeds a defined threshold parameter threshold_sim. The communities are then constructed from this similarity graph with thresholds chosen through data-driven tuning. Algorithm 3 outlines the filtering procedure using various filters.
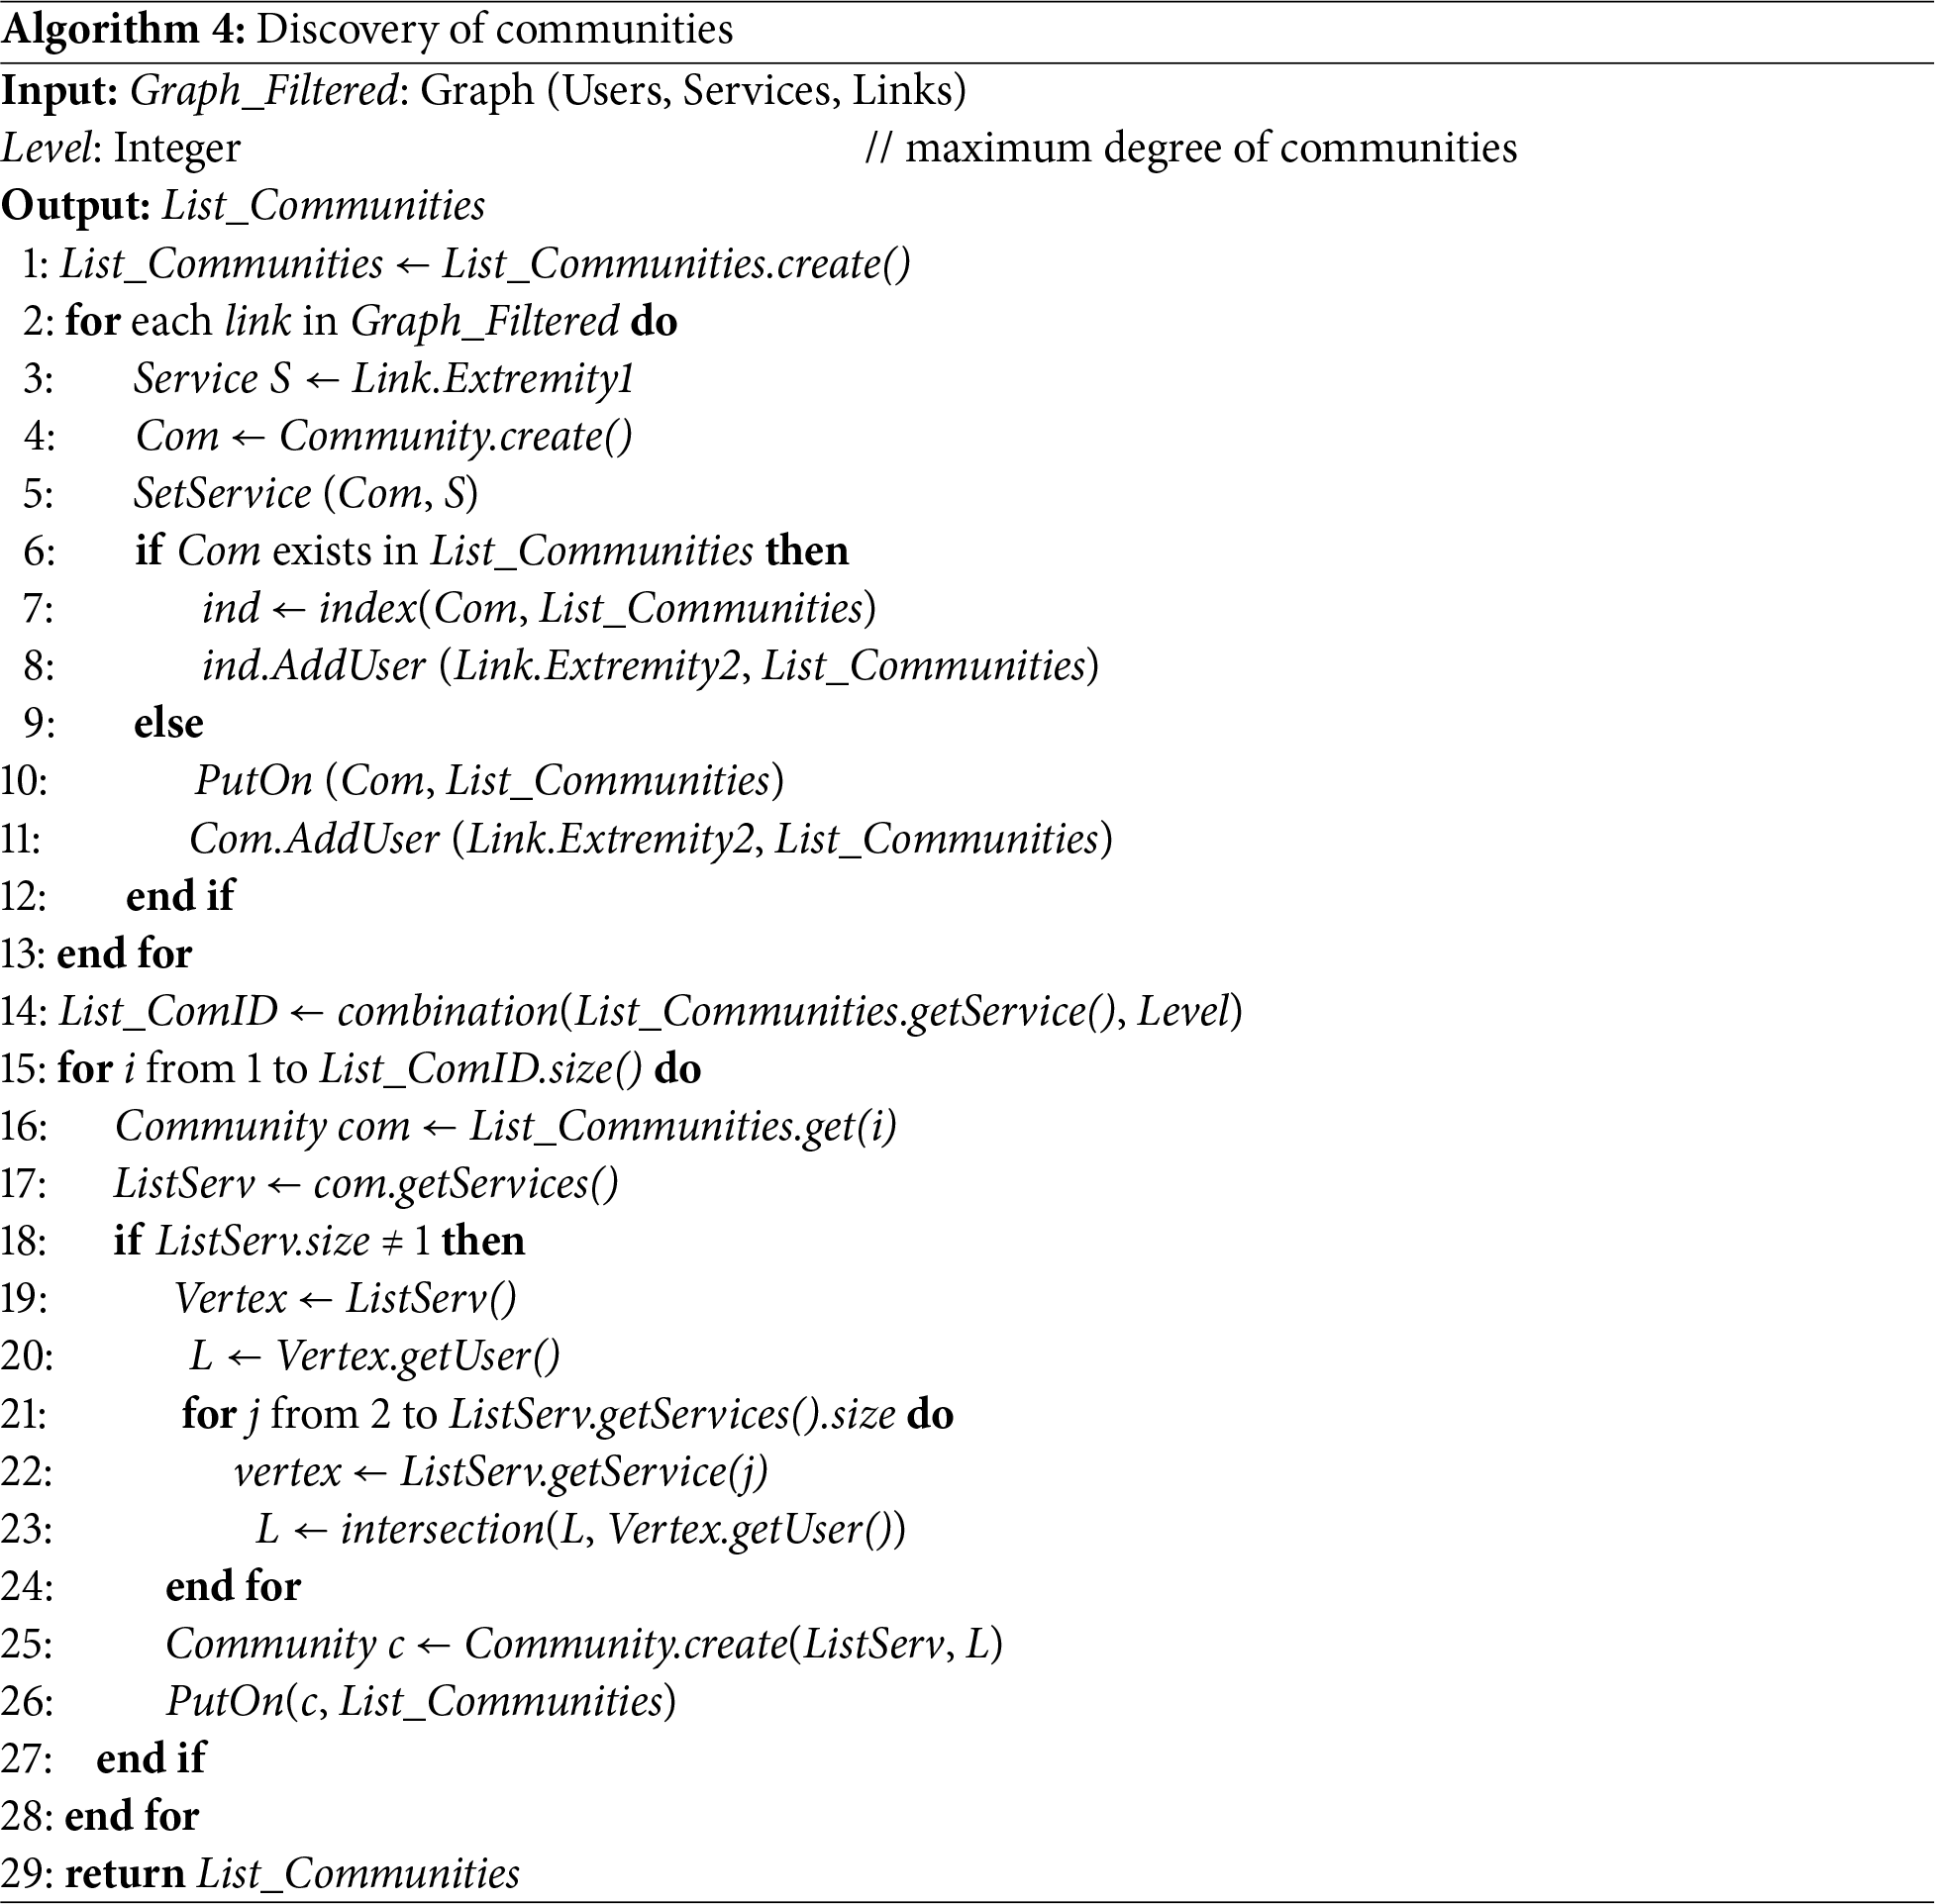
Many methods for community discovery have been proposed, yet all are constrained by limitations when applied to complex networks due to their reliance on user interaction for discovery [13,30]. The proposed CDBS approach aims to address this issue by organizing users into communities, each representing one or more services with the attached users. This final step involves generating communities from the filtered access graph by grouping users who have accessed the same services. Since a user can access several services, the same user node may be simultaneously linked to multiple service nodes. As a consequence, a user may belong to more than one community. Community membership is therefore calculated by collecting all users connected to a given service and then extending this membership iteratively through service intersections that reflect multiple groups of interest. CDBS is divided into two steps:
• Step 1: The objective of this phase is to create communities that adhere to the specified filters, leveraging the results obtained earlier (filtered access graph). At this stage, the advantage of addressing the problem with a bipartite graph becomes evident. Taking into account previously acquired accesses, it is adequate for each service to identify the user nodes associated with it. These users will form a community associated with the service. However, detecting communities related to individual services alone is insufficient. The aim is to uncover communities associated with a set of services.
• Step 2: The decomposition of the network in the preceding step is marked by overlaps among communities, stemming from the possibility of users accessing multiple web services and thus belonging to multiple communities. In this phase, we systematically evaluate pairs of communities obtained from the previous step. For each such pair, a new community is formed by merging their respective services. This resultant community comprises users extracted from the intersection of the merged services. This process is iterative until there is no additional overlap between communities.
These steps group users by services with complexity of
4 Implementation of the Proposed Architecture
The execution environment must rely on a high-performance, open-source platform capable of processing large volumes of distributed data, particularly for complex network analysis. The NetBeans platform [31], with its Java Integrated Development Environment (IDE), meets this requirement effectively. Moreover, remote method invocation (RMI), a Java API, enables transparent manipulation of remote objects as if they were local, ensuring seamless execution across distributed systems. For visualization, Pajek software [32] offers robust network analysis and visualization capabilities, with cross-platform compatibility on Windows, Mac, and Linux.
4.2 Evaluation of the Proposed Approach
The proposed architecture requires the creation of detailed user and service profiles, as defined in Section 3.1, along with specifying each user’s access to their desired services. Since no real data set containing such detailed profile and access information is publicly available, and given that the specific data values do not directly affect the community discovery process, a synthetic database was created for experimentation. In this phase, possible values were defined for each attribute within the user and service profiles. Considering an example with 50 services and 10,000 users. After assigning attribute weights, we generated a similarity discovery graph with a target similarity rate of 50% or higher, identifying the web services most similar to each user through the proposed GSIP metric. The similarity calculation incorporated weighted attributes, and for every matching pair of profiles, multiple accesses were simulated across diverse dates, times, and locations, yielding the web service discovery graph. The subsequent step involves filtering the web services discovery graph based on filters defined by a query. These filters pertain to the user, the web service, and user access to web services. We choose the following filters values:
• Service categories: “Social media,” “Gaming,” and “Sport.”
• Community members: Men.
• Connection duration: Exceeds 110 ms.
To visualize the bipartite graph of filtered accesses, a file in a specific format (.net) is generated that can be viewed using Pajek software [32]. Fig. 2a shows the result obtained. The final step involves creating communities by selecting the degree of communities, which represents the number of services involved in each community. The partial graph on Fig. 2b depicts communities with a single service.
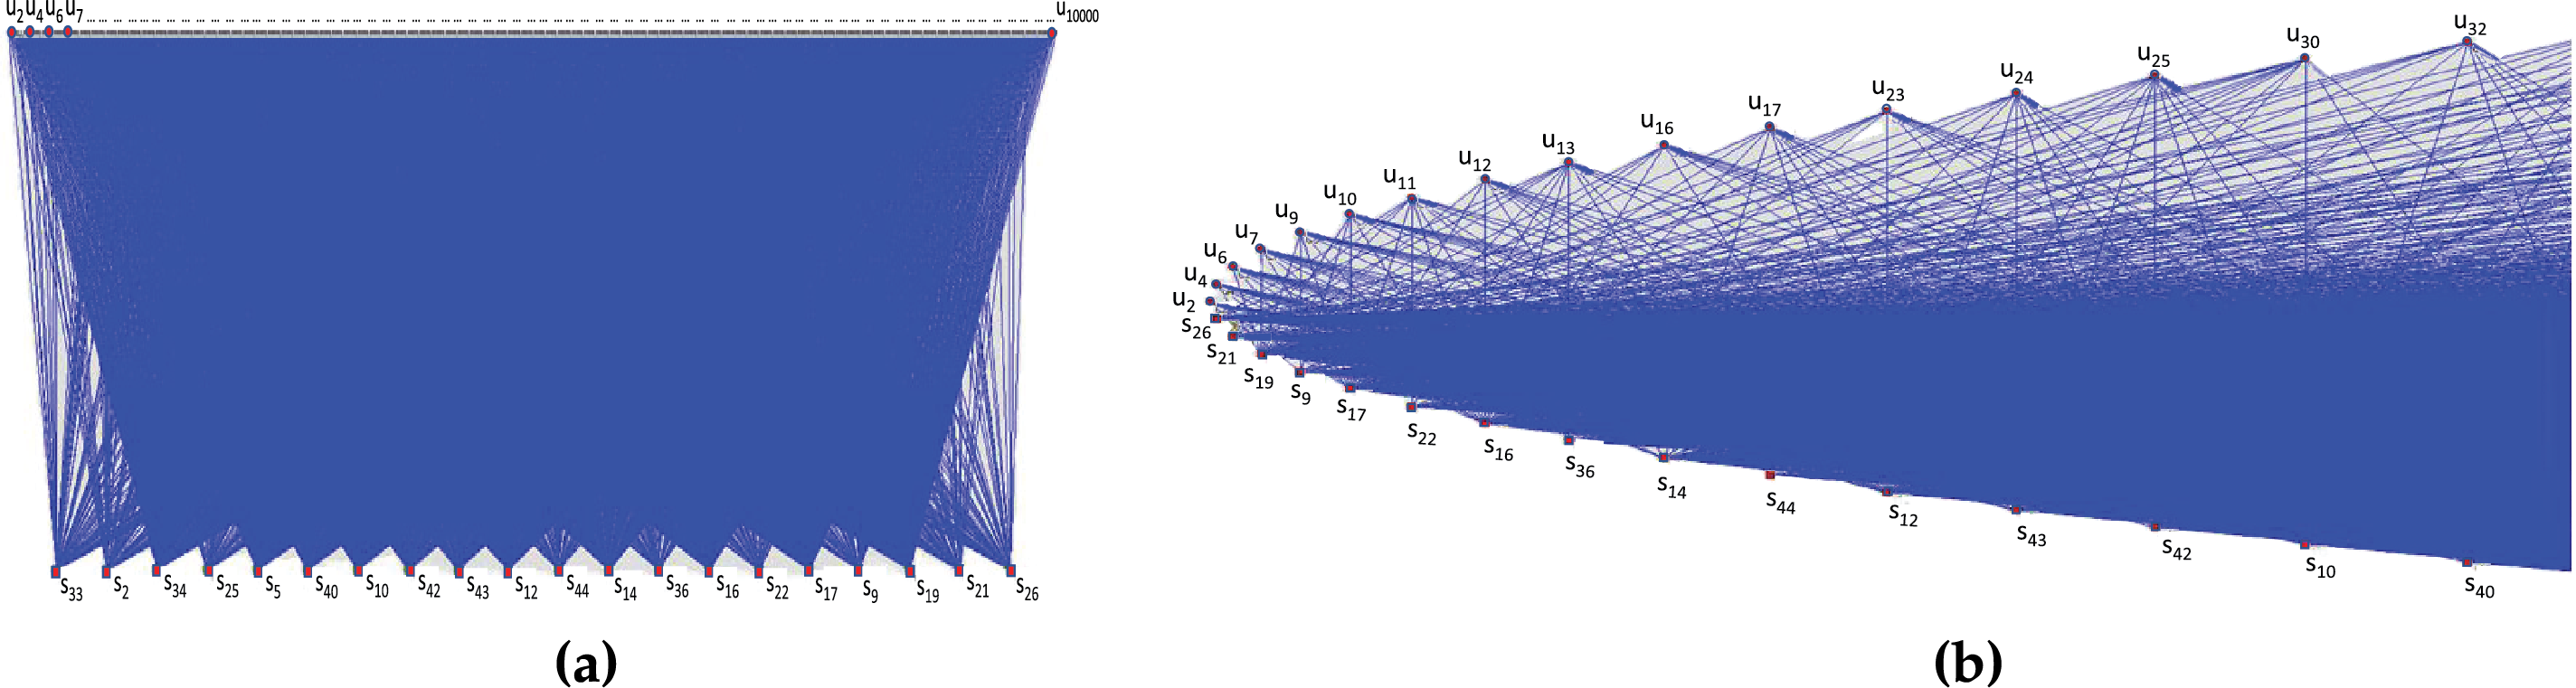
Figure 2: Community and discovery graph visualizations. (a) Graph of communities with a single service. Circles denote users, squares represent services. (b) Visualization of the filtered discovery graph
4.3 Comparison of Multi-Criteria Approach vs. No Criteria Approach
To evaluate the performance of our multi-criteria approach, a run-time comparison with non-criteria strategy was performed during community generation. The study was conducted through a series of experiments on a profile sample using a machine with an Intel Core i5 processor and 16 GB RAM. Table 4 outlines the attributes used in a similarity calculation along with their corresponding weights, expressed as percentages. These weights reflect the relative importance of each attribute in the calculation process. The weights in Table 4 were obtained through a calibration process that began with equal weighting and then gradually adjusted the relative importance of the attributes, using response time as the main evaluation criterion. Although these calibrated values yielded the most stable results in our dataset, the weights are not universally fixed and can be manually modified depending on the objectives of the task, for example, emphasizing gender in marketing, location in regional studies, or age in demographic analyses. Sensitivity analysis confirmed that such context-driven adjustments produce consistent and robust community structures, highlighting the framework’s flexibility.
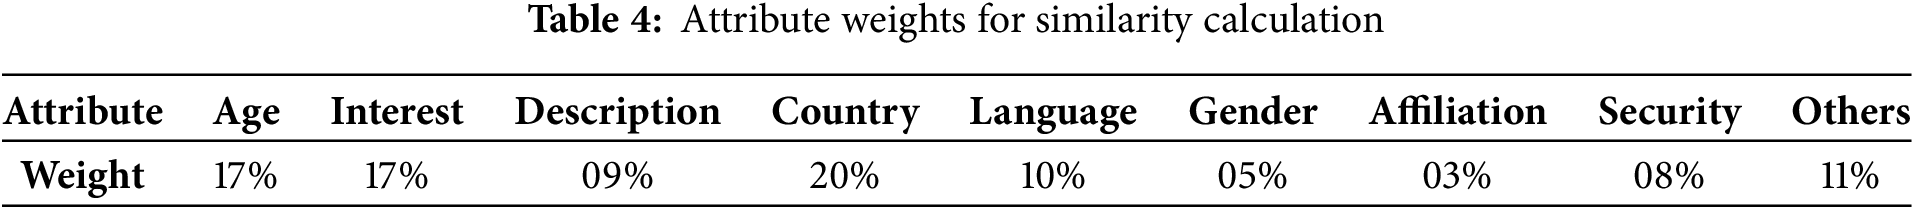
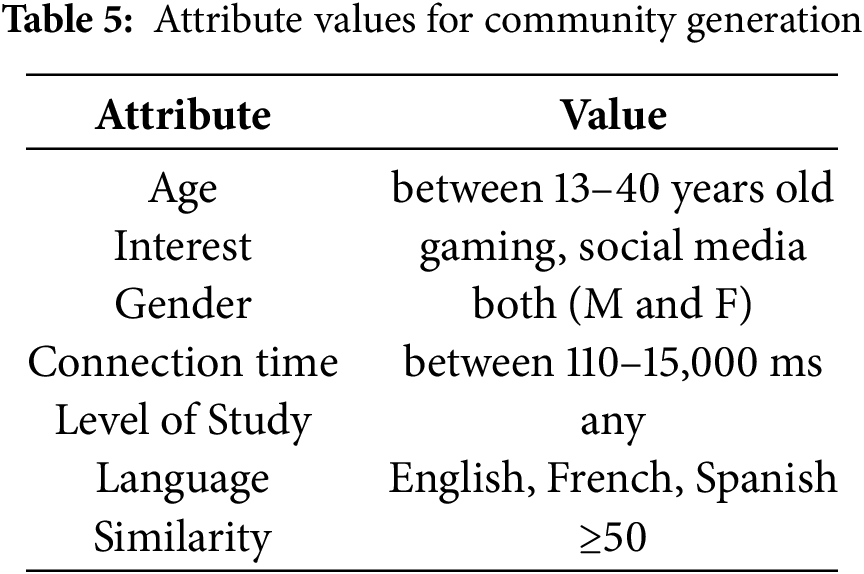
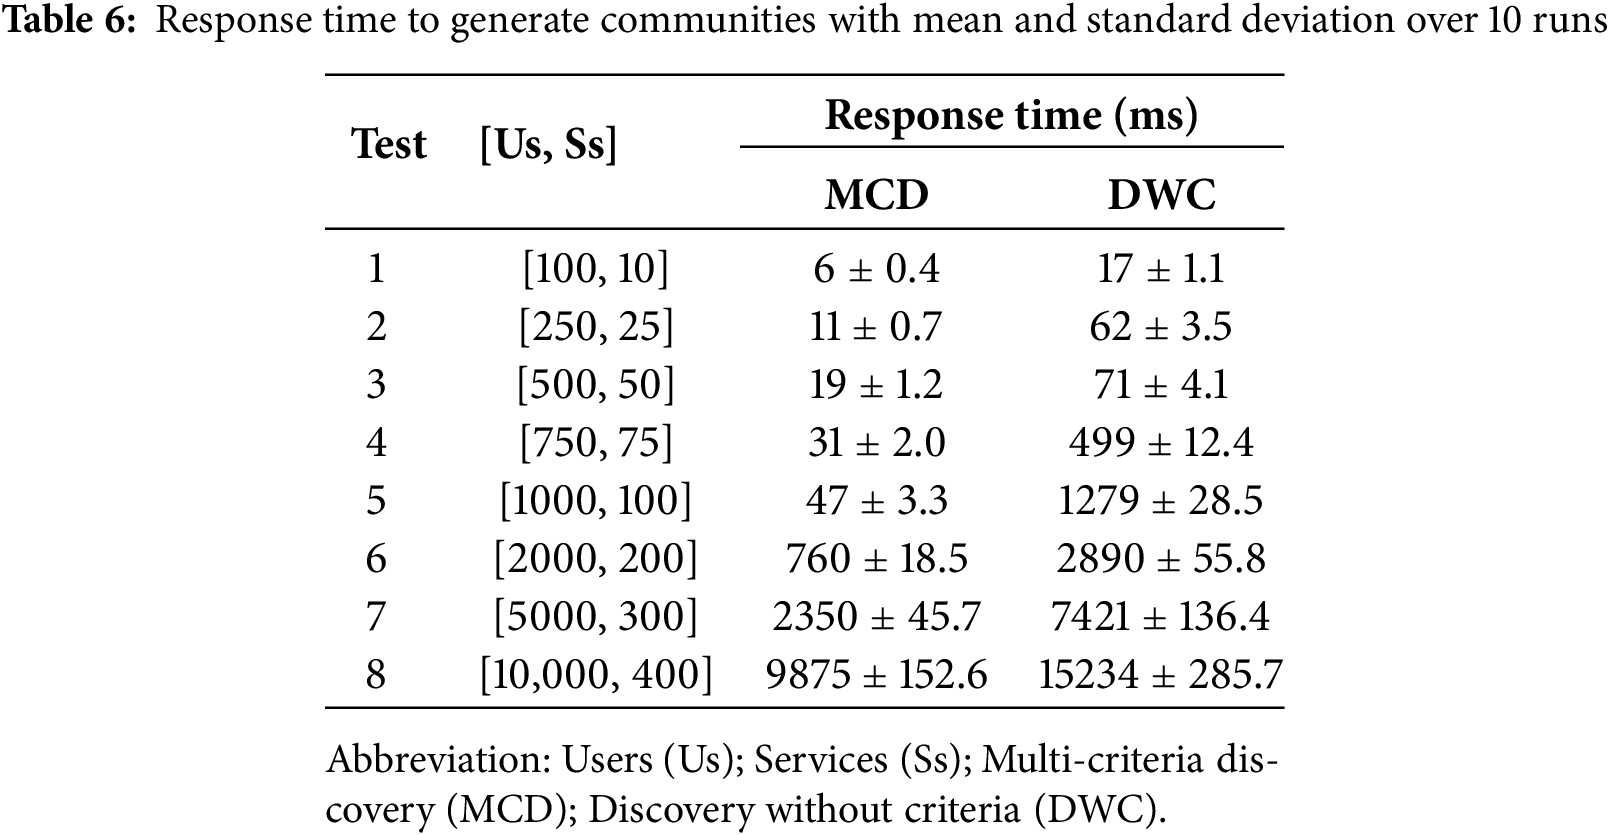
Table 5 presents some values of the criteria (filters) chosen to generate communities. For the no-criteria approach, we select all areas concerning web services without filters. Table 6 presents the tests and results of the experiments, highlighting the computational impact of introducing multi-criteria in community discovery. As expected, execution time increases with the number of profiles, and the comparison with the baseline (with and without criteria) shows the additional cost of handling heterogeneous attributes and semantic similarity. These results underline the efficiency of the proposed method in managing richer profile information within large and complex networks.
4.4 Comparison with State-of-the-Art Algorithms
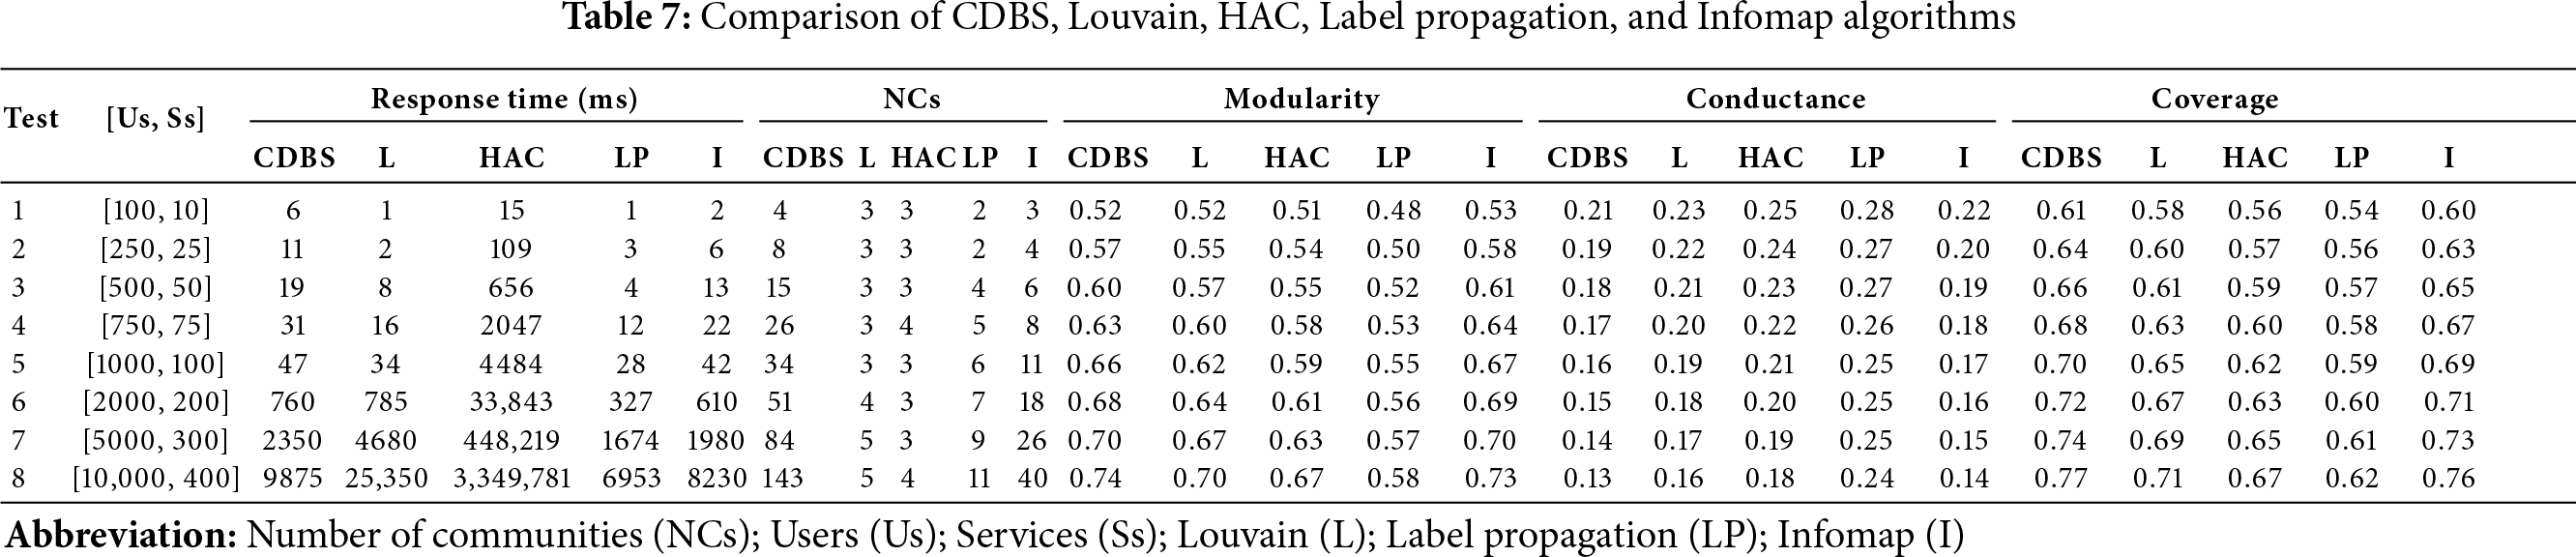
The proposed CDBS approach is compared with four powerful algorithms in the field of community discovery (Louvain [33], hierarchical agglomerative clustering (HAC) [34], Label Propagation [35], and Infomap [36]). Table 7 provides a comprehensive overview of the performance of the five methods when applied to datasets with varying numbers of users and services, in terms of running time, number of communities, and community quality. Synthetic attributes are used because no public dataset simultaneously provides rich user profiles, detailed service metadata, and fine-grained access logs at the granularity required by CDBS. Attribute ranges (e.g., age, access duration) were chosen to be realistic and exercise the entire pipeline while stress testing scalability (up to 10,000 users and 400 services), sparsity (
4.4.1 Comparison in Running Time
It should be noted that the algorithms Louvain, HAC, Label propagation and Infomap were executed on a powerful platform developed by professionals, whereas the CDBS method was implemented by researchers without a focus on optimizing the developed algorithms. Both the algorithms and the data used in all the experiments presented in this work are available in the GitHub repository1. Each experiment was repeated several times, and the reported results represent the average values.
Table 7 reports the response times of CDBS, Louvain, HAC, Label Propagation (LP), and Infomap under increasing network sizes. For small datasets, Louvain remains the fastest, followed closely by LP and Infomap. As network size grows, LP maintains relatively low runtimes, outperforming Louvain. Infomap and CDBS achieve intermediate runtimes, slower than Louvain and LP, until large-scale scenarios are reached. The scalability advantage of CDBS becomes clear in large networks. At 10,000 users and 400 services, CDBS executes in 9.8 s, outperforming Louvain (25.3 s) and HAC (55+ min). While LP remains the fastest, Infomap shows competitive performance, but their community quality metrics (Table 7) consistently fall short compared to those achieved by CDBS. This demonstrates that CDBS achieves the best trade-off between execution time and community quality, making it the most robust option for large and complex networks.
4.4.2 Comparison in the Number of Communities
The number of detected communities is a key factor, as it determines the level of specialization and the interpretability of the results. A large community may contain several sub-communities; these sub-communities form groups that share different interests, and each group requires different decision-making. The results obtained for the CDBS method vary depending on the number of services required in the final discovery. Table 7 shows that CDBS consistently produces more communities than Louvain, HAC, and Label Propagation, while maintaining a balanced scale compared to Infomap. For example, at 1000 users and 100 services, CDBS identifies 34 communities, compared to only 3 for Louvain and HAC, 6 for Label Propagation, and 11 for Infomap. At the largest scale (10,000 users and 400 services), CDBS detects 143 communities, while Louvain, HAC, LP, and Infomap identify only 5, 4, 11, and 40, respectively. These results show that CDBS achieves a balanced granularity: it identifies enough communities to capture user interests and remove intruders, while avoiding excessive fragmentation that hinders interpretability. By leveraging service information, each community is semantically characterized by its dominant service domain, making the structures both specialized and meaningful for real-world applications. Furthermore, combining two or more services can reduce the number of communities while still producing coherent and interpretable communities.
4.4.3 Comparison of the Communities Quality
To evaluate the effectiveness of community detection algorithms, several metrics can be employed (modularity, normalized mutual information (NMI), conductance, coverage, density, silhouette score, etc.) [3], each with its methodology, focus and limitations [14]. The most effective metric can vary depending on the specific goals and context of the analysis. Community quality was assessed using three widely adopted metrics: modularity, conductance, and coverage. As reported in Table 7, CDBS consistently outperforms the four baseline algorithms for the eight tests. Regarding modularity, CDBS (0.52–0.74) and infomap (0.53–0.73) achieve the highest values, demonstrating stronger intra-community cohesion than Louvain (0.52–0.70), HAC (0.51–0.67) and Label Propagation (0.48–0.58). For conductance, CDBS records the lowest values (0.21–0.13), which indicates well-separated communities; in contrast, HAC and LP present the highest conductance (
To validate the robustness of the modularity improvements, two statistical significance tests were performed on the modularity values over 10 independent runs. The Student’s t-test indicated that the improvements of CDBS over Louvain (
To assess the contribution of individual components in the proposed CDBS framework, we conducted an ablation study. Key modules were removed or replaced, and results were compared against the full model.
• GSIP similarity: Replacing GSIP with standard measures (Cosine) reduced modularity by 12.16%, confirming GSIP’s advantage in handling heterogeneous and semantic attributes.
• Filtering: Disabling multi-criteria filtering produced larger but noisy communities, with modularity dropping by 10.81%.
• Overlapping detection: Forcing users into single communities reduced modularity by 08.10%, though runtime improved slightly.
• Attribute weights: Using equal weights instead of calibrated ones decreased modularity by 05.41%, showing the importance of weighting.
Table 8 summarizes the results.
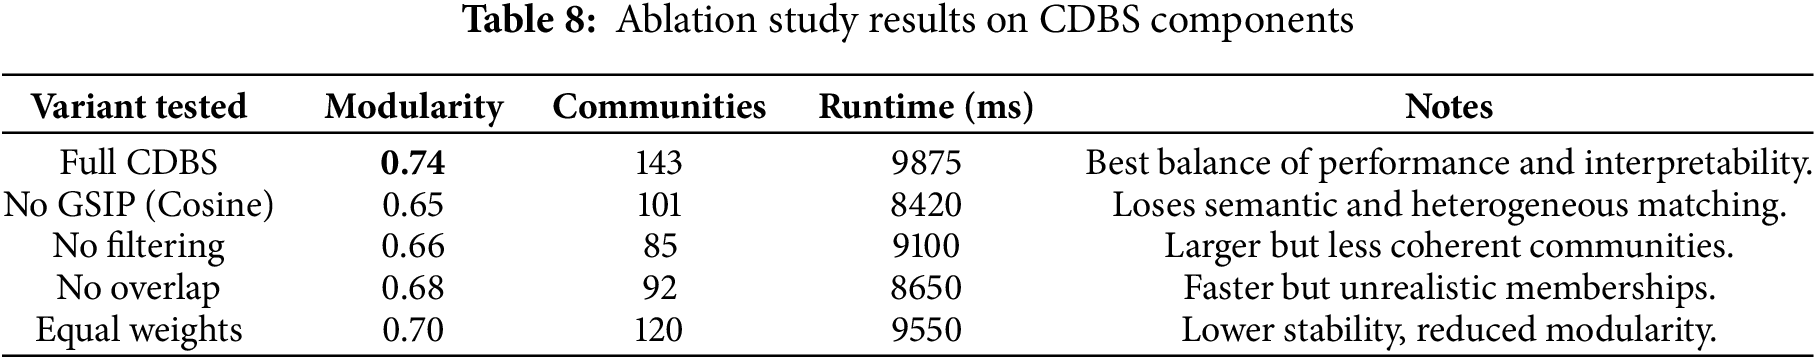
Overall, all four components (GSIP, filtering, overlap, weighting) are critical, and the full CDBS system achieves the best results.
This work introduced community discovery in complex networks through a novel service-driven discovery framework CDBS, that goes beyond topology-only methods by jointly leveraging heterogeneous user-service attributes, a novel GSIP similarity that handles all type of attributes, with semantic text matching, and multi-criteria filtering to produce interpretable, domain-anchored communities. Compared with four community detection algorithms, CDBS achieved superior community quality, yielding a 3.26% improvement over the strongest baseline, and maintained fast large-scale runtimes of just 9.8 s on networks of 10,000 users and 400 services, demonstrating both efficiency and scalability. CDBS surpasses topology-only methods by linking communities to service engagement, yielding finer-grained community structure with clearer thematic orientation, demonstrating both scalability and precision while enhancing interpretability. Nonetheless, challenges remain with parameter sensitivity, which can affect stability if not carefully tuned. Our study highlighted the critical role of calibrated weights and multi-criteria filtering, suggesting that future work should develop data-driven and adaptive tuning mechanisms to enhance robustness across heterogeneous datasets. Furthermore, service-based community discovery suffers from a scarcity of publicly available datasets and this lack of real-world benchmarks continues to limit external validation and generalizability. Addressing this gap requires building large-scale, service-oriented datasets from real platforms such as Facebook, LinkedIn, and e-learning systems. Such resources would enable rigorous validation, support real-world applications including targeted marketing, access control, and e-learning communities, and drive advances in refined filtering, predictive discovery, and personalized recommendations.
Acknowledgement: The authors thank all collaborators for contributing to this research.
Funding Statement: The authors received no specific funding for this study.
Author Contributions: The authors confirm contribution to the paper as follows: Conceptualization and design, Karim Boudjebbour; methodology, Karim Boudjebbour and Abdelkader Belkhir; data conception and implementation, Karim Boudjebbour; analysis and interpretation of results, Karim Boudjebbour and Abdelkader Belkhir; draft manuscript preparation, Karim Boudjebbour; writing—review and editing, Karim Boudjebbour and Hamza Kheddar; supervision, Abdelkader Belkhir and Hamza Kheddar. All authors reviewed the results and approved the final version of the manuscript.
Availability of Data and Materials: Data are contained within the article.
Ethics Approval: Not applicable.
Conflicts of Interest: The authors declare no conflicts of interest to report regarding the present study.
1https://github.com/bkarim78/Communities_Discovery_Based_Service
References
1. Dey AK, Tian Y, Gel YR. Community detection in complex networks: from statistical foundations to data science applications. Wiley Interdiscip Rev: Computat Stat. 2022;14(2):e1566. doi:10.1002/wics.1566. [Google Scholar] [CrossRef]
2. Jin D, Yu Z, Jiao P, Pan S, He D, Wu J, et al. A survey of community detection approaches: from statistical modeling to deep learning. IEEE Trans Knowl Data Eng. 2021;35(2):1149–70. doi:10.1109/tkde.2021.3104155. [Google Scholar] [CrossRef]
3. Liu X, Cheng HM, Zhang ZY. Evaluation of community detection methods. IEEE Trans Knowl Data Eng. 2019;32(9):1736–46. [Google Scholar]
4. Alfaqeeh M, Skillicorn DB. Community detection in social networks by spectral embedding of typed graphs. Soc Netw Anal Min. 2023;14(1):12. doi:10.1007/s13278-023-01172-y. [Google Scholar] [CrossRef]
5. Contisciani M, Safdari H, De Bacco C. Community detection and reciprocity in networks by jointly modelling pairs of edges. J Complex Netw. 2022;10(4):cnac034. doi:10.1093/comnet/cnac034. [Google Scholar] [CrossRef]
6. Akachar E, Ouhbi B, Frikh B. A new algorithm for detecting communities in social networks based on content and structure information. Int J Web Inf Syst. 2019;16(1):79–93. doi:10.1108/ijwis-06-2019-0030. [Google Scholar] [CrossRef]
7. Cai J, Hao J, Yang H, Yang Y, Zhao X, Xun Y, et al. A new community detection method for simplified networks by combining structure and attribute information. Expert Syst Appl. 2024;246(8):123103. doi:10.1016/j.eswa.2023.123103. [Google Scholar] [CrossRef]
8. Zhao X, Liang J, Wang J. A community detection algorithm based on graph compression for large-scale social networks. Inf Sci. 2021;551(3):358–72. doi:10.1016/j.ins.2020.10.057. [Google Scholar] [CrossRef]
9. Dabaghi-Zarandi F, Afkhami MM, Ashoori MH. Community detection method based on random walk and multi objective evolutionary algorithm in complex networks. J Netw Comput Appl. 2025;234(4):104070. doi:10.1016/j.jnca.2024.104070. [Google Scholar] [CrossRef]
10. Karampour E, Malek MR, Eidi M. Discrete Ricci Flow: a powerful method for community detection in location-based social networks. Comput Electr Eng. 2025;123(2):110302. doi:10.1016/j.compeleceng.2025.110302. [Google Scholar] [CrossRef]
11. Khawaja FR, Zhang Z, Ullah A. Common-neighbor based overlapping community detection in complex networks. Soc Netw Anal Min. 2025;15(1):61. doi:10.1007/s13278-025-01480-5. [Google Scholar] [CrossRef]
12. Chandrika GN, Alnowibet K, Kautish KS, Reddy ES, Alrasheedi AF, Mohamed AW. Graph transformer for communities detection in social networks. Comput Mater Contin. 2022;70(3):5707–20. [Google Scholar]
13. Azaouzi M, Rhouma D, Ben Romdhane L. Community detection in large-scale social networks: state-of-the-art and future directions. Soc Netw Anal Min. 2019;9(1):23. doi:10.1007/s13278-019-0566-x. [Google Scholar] [CrossRef]
14. Arab M, Hasheminezhad M. Limitations of quality metrics for community detection and evaluation. In: 2017 3th International Conference on Web Research (ICWR); 2017 Apr 19–20; Tehran, Iran. p. 7–14. [Google Scholar]
15. Amin F, Choi JG, Choi GS. Advanced community identification model for social networks. Comput Mater Contin. 2021;69(2):1687–707. doi:10.32604/cmc.2021.017870. [Google Scholar] [CrossRef]
16. Dabaghi-Zarandi F, KamaliPour P. Community detection in complex network based on an improved random algorithm using local and global network information. J Netw Comput Appl. 2022;206(2):103492. doi:10.1016/j.jnca.2022.103492. [Google Scholar] [CrossRef]
17. Sayari S, Harounabadi A, Banirostam T. Community detection based on improved user interaction degree, weighted quasi-local path-based similarity and frequent pattern mining. J Supercomput. 2024;80(13):18544–72. doi:10.1007/s11227-024-06178-7. [Google Scholar] [CrossRef]
18. Sayari S, Harounabadi A, Banirostam T. Robust community detection based on improved user interaction, enhanced local path index and pattern mining in social networks. Inf Process Manag. 2025;62(3):104008. doi:10.1016/j.ipm.2024.104008. [Google Scholar] [CrossRef]
19. Madhulika Kaur P, Sabharwal S. Hybrid label propagation based on motifs and similarity measures for community detection. Knowl Inf Syst. 2025;6(3):115. doi:10.1007/s10115-025-02557-5. [Google Scholar] [CrossRef]
20. Boudjebbour K, Belkhir A, Toubal EB, Rahim M. User web access prediction based on web services and user profile. In: 2022 International Conference on Advanced Aspects of Software Engineering (ICAASE); 2022 Sep 17–18; Constantine, Algeria. p. 1–6. [Google Scholar]
21. Obidallah WJ, Raahemi B, Ruhi U. Clustering and association rules for web service discovery and recommendation: a systematic literature review. SN Comput Sci. 2020;1(1):27. [Google Scholar]
22. Eriksson L, Lagerkvist V. Improved algorithms for allen’s interval algebra: a dynamic programming approach. In: Proceedings of the Thirtieth International Joint Conference on Artificial Intelligence (IJCAI-21); 2021 Aug 19–27; Montreal, QC, USA. p. 1873–9. [Google Scholar]
23. Piao G, Breslin JG. Measuring semantic distance for linked open data-enabled recommender systems. In: Proceedings of the 31st Annual ACM Symposium on Applied Computing; 2016 Apr 3–8; Pisa, Italy. p. 315–20. [Google Scholar]
24. Cheniki N, Belkhir A, Sam Y, Messai N. Lods: A linked open data based similarity measure. In: 2016 IEEE 25th International Conference on eNabling Technologies: Infrastructure for Collaborative Enterprises (WETICE); 2016 Jun 13–15; Paris, France. p. 229–34. [Google Scholar]
25. Friendly F. Jaro–Winkler distance improvement for approximate string search using indexing data for multiuser application. In: Journal of Physics: Conference Series. Vol. 1361. Bristol, UK: IOP Publishing; 2019. 012080 p. [Google Scholar]
26. Verma V, Aggarwal RK. A comparative analysis of similarity measures akin to the Jaccard index in collaborative recommendations: empirical and theoretical perspective. Soc Netw Anal Min. 2020;10(1):43. doi:10.1007/s13278-020-00660-9. [Google Scholar] [CrossRef]
27. Alobed M, Altrad AM, Bakar ZBA. A comparative analysis of Euclidean, Jaccard and Cosine similarity measure and arabic wordnet for automated arabic essay scoring. In: 2021 Fifth International Conference on Information Retrieval and Knowledge Management (CAMP); 2021 Jun 15–16; Online. p. 70–4. [Google Scholar]
28. Temple J. Characteristics of distance matrices based on Euclidean, Manhattan and Hausdorff coefficients. J Classif. 2023;40(2):214–32. doi:10.1007/s00357-023-09435-1. [Google Scholar] [CrossRef]
29. Setyorini I, Ramayanti D. Finding nearest mosque using Haversine formula on Android platform. Jurnal Online Informatika. 2019;4(1):57–62. doi:10.15575/join.v4i1.267. [Google Scholar] [CrossRef]
30. Jin D, Liu Z, He D, Gabrys B, Musial K. Robust detection of communities with multi-semantics in large attributed networks. In: Knowledge Science, Engineering and Management: 11th International Conference, KSEM 2018. Cham, Switzerland: Springer; 2018. p. 362–76. [Google Scholar]
31. Kostaras I, Drabo C, Juneau J, Reimers S, Schröder M, Wielenga G, et al. Porting an application to the netbeans platform. In: Pro Apache NetBeans: Building Applications on the Rich Client Platform. Berkeley, CA, USA: Apress; 2020. p. 255–97 doi: 10.1007/978-1-4842-5370-0_9. [Google Scholar] [CrossRef]
32. Mrvar A, Batagelj V. Programs for analysis and visualization of very large networks reference manual. Recuperado El. 2018;12:3. [Google Scholar]
33. Ghosh S, Halappanavar M, Tumeo A, Kalyanaraman A, Lu H, Chavarria-Miranda D, et al. Distributed louvain algorithm for graph community detection. In: 2018 IEEE international parallel and distributed processing symposium (IPDPS); 2018 May 21–25; Vancouver, BC, Canada. p. 885–95. [Google Scholar]
34. Eckhardt CM, Madjarova SJ, Williams RJ, Ollivier M, Karlsson J, Pareek A, et al. Unsupervised machine learning methods and emerging applications in healthcare. Knee Surg Sports Traumatol Arthrosc. 2023;31(2):376–81. doi:10.1007/s00167-022-07233-7. [Google Scholar] [PubMed] [CrossRef]
35. Zhao Z, Xie J, Zhang N, Hu A, Yan R, Tang J. Node influence-based label propagation for community detection using both topology and attributes. Expert Syst Appl. 2025;287(5):127999. doi:10.1016/j.eswa.2025.127999. [Google Scholar] [CrossRef]
36. Sun B, Tu Y, Song X. Leveraging community detection for clustered federated learning on Non-IID data: from an information-theoretic perspective. Future Gener Comput Syst. 2026;174(2):108005. doi:10.1016/j.future.2025.108005. [Google Scholar] [CrossRef]
Cite This Article
 Copyright © 2026 The Author(s). Published by Tech Science Press.
This work is licensed under a Creative Commons Attribution 4.0 International License , which permits unrestricted use, distribution, and reproduction in any medium, provided the original work is properly cited.
 Downloads
 Citation Tools