
 Submit a Paper
 Propose a Special lssue
 Open Access
ARTICLE
Semi-Supervised Segmentation Framework for Quantitative Analysis of Material Microstructure Images
1 Faculty of Information Engineering and Automation, Kunming University of Science and Technology, Kunming, 650093, China
2 Yunnan Key Laboratory of Computer Technologies Application, Kunming University of Science and Technology, Kunming, 650500, China
3 Faculty of Materials Science and Engineering, Kunming University of Science and Technology, Kunming, 650093, China
* Corresponding Author: Jiancheng Yin. Email:
Computers, Materials & Continua 2026, 87(1), 20 https://doi.org/10.32604/cmc.2026.074681
Received 15 October 2025; Accepted 05 January 2026; Issue published 10 February 2026
 View Full Text
 Download PDF
Abstract
Quantitative analysis of aluminum-silicon (Al-Si) alloy microstructure is crucial for evaluating and controlling alloy performance. Conventional analysis methods rely on manual segmentation, which is inefficient and subjective, while fully supervised deep learning approaches require extensive and expensive pixel-level annotated data. Furthermore, existing semi-supervised methods still face challenges in handling the adhesion of adjacent primary silicon particles and effectively utilizing consistency in unlabeled data. To address these issues, this paper proposes a novel semi-supervised framework for Al-Si alloy microstructure image segmentation. First, we introduce a Rotational Uncertainty Correction Strategy (RUCS). This strategy employs multi-angle rotational perturbations and Monte Carlo sampling to assess prediction consistency, generating a pixel-wise confidence weight map. By integrating this map into the loss function, the model dynamically focuses on high-confidence regions, thereby improving generalization ability while reducing manual annotation pressure. Second, we design a Boundary Enhancement Module (BEM) to strengthen boundary feature extraction through erosion difference and multi-scale dilated convolutions. This module guides the model to focus on the boundary regions of adjacent particles, effectively resolving particle adhesion and improving segmentation accuracy. Systematic experiments were conducted on the Aluminum-Silicon Alloy Microstructure Dataset (ASAD). Results indicate that the proposed method performs exceptionally well with scarce labeled data. Specifically, using only 5% labeled data, our method improves the Jaccard index and Adjusted Rand Index (ARI) by 2.84 and 1.57 percentage points, respectively, and reduces the Variation of Information (VI) by 8.65 compared to state-of-the-art semi-supervised models, approaching the performance levels of 10% labeled data. These results demonstrate that the proposed method significantly enhances the accuracy and robustness of quantitative microstructure analysis while reducing annotation costs.Keywords
Quantitative analysis of microstructure plays a crucial role in the field of materials science, especially in controlling the performance of metals or alloys [1]. Traditional methods mainly rely on manual labeling techniques for researchers to carefully segment particles in the microstructure and subsequently use specialized software tools for quantitative analysis. However, this approach is not only inefficient and time-consuming, but also often involves strong subjectivity, making it difficult to ensure objectivity and accuracy of the analysis results [2]. In view of this, researching computer algorithms that can quickly identify the microstructure characteristics of materials and accurately extract their characteristic parameters is particularly important to improve the efficiency and accuracy of alloy material research and development, reduce the influence of subjective factors in material analysis, and promote innovative development in the field of materials science, providing strong support for optimizing the performance and expanding the applications of alloy materials.
With the rapid development of deep learning technology, numerous research papers [3–14] have achieved significant results in image segmentation tasks. Ronneberger et al. [3] proposed an innovative end-to-end U-shaped network (U-Net), which cleverly combines an encoding and decoding structure and introduces a skip connection mechanism to effectively integrate shallow and deep spatial information, significantly improving segmentation accuracy. Kim et al. [4] developed an efficient data mining technology that utilizes texture analysis filters for feature extraction and combines BGMM clustering methods to achieve precise segmentation of low carbon steel microstructure images acquired under different imaging conditions. Azimi et al. [5] used a maximum voting strategy to innovatively construct the MVFCNN model, which significantly improves the segmentation performance of steel microstructure images by retaining discriminative texture information that is closely related to the microstructure category. Strohmann et al. [6] designed a unique pixel-wise weighted loss function that assigns higher weights to silicon and silicon-aluminum alloy interphase regions in aluminum-silicon alloys, thereby enhancing the model’s focus on microstructure-related regions and effectively improving the segmentation performance of aluminum-silicon alloy microstructure images. Ma et al. [7] proposed a symmetric overlapping tiling strategy for the segmentation of high-resolution microstructure images of Al-La alloys, while addressing the issue of contamination formed during sample preparation by further introducing a symmetric correction strategy, effectively eliminating model errors caused by contamination. In addition, Liu et al. [8] proposed a weighted neural network model for detecting boundary in polycrystalline microstructure images. The model guides the network to focus on the geometric and topological features of grains by customizing adaptive boundary weights for each pixel in the grain, thus achieving high-precision boundary detection. Zhao et al. [9] proposed a two-stage neural network construction method for the classification and segmentation of titanium alloy microstructure features. The model can automatically extract and compute titanium alloy feature parameters, providing powerful support for in-depth research on titanium alloys. Chen et al. [10] incorporated three different visual attention mechanisms into the basic model to investigate the impact of visual attention mechanisms on steel microstructure segmentation performance, providing new ideas for improving steel microstructure segmentation accuracy. For the segmentation of material microstructure images with blurred boundary, Lai et al. [11] proposed two targeted methods: for materials with a certain number of sample microstructure images, feature extraction using machine learning methods is used for effective segmentation; for images with very blurred boundary, graph-theoretic complex network methods are used to significantly improve the segmentation performance of blurred boundary material microstructure images. Panda et al. [12] used generative adversarial models for steel microstructure image segmentation, which can accurately identify different grains and mark the grain boundary. Considering the scarcity of existing literature on steel microstructure image data, they further proposed a convolutional neural network-based framework for generating enough real label data to assist in steel microstructure image segmentation tasks. Chen et al. [13] innovatively proposed an instance segmentation framework for aluminum alloy microstructure images by combining different loss functions. The framework can achieve automatic instance segmentation of aluminum alloy microstructure images, providing a powerful tool for in-depth research on aluminum alloys. Zhang et al. [14] proposed an improved and optimized nonlocal attention module for the difficult problem of segmenting the non-cutting phase in alloy material microstructure images. The method effectively improves the segmentation accuracy and robustness of high-temperature alloy microstructure images by reusing and stacking similarity matrices from different angles.
In the field of metal materials, aluminum-silicon alloys have attracted much attention for their excellent performance and wide range of applications, especially in key industries such as automobiles, electronics, and aerospace [15]. The main reason for their popularity is their low thermal expansion coefficient and excellent wear resistance, which maintain stable performance in a complex working environment. However, the realization of these excellent properties mainly depends on the size, shape, and distribution of primary silicon particles in the microstructure of aluminum-silicon alloys. Therefore, in-depth quantitative analysis of the microstructure of aluminum-silicon alloys is particularly important, and accurately defining the primary silicon particles in the microstructure is a key prerequisite and foundation for achieving this analysis goal.
Currently, image segmentation techniques based on fully supervised learning have demonstrated significant effectiveness in automatic segmentation of microstructure images of Al-Si alloys. However, fully supervised models still face two major challenges in the training process. Firstly, the training of the model requires a large amount of labeled images of Al-Si alloy microstructure, which often contain numerous differently shaped primary silicon particles. Therefore, annotating all primary silicon particles in pixels with fine detail is not only a time-consuming and labor-intensive task, but also poses certain difficulties for practical applications. Secondly, during the training process, the model may sometimes make false positives by incorrectly identifying two or more originally independent primary silicon particles as a single particle. This type of misclassification can directly affect subsequent quantitative analysis of the alloy microstructure, leading to significant errors.
In the field of semi-supervised image segmentation, where only a subset of training images has complete pixel-level labels, while most images are unlabeled, utilizing these unlabeled images can improve model accuracy and generalization ability. In recent years, various semi-supervised learning-based image segmentation methods have been proposed [16–21]. Among them, Luo et al. [16] developed a semi-supervised image segmentation technique called Uniformity Regularization Pyramid Consistency (URPC) inspired by the pyramid feature network. The method guides the model to learn useful information from unlabeled data by minimizing the difference between each pyramid prediction and its average value. In addition, Yu et al. [17] proposed an uncertainty-aware self-ensembling mean teacher framework (UA-MT) for semi-supervised LA segmentation, enabling the student model to gradually learn from meaningful and reliable targets using uncertainty information. Tarvainen and Valpola [18] proposed the Mean Teacher model (MT), which consists of a student model and a teacher model with the same network architecture. The teacher model is updated using an exponential moving average (EMA) scheme. For labeled data, the student model receives supervision from the labels; for unlabeled data, the student model learns from the teacher model’s output and strives to produce similar outputs. Luo et al. [19] proposed a dual task consistency semi-supervised segmentation framework that combines pixel-level classification and level set function regression tasks. This framework can fully leverage unlabeled data and effectively capture global shape information. Li et al. [20] proposed a Hierarchical Consistency Regularization Mean Teacher framework (HCMT), which applies consistency regularization to the outputs of the student model through multi-scale deep supervision and hierarchical optimization to achieve more reliable output results. Additionally, Li et al. [21] proposed a novel shape-aware semi-supervised segmentation strategy (SASS) that aims to fully leverage unlabeled data and impose geometric shape constraints on segmentation output. This method introduces an adversarial loss between predictions of labeled and unlabeled data to enable the network to more effectively capture shape-aware features.
Based on the above discussion, effectively utilizing unlabeled data to prevent it from being mistakenly regarded as noise and enhancing the efficiency and generalization ability of image segmentation models has become a core issue of semi-supervised image segmentation research. Especially in the field of aluminum-silicon alloy microstructure image processing, existing network models face significant challenges when processing adjacent primary silicon particles, which easily lead to phenomenon between particles. To address this, this paper proposes two solutions. Firstly, an innovative semi-supervised segmentation framework is proposed. This framework performs multi-angle rotation processing on aluminum-silicon alloy microstructure image data and inputs it into the model for computation. Subsequently, the rotated data is inversely operated, and the mean value is calculated, followed by using a confidence filtering mechanism to generate a confidence weight map. This weight map is used to weight loss and guide the model to focus more on regions with higher confidence, thereby significantly improving the segmentation quality and generalization performance of the model. Secondly, a carefully designed boundary enhancement module is proposed. This module can effectively guide the model to pay more attention to the boundary regions of adjacent primary silicon particles. Through this design, the model can more accurately separate adjacent primary silicon particles, significantly improve the boundary segmentation effect of primary silicon particles, and effectively reduce sticking between neighboring particles. In summary, the main contributions of this paper include:
(1) A rotational uncertainty correction strategy (RUCS) was proposed and implemented, which was deeply integrated into the loss function. The loss calculation was optimized through a dynamic weighting mechanism to improve the generalization ability of the model, greatly reducing the pressure of manual annotation of silicon particles in aluminum-silicon alloy microstructure images.
(2) A boundary enhancement module (BEM) was designed and implemented. By strengthening boundary feature extraction and refinement processing, the segmentation accuracy of the silicon particle boundary was significantly improved, and the adhesion phenomenon between adjacent particles was effectively reduced.
(3) System experimental verification was carried out on the aluminum-silicon alloy microstructure Image dataset (ASAD). When only 5% of the labeled data is used, compared with the existing optimal semi-supervised model, the Jac and ARI indicators of the proposed model are improved by 2.84 and 1.57 percentage points, respectively, and the VI is reduced by 8.65, and the performance is close to the level of 10% labeled data; when the labeled data reaches 10%, Jac and ARI are improved by 0.41 and 0.35 percentage points, respectively, and the VI is reduced by 3.44 percentage points. In some scenarios, the performance exceeds the model trained with 20% labeled data. The experimental results strongly prove the effectiveness and significant superiority of the proposed method.
To better illustrate the training process of the model, first set a training set D, which contains a labeled image set L and an unlabeled image set U, where L is much smaller than U. Represent the labeled image set and the unlabeled image set respectively as DL = {(x_i, y_i), i = 1, …, L} and DU = {x_i, i = L + 1, L + U}. The final training set is represented by the set D = DL + DU, where x represents the input image and y represents the corresponding segmentation label image.
Secondly, a student-teacher model is constructed, where the teacher model and student model have the same structure but do not perform backpropagation. After supervised learning, the student model obtains parameters θ, which are passed through a moving average weighted EMA to the teacher model. The parameters of the teacher model are the average of the student model’s parameters obtained from several consecutive iterations, as shown in Eq. (1). The parameters θ′ of the teacher model at iteration t during training are as follows:
In this paper, the hyperparameter α controls the decay rate of EMA and is set to 0.99. The teacher model uses the EMA weights of the student model instead of sharing weights with the student model, because EMA can summarize all learned information after each iteration and stabilize the training process by smoothing weight fluctuations, thereby effectively improving model performance. In addition, since EMA improves the output quality of all layers (not just the last layer), the model can more accurately represent mid-level and high-level semantic information.
Fig. 1 presents the semi-supervised segmentation framework (RUCS-BE-MT) for aluminum-silicon alloy microstructure images, whose core consists of the segmentation network BE-Unet, Boundary Enhancement Module (BEM), and Rotational Uncertainty Correction Strategy (RUCS). In terms of data processing logic, the Mean Teacher (MT) generates unlabeled samples solely through simple perturbations such as flipping and cropping, relying on EMA smoothing to maintain training stability but failing to assess the prediction reliability of perturbed samples. Although UAMT incorporates uncertainty filtering based on single-view prediction entropy, it still does not address the measurement issue of “multi-view prediction consistency”. To tackle this problem, the RUCS strategy in the proposed framework generates four-angle samples via rotational perturbations. After independent forward propagation and inverse rotation correction, uncertainty is defined based on multi-view prediction consistency, enabling more accurate selection of unlabeled data. In terms of feature extraction, both MT and UAMT adopt the basic U-Net architecture, only recovering details through skip connections, which makes it difficult to capture the blurry grain boundary in aluminum-silicon alloys. In contrast, BE-Unet integrates the BEM module, featuring a design of “extracting boundary features via erosion difference and expanding receptive fields through multi-scale dilated convolution”, which targeted enhances the discriminability of boundary features. Based on the designs, the framework simultaneously achieves “unlabeled data quality control” and “boundary feature enhancement”. The design details, theoretical foundations, and operational mechanisms of each core component will be elaborated on sequentially in the subsequent sections.
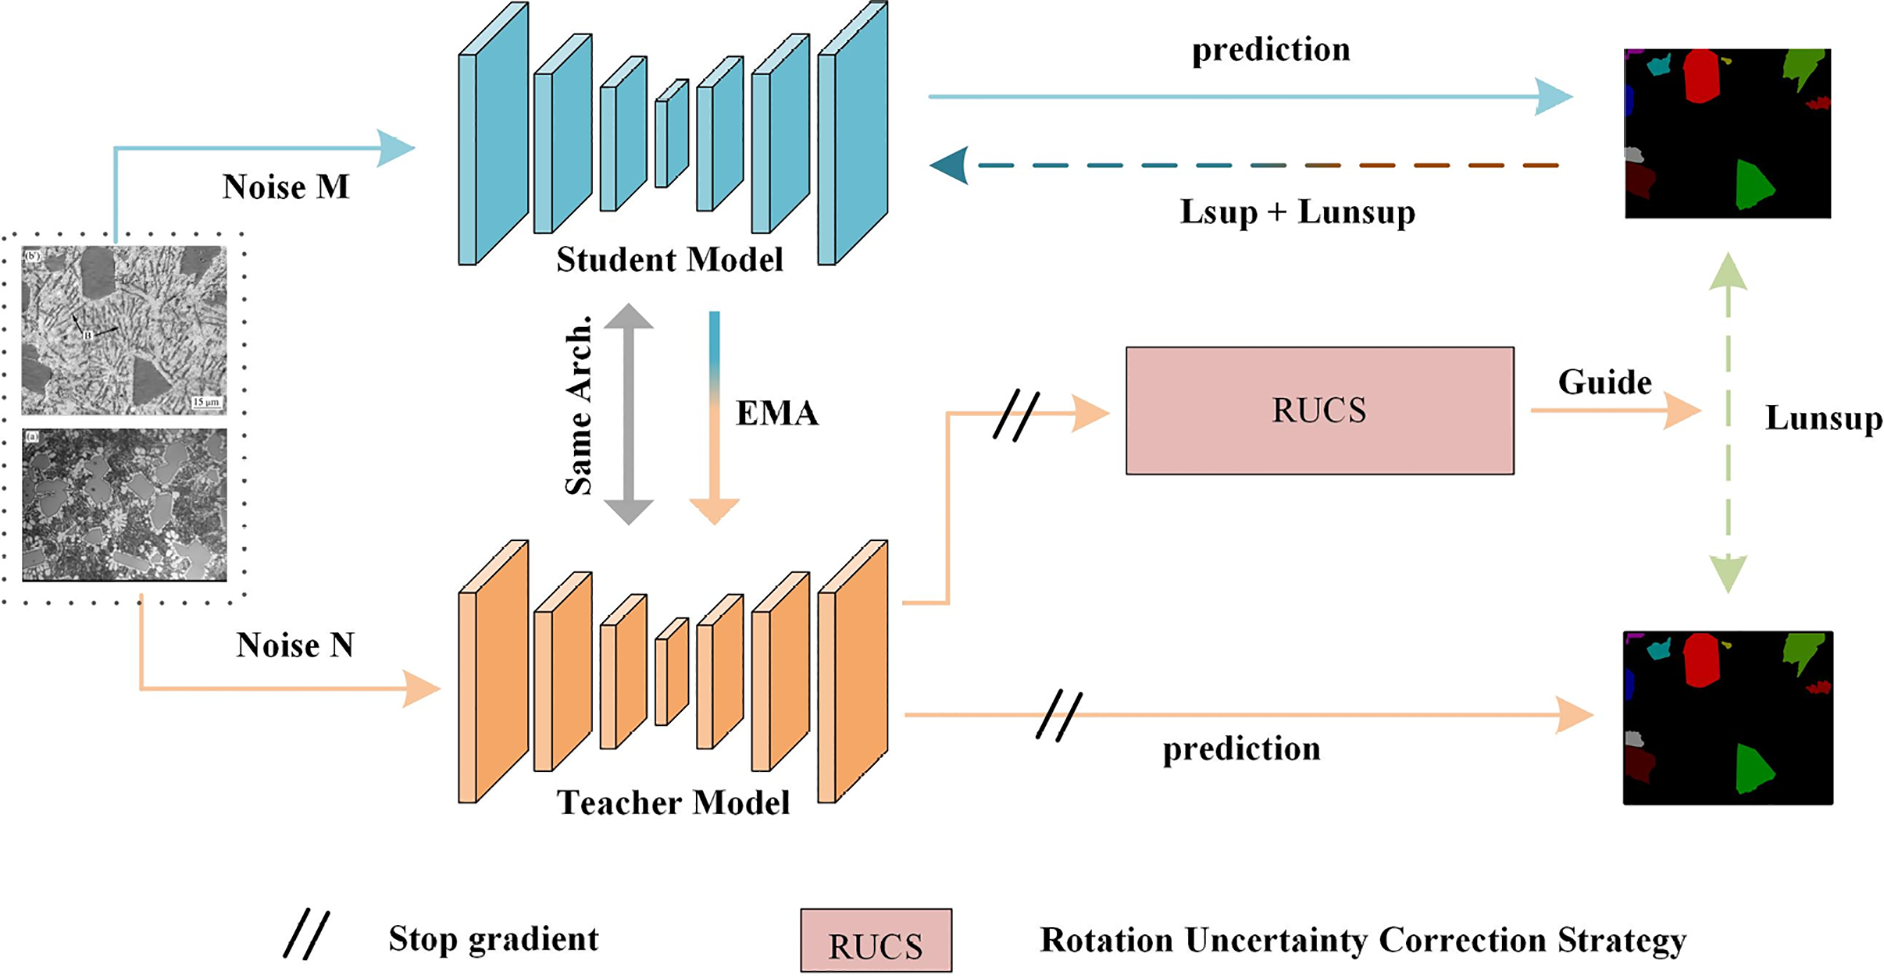
Figure 1: Overall architecture diagram of RUCS-BE-MT
Due to the powerful capabilities demonstrated by U-Net in the field of image segmentation, we use U-Net as the basic segmentation model and embed a BEM into it, as shown in Fig. 2. BE-Unet consists of an encoder (shown on the left side of Fig. 2) and a decoder (shown on the right side of Fig. 2). The encoder part is composed of 10 convolution blocks with 3 convolution kernels and 4 max pooling layers, where the convolution blocks are responsible for extracting potential features from the image, and the max pooling layers are responsible for downsampling the image to reduce its resolution and accelerate network training. The decoder part consists of eight convolution blocks with three convolution kernels, four bilinear interpolation blocks, four BEMs, and one convolution block with a kernel size of one. The bilinear interpolation blocks are responsible for upsampling the image from a low resolution to a high resolution, gradually restoring it to the same size as the input image. The convolution block with a kernel size of one is responsible for outputting the final segmentation result. In BE-Unet, the skip connections between the encoder and decoder are used to alleviate information loss caused by downsampling operations, which is useful for recovering the details of primary silicon particles in aluminum-silicon alloys microstructure.
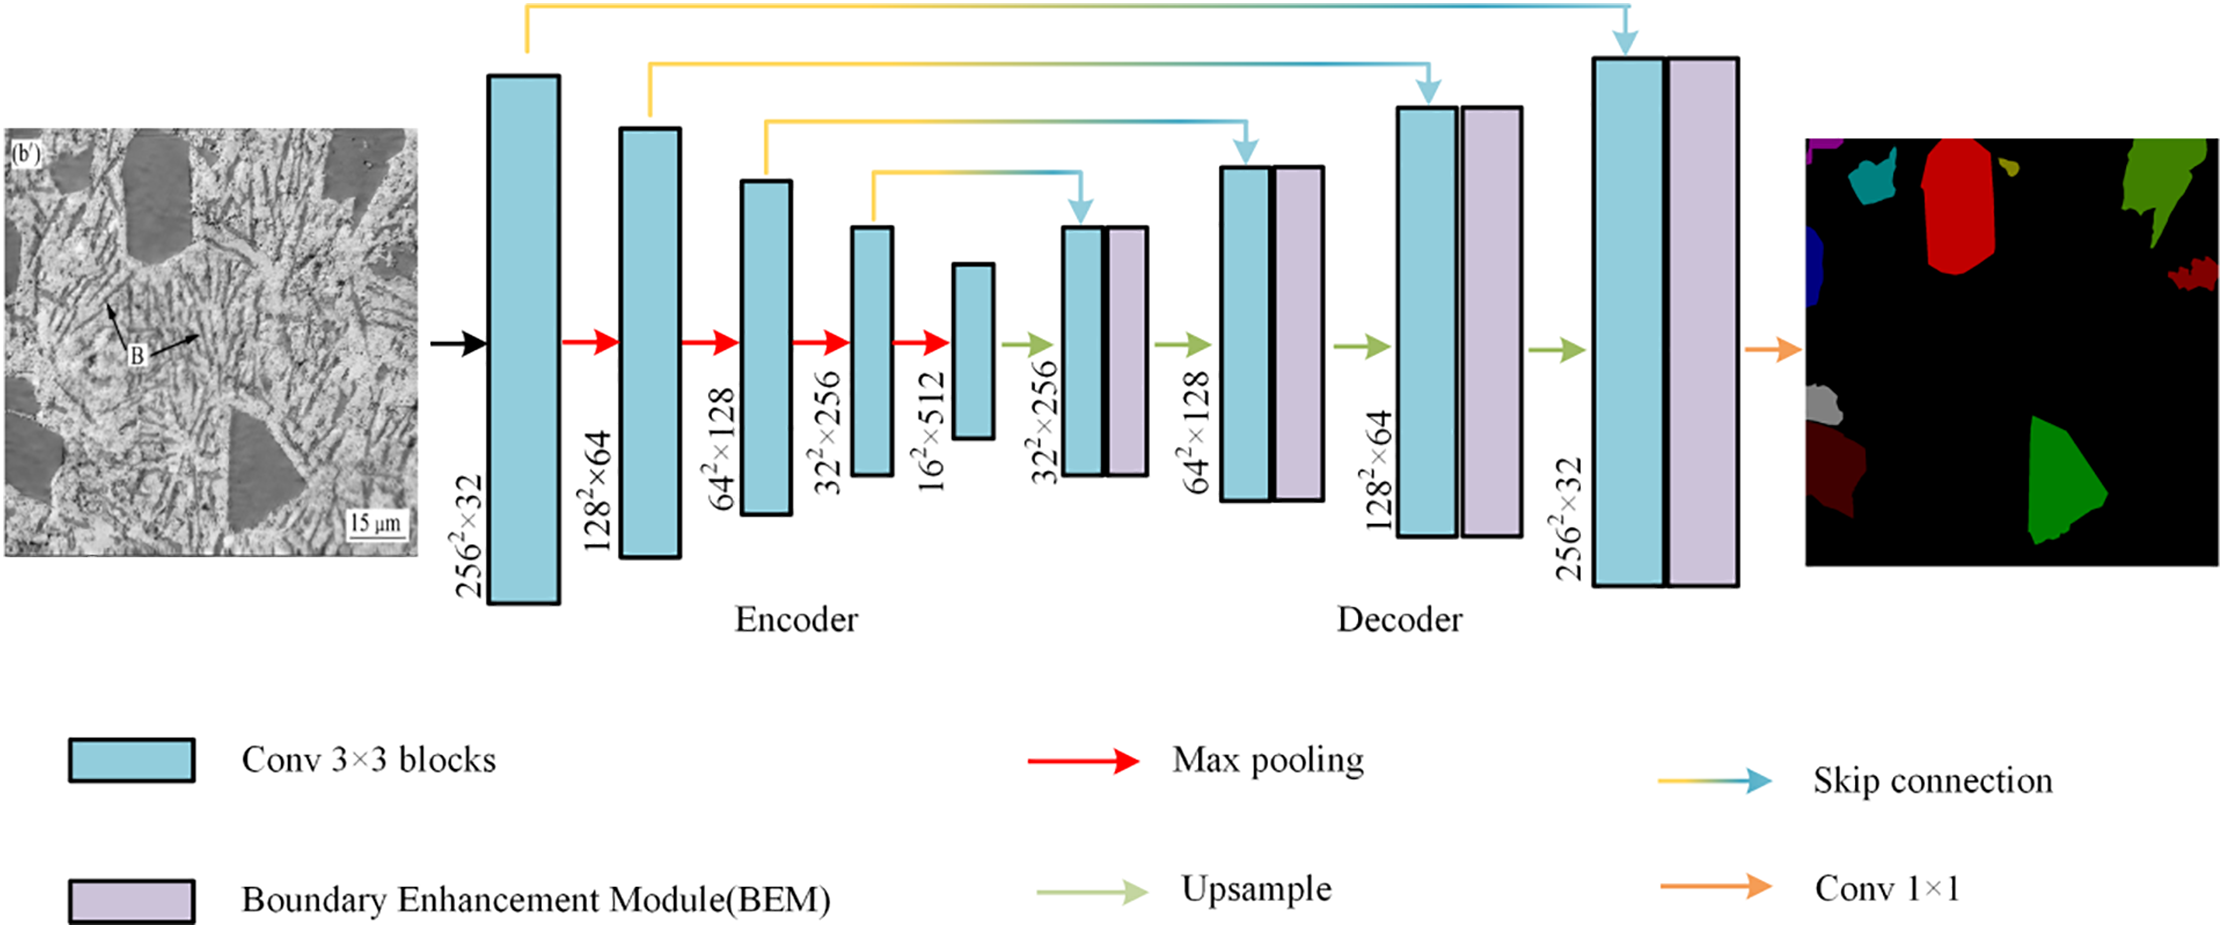
Figure 2: Overall architecture diagram of BE-Unet model
As shown in Fig. 3, we present the detailed structure of BEM, which includes two main steps: boundary extraction and boundary enhancement. First, boundary extraction is performed by simulating the erosion effect through a max pooling operation, which reduces the size of primary silicon particles, and then obtains the boundary features of primary silicon particles by subtracting the erosion feature map from the original feature map. To achieve the hierarchical extraction of boundary features of primary silicon particles, this study introduces dilated convolutions with dilation rates of 1, 3, 5, and 7, with reference to the convolutional module PMCB proposed by Fu et al. [22]. Such an increasing configuration enables efficient capture and integration of multi-scale features while controlling computational overhead, thus effectively capturing multi-scale feature information ranging from the fine edges of particles to the agglomerated regions. We also performed channel fusion to increase feature dimension and obtain richer feature expression, followed by max pooling and average pooling operations on the fused features to preserve the most prominent features within each channel and consider information from the entire channel feature map more evenly, respectively. Subsequently, we added pixels one by one to combine the advantages of both methods, normalized them using a sigmoid function to restrict the value range to zero to one, and multiplied them by a normalized boundary attention weight map to obtain weighted boundary features. Finally, we added them to the original feature map to integrate primary silicon particle information and obtained the enhanced boundary feature map of primary silicon particles. Specifically, by enhancing boundary features, the BEM enables the model to generate more distinct and sharper feature responses in the adherent regions of adjacent grains. This clarification at the feature level reduces the model’s prediction variance in these complex regions during subsequent Monte Carlo sampling of RUCS, thereby allowing the adaptive weight map generated by RUCS to more accurately identify boundary regions as “high confidence” regions. In turn, the strong gradient weights assigned to high-confidence regions by RUCS will further guide and strengthen the boundary feature extraction capability of the BEM during backpropagation.
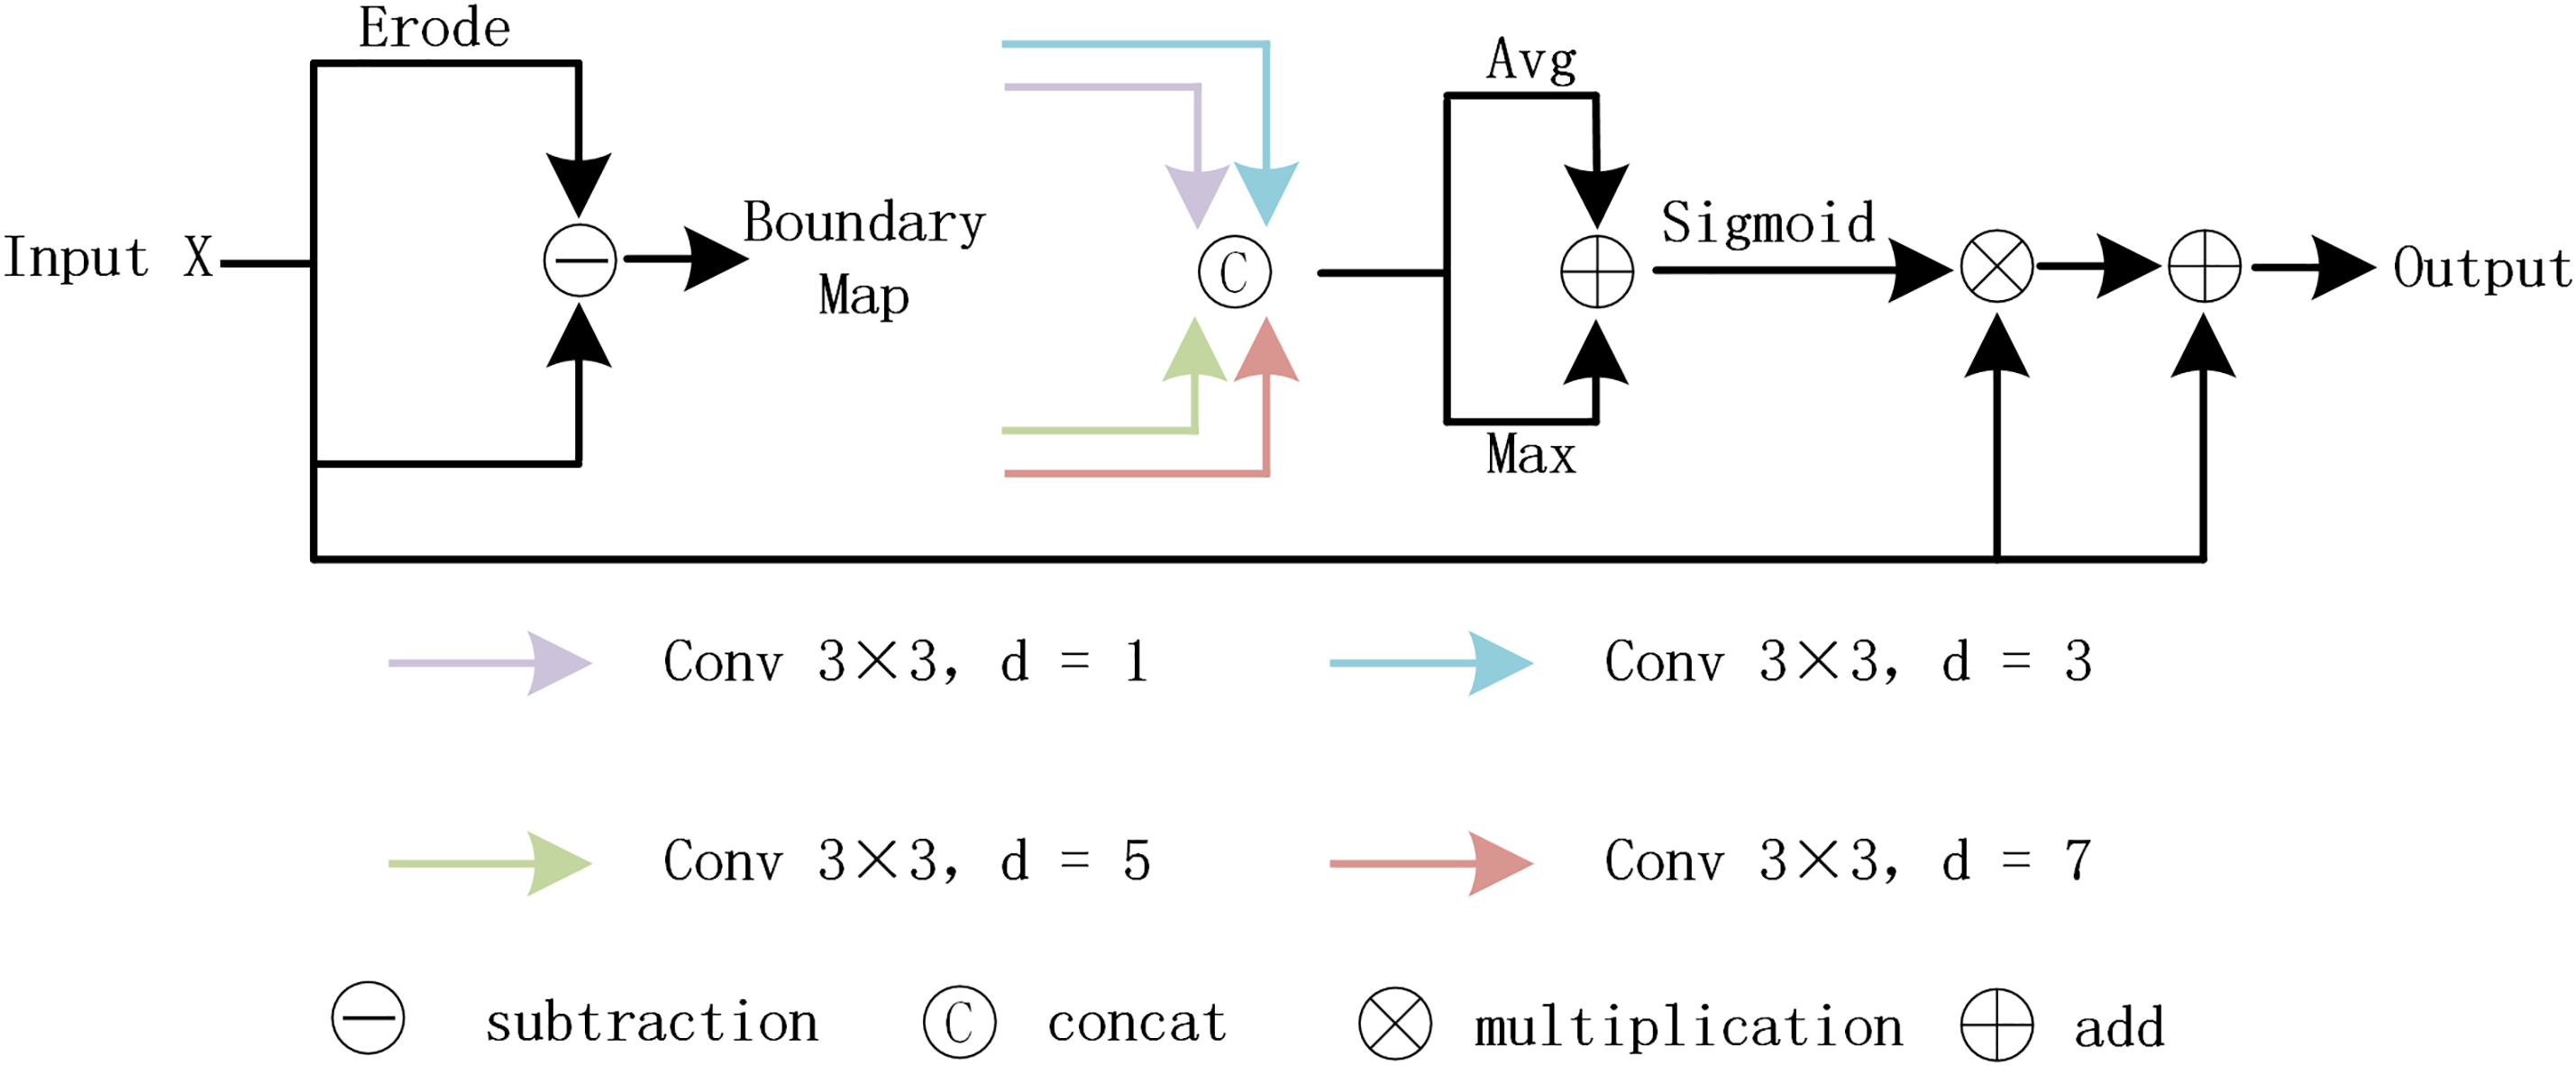
Figure 3: Overall architecture diagram of BEM
Semi-supervised learning aims to train models using a small amount of labeled data and a large volume of unlabeled data, and how to effectively utilize these data remains a key challenge in this field. The proposed RUCS is designed to increase the weight of deterministic regions in the model, enabling the model to gradually correct uncertain regions and enhance its robustness and generalization ability. This method integrates two key technologies in semi-supervised learning: the Monte Carlo algorithm and uncertainty estimation [23]. The Monte Carlo algorithm is a numerical method based on random sampling, which approximates the properties of target functions or probability distributions by leveraging the statistical characteristics of samples drawn from probability distributions; in semi-supervised learning, it is often used for multiple random forward propagations to statistically map the probability distribution of feature maps. Uncertainty estimation refers to the process of quantitatively evaluating the confidence or reliability of model prediction results—since semi-supervised learning models are typically trained on limited datasets, their parameter spaces are not fully constrained, leading to prediction uncertainty (i.e., the same input may produce different outputs). By quantifying the confidence of prediction results under different conditions, uncertainty estimation can weaken the supervisory contribution of low-confidence pixels and strengthen that of high-confidence pixels, thereby improving the model’s generalization ability.
Algorithm and uncertainty estimation, the specific structure of RUCS is illustrated in Fig. 4. Firstly, the aluminum-silicon alloy microstructure images are rotated by four angles (0°, 90°, 180°, 270°); due to the lack of rotation invariance in convolutional operations, the prediction results of rotated images input into the model are inconsistent with those of the original image, and this characteristic is utilized to introduce feature perturbations consistent with the data distribution into the model. The forward propagation process of the four rotated images is equivalent to unbiased Monte Carlo sampling from the model’s prediction distribution—where the joint distribution of sampling results is consistent with the model’s true prediction distribution. By calculating the mean of the sampling results (i.e., the segmentation probability maps corresponding to each rotation angle), the pixel-wise predicted expected value is obtained; meanwhile, Kullback-Leibler (KL) divergence is used to quantify pixel-wise prediction uncertainty, specifically by computing the KL divergence between the predicted probability distribution of each single rotation angle and the mean distribution. A larger KL divergence value indicates a more significant difference between the single-angle prediction and the average prediction, corresponding to high-uncertainty regions such as blurry boundary or confusing adjacent grains, while a smaller value represents stable predictions and high confidence. Subsequently, based on the KL divergence results, an exponential decay function is used to generate a continuous pixel-wise confidence weight map (instead of the traditional fixed-threshold binary map), which smoothly maps the uncertainty to the interval [0, 1]: high-confidence pixels (with low KL divergence) correspond to weights approaching 1, and low-confidence pixels (with high KL divergence) correspond to weights approaching 0, realizing adaptive quantification of pixel confidence. This weight map is then integrated into the loss function to perform pixel-wise weighting of the unsupervised consistency loss—enhancing the gradient feedback of high-confidence regions during backpropagation while suppressing the interference signals from low-confidence regions. This adaptive weight mechanism without fixed thresholds not only avoids the rigid segmentation problem caused by fixed thresholds but also has strong tolerance to sampling noise and calculation errors due to the unbiasedness of Monte Carlo sampling and the smoothness of the exponential decay function, significantly enhancing the robustness of the model under limited labeled data and effectively alleviating the confirmation bias problem in semi-supervised learning.
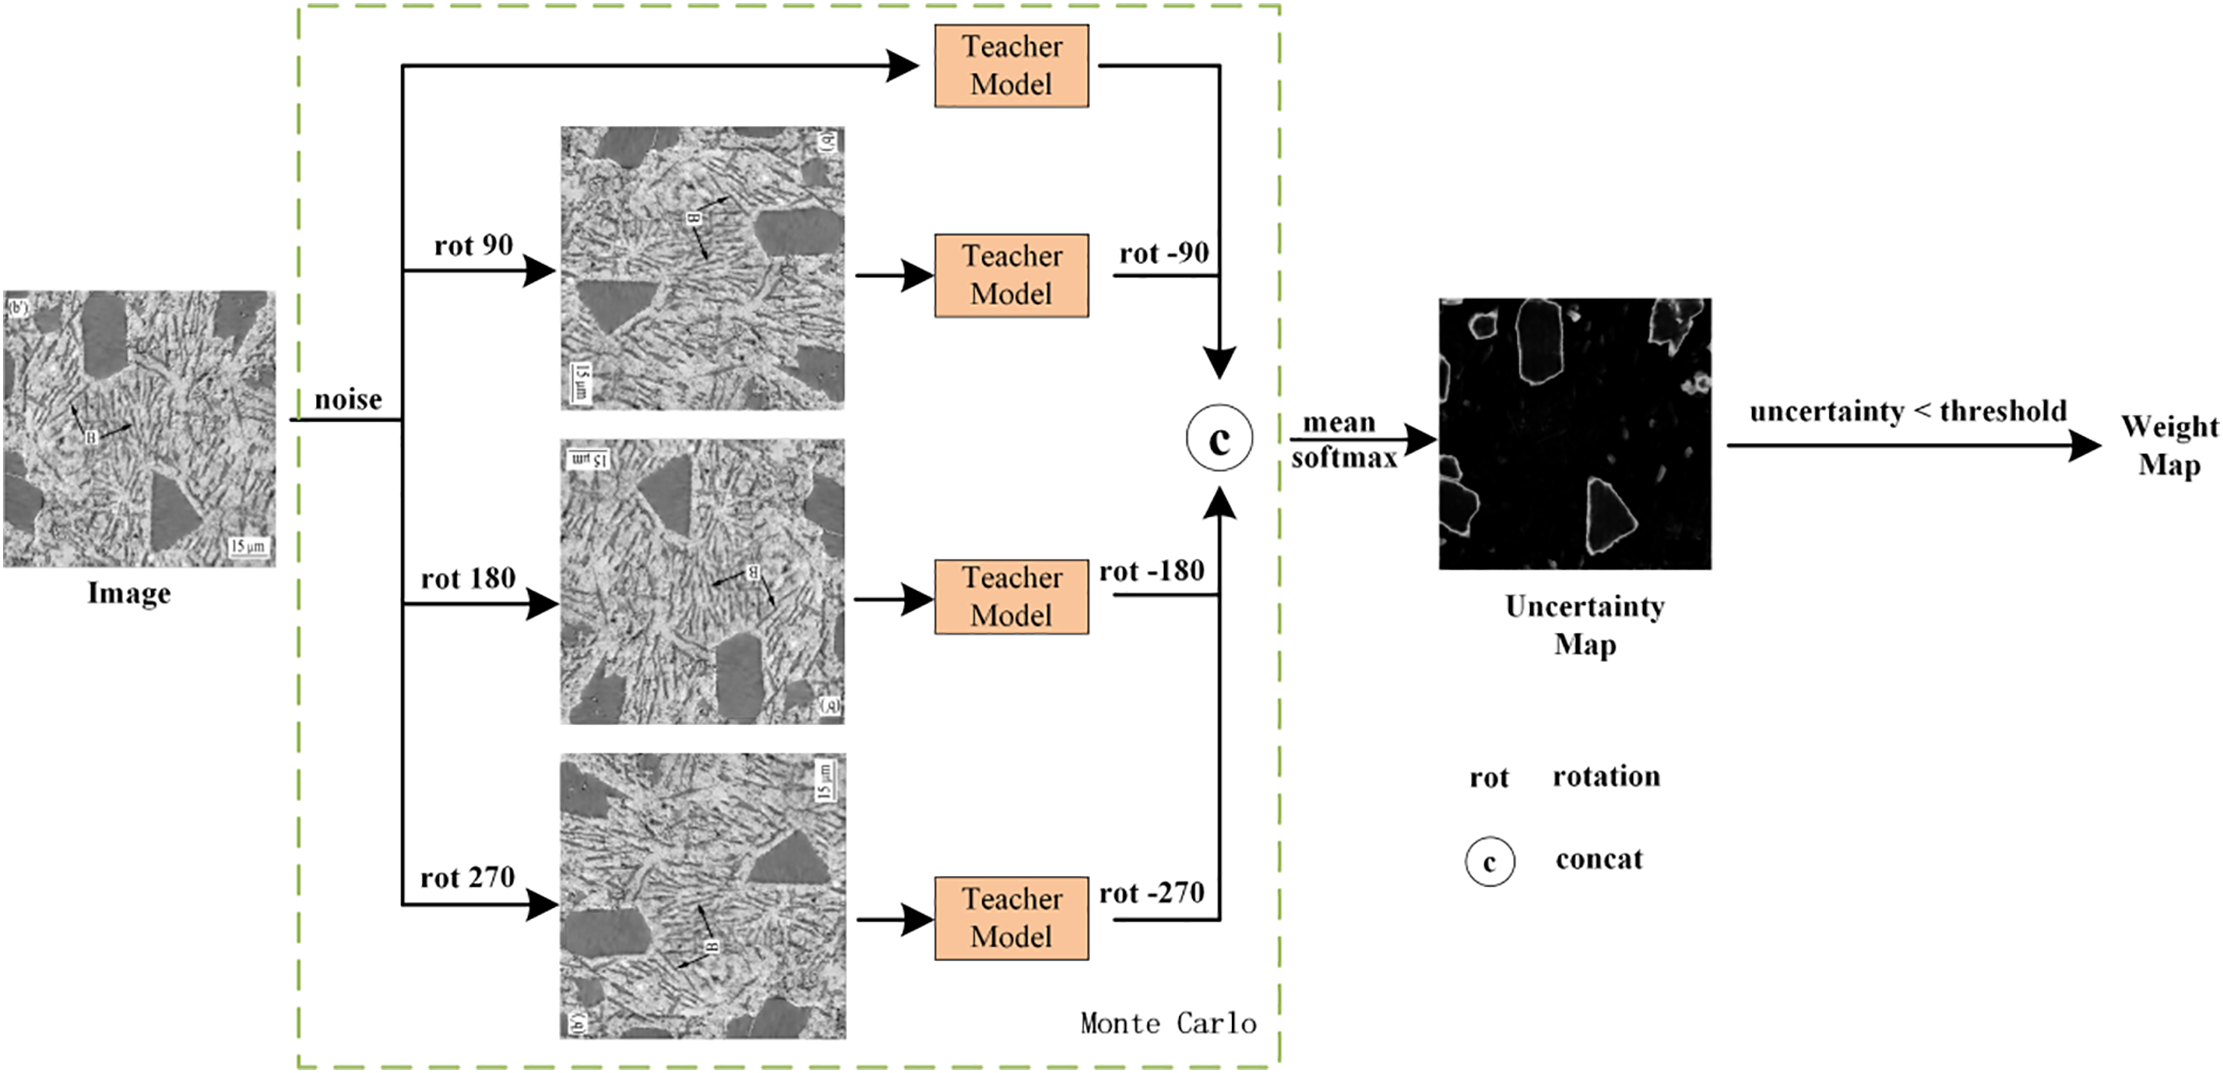
Figure 4: Overall architecture diagram of RUCS
The loss function is used to measure the difference between the predicted value and the true value. In our framework, we divide the loss function into labeled loss and unlabeled loss, where labeled data uses Dice loss and Cross-Entropy loss as a mixed supervision loss for pixel-level segmentation prediction tasks. For unlabeled data, we encourage models to have consistent output across different perturbations, and adopt the mean squared error (MSE) loss function. We attach the weight map obtained from the RUCS to the loss function and weight both the labeled and unlabeled image loss functions simultaneously. Specifically, the definition is as follows:
where W represents weight graph,
Due to the weighting filter removing low-confidence pixels, adding extra weight to the loss function allows the model to amplify the loss in high-confidence regions of the primary silicon particles, resulting in a greater loss that promotes the propagation of more significant gradients during training, thus facilitating feature learning in these regions. This provides the student model with more reliable supervision, improves its robustness compared to the framework, and in turn encourages the teacher model to generate more reliable output and make better use of unlabeled data to improve model performance.
In this section, we first describe the microstructure semi-supervised segmentation dataset of aluminum-silicon alloys, implementation details, and evaluation metrics. Then, we verify the effectiveness of the proposed boundary enhancement module and rotation uncertainty correction strategy through extensive experiments. Finally, we evaluate several state-of-the-art methods on the microstructure semi-supervised segmentation dataset of aluminum-silicon alloys.
Microstructure images of aluminum-silicon alloys are derived from experimental studies conducted by professionals in the materials field. These images have low confidentiality and favorable sharing attributes. In addition, many relevant image resources are included in academic literature. Therefore, we extracted and screened 500 images from aluminum-silicon alloy-related academic literature to construct the Aluminum-Silicon Alloy Microstructure semi-supervised segmentation dataset. The original resolution of the images in this dataset ranges from 300 × 300 to 800 × 800 pixels. To recover the detailed features of the microstructure, all images are unsampled by 2× using bicubic interpolation. For the annotation phase, the CVAT (Computer Vision Annotation Tool) is adopted for pixel-wise annotation. During the annotation process, the polygonal annotation function of the tool is utilized for fine pixel-wise delineation along the true boundaries of primary silicon particles. After annotation completion, the results are reviewed and revised by professional researchers in the materials field to ensure the accuracy and consistency of the annotation. In the experiment, the dataset is divided into a training set, a validation set, and a test set in an 8:1:1 ratio.
The experimental environment is Ubuntu 20.04 operating system, a NVIDIA GeForce RTX 4090 GPU with 24 GB of memory, and a deep learning framework of PyTorch. We use a random gradient descent optimizer with a momentum of 0.9 and an initial learning rate of 0.001, which is trained for 30,000 iterations. The batch size for each iteration is set to 4, containing two labeled images and two unlabeled images. Weight decay is set to 0.0001 to combat overfitting. For fairness in the experiment, we only perform rotation and flipping data augmentation on the training images, and to facilitate training, we uniformly randomly crop the training images to a size of 256 × 256.
We select Jaccard similarity coefficient (Jac) [24], adjusted rand index (ARI) [25], and variation of information (VI) [26] as indicators to objectively evaluate the effectiveness of the proposed method. ARI and VI are based on clustering-based evaluation methods, and due to the consideration of topological characteristics of microstructure organization during execution, they are suitable for tasks in material microstructure image analysis that require quantitative characterization of statistical dimensions and shape distribution of microstructure [27]. The Jaccard coefficient is calculated using the following formula:
In this formula, TP represents the number of correctly predicted positive samples, FP represents the number of incorrectly predicted positive samples, TN represents the number of correctly predicted negative samples, and FN represents the number of incorrectly predicted negative samples.
The adjusted rand index is calculated using the following formula:
Given two divisions of a set S containing m elements, S is divided into r subsets (true partitioning result):
The variation of information is calculated using the following formula:
Specifically,
We incorporated the RUCS method and BEM module into our base model, and conducted semi-supervised segmentation experiments using 5% and 10% labeled data with the results validated on the validation set. Our base model is based on the Unet architecture and trained solely with labeled data without using unlabeled data. When we incorporated the RUCS method into the model, we introduced a large amount of unlabeled data that allowed the model to see rich features, and as shown in the experimental results (Table 1), the Jaccard and ARI indices significantly increased, indicating that the overall segmentation ability of the model had been enhanced, while the VI index decreased significantly, indicating that the overall performance of the model had improved, resulting in improved segmentation accuracy for adjacent primary silicon particles. When we added the BEM module, the Jaccard and ARI indices further improved in both 5% and 10% labeled data scenarios, but in the 5% labeled data scenario, the VI index did not further decrease but instead increased. This is because the amount of labeled data is relatively small while the proportion of unlabeled data is excessively high, leading to a decline in the model’s boundary optimization capability. After enhancing the boundary of the labeled data, we improved their weight during the model’s backpropagation process to enhance boundary segmentation performance. However, for unlabeled data, due to the lack of completely accurate label maps to supervise the predicted feature maps, their boundary segmentation effect is susceptible to interference from unlabeled data, and the specific detected discrepancies are shown in the regions marked by red circles in Fig. 5 below. In the 10% labeled scenario, our VI index further decreased due to an increase in labeled data, allowing the model to optimize boundary primarily using labeled data, thus demonstrating further improvement in the recognition accuracy of adjacent primary silicon particles. Overall, based on the experimental results in Table 1, both our methods have improved model performance, proving the effectiveness of RUCS and BEM.
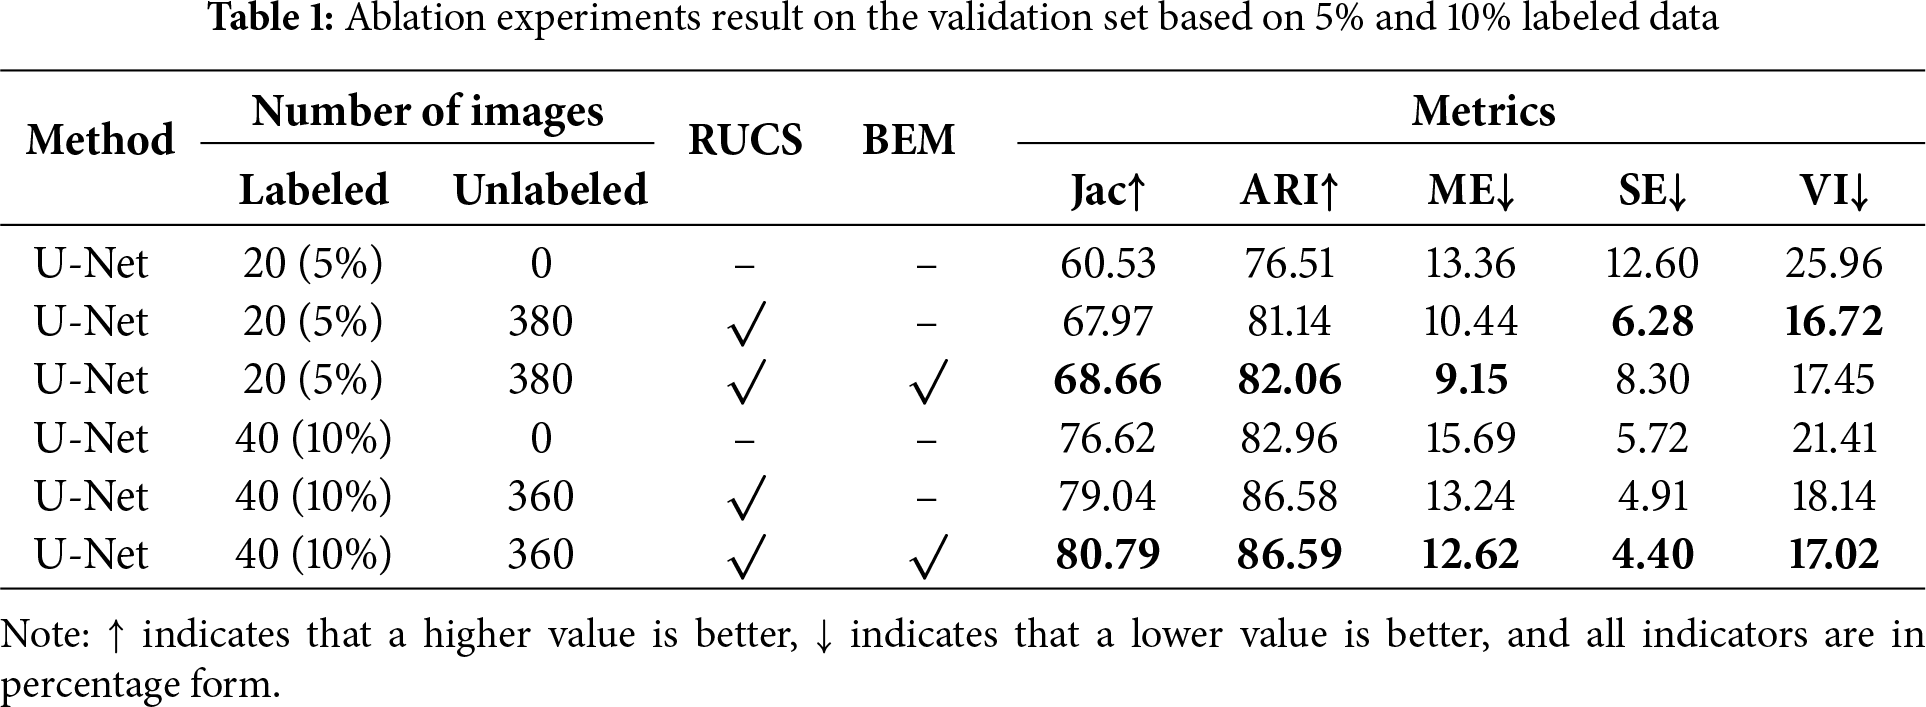
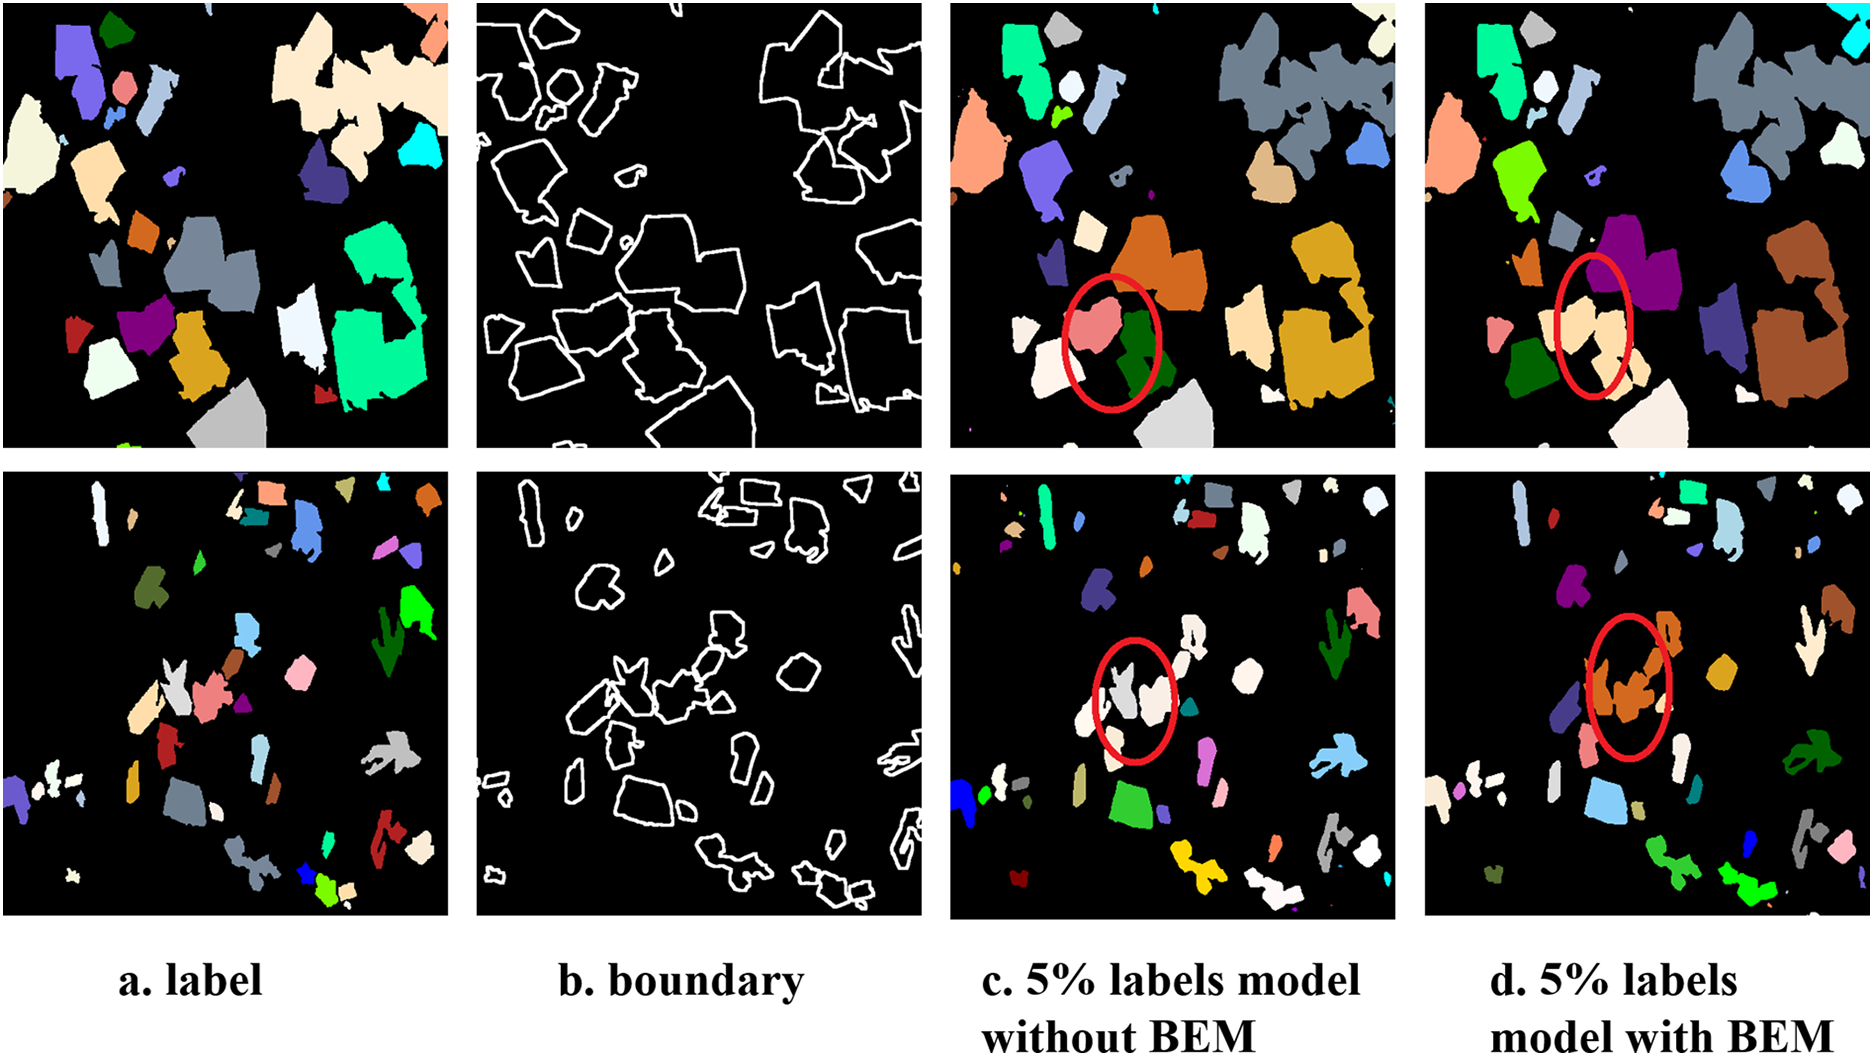
Figure 5: Comparison of segmentation results of the model with and without the BEM module under the 5% labeled data scenario
Table 2 presents the comparative experimental results based on 5% and 10% labeled data in the validation set, and added 20% of labeled data experimental results for a comprehensive comparison of all models, where we compare six leading semi-supervised segmentation models: MT [18], UAMT [17], HCMT [20], DTC [19], CCNET, FD-Unet [28], Fuse-Unet [29] and URPC [16]. These results demonstrate the effectiveness of semi-supervised segmentation methods, as almost all the semi-supervised segmentation methods outperform the baseline model. For MT and UAMT, however, their performance at 10% labeled data is not even as good as the baseline model. This could be due to the simple data perturbation on unlabeled data does not fully leverage the unlabeled data, and further processing is not performed on the noise generated by the unlabeled data, leading to more accumulated errors in the early stages of training and limiting the model’s performance.
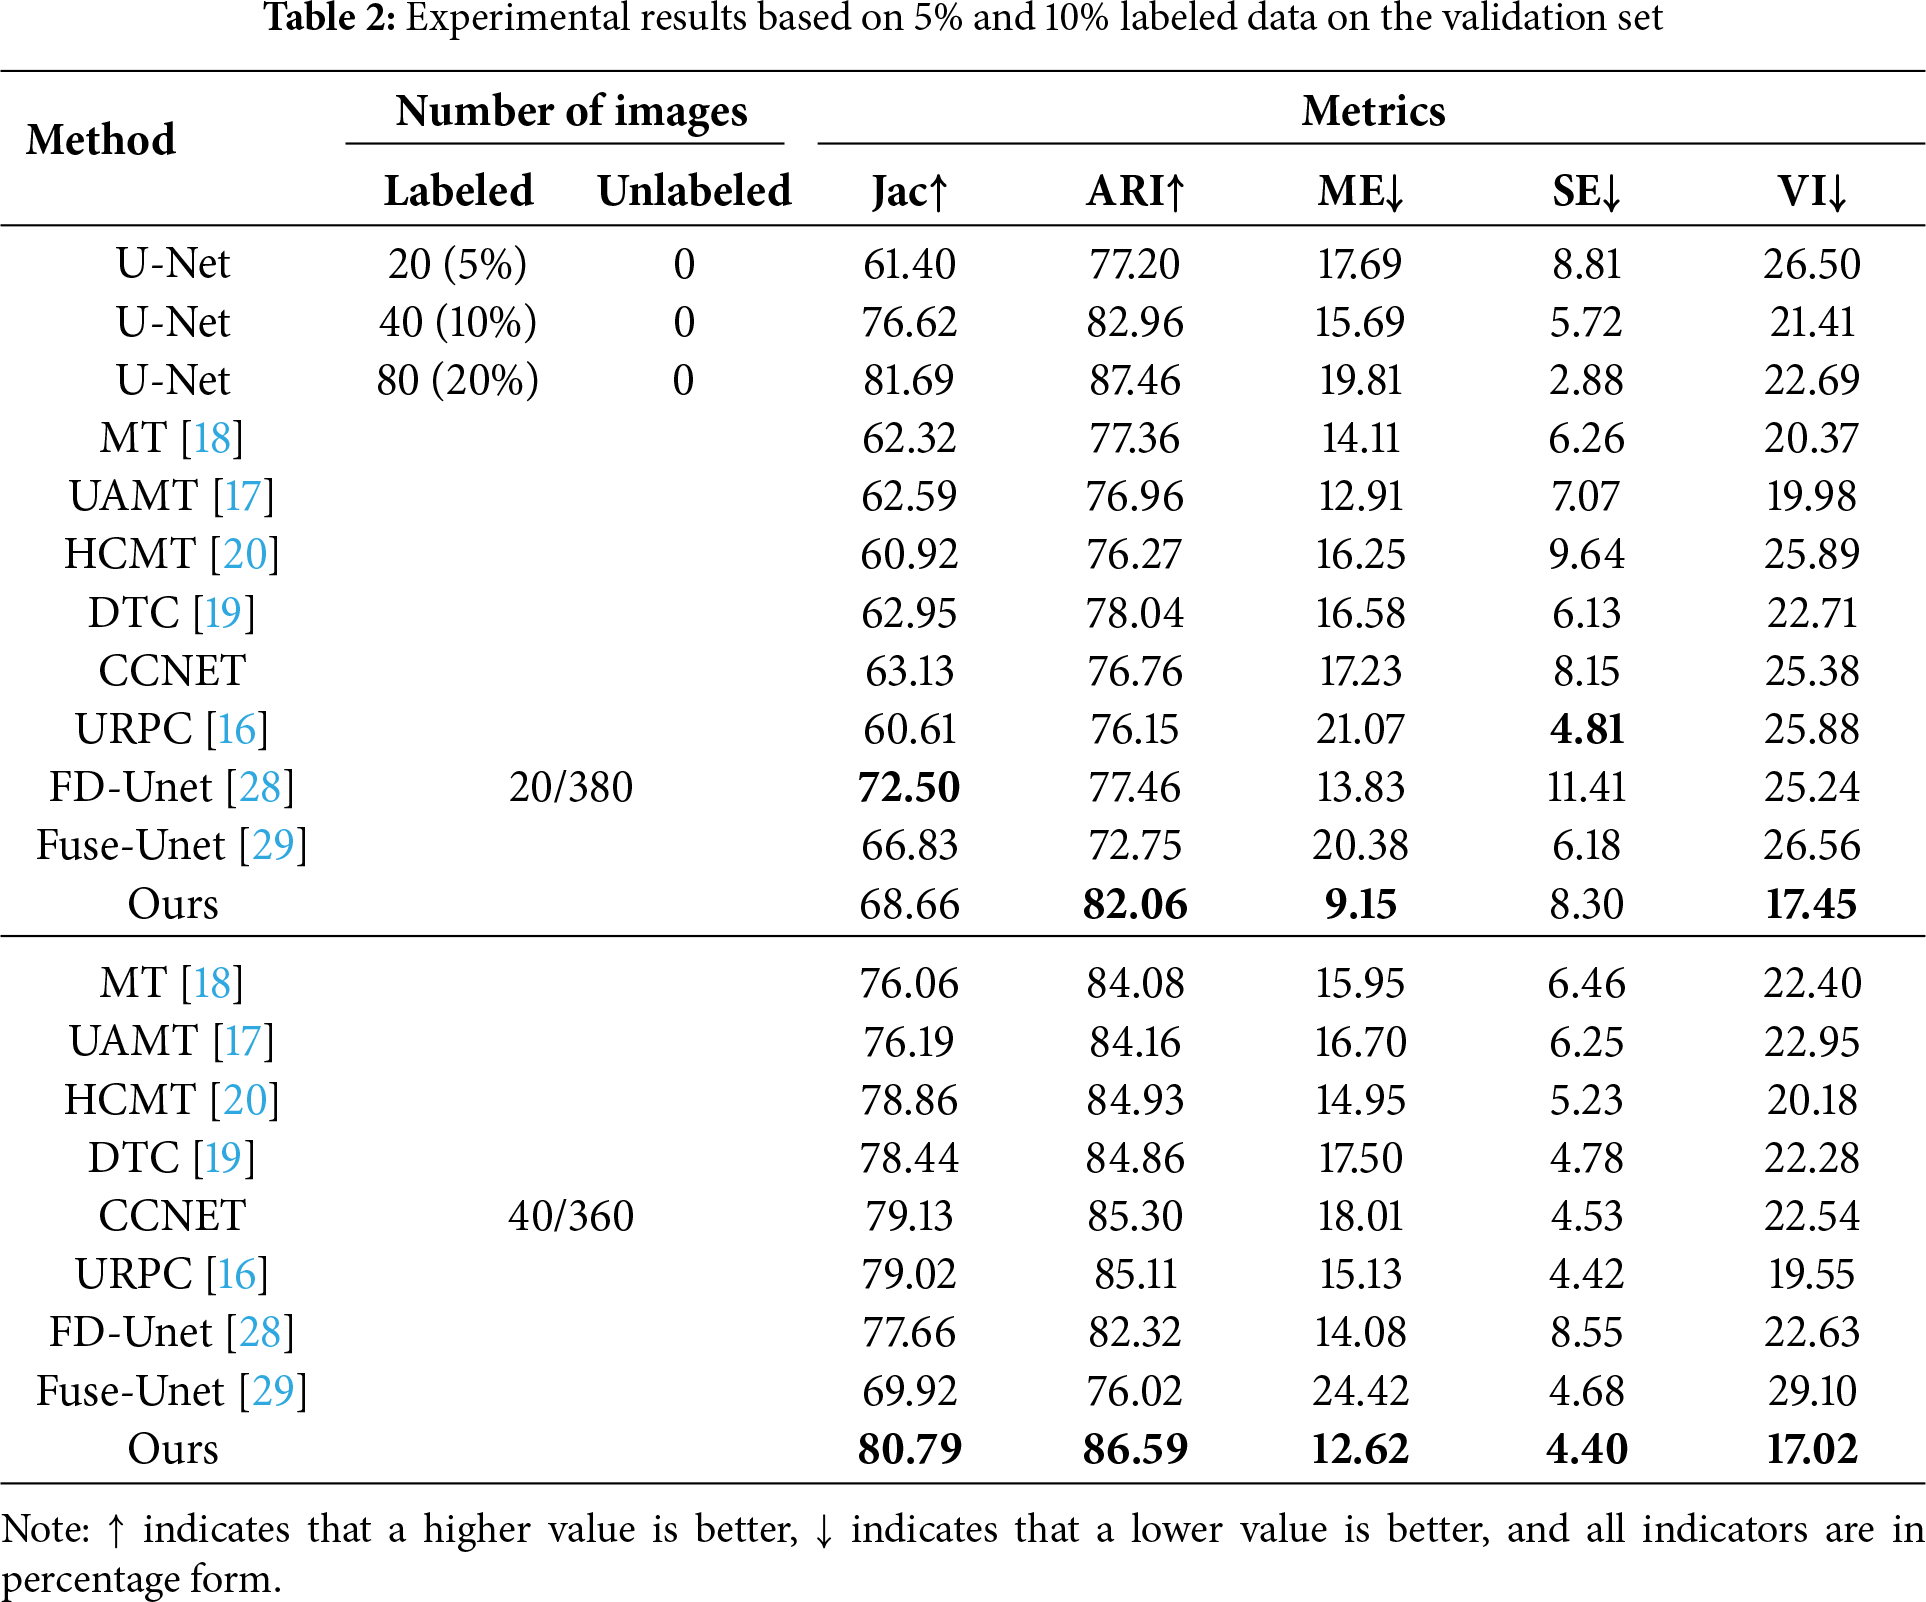
The method we propose is also based on perturbing images, but we use rotation operations to perturb the images from different perspectives. We are not limited to unlabeled data, but also perturbed labeled data, as labeled data has real labels. Through perturbation, the model’s ability to resist interference can be stronger. For unlabeled data, we filter low-confidence pixels and retain high-confidence pixels to generate more reliable prediction labels, which can significantly alleviate the accumulation of model errors during training.
Based on the experimental results, when using 5% and 10% labeled data, the proposed model achieves almost optimal performance, and compared to the current best method, our model still has a significant advantage. Moreover, in the 5% labeled data scenario, our model significantly outperforms other models in various indicators, indicating that our method has better competitiveness when the amount of labeled data is relatively small. In summary, the proposed method tends to preserve the topological structure and distribution of primary silicon particles, which is more in line with quantitative analysis of micro-materials
We applied the optimal parameters validated on the validation set to the test set to evaluate the model’s generalization performance. The experimental results are detailed in Table 3. Based on the analysis of the experimental results, under the scenarios of 5% and 10% labeled data, our proposed model demonstrated excellent performance across all metrics, and our proposed method performed better in preserving the topological structure and distribution of primary silicon particles, thus more meeting the quantitative analysis needs of micro-materials. Through the indicators, it is not easy to visually perceive the differences in the performance of various models. Therefore, in Figs. 6 and 7, we have demonstrated the segmentation effect of the model on 5% labeled data and 10% labeled data, where red areas represent adjacent grain boundary and blue areas (In the upper right portion of UAMT’s P1 prediction map) represent incorrect segmentations. From the effect map, our model can better identify adjacent grain boundaries and separate them.
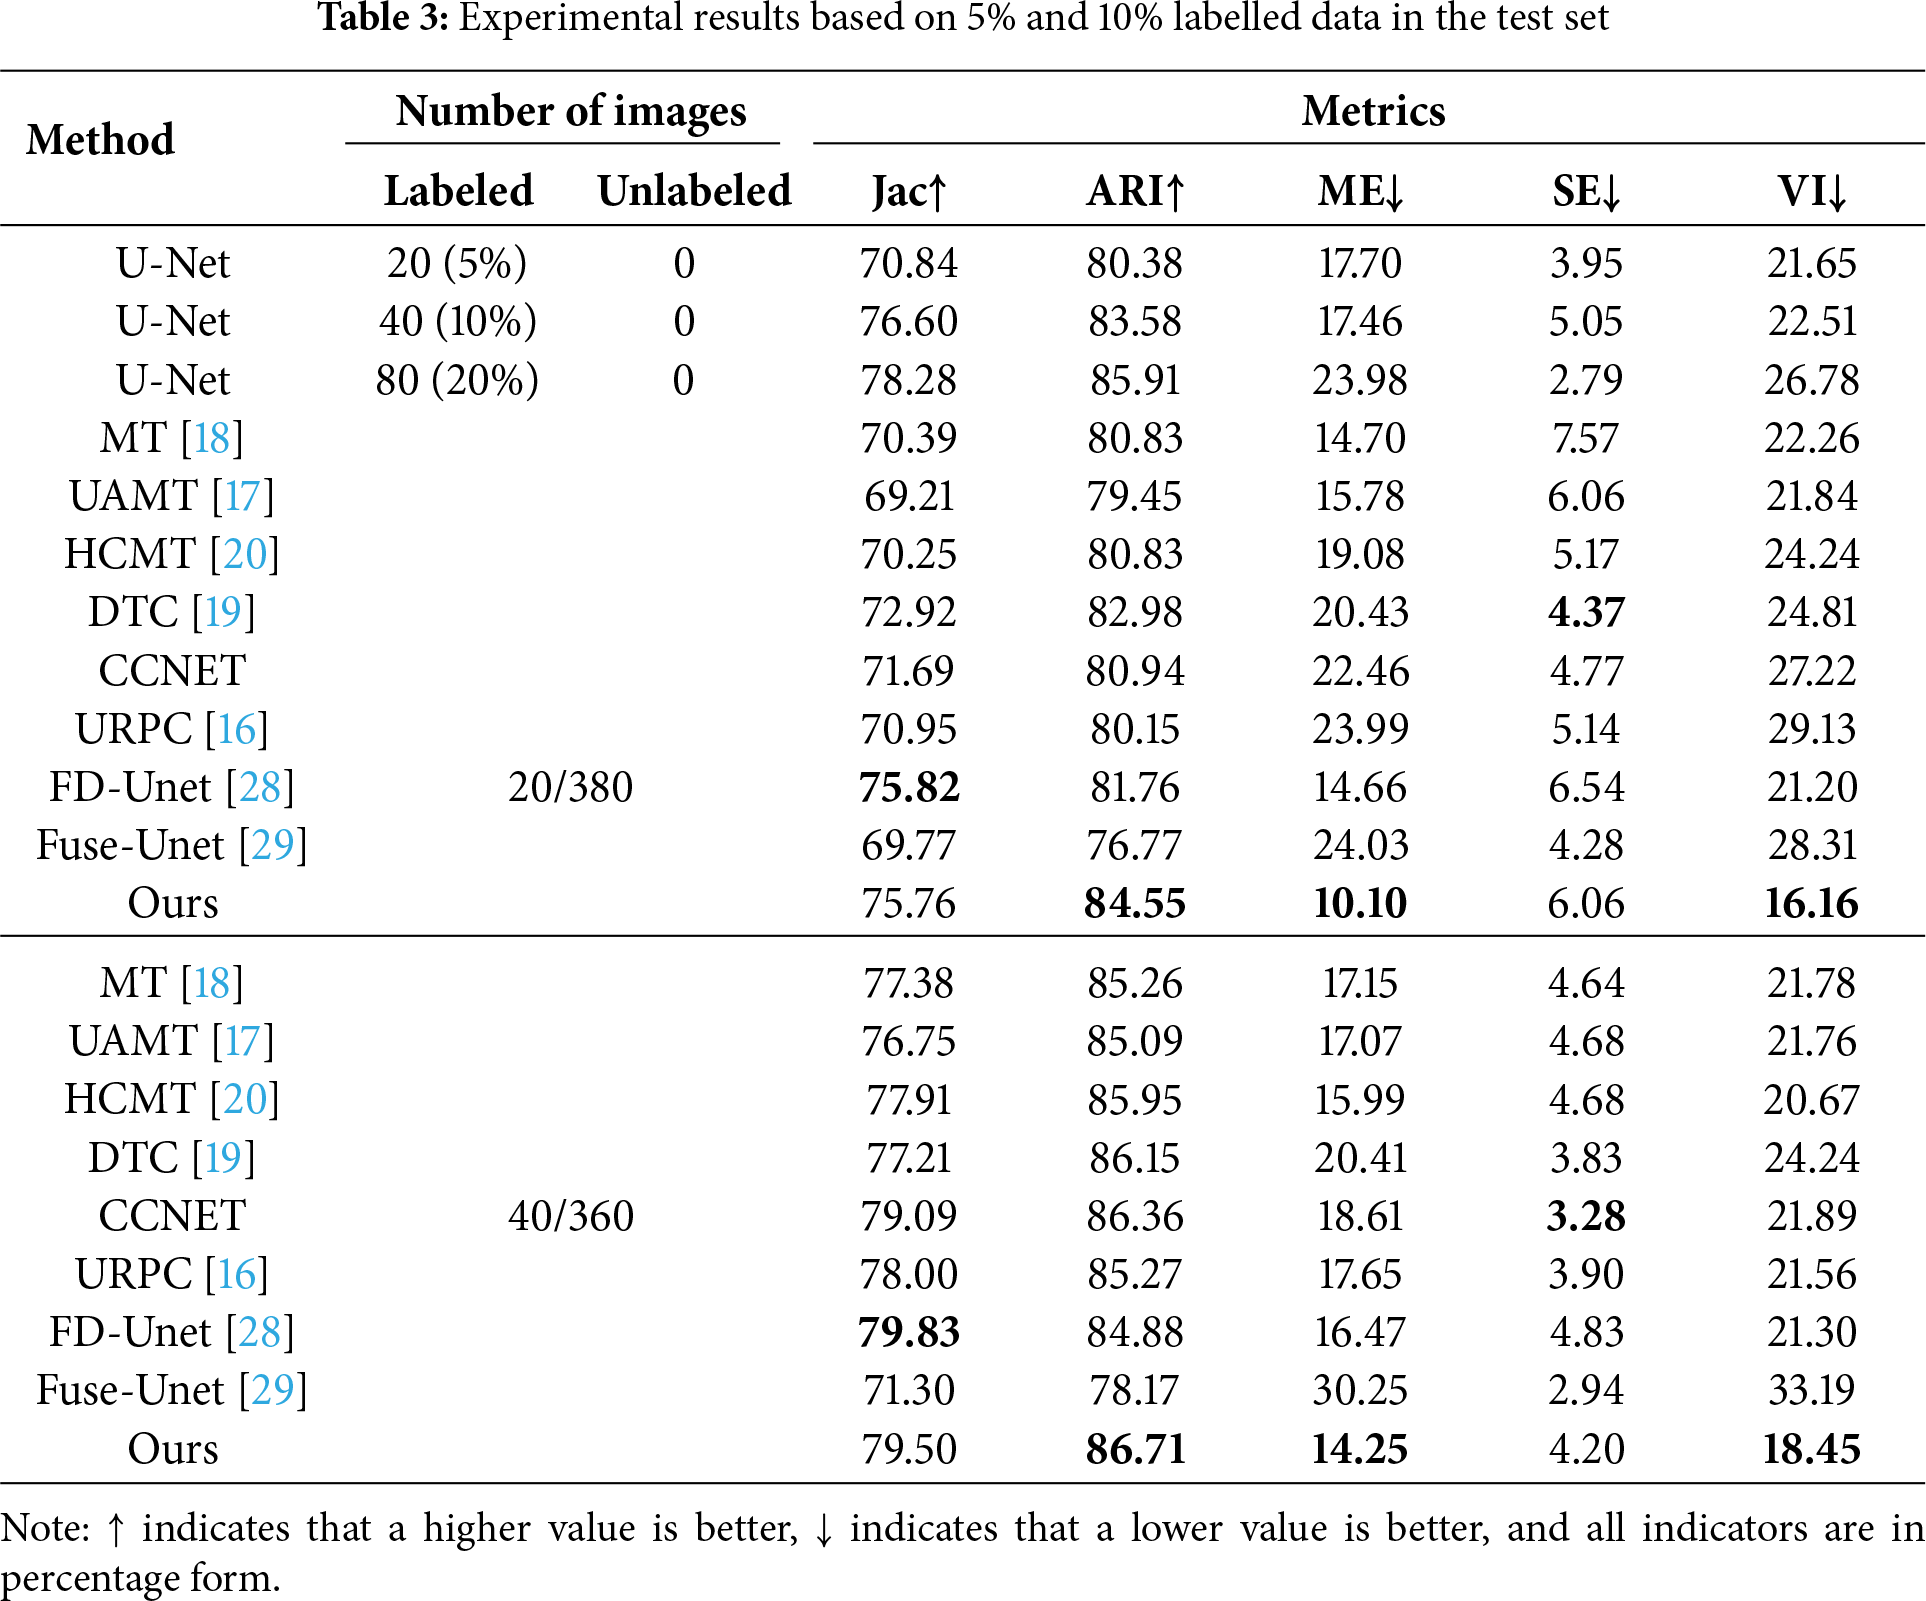
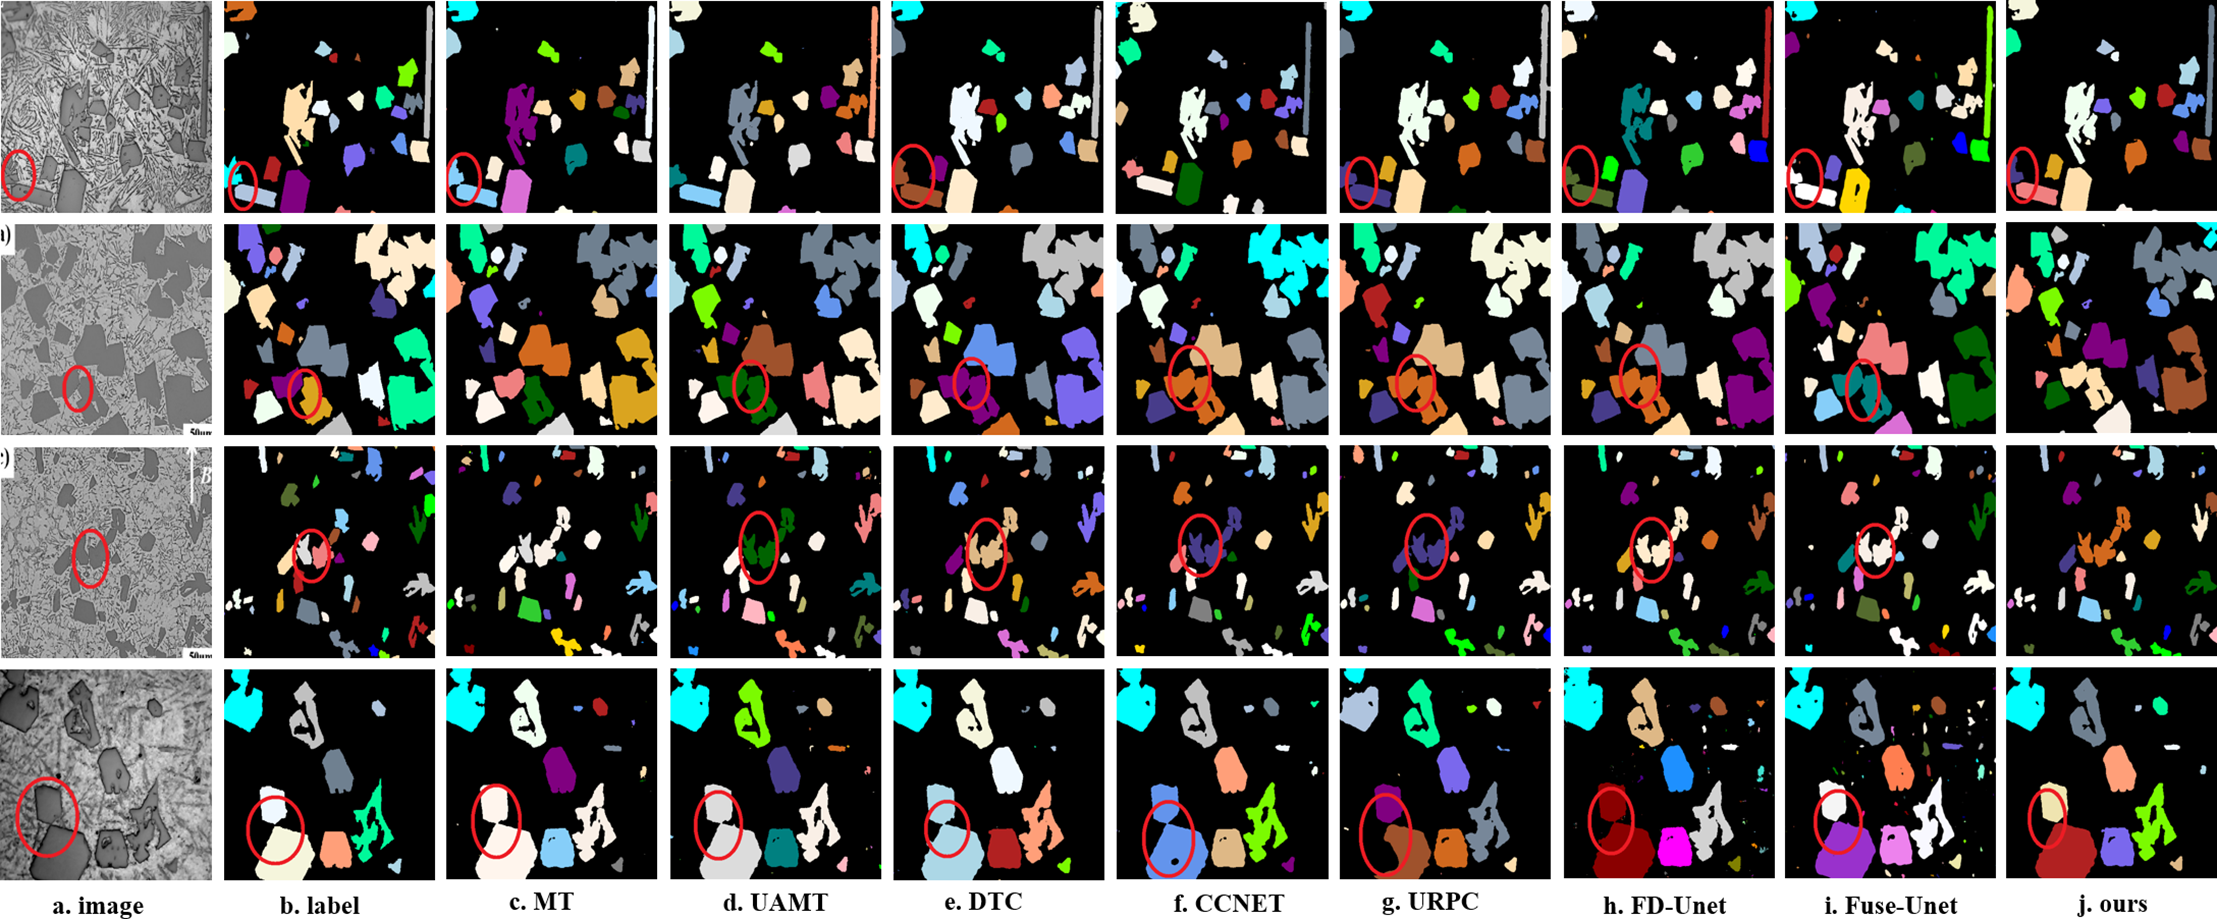
Figure 6: Experimental results on the validation set based on 5% labeled data. From left to right, the original image, the ground truth image, the segmentation results of UAMT, DTC, CCNET, URPC, FD-Unet, Fuse-Unet, and Ours, where the red region represents adjacent primary silicon particles and the blue region represents the incorrect segmentation area
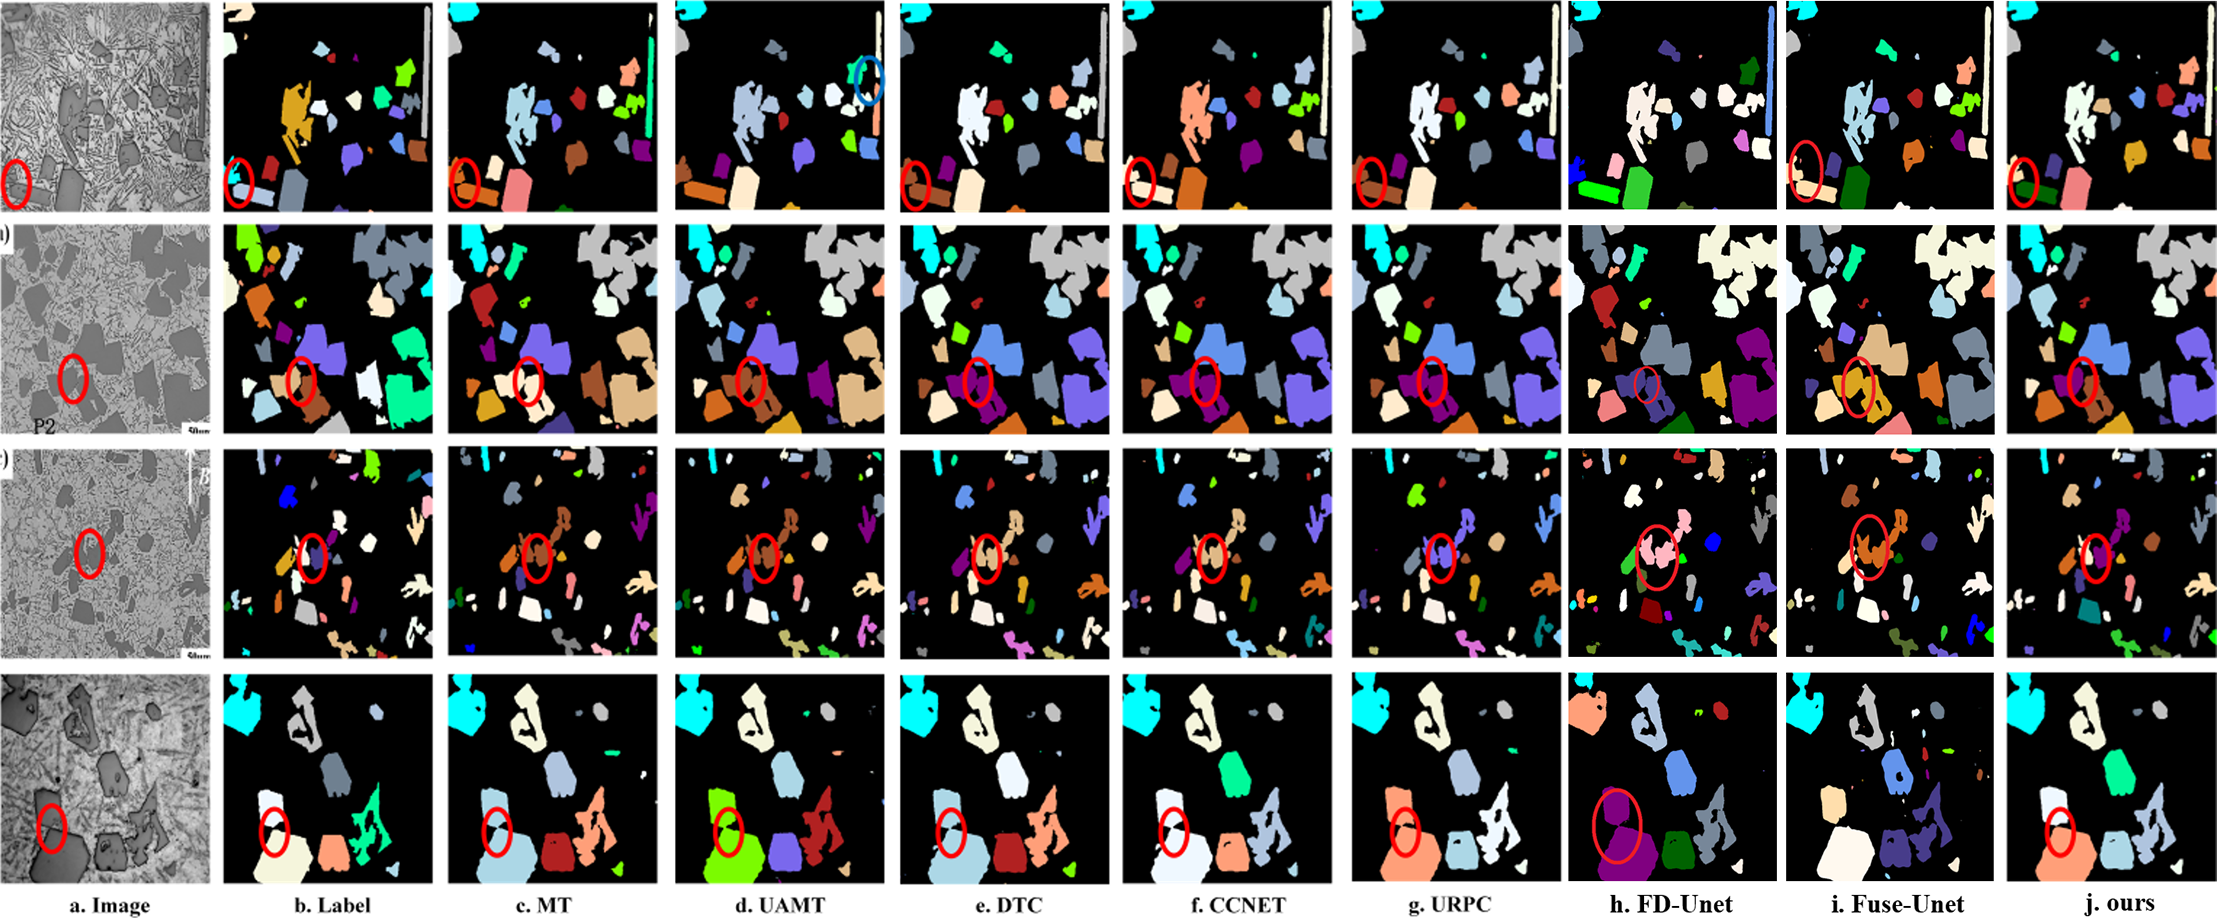
Figure 7: Experimental results on the validation set based on 10% labeled data. From left to right, the original image, the ground truth image, the segmentation results of UAMT, DTC, CCNET, URPC, FD-Unet, Fuse-Unet, and Ours, where the red region represents adjacent primary silicon particles and the blue region represents the incorrect segmentation area
In this study, we demonstrate a semantic segmentation method based on a semi-supervised neural network model, which realizes high-precision automatic fast segmentation based on microstructure images of materials. We applied the above method to an Al-Si alloy microstructure image dataset. Compared with other methods, our method improves the segmentation quality of Al-Si alloy microstructure images and alleviates the challenges of primary silicon particle labeling and the separation of adjacent particles by introducing the semi-supervised segmentation idea and boundary enhancement module. The confidence weight map is generated by rotating the Al-Si alloy microstructure image data at multiple angles and then using the confidence filtering mechanism. The weight map is used for weight loss, which is designed to guide the model to focus more on the regions with higher confidence, thus significantly improving the segmentation quality and generalization performance of the model. The boundary enhancement module can effectively guide the model to pay more detailed attention to the boundary regions of neighboring primary silicon particles, which significantly improves the boundary segmentation effect of primary silicon particles and effectively reduces the adhesion phenomenon between particles. The experimental results show that the proposed method effectively improves the overall segmentation ability of the model and the separation of neighboring targets. Finally, we evaluate six commonly used methods on the ASAD dataset. Compared with the current best method, our method improves the Jac and ARI metrics by 2.84 and 1.57 percentage points, respectively, when only 5% have labeled data. Additionally, the VI has decreased by 8.65, and is close to the experimental results of the base model with 10% data volume. It improved the Jac and ARI metrics by 0.41 and 0.35 percentage points when using 10% labeled data, and the VI decreased by 3.44. Even beyond the experimental results of the base model with 20% data volume. It can be seen from the experimental results that our method can have a greater advantage in the case of less data. And the separation effect for neighboring primary silicon particles is also improved more obviously.
Acknowledgement: The authors would like to express their gratitude to the editors and reviewers for their detailed review and insightful advice.
Funding Statement: This research was funded by the National Natural Science Foundation of China (52061020).
Author Contributions: Yingli Liu (First Author) completed Conceptualization, Funding Acquisition, Methodology. Weiyong Tang completed Visualization, Investigation. Xiao Yang completed Data Curation, Software, Writing, Original Draft. Jiancheng Yin (Corresponding Author) completed Validation, Writing, Review & Editing, Supervision. Haihe Zhou completed Conceptualization, Resources, Supervision. All authors reviewed the results and approved the final version of the manuscript.
Availability of Data and Materials: The data needed to replicate this work can be found in the GitHub repository, linked to “https://github.com/yx1539946445/RUCS-BE-MT/tree/master”. The code needed to replicate this work can be found in the GitHub repository, linked to “https://github.com/yx1539946445/RUCS-BE-MT/tree/master”.
Ethics Approval: Not applicable.
Conflicts of Interest: The authors declare no conflicts of interest to report regarding the present study.
References
1. Gorynski C, Frei M, Kruis FE, Winterer M. Machine learning based quantitative characterization of microstructures. Acta Mater. 2023;256:119106. doi:10.1016/j.actamat.2023.119106. [Google Scholar] [CrossRef]
2. Liu Y, Yang X, Jin K, Yin J, Tao S. GRAF: gap region aware framework for Al-Si alloy microscopic image segmentation. Comput Mater Sci. 2024;231:112620. doi:10.1016/j.commatsci.2023.112620. [Google Scholar] [CrossRef]
3. Ronneberger O, Fischer P, Brox T. U-Net: convolutional networks for biomedical image segmentation. Med Image Comput Comput Assist Interv. 2015;9351:234–41. doi:10.1007/978-3-319-24574-4_28. [Google Scholar] [CrossRef]
4. Kim H, Arisato Y, Inoue J. Unsupervised segmentation of microstructural images of steel using data mining methods. Comput Mater Sci. 2022;201:110855. doi:10.1016/j.commatsci.2021.110855. [Google Scholar] [CrossRef]
5. Azimi S, Britz D, Engstler M, Fritz M, Mücklich F. Advanced steel microstructural classification by deep learning methods. Sci Rep. 2018;8(1):2128. doi:10.1038/s41598-018-20037-5. [Google Scholar] [PubMed] [CrossRef]
6. Strohmann T, Bugelnig K, Breitbarth E, Wilde F, Steffens T, Germann H, et al. Semantic segmentation of synchrotron tomography of multiphase Al-Si alloys using a convolutional neural network with a pixel-wise weighted loss function. Sci Rep. 2019;9(1):19611. doi:10.1038/s41598-019-56008-7. [Google Scholar] [PubMed] [CrossRef]
7. Ma B, Ban X, Huang H, Chen Y, Liu W, Zhi Y. Deep learning-based image segmentation for Al-La alloy microscopic images. Symmetry. 2018;10(4):107. doi:10.3390/sym10040107. [Google Scholar] [CrossRef]
8. Liu W, Chen J, Liu C, Ban X, Ma B, Wang H, et al. Boundary learning by using weighted propagation in convolution network. J Comput Sci. 2022;62:101709. doi:10.1016/j.jocs.2022.101709. [Google Scholar] [CrossRef]
9. Zhao P, Wang Y, Jiang B, Wei M, Zhang H, Cheng X. A new method for classifying and segmenting material microstructure based on machine learning. Mater Des. 2023;227:111775. doi:10.1016/j.matdes.2023.111775. [Google Scholar] [CrossRef]
10. Chen X, Cheng L, Hu C, Zhang Y, Wu K. Microstructure recognition of steels by machine learning based on visual attention mechanism. J Iron Steel Res Int. 2024;31(4):909–23. doi:10.1007/s42243-023-01031-2. [Google Scholar] [CrossRef]
11. Lai C, Song L, Han Y, Li Q, Gu H, Wang B, et al. Material image segmentation with the machine learning method and complex network method. MRS Adv. 2019;4(19):1119–24. doi:10.1557/adv.2019.7. [Google Scholar] [CrossRef]
12. Panda A, Naskar R, Pal S. Deep learning approach for segmentation of plain carbon steel microstructure images. IET Image Process. 2019;13(9):1516–24. doi:10.1049/iet-ipr.2019.0404. [Google Scholar] [CrossRef]
13. Chen D, Guo D, Liu S, Liu F. Microstructure instance segmentation from aluminum alloy metallographic image using different loss functions. Symmetry. 2020;12(4):639. doi:10.3390/sym12040639. [Google Scholar] [CrossRef]
14. Zhang L, Yao H, Xu Z, Sun H. Segmentation and measurement of superalloy microstructure based on improved nonlocal block. IEEE Access. 2022;10:32418–25. doi:10.1109/access.2022.3161507. [Google Scholar] [CrossRef]
15. Bates W, Patel V, Rana H, Andersson J, Backer J, Igestrandet M, et al. Properties augmentation of cast hypereutectic Al-Si alloy through friction stir processing. Met Mater Int. 2022;29(1):215–28. doi:10.1007/s12540-022-01207-7. [Google Scholar] [CrossRef]
16. Luo X, Wang G, Liao W, Chen J, Song T, Chen Y, et al. Semi-supervised medical image segmentation via uncertainty rectified pyramid consistency. Med Image Anal. 2022;80:102517. doi:10.1016/j.media.2022.102517. [Google Scholar] [PubMed] [CrossRef]
17. Yu L, Wang S, Li X, Fu C, Heng P. Uncertainty-aware self-ensembling model for semi-supervised 3D left atrium segmentation. Med Image Comput Comput Assist Interv. 2019;11765:605–13. doi:10.1007/978-3-030-32245-8_67. [Google Scholar] [CrossRef]
18. Tarvainen A, Valpola H. Mean teachers are better role models: weight-averaged consistency targets improve semi-supervised deep learning results. arXiv:1703.01780. 2017. [Google Scholar]
19. Luo X, Chen J, Song T, Wang G. Semi-supervised medical image segmentation through dual-task consistency. Proc AAAI Conf Artif Intell. 2021;35(10):8801–9. doi:10.1609/aaai.v35i10.17066. [Google Scholar] [CrossRef]
20. Li S, Zhao Z, Xu K, Zeng Z, Guan C. Hierarchical consistency regularized mean teacher for semi-supervised 3D left atrium segmentation. arXiv:2105.10369. 2021. [Google Scholar]
21. Li S, Zhang C, He X. Shape-aware semi-supervised 3D semantic segmentation for medical images. Int Conf Med Image Comput Comput Assist Interv. 2020;12261:552–61. doi:10.1007/978-3-030-59710-8_54. [Google Scholar] [CrossRef]
22. Fu L, Gu W, He L, Rui T, Chen L, Ai Y, et al. Parallel multi-branch convolution block net for fast and accurate object detection. Electronics. 2020;9(1):15. doi:10.3390/electronics9010015. [Google Scholar] [CrossRef]
23. Kendall A, Gal Y. What uncertainties do we need in bayesian deep learning for computer vision? arXiv:1703.04977. 2017. [Google Scholar]
24. Seifoddini H, Djassemi M. The production data-based similarity coefficient versus Jaccard’s similarity coefficient. Comput Ind Eng. 1991;21(1):263–6. doi:10.1016/0360-8352(91)90099-R. [Google Scholar] [CrossRef]
25. Hubert L, Arabie P. Comparing partitions. J Classif. 1985;2(1):193–218. doi:10.1007/BF01908075. [Google Scholar] [CrossRef]
26. Meilă M. Comparing clusterings—an information based distance. J Multivar Anal. 2007;98(5):873–95. doi:10.1016/j.jmva.2006.11.013. [Google Scholar] [CrossRef]
27. Ma B, Jiang S, Yin D, Shen H, Ban X, Huang H, et al. Image segmentation metric and its application in the analysis of microscopic image. Chin J Eng. 2021;43(1):137–49. doi:10.13374/j.issn2095-9389.2020.05.28.002. [Google Scholar] [CrossRef]
28. Noeltong. FDUNet-JAX. GitHub; c2025. Main repository of FDUNet-JAX implementation; [about 1 screen]. [cited 2025 Dec 10]. Available from: https://github.com/noeltong/fdunet-jax/tree/main. [Google Scholar]
29. He Q, Min X, Wang K, He T. FuseUNet: a multi-scale feature fusion method for u-like networks. arXiv:2506.05821. 2025. [Google Scholar]
Cite This Article
 Copyright © 2026 The Author(s). Published by Tech Science Press.
This work is licensed under a Creative Commons Attribution 4.0 International License , which permits unrestricted use, distribution, and reproduction in any medium, provided the original work is properly cited.
 Downloads
 Citation Tools