
 Submit a Paper
 Propose a Special lssue
 Open Access
ARTICLE

SNELM: SqueezeNet-Guided ELM for COVID-19 Recognition
1 School of Computing and Mathematical Sciences, University of Leicester, Leicester, LE1 7RH, UK
2 Department of Computer Science, HITEC University Taxila, Taxila, Pakistan
* Corresponding Author: Shuihua Wang. Email:
Computer Systems Science and Engineering 2023, 46(1), 13-26. https://doi.org/10.32604/csse.2023.034172
Received 07 July 2022; Accepted 22 September 2022; Issue published 20 January 2023
 View Full Text
 Download PDF
Abstract
(Aim) The COVID-19 has caused 6.26 million deaths and 522.06 million confirmed cases till 17/May/2022. Chest computed tomography is a precise way to help clinicians diagnose COVID-19 patients. (Method) Two datasets are chosen for this study. The multiple-way data augmentation, including speckle noise, random translation, scaling, salt-and-pepper noise, vertical shear, Gamma correction, rotation, Gaussian noise, and horizontal shear, is harnessed to increase the size of the training set. Then, the SqueezeNet (SN) with complex bypass is used to generate SN features. Finally, the extreme learning machine (ELM) is used to serve as the classifier due to its simplicity of usage, quick learning speed, and great generalization performances. The number of hidden neurons in ELM is set to 2000. Ten runs of 10-fold cross-validation are implemented to generate impartial results. (Result) For the 296-image dataset, our SNELM model attains a sensitivity of 96.35 ± 1.50%, a specificity of 96.08 ± 1.05%, a precision of 96.10 ± 1.00%, and an accuracy of 96.22 ± 0.94%. For the 640-image dataset, the SNELM attains a sensitivity of 96.00 ± 1.25%, a specificity of 96.28 ± 1.16%, a precision of 96.28 ± 1.13%, and an accuracy of 96.14 ± 0.96%. (Conclusion) The proposed SNELM model is successful in diagnosing COVID-19. The performances of our model are higher than seven state-of-the-art COVID-19 recognition models.Keywords
COVID-19 has caused 6.26 million deaths and 522.06 million confirmed cases till 17/May/2022. The polymerase chain reaction (PCR) can effectively detect its existence; however, the cluster of false-positive [1] perplexes clinicians. The chest computed tomography (CCT) [2] is another precise way to help clinicians to diagnose COVID-19 patients. Till July/2022, three vaccines are approved for use in UK, including Moderna, Oxford/AstraZeneca, and Pfizer/BioNTech.
In the recent few years, scholars proposed to novel artificial intelligence (AI)-based models for COVID-19 diagnosis. For examples, El-kenawy et al. [3] proposed an innovative feature selection and voting (FSV) classifier Wu [4] proposed a three-segment biogeography-based optimization (3SBBO) method for COVID-19 detection. Zhang [5] proposed a model combining a convolutional neural network (CNN) with stochastic pooling (SP). Their method is renamed CNNSP. Chen [6] merged gray-level co-occurrence matrix (GCM) and support vector machine (SVM) for COVID-19 classification. This method is named GCMSVM. Wang [7] proposed a wavelet entropy and Jaya (WEJ) algorithm. Pi [8] merged GCM with Schmitt neural network (SNN) for COVID-19 diagnosis. Their model is named GCMSNN. Wang [9] introduced self-adaptive particle swarm optimization (SaPSO) for COVID-19 detection. Ni et al. [10] proposed a deep learning approach (DLA) to characterize COVID-19. Wang et al. [11] developed a weakly supervised framework. Their model was named DeCovNet. Gafoor et al. [12] developed a deep learning model (DLM) to detect COVID-19 using chest X-ray.
Nevertheless, the above models still have room to improve in terms of their recognition performances, i.e., the accuracy. Inspired by the model in Özyurt et al. [13], we proposed SqueezeNet-guided ELM (SNELM), which combines traditional SqueezeNet (SN) with the extreme learning machine (ELM). Nevertheless, our SNELM is different from [13] in two ways. First, we do not use fuzzy C-means for super-resolution. Second, we choose the SN model with complex bypass, while [13] chooses the vanilla SN model. Our experiments show the effectiveness of this proposed SNELM model. In all, this study has several novel contributions:
a) The multiple-way data augmentation (MDA) is used to increase the size of the training set.
b) We propose the novel SNELM model to diagnose COVID-19.
c) SNELM model gives higher results than seven state-of-the-art models.
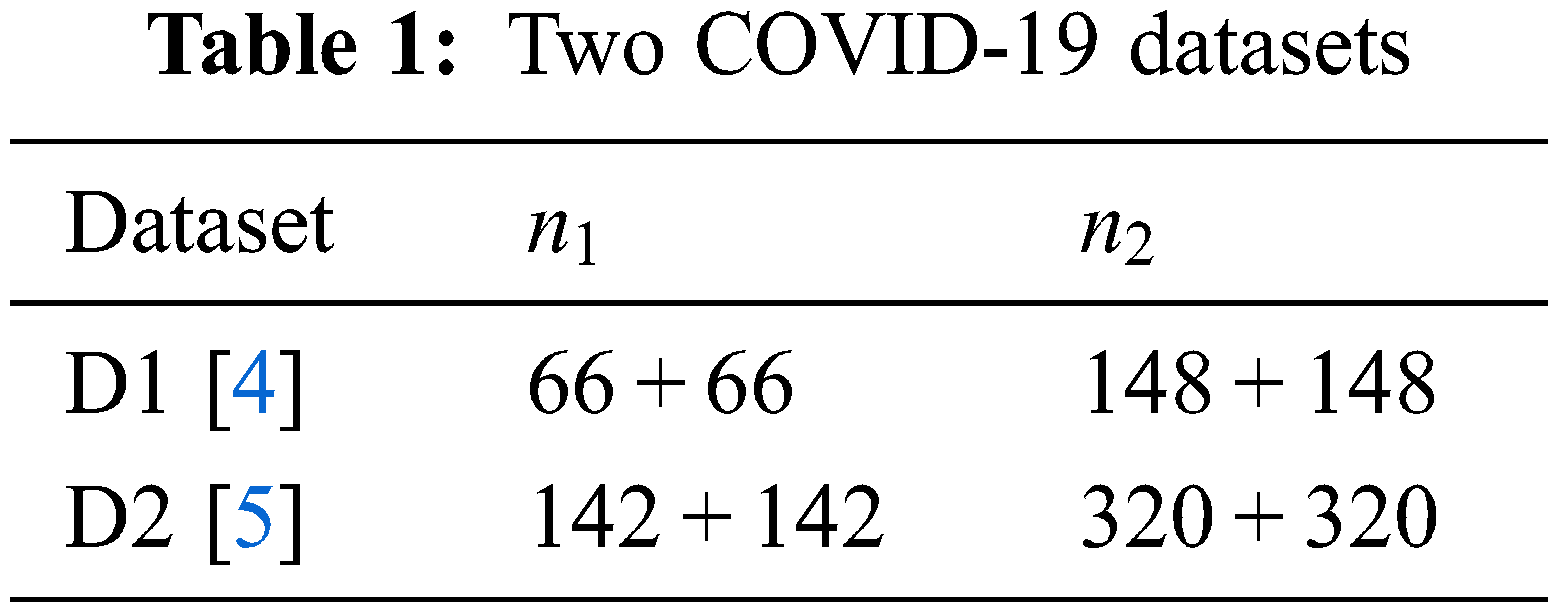
Two datasets (D1 and D2) are used since they can report the results more unbiasedly. The details of the two datasets can be found in [4,5]. Table 1 displays the descriptions of D1 and D2. Suppose
A five-step preprocessing is employed. The flowchart can be seen in Fig. 1a, in which the five steps are grayscaling, histogram stretching (HS), margin and text crop (MTC), downsampling (DS), and coloriazation. Here U stands for the dataset at each step. HS is used to enhance the contrast. Suppose
and the HSed image is defined as
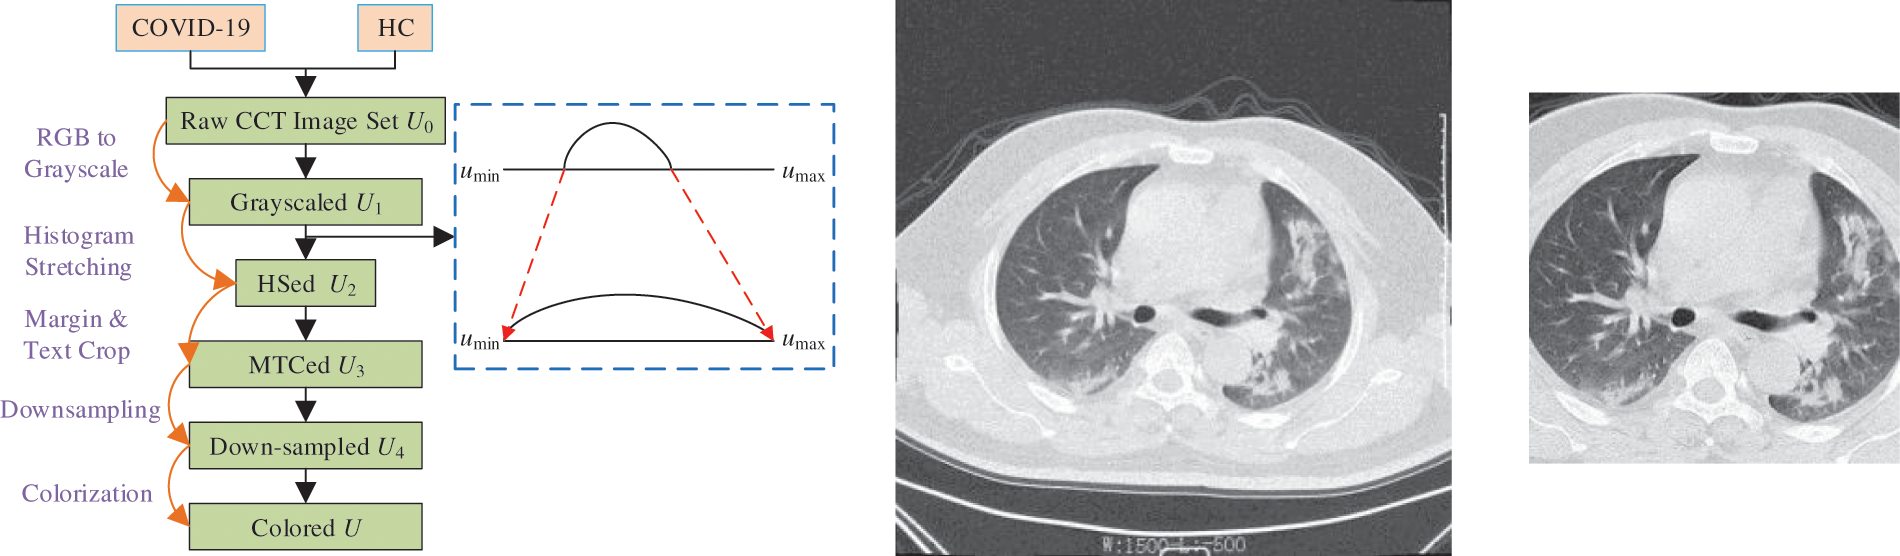
Figure 1: Preprocessing
The grayscale range of
where
3.1 Multiple-Way Data Augmentation
Table 2 itemizes the abbreviation and their meanings. Fig. 2 illustrates the schematic of MDA. Assume the original image is
where we do not take color channels into consideration. Then, all the
where
Compared to normal individual DA methods, the MDA fuse the separate DA methods together and thus can yield better performances [14].
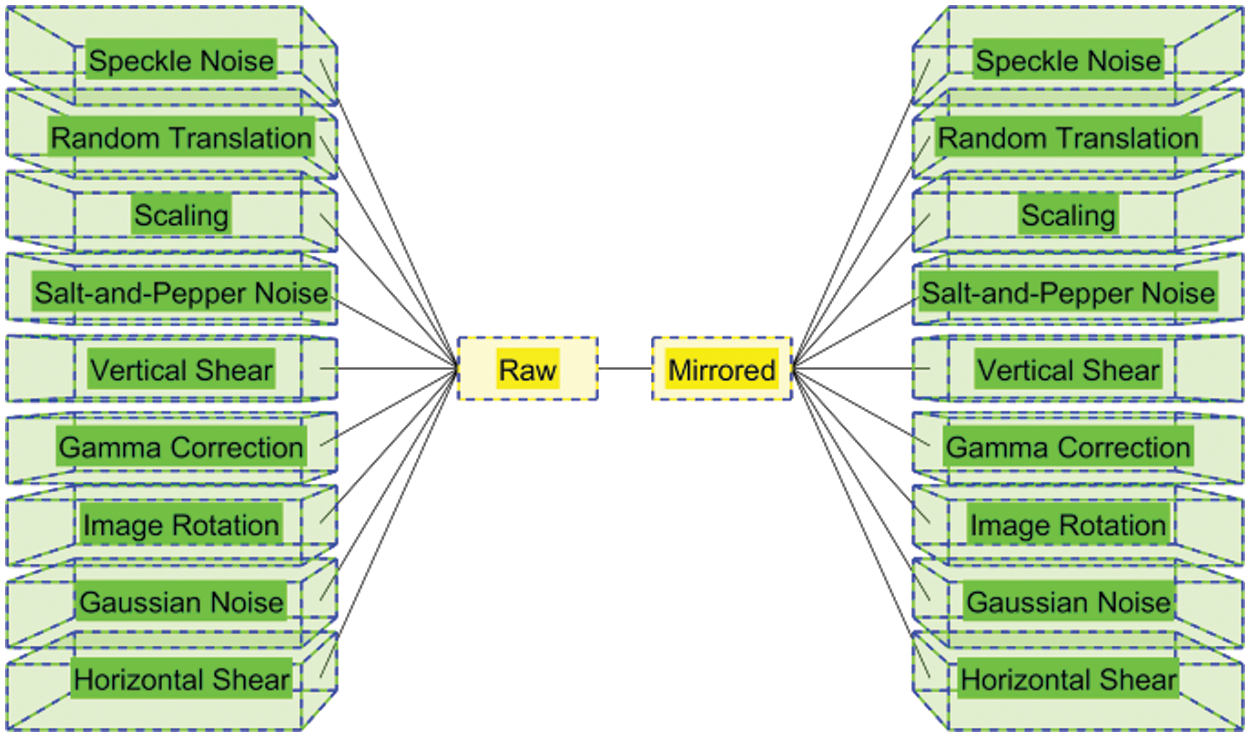
Figure 2: Schematic of MDA
3.2 Fire Module and SqueezeNet with Complex Bypass
SqueezeNet (SN) is chosen since it can achieve a 50× reduction in model size compared to AlexNet and maintain the same accuracy [15]. This lightweight SN can help make our final COVID-19 recognition model fast and still have sufficient accuracy.
The fire module (FM) is the core component in the N. It contains a squeeze layer (SL), which uses only
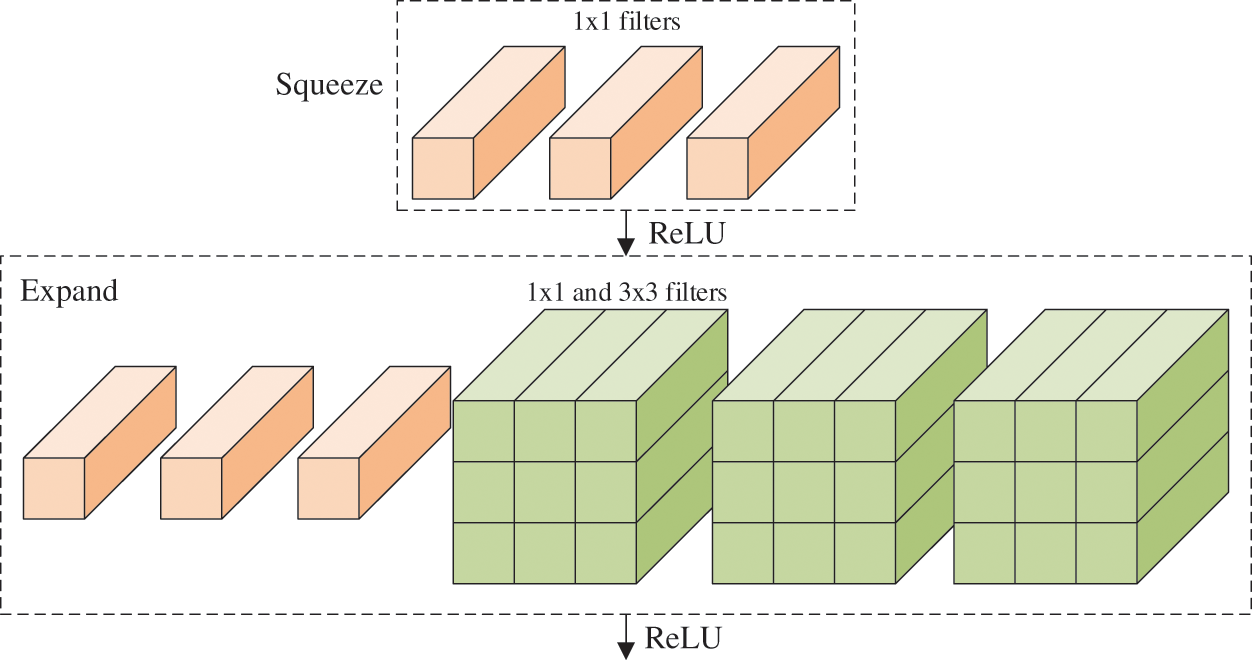
Figure 3: Structure of FM (
Compared to ordinary convolutional neural network (CNN) architectures, the SN [17] has three main advantages: (i) replace traditional
There are different variants of SN. Özyurt et al. [13] used vanilla SN, while our SNELM use SN with complex bypass. Fig. 4 shows the flowchart, where we can observe not only simple bypass but also complex bypass are added between some FMs. If the “same-number-of-channel” requirement is met, a simple bypass is added. If that requirement is not met, a complex bypass is added. These bypasses can help improve the recognition performances, and their designs are similar to those in ResNet.
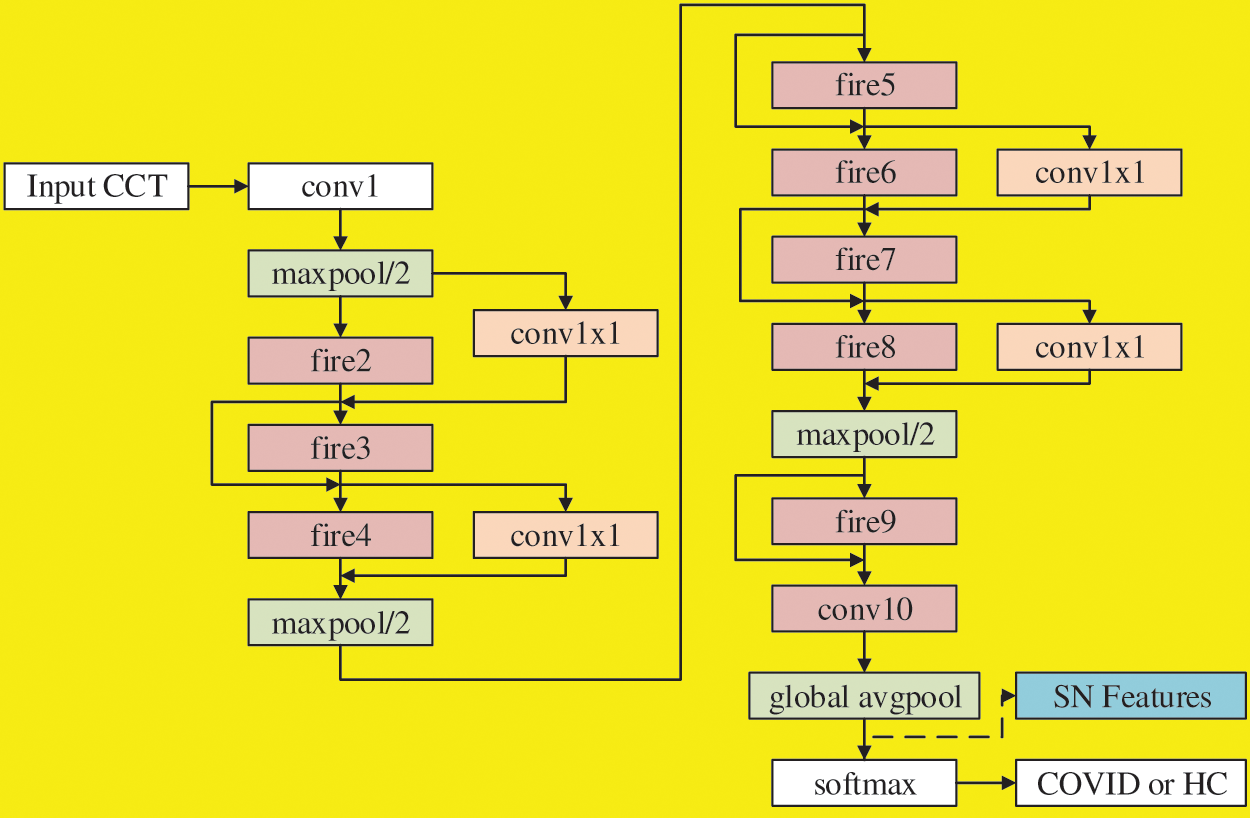
Figure 4: Flowchart of SN with simple bypass and complex bypass
The SN features after global avgpool (See Fig. 4) are used as the learnt features and passed to the extreme learning machine (ELM) [19] that features a very fast classifier. Besides, ELM is simple to use, has greater generalization performance, and is appropriate for several nonlinear kernel functions and activation functions. Its structure is a single hidden-layer feedforward network shown in Fig. 5.
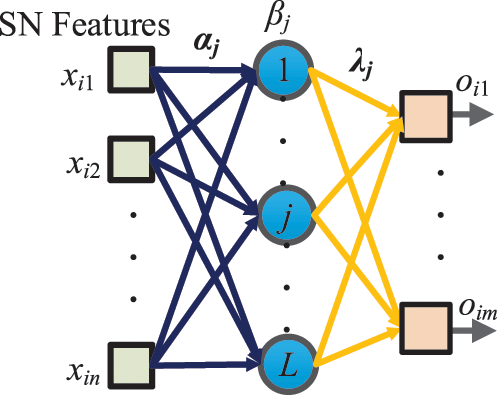
Figure 5: Schematic of SN-guided ELM
Let the i-th input sample be
where h stands for the activation function,
Let us rephrase the above equation as
where
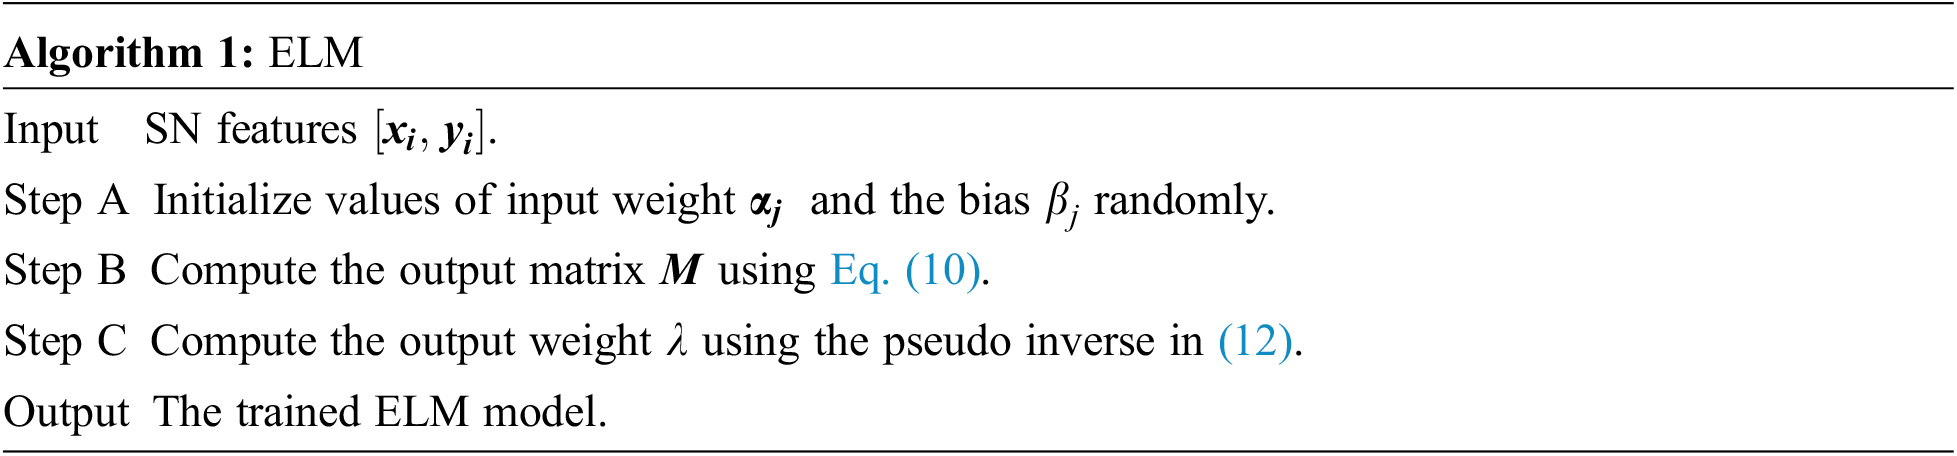
It challenges the users to acquire the optimal
where
3.4 Cross-Validation and Evaluation
where
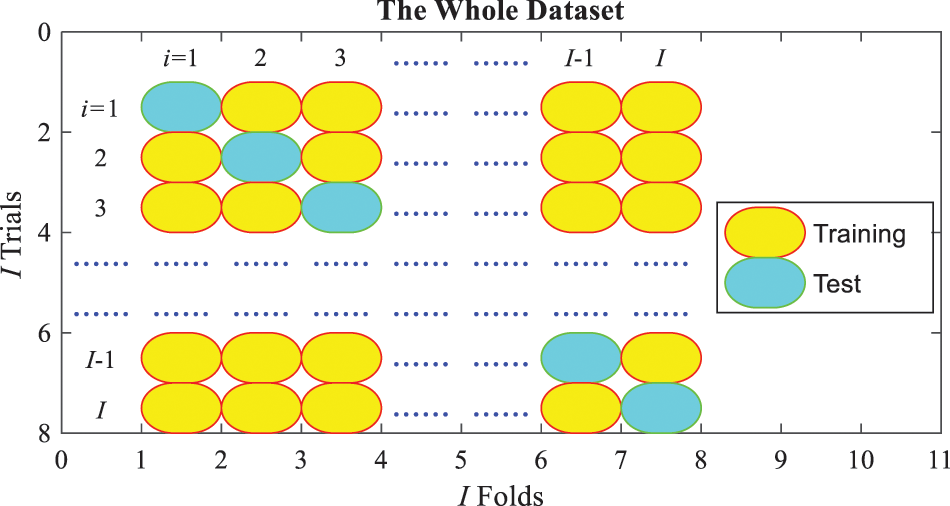
Figure 6: Schematic of one run of
At
where the first four indicators mean:
and
There are two indicators
The previous process is for one run of
where
4 Experiments, Results, and Discussions
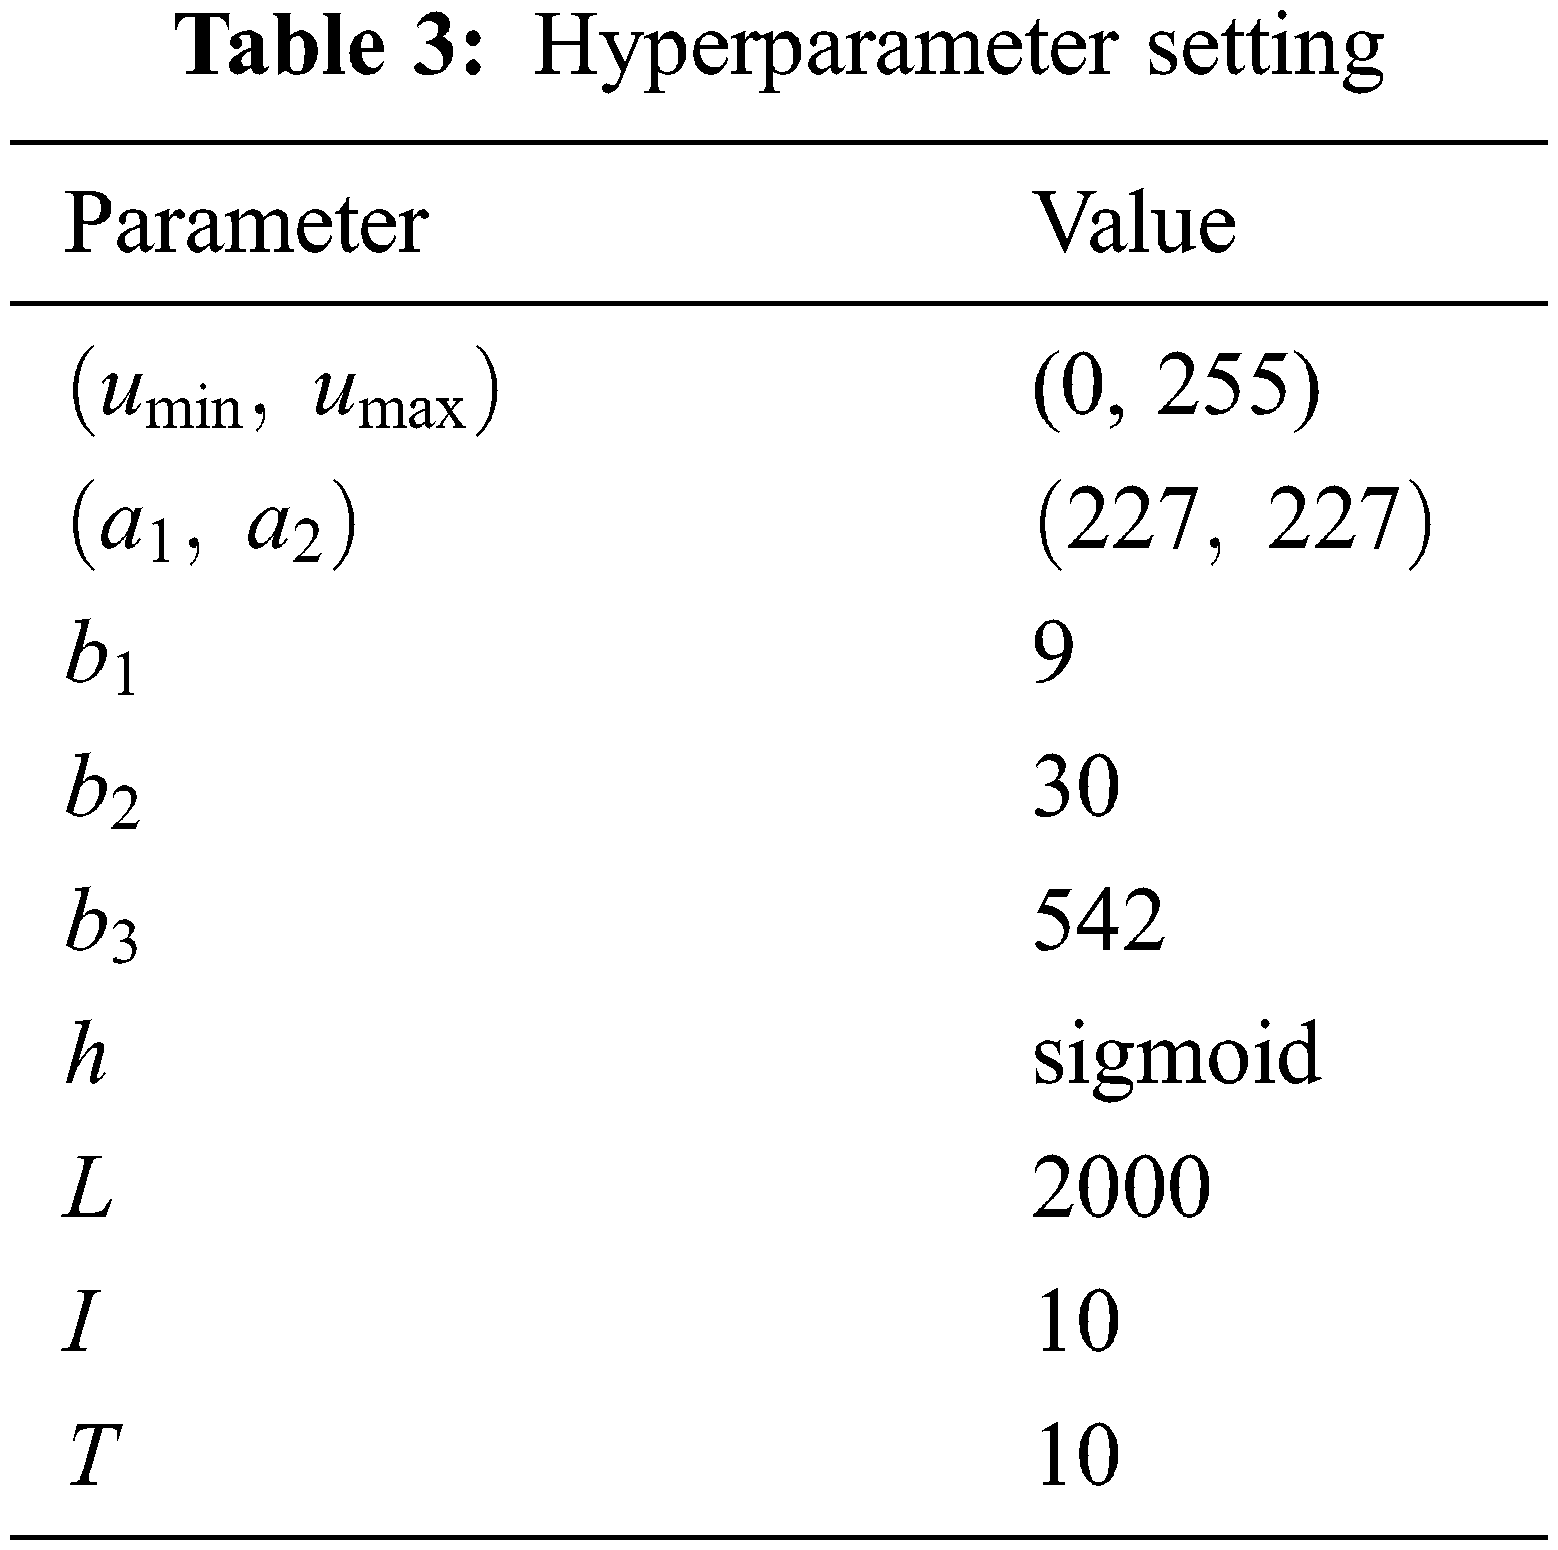
The hyperparameters are listed in Table 3. The minimum and maximum gray values of HSed images are
The MDA result of Fig. 1c is shown in Fig. 7, in which we can observe the nine DA results, i.e., speckle noise, random translation, scaling, salt-and-pepper noise, vertical shear, Gamma correction, rotation, Gaussian noise, and horizontal shear. Due to the space limit, the nine DA outcomes on HMI are not displayed. Fig. 7 indicates that the MDA can increase the diversity of the training set.
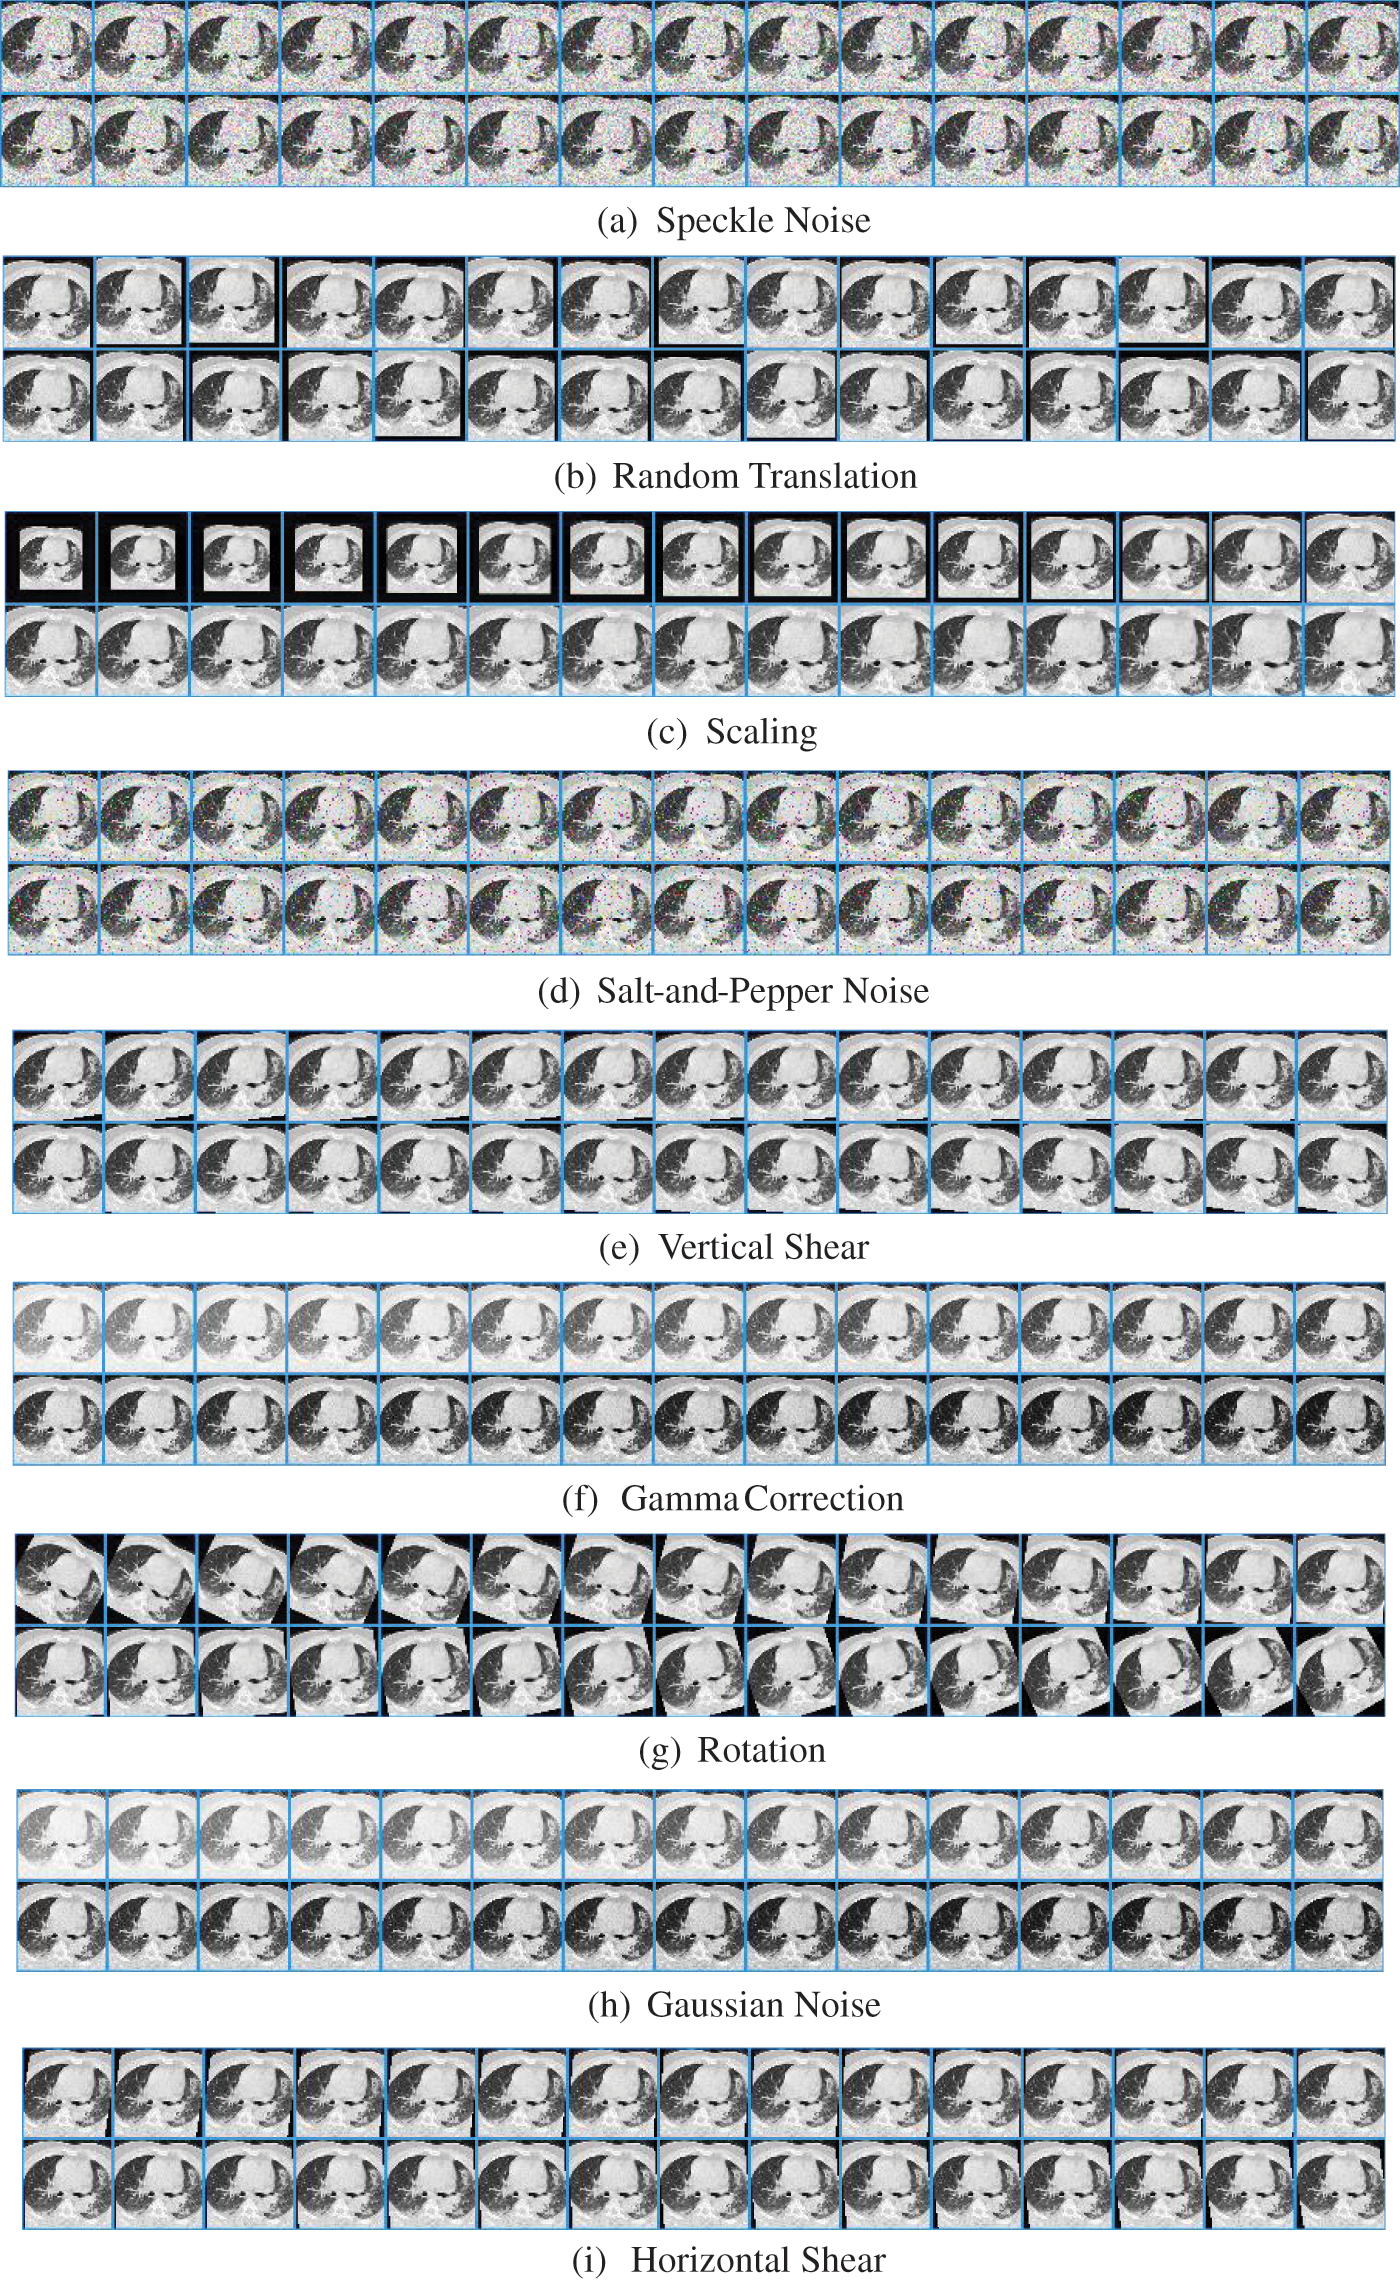
Figure 7: Result of MDA
Meanwhile, the AFMDA value
4.3 Results of Proposed SNELM Model
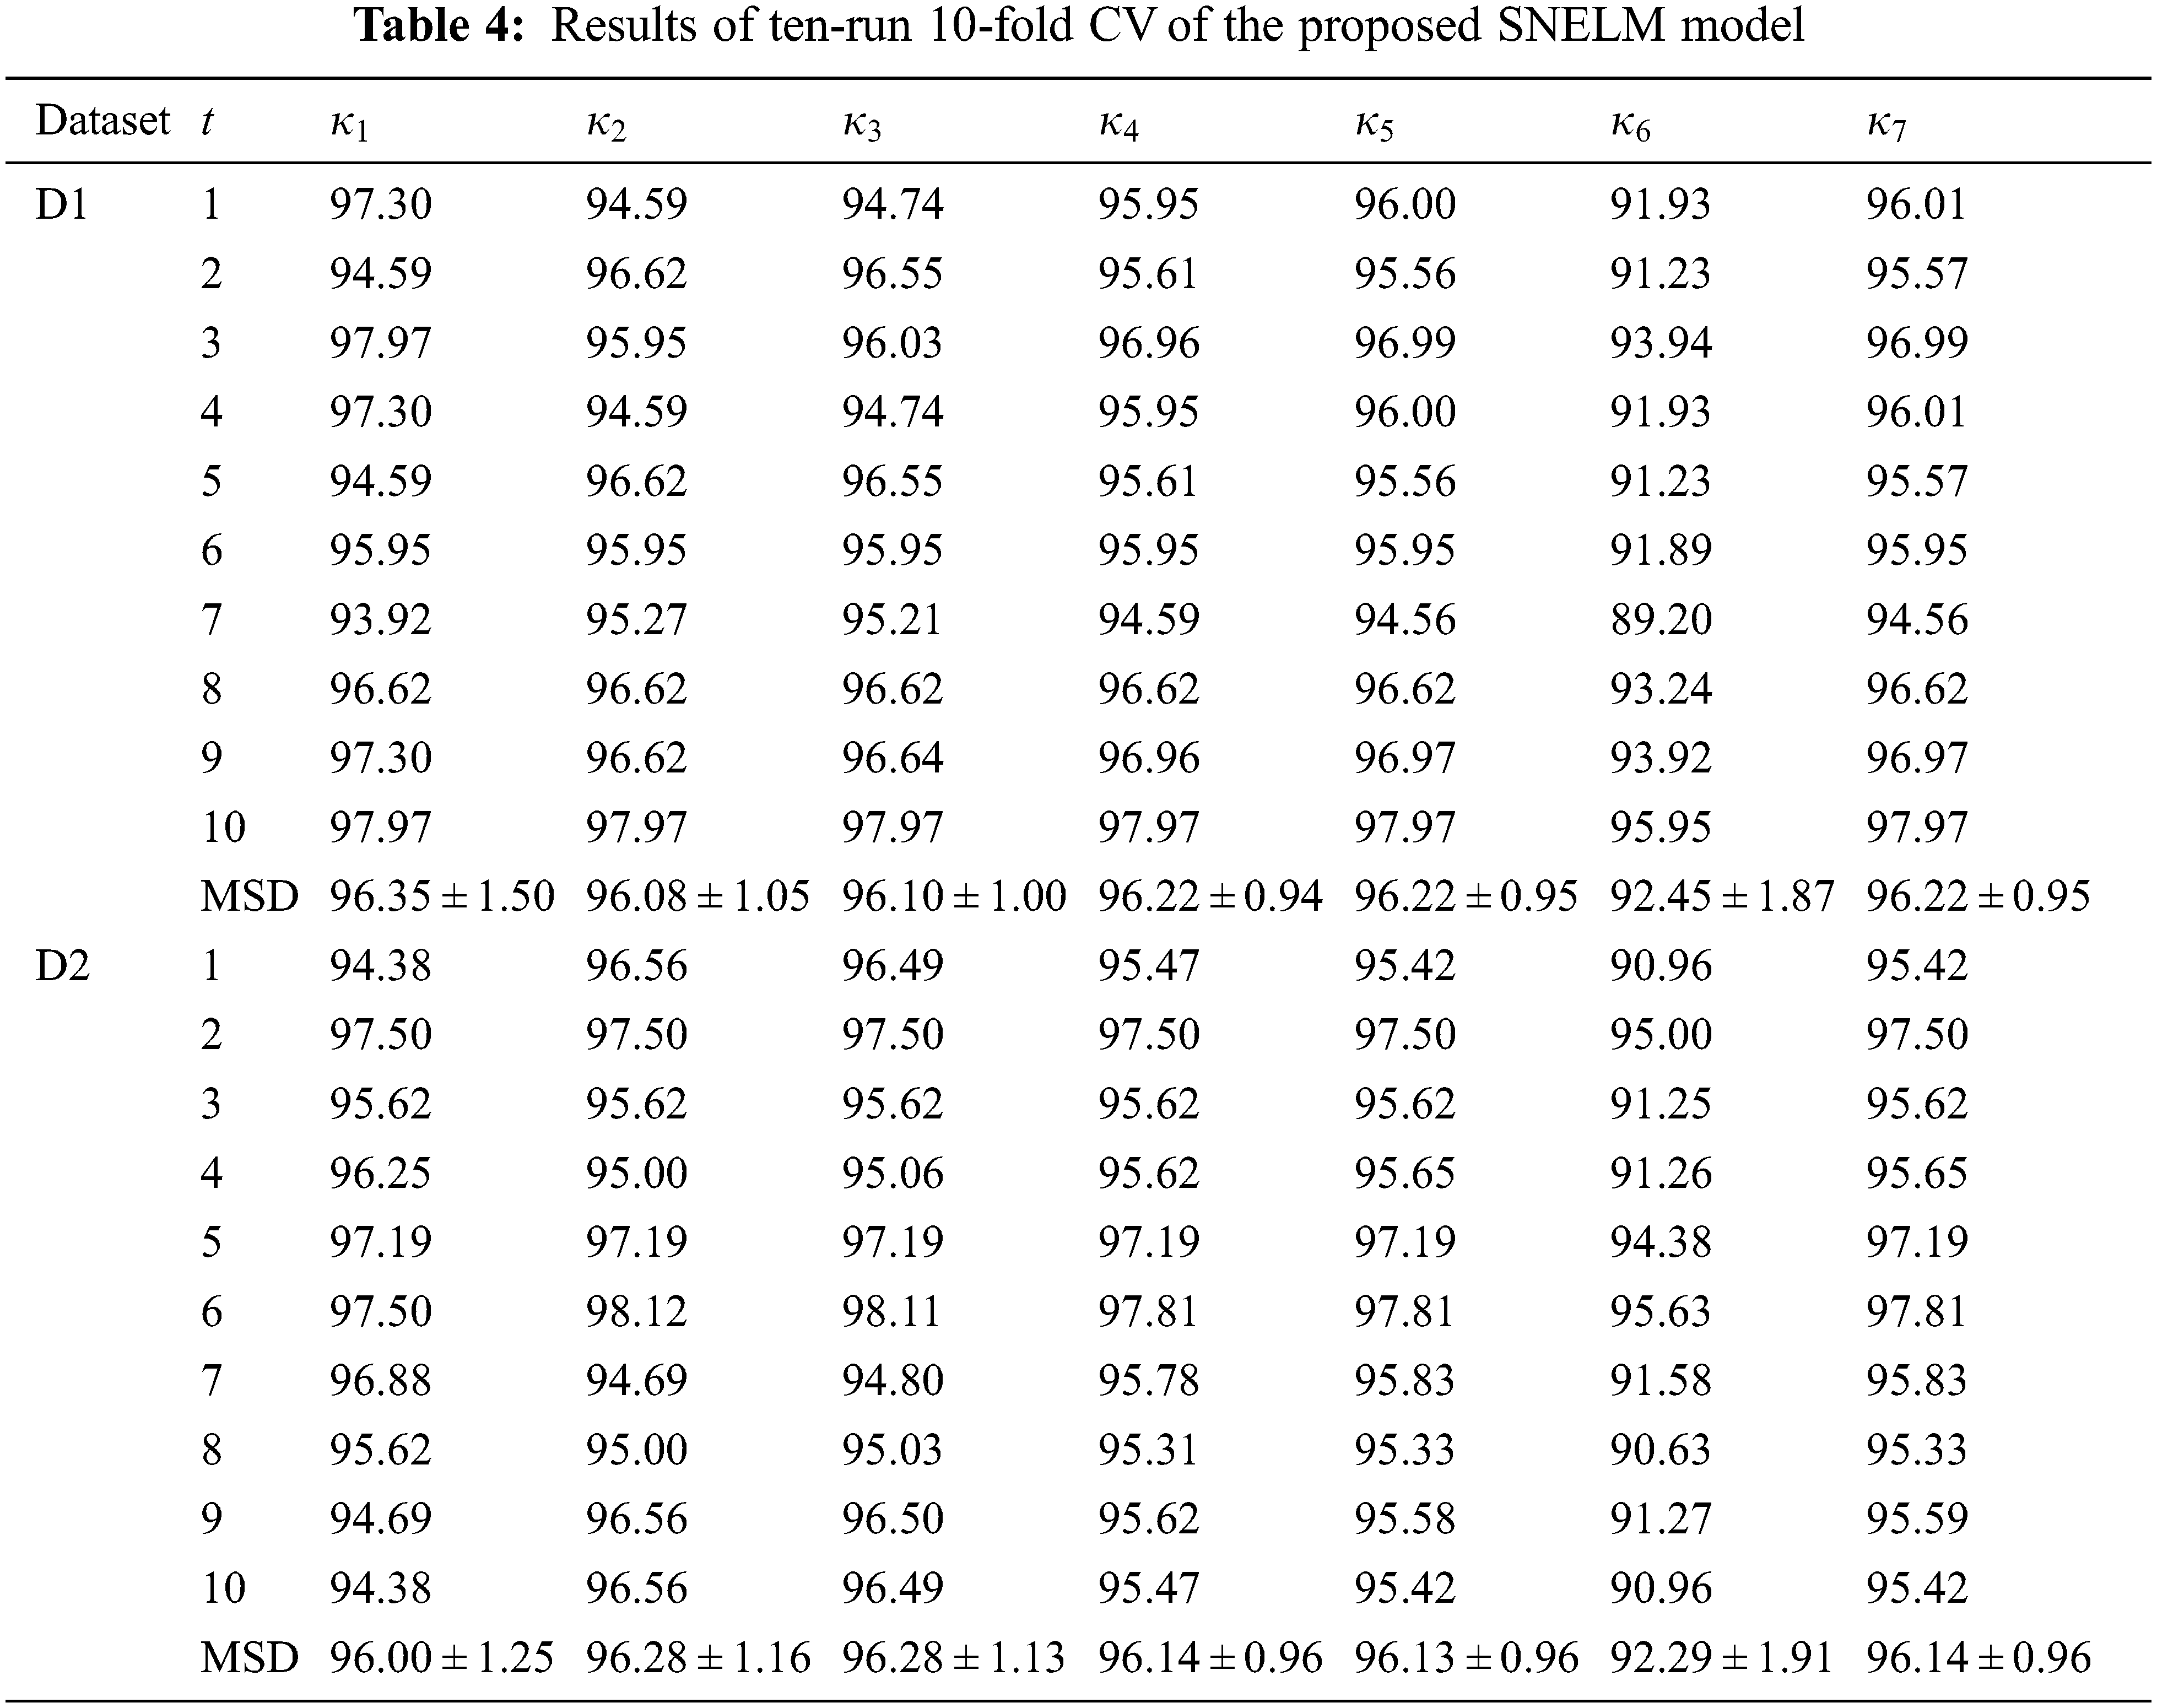
Table 4 displays the ten runs of 10-fold CV, where t = 1, 2, ..., 10 means the run index. For the dataset D1, SNELM attains a sensitivity of 96.35 ± 1.50%, a specificity of 96.08 ± 1.05%, a precision of 96.10 ± 1.00%, an accuracy of 96.22 ± 0.94%, an F1 score of 96.22 ± 0.95%, an MCC of 92.45 ± 1.87%, and an FMI of 96.22 ± 0.95%. For the dataset D2, SNELM attains a sensitivity of 96.00 ± 1.25%, a specificity of 96.28 ± 1.16%, a precision of 96.28 ± 1.13%, an accuracy of 96.14 ± 0.96%, an F1 score of 96.13 ± 0.96%, an MCC of 92.29 ± 1.91%, and an FMI of 96.14 ± 0.96%.
4.4 Confusion Matrix and ROC Curve
After combining the ten runs altogether, we can draw the overall TCMs and the ROC curves of the two datasets. The top row of Fig. 8 displays the TCM of two datasets. The bottom row of Fig. 8 displays their corresponding ROC curves. The AUC values of D1 and D2 are 0.9767 and 0.9776, respectively.
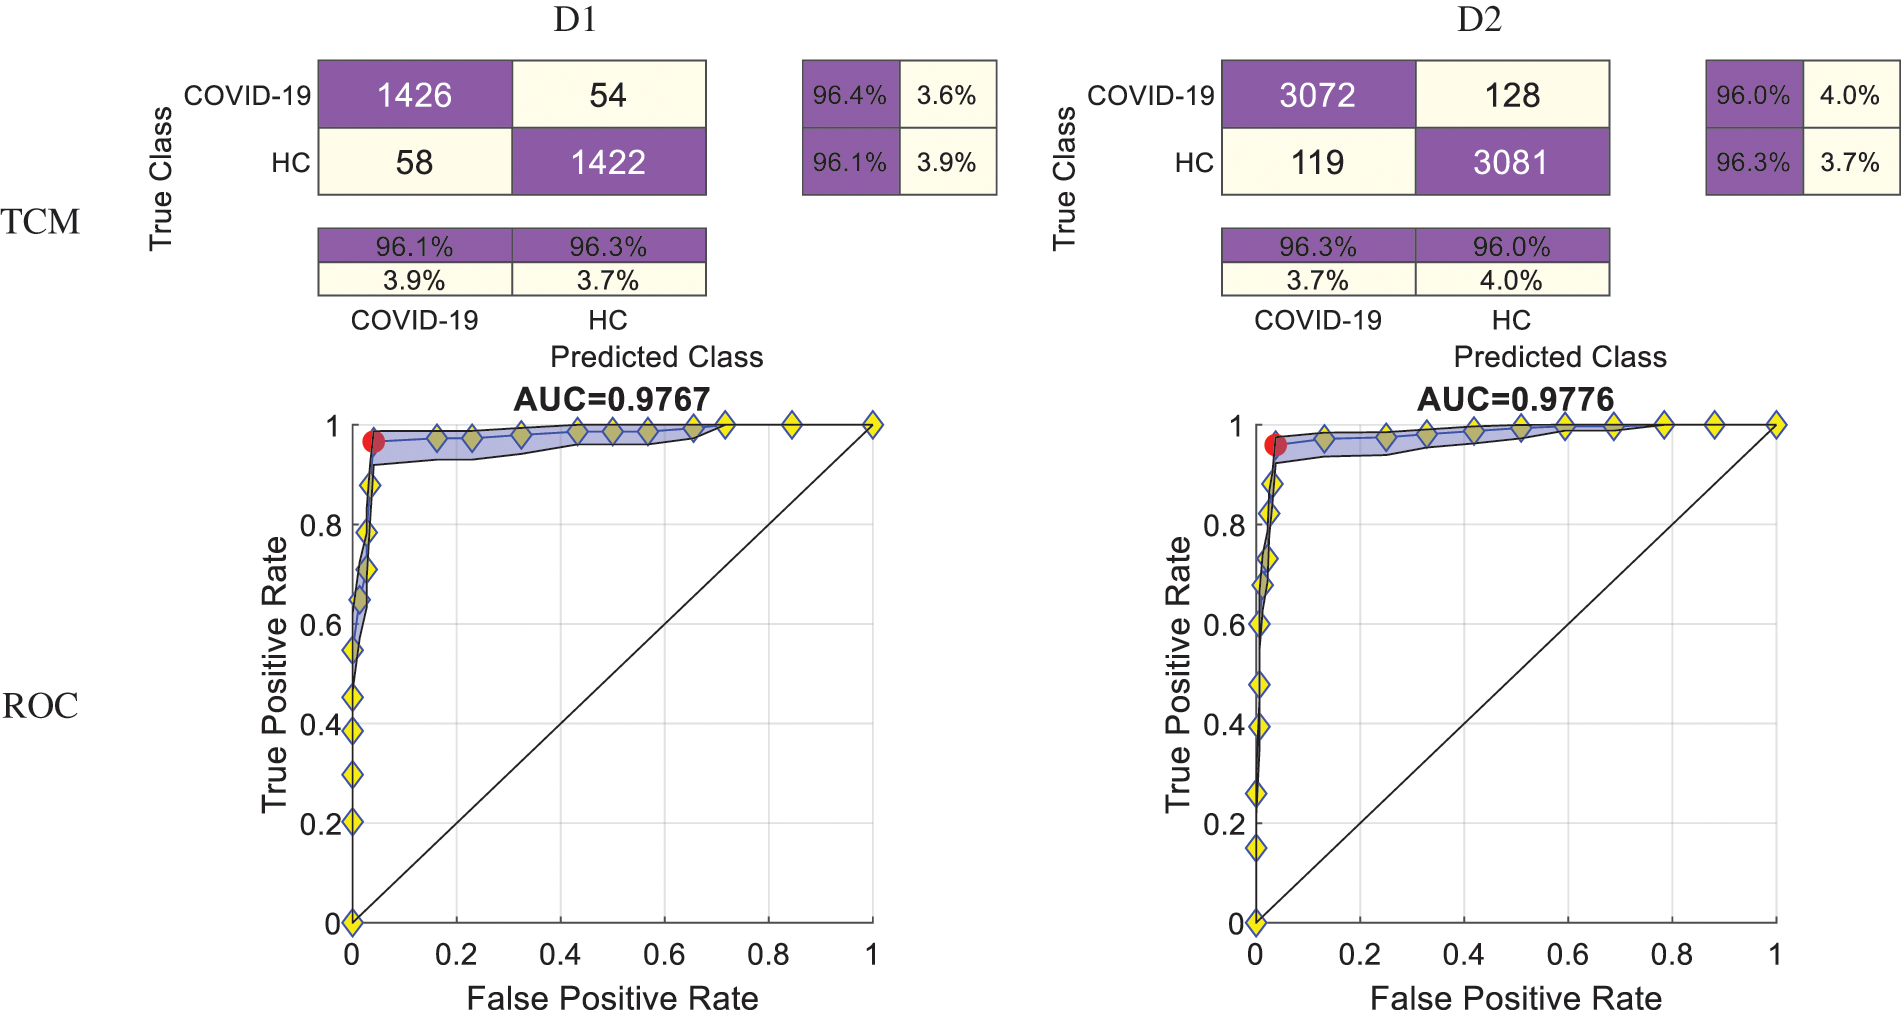
Figure 8: TCMs and ROC curves of two datasets
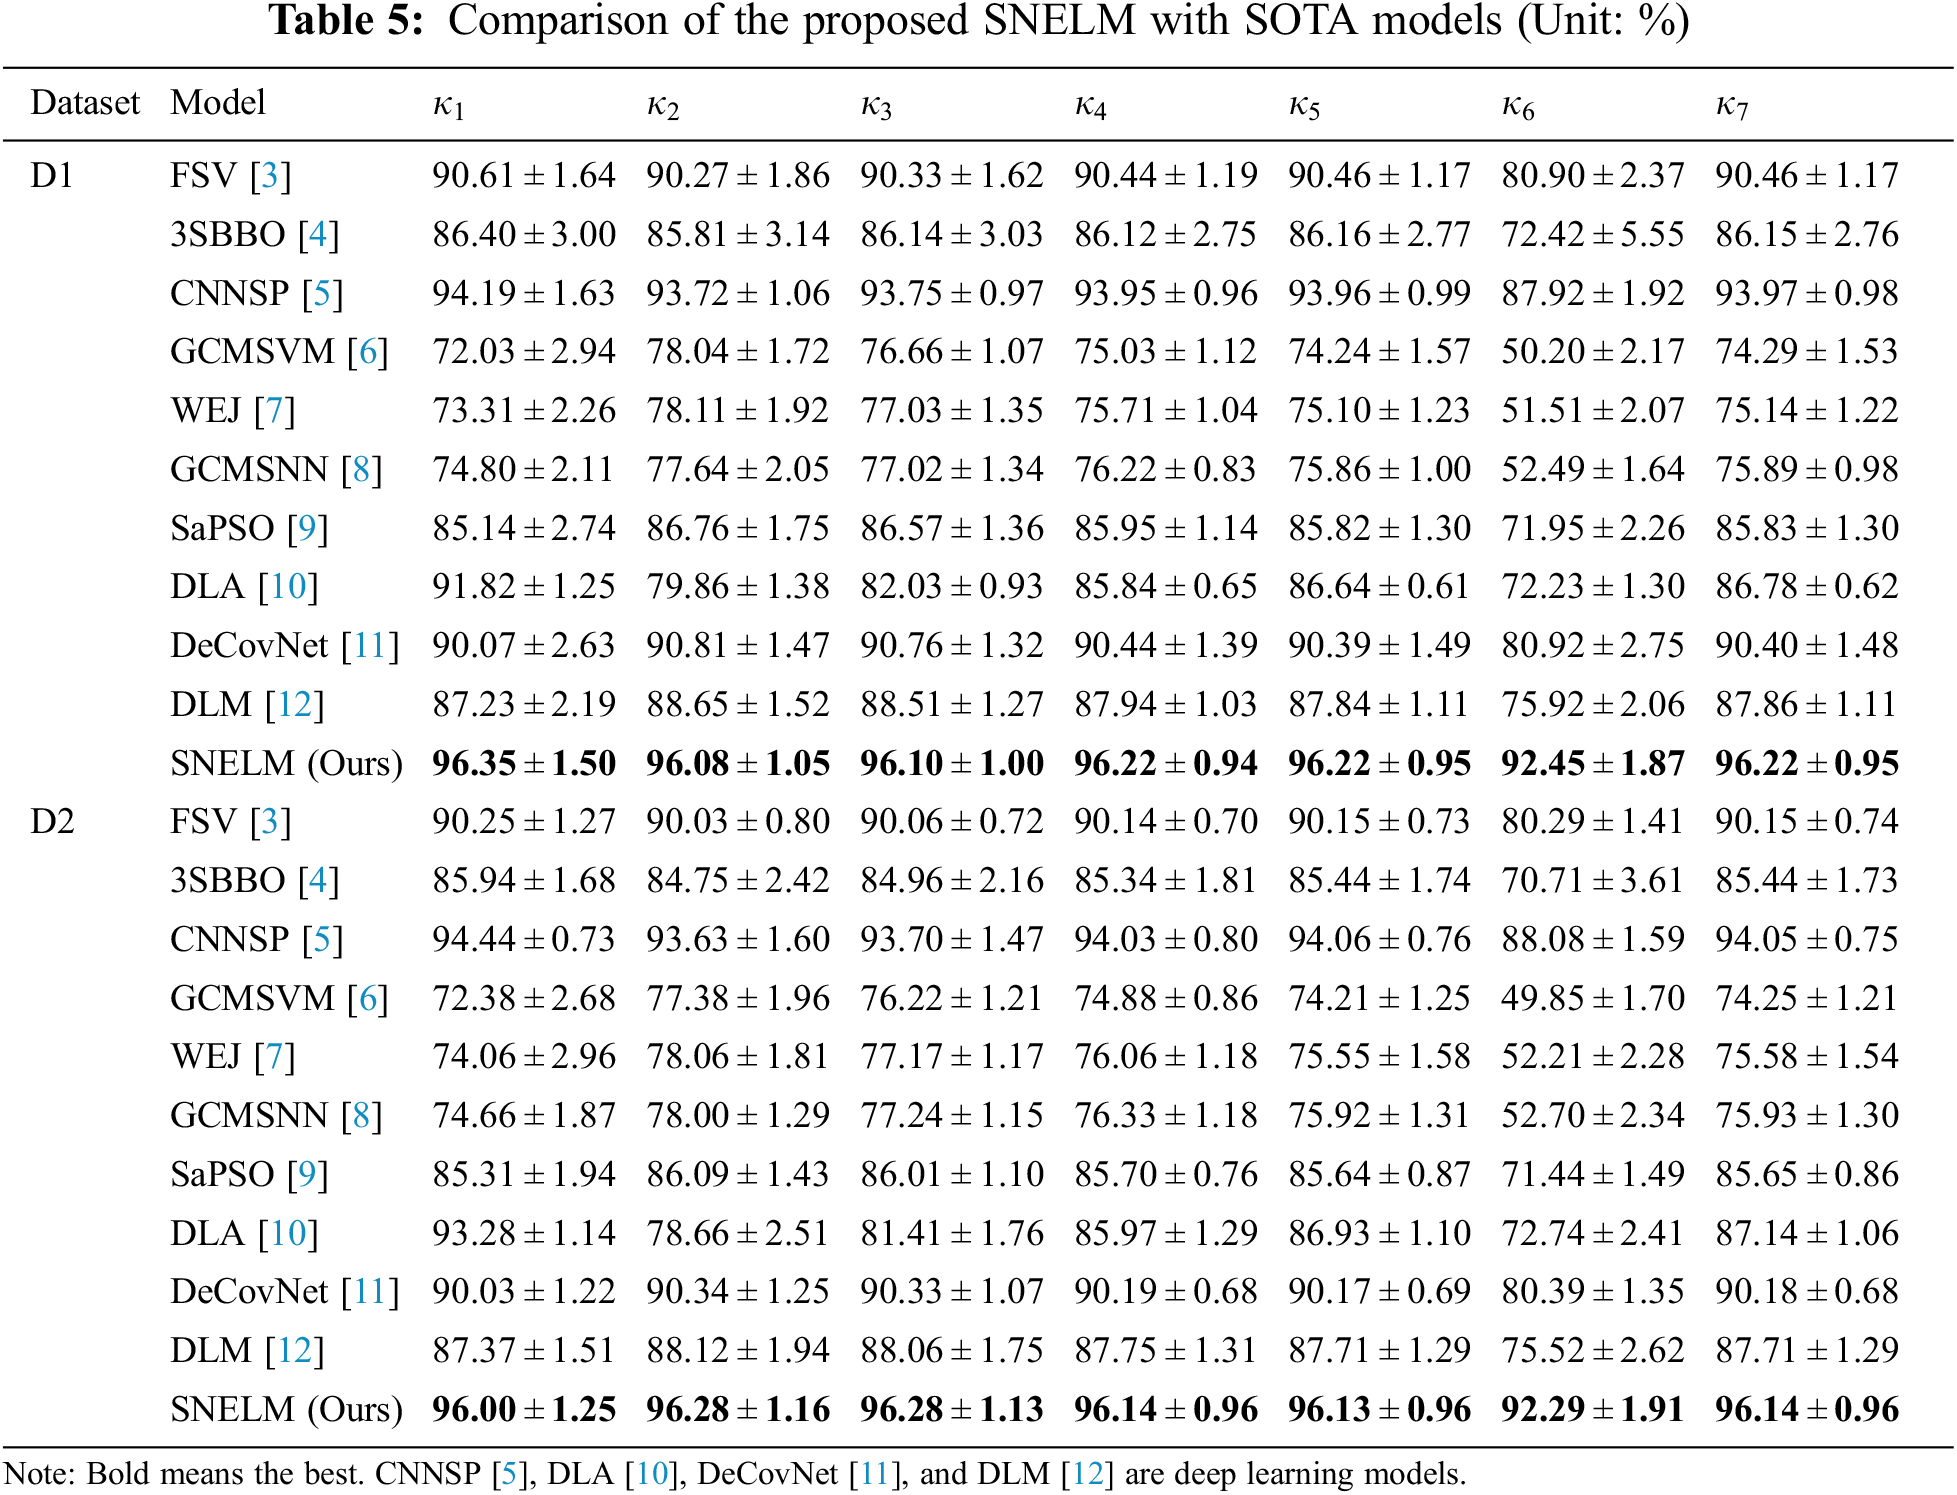
4.5 Comparison with State-of-the-Art Models
The SNELM model is compared with seven state-of-the-art COVID-19 recognition models over two datasets. The comparison models consist of FSV [3], 3SBBO [4], CNNSP [5], GCMSVM [6], WEJ [7], GCMSNN [8], SaPSO [9], DLA [10], DeCovNet [11], and DLM [12]. Particularly, CNNSP [5], DLA [10], DeCovNet [11], and DLM [12] are deep learning models. The results on two datasets are itemized in Table 5. As we can observe, the proposed SNELM outperforms other state-of-the-art models in both datasets.
Error bar (EB) can assist in observing the differences in the model’s performances. Fig. 9 displays the EB of different models over two datasets. It shows that the performance of this proposed SNELM model is higher than those of seven state-of-the-art models. The reason of the success of SNELM model may lie in three points: (i) MDA helps increase the size of training set significantly. (ii) The SN with complex bypass helps extract efficient features. (iii) ELM serves as an effective classifier.
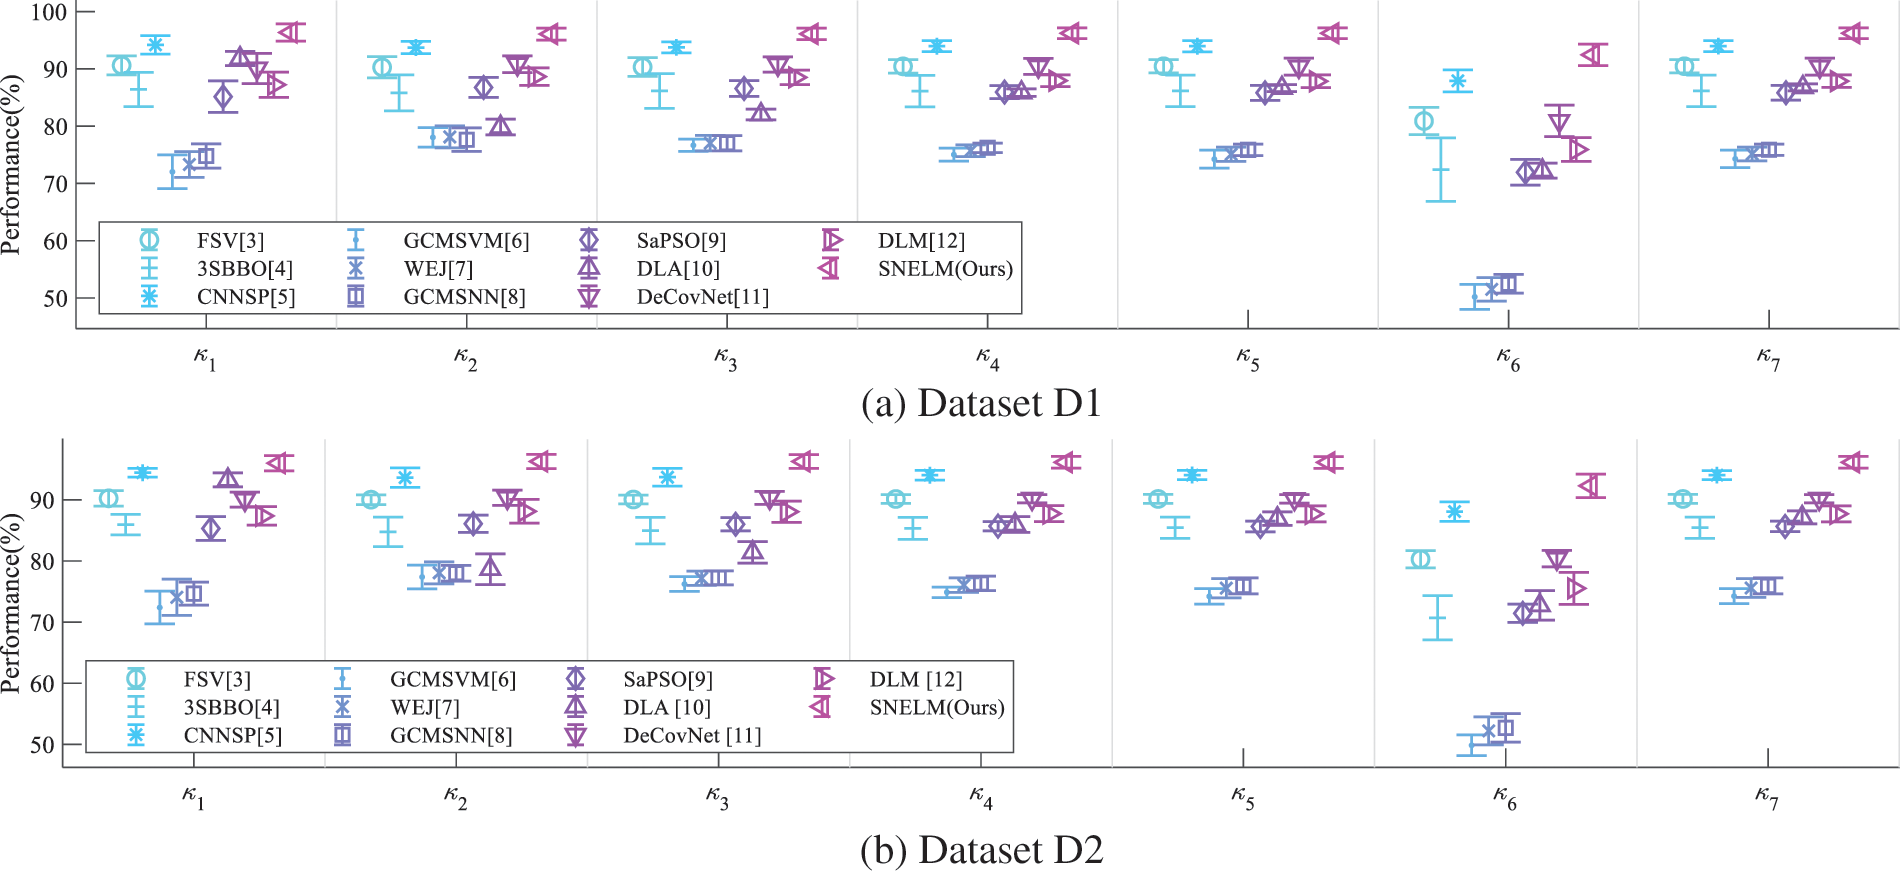
Figure 9: EBs of model comparison
This study proposes an innovative SNELM model for COVID-19 detection. The MDA is used to increase the size of the training set. The SN with complex bypass is employed to generate SN features. ELM is used as the classifier. This proposed SNELM model can produce higher results than seven state-of-the-art models.
There are three deficiencies of the proposed SNELM model: (i) Strict clinical validation is not tested. (ii) The SNELM model is a black box. (iii) Other chest-related infectious diseases are not considered.
In our future studies, our team first shall distribute the proposed SNELM model to the online cloud computing environment (such as Microsoft Azure or Amazon Web Services). Second, we intend to incorporate Gram-CAM into this model to make it explainable. Third, chest-related infectious diseases, such as tuberculosis or pneumonia, will be added to our task.
Funding Statement: This paper is partially supported by Medical Research Council Confidence in Concept Award, UK (MC_PC_17171); Royal Society International Exchanges Cost Share Award, UK (RP202G0230); British Heart Foundation Accelerator Award, UK (AA/18/3/34220); Hope Foundation for Cancer Research, UK (RM60G0680); Global Challenges Research Fund (GCRF), UK (P202PF11); Sino-UK Industrial Fund, UK (RP202G0289); LIAS Pioneering Partnerships award, UK (P202ED10); Data Science Enhancement Fund, UK (P202RE237).
Conflicts of Interest: The authors declare that they have no conflicts of interest to report regarding the present study.
References
1. B. Joob and V. Wiwantikit, “COVID-19 pcr test, cluster of false positive and importance of quality control,” Clinical Laboratory, vol. 66, pp. 2147–2147, 2020. [Google Scholar]
2. S. S. Alotaibi and A. Elaraby, “Generalized exponential fuzzy entropy approach for automatic segmentation of chest ct with COVID-19 infection,” Complexity, vol. 2022, Article ID: 7541447, 2022. [Google Scholar]
3. E. S. M. El-kenawy, A. Ibrahim, S. Mirjalili, M. M. Eid and S. E. Hussein, “Novel feature selection and voting classifier algorithms for COVID-19 classification in ct images,” IEEE Access, vol. 8, pp. 179317–179335, 2020. [Google Scholar]
4. X. Wu, “Diagnosis of COVID-19 by wavelet renyi entropy and three-segment biogeography-based optimization,” International Journal of Computational Intelligence Systems, vol. 13, pp. 1332–1344, 2020. [Google Scholar]
5. Y. D. Zhang, “A seven-layer convolutional neural network for chest ct based COVID-19 diagnosis using stochastic pooling,” IEEE Sensors Journal, pp. 1–1, 2020, https://doi.org/10.1109/JSEN.2020.3025855 (Online First). [Google Scholar]
6. Y. Chen, “COVID-19 classification based on gray-level co-occurrence matrix and support vector machine,” In: K. C. Santosh and A. Joshi, (Eds.COVID-19: Prediction, Decision-Making, and its Impacts, Singapore: Springer, pp. 47–55, 2020. [Google Scholar]
7. W. Wang, “COVID-19 detection by wavelet entropy and jaya,” Lecture Notes in Computer Science, vol. 12836, pp. 499–508, 2021. [Google Scholar]
8. P. Pi, “Gray level co-occurrence matrix and schmitt neural network for COVID-19 diagnosis,” EAI Endorsed Transactions on e-Learning, vol. 7, pp. e3, 2021. [Google Scholar]
9. W. Wang, “COVID-19 detection by wavelet entropy and self-adaptive pso,” Lecture Notes in Computer Science, vol. 13258, pp. 125–135, 2022. [Google Scholar]
10. Q. Q. Ni, Z. Y. Sun, L. Qi, W. Chen, Y. Yang et al., “A deep learning approach to characterize 2019 coronavirus disease (COVID-19) pneumonia in chest ct images,” European Radiology, vol. 30, pp. 6517–6527, 2020. [Google Scholar]
11. X. G. Wang, X. B. Deng, Q. Fu, Q. Zhou, J. P. Feng et al., “A weakly-supervised framework for COVID-19 classification and lesion localization from chest ct,” IEEE Transactions on Medical Imaging, vol. 39, pp. 2615–2625, 2020. [Google Scholar]
12. S. A. Gafoor, N. Sampathila, M. Madhushankara and K. S. Swathi, “Deep learning model for detection of COVID-19 utilizing the chest x-ray images,” Cogent Engineering, vol. 9, Article ID: 2079221, 2022. [Google Scholar]
13. F. Özyurt, E. Sert and D. Avcı, “An expert system for brain tumor detection: Fuzzy c-means with super resolution and convolutional neural network with extreme learning machine,” Medical Hypotheses, vol. 134, pp. 109433, 2020. [Google Scholar]
14. V. Govindaraj, “Deep rank-based average pooling network for COVID-19 recognition,” Computers, Materials & Continua, vol. 70, pp. 2797–2813, 2022. [Google Scholar]
15. R. Y. Lin, Y. H. Xu, H. Ghani, M. H. Li and C. C. J. Kuo, “Demystify squeeze networks and go beyond,” in Conf. on Applications of Digital Image Processing XLIII, Bellingham, USA, pp. 11510, 2020. [Google Scholar]
16. A. Ullah, H. Elahi, Z. Y. Sun, A. Khatoon and I. Ahmad, “Comparative analysis of alexnet, resnet18 and squeezenet with diverse modification and arduous implementation,” Arabian Journal for Science and Engineering, vol. 47, pp. 2397–2417, 2022. [Google Scholar]
17. F. N. Iandola, S. Han, M. W. Moskewicz, K. Ashraf, W. J. Dally et al., “Squeezenet: Alexnet-level accuracy with 50x fewer parameters and <0.5 mb model size,” arXiv preprint arXiv:1602.07360, 2016. [Google Scholar]
18. L. S. Bernardo, R. Damasevicius, V. H. C. de Albuquerque and R. Maskeliunas, “A hybrid two-stage squeezenet and support vector machine system for Parkinson’s disease detection based on handwritten spiral patterns,” International Journal of Applied Mathematics and Computer Science, vol. 31, pp. 549–561, 2021. [Google Scholar]
19. S. Tummalapalli, L. Kumar, L. B. M. Neti and A. Krishna, “Detection of web service anti-patterns using weighted extreme learning machine,” Computer Standards & Interfaces, vol. 82, Article ID: 103621, 2022. [Google Scholar]
20. R. G. Moghadam, B. Yaghoubi, A. Rajabi, S. Shabanlou and M. A. Izadbakhsh, “Evaluation of discharge coefficient of triangular side orifices by using regularized extreme learning machine,” Applied Water Science, vol. 12, Article ID: 145, 2022. [Google Scholar]
21. D. Chicco and G. Jurman, “The advantages of the matthews correlation coefficient (mcc) over f1 score and accuracy in binary classification evaluation,” BMC Genomics, vol. 21, Article ID: 6, 2020. [Google Scholar]
Cite This Article
 Copyright © 2023 The Author(s). Published by Tech Science Press.
This work is licensed under a Creative Commons Attribution 4.0 International License , which permits unrestricted use, distribution, and reproduction in any medium, provided the original work is properly cited.
 Downloads
 Citation Tools