
 Submit a Paper
 Propose a Special lssue
 Open Access
ARTICLE

Predicting Bitcoin Trends Through Machine Learning Using Sentiment Analysis with Technical Indicators
1 Department of Applied Artificial Intelligence/Department of Human-Artificial Intelligence Interaction, Sungkyunkwan University, Seoul, 03063, Korea
2 Department of Interaction Science/Department of Human-Artificial Intelligence Interaction, Sungkyunkwan University, Seoul, 03063, Korea
* Corresponding Author: Jang Hyun Kim. Email:
Computer Systems Science and Engineering 2023, 46(2), 2231-2246. https://doi.org/10.32604/csse.2023.034466
Received 18 July 2022; Accepted 10 October 2022; Issue published 09 February 2023
 View Full Text
 Download PDF
Abstract
Predicting Bitcoin price trends is necessary because they represent the overall trend of the cryptocurrency market. As the history of the Bitcoin market is short and price volatility is high, studies have been conducted on the factors affecting changes in Bitcoin prices. Experiments have been conducted to predict Bitcoin prices using Twitter content. However, the amount of data was limited, and prices were predicted for only a short period (less than two years). In this study, data from Reddit and LexisNexis, covering a period of more than four years, were collected. These data were utilized to estimate and compare the performance of the six machine learning techniques by adding technical and sentiment indicators to the price data along with the volume of posts. An accuracy of 90.57% and an area under the receiver operating characteristic curve value (AUC) of 97.48% were obtained using the extreme gradient boosting (XGBoost). It was shown that the use of both sentiment index using valence aware dictionary and sentiment reasoner (VADER) and 11 technical indicators utilizing moving average, relative strength index (RSI), stochastic oscillators in predicting Bitcoin price trends can produce significant results. Thus, the input features used in the paper can be applied on Bitcoin price prediction. Furthermore, this approach allows investors to make better decisions regarding Bitcoin-related investments.Keywords
Bitcoin is a digital currency that utilizes blockchain, a decentralized encryption technology that enables payments or remittances within a short time between parties without the utilization of a financial company [1]. Since the late 2000s, various cryptocurrencies have emerged, attracting the attention of early adopters and technicians interested in blockchain technology and its effects. In particular, market interest in cryptocurrencies increased in late 2017 and early 2018, with Bitcoin and other cryptocurrencies recording unprecedented returns [2,3]. Although the controversy over the merits of blockchain technology and the value of cryptocurrency continues, the cryptocurrency market has formed on a considerable scale, and the number of institutional and individual investors has steadily increased [4,5]. Recently, the market capitalization of cryptocurrency has reached 1.1 trillion dollars [6]. In this regard, cryptocurrencies including Bitcoin are being recognized as a class of assets and cryptocurrency-related regulations are gradually being established. According to previous studies, cryptocurrency can be utilized for purposes such as portfolio diversification and hedging of portfolios [7–11].
Bitcoin is a representative asset in the cryptocurrency market. Since its launch on January 3, 2009, Bitcoin has become a symbolic asset leading to the cryptocurrency market [12]. According to [13], Bitcoin’s market share accounts for 35%–75% of the total cryptocurrency market value, and other cryptocurrencies tend to move along with the price trends of Bitcoin [14]. Therefore, if the price trends of Bitcoin can be predicted, it can provide a big opportunity for cryptocurrency investors. In addition, understanding of the factors influencing Bitcoin’s price formation is important from a global economic point of view.
However, the cryptocurrency market has a short history and is highly volatile. Thus, unlike traditional assets, achieving good predictive performance based simply on past sequential price data and technical indicators is not possible. Unlike stock investors, who can acquire various types of information to gauge the value of a company, cryptocurrency investors tend to rely on media information because there is a lack of evidence to judge the value of cryptocurrency. According to [15,16], the cryptocurrency market reacts strongly to news and social media. Studies have been conducted on how the sentiments evoked by news or social media in the public affect the decision to invest in cryptocurrencies. In other words, various studies have predicted a correlation between the sentiment index of text data and Bitcoin price movements. However, most of the existing studies employed only the sentiment index and price data [17–19].
In this study, a methodology using both sentiment index and technical indicators is presented. Social media data were collected from Reddit and news data were obtained from LexisNexis. Additionally, investor sentiment was contemplated by adopting a sentiment index with a daily posting volume to existing historical price data and various technical indicators. The effectiveness of predicting Bitcoin price movements was explored by considering both emotional and technical indicators. Diverse machine learning models were employed: logistic regression, naïve Bayes, support vector machine (SVM), random forest, extreme gradient boosting (XGBoost), and light gradient boost model (LightGBM). The current section is followed by the Related Works section which examines relevant literature. The Methods section describes data collection and analytical processes. The Results section reports the findings, and the Conclusion section reveals the implications of this study.
First, the authors briefly reviewed previous studies on the factors affecting the price change of Bitcoin. Second, studies using sentiment analysis in predicting Bitcoin prices were illustrated. Lastly, research on prediction tasks using diverse machine learning models in several domains were examined.
2.1 Factors Affecting Changes in the Price of Bitcoin
With the rapid growth of the cryptocurrency market, various studies on Bitcoin have been conducted. Owing to the high volatility and short history of Bitcoin, researchers have focused on the factors that affect its price. According to [20], external shocks, including interest rates and exchange rate fluctuations affect Bitcoin prices. In [21], the price of Bitcoin was found to be unrelated to or negatively correlated with other types of financial assets such as gold, dollars, and major stock market indices. Reference [22] found that speculative sentiment of investors toward Bitcoin has a significant impact on price changes in short-term. It was suggested in [23] that fundamental factors such as real use in transactions and money supply affect the long-term price of Bitcoin, and investors’ interest in cryptocurrency reinforces this phenomenon. In [24], Google search term queries were used on Bitcoin to reveal that global interest in Bitcoin precedes price increases; in contrast, prices fall when fear of market collapse increases. In [25], it was found that public interest and Bitcoin prices had a high correlation. Pearson’s correlation coefficient was utilized to show that Twitter sentiment helps predict changes in Bitcoin prices [26]. In [15], it was also revealed that Twitter sentiment and text volume affect the Bitcoin price. However, it is difficult to predict the price trends of Bitcoin by considering only these fragmentary factors.
2.2 Study on Predicting Bitcoin Prices Using Sentiment Analysis
In recent years, studies have been conducted by considering social media, forums, and news posts to use investor and public interest sentiments to predict the price of Bitcoin. In [17], the sentiment score acquired using the valence aware dictionary and sentiment reasoner (VADER) during the Coronavirus disease-2019 pandemic had an important correlation with short-term trends in Bitcoin prices. In [18], SVM, regression models, and Twitter sentiments were adopted to gauge changes in the price of Bitcoin. In [19], logistic regression with tweets and news headlines was used to predict price alterations in Bitcoin and Ethereum. The methodology showed 43.9% accuracy for price increases and 61.9% accuracy for price decreases. Based on previous studies, using social media or news data can be an appropriate approach to assess the overall investor sentiment. In addition, the authors focused on the fact that more accurate predictions could be made if technical indicators which are used in stock or cryptocurrency trading were considered together.
2.3 Machine Learning for Prediction
Various machine learning algorithms are being used in several domains on performing prediction tasks. For instance, machine learning models were adopted to predict tourist satisfaction in the tourism industry [27]. The task was performed by employing survey data using K-nearest neighbor (KNN), tree, SVM, random forest, naïve Bayes, and gradient boost models. The gradient boost model outperformed the others with an accuracy of over 0.99. Table 1 presents studies on the application of machine learning technologies for predictive tasks in various fields. Customer attrition was anticipated in accordance with customer loyalty and conversion costs through various structured bank data, including company size and savings deposits [28]. They found that a convolutional neural network (CNN) performed the best in this task. In [29,30], machine-learning methods were utilized to improve user satisfaction through application reviews. Along with LightGBM, logistic regression and XGBoost yielded prominent outcomes. Experiments were conducted using LightGBM and logistic regression to calculate purchase intention based on service-experience data [31]. The predictive performance of LightGBM was better than that of logistic regression. In [32], it was suggested that applying machine learning algorithms to cardiovascular disease prediction is promising, specifically revealing that SVM can outperform other models in the medical domain. In [33], machine learning approaches were employed to anticipate fatty liver disease. Random Forest executed best with an area under the receiver operating characteristic curve (AUC) value over 0.92. An ensemble of different machine-learning classifiers was utilized for diabetes prediction [34]. The ensemble model with adaptive boosting (AdaBoost) and XGBoost achieved an AUC value of 0.95. In [35], the authors aimed to predict stroke outcomes by applying natural-language processing-based machine learning to brain MRI radiation reports. The results illustrated that multi-CNN produced the highest performance among the machine learning models utilized while achieving an AUC value of 0.80. In [36], an experiment was performed by employing a CNN, SVM, and ANN to analyze customer satisfaction. They found that the CNN performed better on classification tasks than the other two models. Reference [37] used seven types of machine learning models to classify airline customer feedback sentiments into three classes and revealed that random forest had the best performance with an F1-score of 0.86. In addition to the studies reviewed above, machine learning has exhibited excellent efficiency in prediction tasks and is being actively applied in several domains [38–41].

In this section, description on overall flow of the experiment is stated. First, data collection for the experiment was conducted. Afterward, preprocessing was performed to remove unnecessary text data. Second, the technical indicators were calculated from the price data, and the sentiment index was calculated from the text data. After merging the processed data, scaling was applied to match the scale of the data. Lastly, classification was performed by putting scaled data into input of six machine learning models. Accuracy, AUC, F1-score were adopted as evaluation metrics for classification performance. The overall flow of the experiments is shown in Fig. 1.
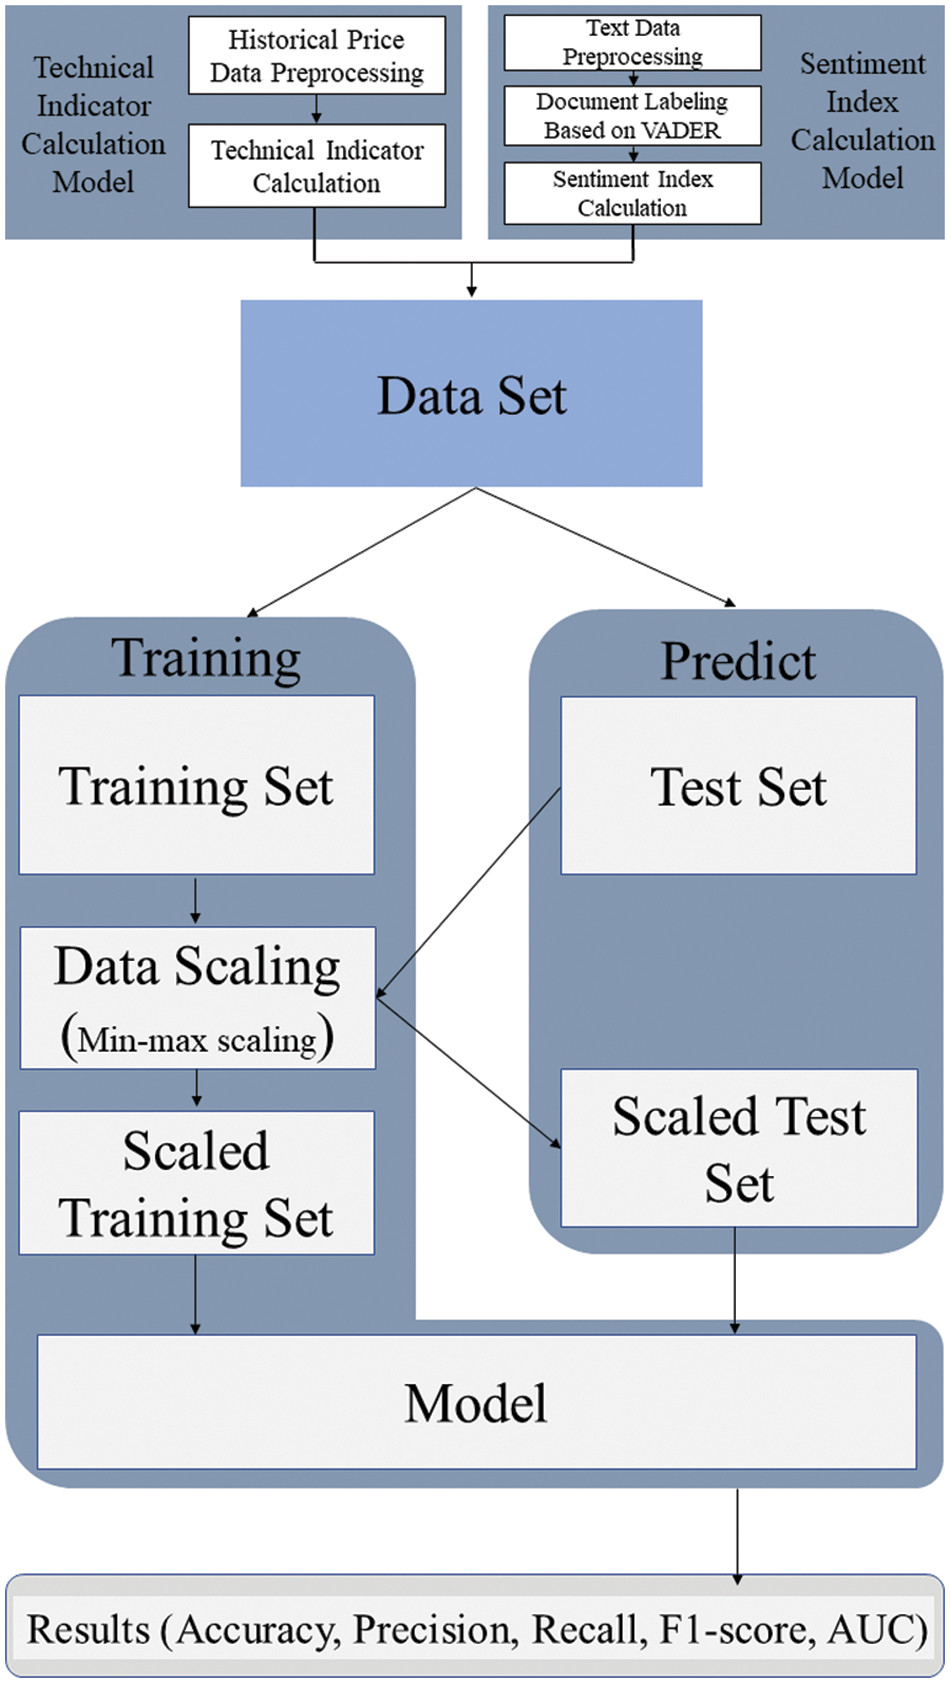
Figure 1: Experimental flowchart for predicting Bitcoin price trends
3.1 Data Description and Collection
Because the price of Bitcoin represents the overall trend in the cryptocurrency market, data on the entire cryptocurrency market must be collected to predict these values [42]. Hence, news and social media data from August 1, 2017 to February 28, 2022 were acquired using various search queries. In all, 26,441 data were collected from news articles obtained using “Bitcoin,” “Crypto,” “Virtual Asset,” “Ethereum,” “BTC,” “ETH,” and “Blockchain” queries from LexisNexis. On Reddit, submissions and comments contained in r/Bitcoin, r/Ethereum, and r/cryptocurrency subreddits were collected using the Pushshift application programming interface (API). A total of 359,943 submissions and 26,003,561 comments were collected. Bitcoin price data based on the U.S. dollar were collected from Investing.com, which included dates, closing prices, opening prices, high prices, low prices, transaction volumes.
In the Bitcoin price data, the values obtained by subtracting the opening price from the closing price on a daily basis were defined as fluctuations (Fig. 2). Upward fluctuations were labeled 1, and downward fluctuations were labeled 0. Of the 1645 days of data, 862 days were labeled as 1 and 783 days were classified as 0 (Fig. 3). Because there was no significant difference in the amount of data between the two classes, data balancing was not performed.
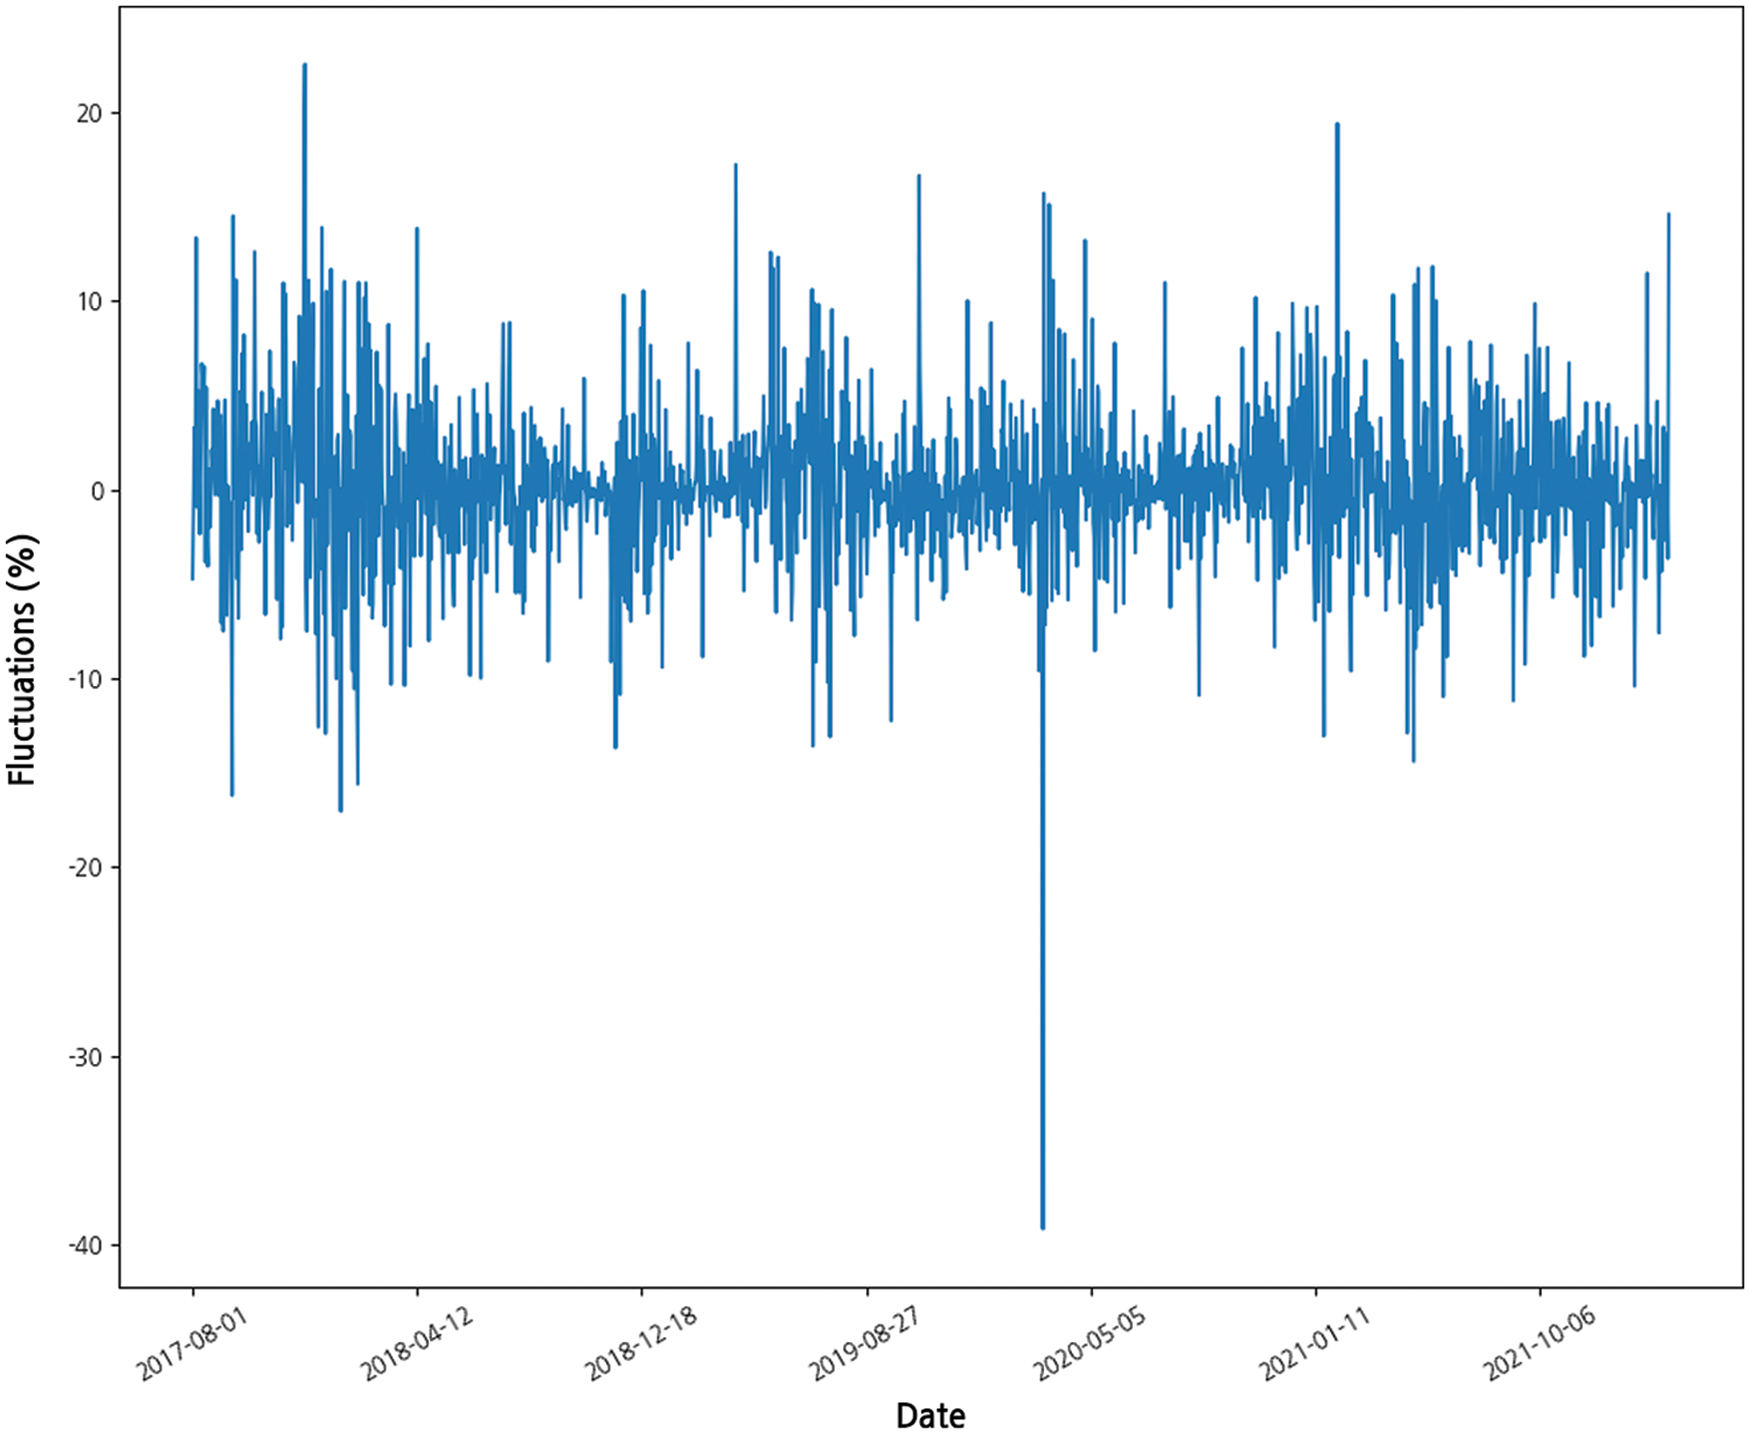
Figure 2: Fluctuations in Bitcoin prices
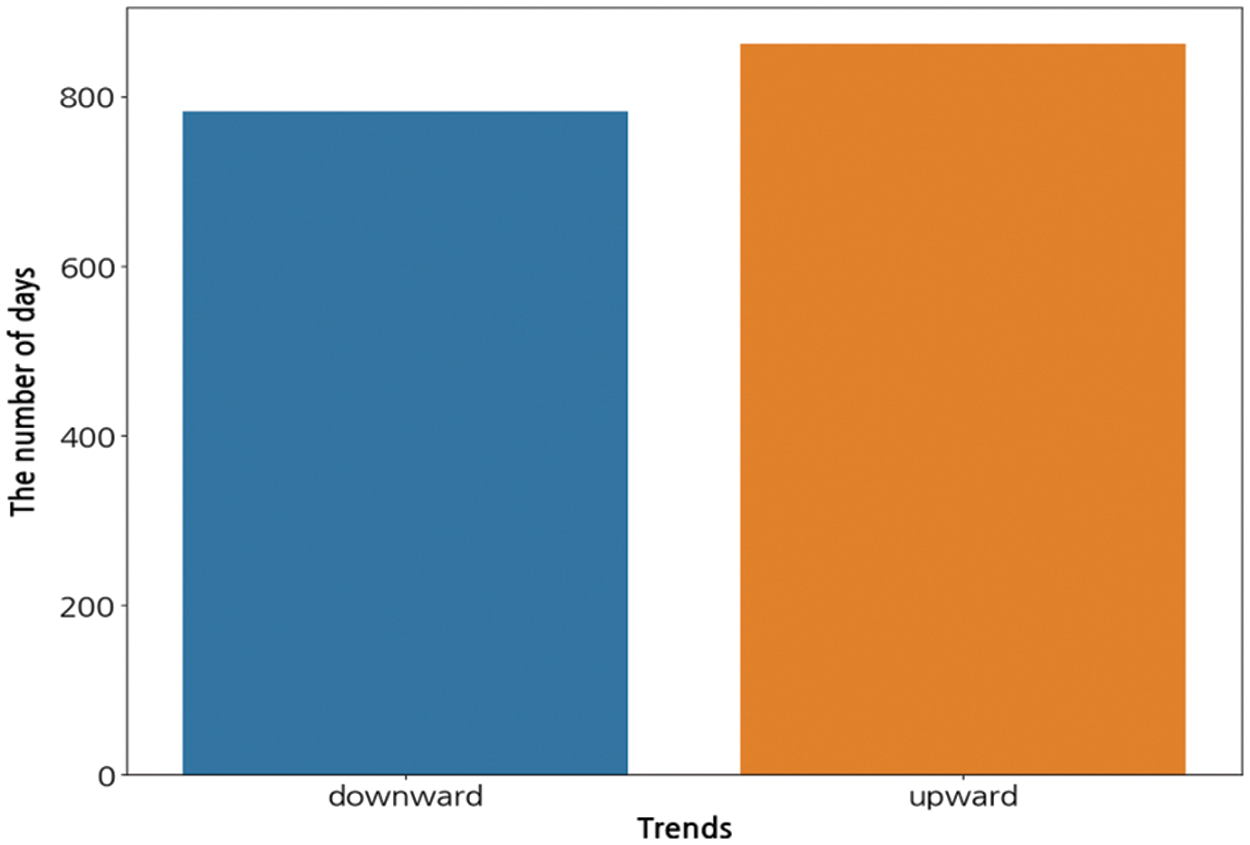
Figure 3: Description of the label distributions
Widely used technical indicators were selected by referring to existing papers on stock price predictions [43,44]. Technical indicators were calculated by employing the collected Bitcoin price data using the Python TA-lib library. The equation for each technical indicator is as follows.
The relative strength index (RSI) can be between 0 and 100. The closer this value is to zero, the stronger the selling pressure; the closer it is to 100, the stronger the buying pressure [44].
where relative strength (RS) is the average increase in closing price during the calculation period divided by the average decrease in closing price during the same period. The value of t was set to 14 days in the experiments. The simple moving average (SMA) is the most basic moving average and is calculated by adding the closing price for the past specific days and dividing it by the number of days [45].
where CM is the current closing price and variable t is set to 5, 20, and 60 in the experiments. The exponential moving average (EMA) is an indicator that can be applied to evaluate short-term trends by using weighted variables to increase the influence of recent values and lower that of past values [46].
where Close(t) is the current closing price and K is the exponential smoothing constant. N was set as 10 days in this experiment. Moving average convergence and divergence (MACD) is an indicator of the convergence and spread of the moving average line, and the MACD signal is the 9-day MACD moving average [47].
The short-term EMA was set to 12 days and the long-term EMA was set to 26 days in the experiments. The stochastic RSI is a technical indicator used to determine whether an asset has been overbought or oversold.
where RSI denotes the current RSI and min [RSI] and max [RSI] represent the highest and lowest RSI readings over the last 14 days, respectively. Similarly, stochastic oscillators are technical indicators that can detect pattern breakthroughs and trend reversals [48].
where Ht and Lt represent the highest and lowest prices over the previous three days, respectively, and C is the most recent closing price.
Duplicate and missing values were removed from the textual data. After posts containing uniform resource locators were discarded, uppercase letters were converted to lowercase letters and special characters were extracted. After the submissions, comments, and news were integrated into a single dataset, sentiment analysis was performed. VADER, a lexicon-based unsupervised method, was used to preprocess text data to obtain a compound score [49]. The threshold of the compound score was set to 0.1, and each post was labeled as a positive class if its value was higher than or equal to the threshold and a negative class if it was smaller than the threshold. Based on [50], the sentiment measure was calculated as the difference in the number of negative and positive posts on a given date (Fig. 4).
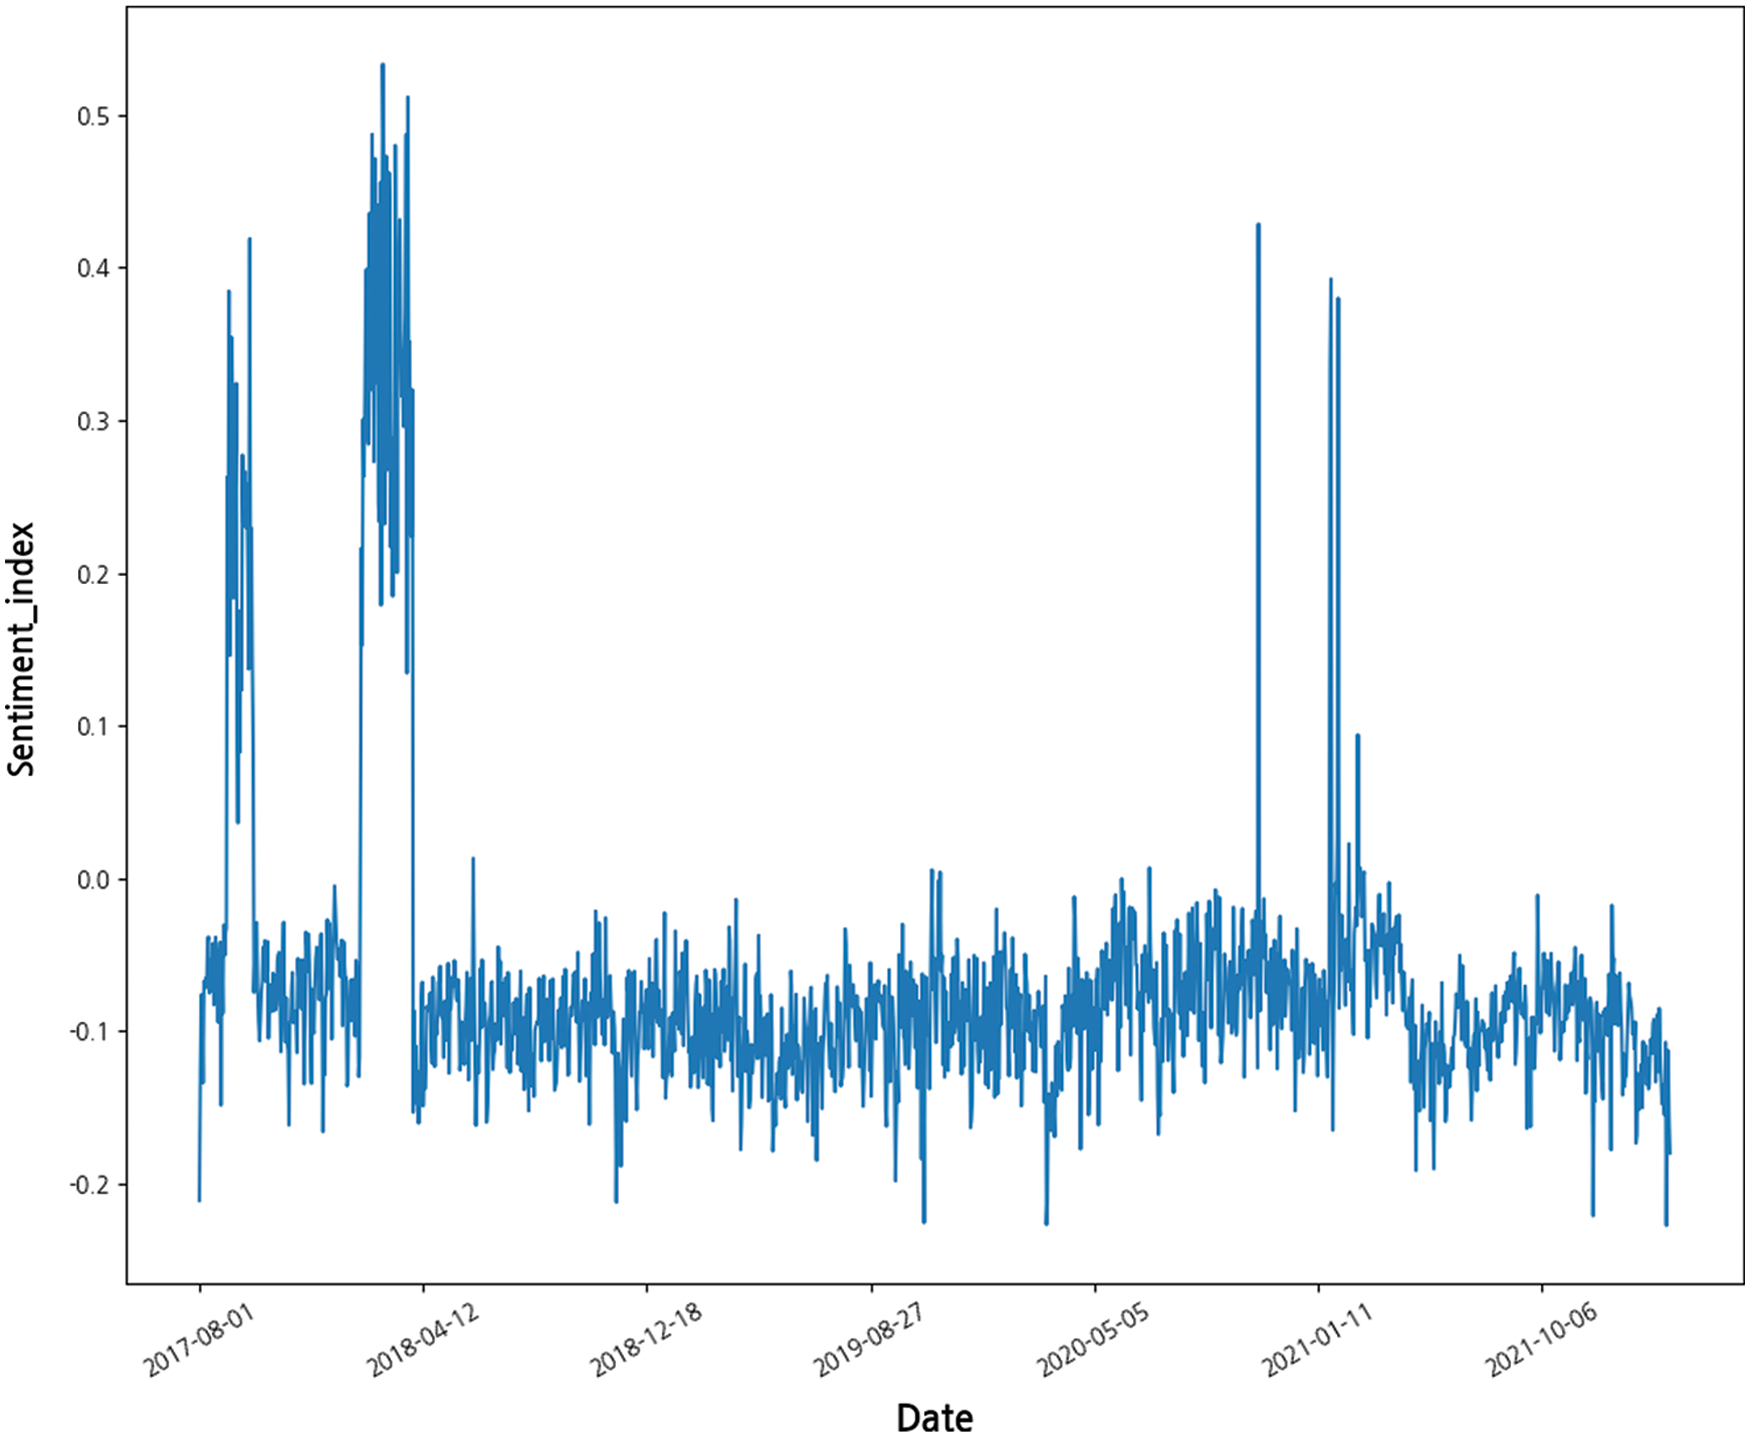
Figure 4: Distribution of sentiment index
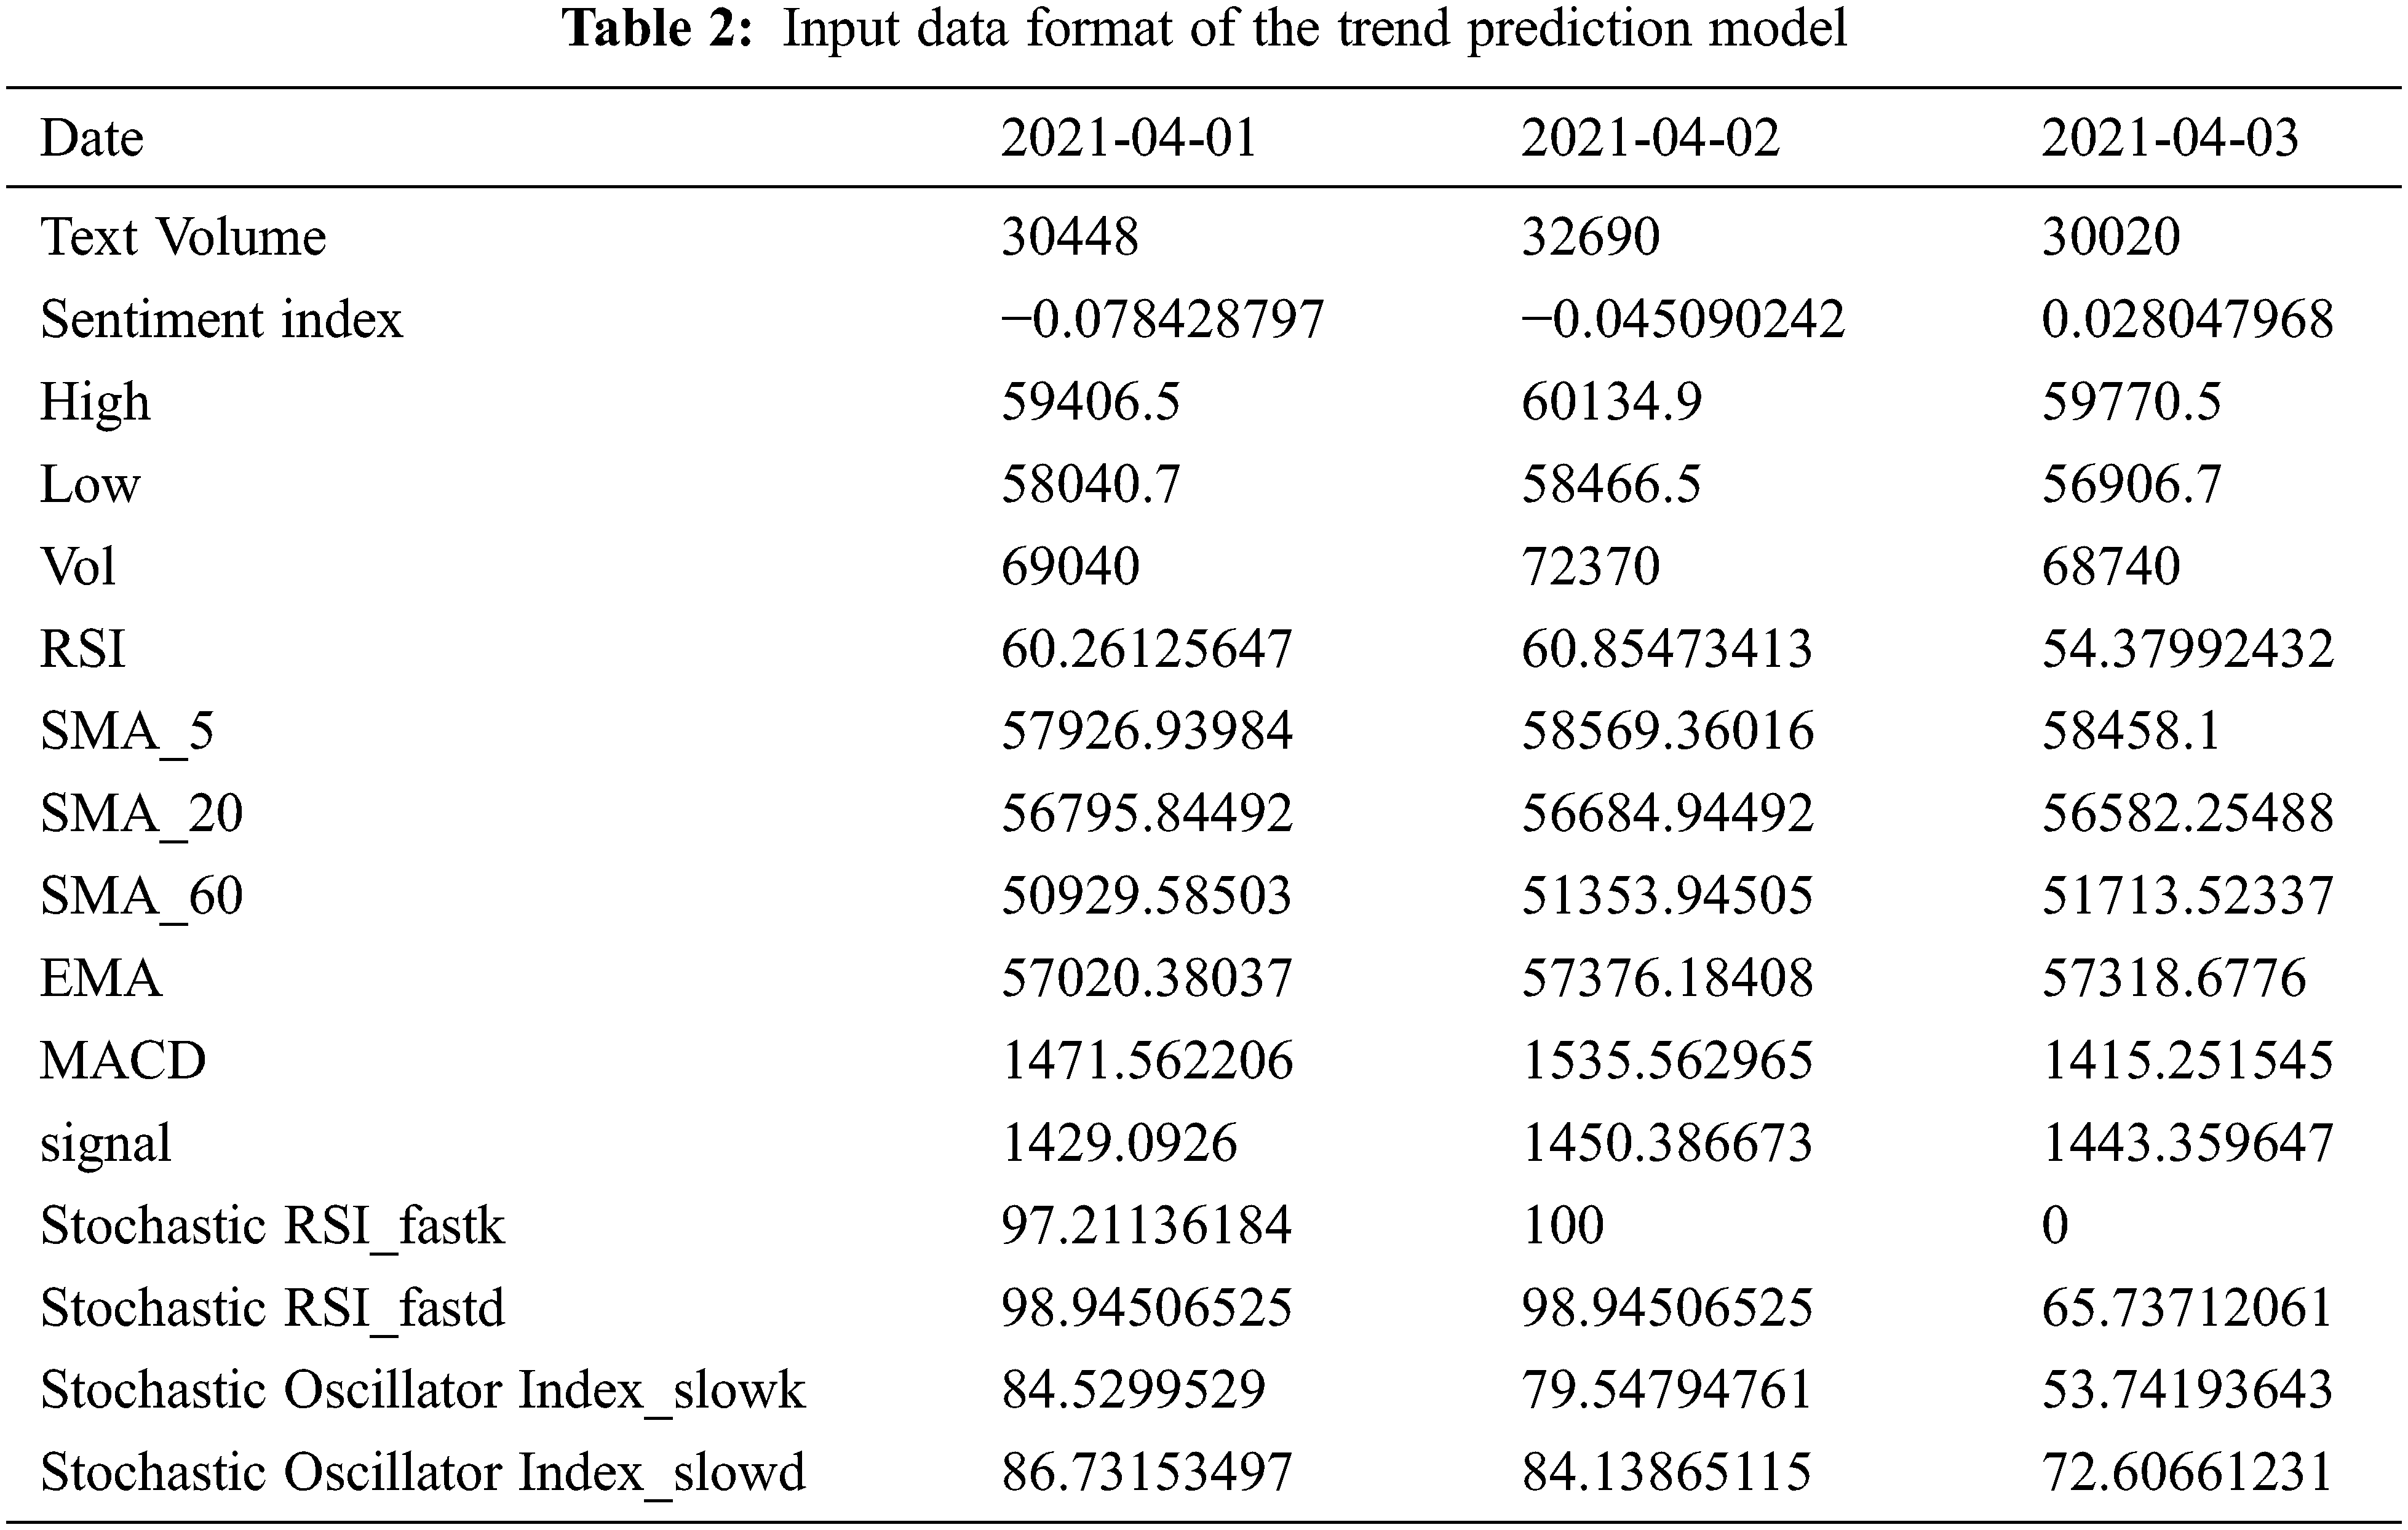
where Mtpos is the total amount of positive articles and Reddit statements, and Mtneg is the total number of negative articles and Reddit statements on the day t, respectively. The range of values for the sentiment index was limited from −0.5 to 0.5. If the sentiment index is close to −0.5, then most posts on that day contain a negative tone, whereas if it is close to 0.5, posts mostly contain a positive tone. Based on previous studies in which the post volume was shown to affect price fluctuations, the total post volume was added to the feature [15,51]. Table 2 shows the input data format of the trend prediction model before scaling.
After merging features, the training and test data were divided in the ratio of 8:2 [52]. Data from August 1, 2017, to March 31, 2021, were used as training data, and data from April 1, 2021, to February 28, 2022, were used as test data.
A MinMax Scaler was used to match the scale of the data. After the training set was fitted, normalization was performed on the test dataset. Finally, 16 features were used as inputs to the model: the highest and lowest prices, trading volume, RSI, SMA-5, SMA-20, SMA-60, EMA, MACD, MACD signal, stochastic RSI-fastk, stochastic RSI-fastd, stochastic oscillator index-slowk, stochastic oscillator index-slowd, sentiment index, and text volume.
In this study, the results were compared and verified using various algorithms, ranging from traditionally used methods to recently used methods for classification tasks (Fig. 1). Six machine-learning classifiers were employed: logistic regression, SVM, naïve Bayes, random forest, XGBoost, and LightGBM. To optimize the model, the scikit-learn package in Python was employed, and the optimal hyperparameter combination was explored through a grid search. In addition, the parameters were checked using 5-fold cross-validation.
Logistic regression is an algorithm proposed in 1958 [53]. This method is used to predict the likelihood of an event using a linear combination of independent variables. Binary classification using logistic regression is simple but performs well on various tasks. The logistic hypothesis and the time complexity are as follows:
where
The naïve Bayes is a probability classifier algorithm that applies the Bayesian theorem, which postulates that individual independent variables of all dimensions are conditionally independent [54]. Despite its simple assumptions and designs, the naïve Bayes classifier operates well in many complex real-world circumstances and is used for classification problems in various fields. The Bayesian theorem and the time complexity are as follows:
where
SVM is an algorithm that obtains the optimal decision boundary, that is, the hyperplane for classification, which maximizes the margin, representing the distance between the decision boundary and the support vector [55]. After defining the decision boundary, when a new input arrives, the classification task is carried out by checking the side of the boundary to which it belongs. Classification using SVM is robust and less likely to overfit. However, there is a disadvantage in that testing is necessary for various combinations of parameters. The margin for the support vector and time complexity are as shown in the following equation:
where w is the weight of hyperplane and n denotes the number of training examples.
Random forest is an ensemble machine learning model [56]. First, multiple decision trees are formed. Then, new data points are simultaneously passed through each tree, and the final classification result is selected through major voting. This algorithm prevents overfitting by generating numerous trees. The decision trees operate in a manner that minimizes entropy.
where pi denotes the frequentist probability of class i in the training data, k′ is the number of trees, n is the number of training examples, and m is the number of features.
XGBoost is an ensemble technique that uses a combination of several weak decision trees [57]. A strong prediction model is created by placing a weight on the learning error of the weak prediction models and sequentially reflecting it in the next learning model. Although the learning and classification speeds are very high because of parallel processing, overfitting easily occurs without proper parameter tuning. XGBoost aims to minimize the following objective functions.
where
LightGBM is a decision-tree-based learning algorithm with a gradient-boosting framework [58]. While most of learning algorithms based on decision tree extend trees level-wise, LightGBM extends trees leafwise. Because the LightGBM continuously splits leaf nodes with maximum delta loss without balancing the tree, the tree is deep and asymmetrical. If the tree is continuously divided, the prediction error can be minimized by comparison with that obtained using the balanced tree division method. Because of this feature, the LightGBM can easily handle large-sized data and consumes less memory when running. However, the LightGBM can only produce good results when appropriate parameter tuning is applied. The time complexity of LightGBM is as follows:
In accordance with the guidelines in [59,60], the effectiveness of a classifier can be summarized using a confusion matrix (Table 3). Four results were obtained from the confusion matrix: the accuracy, recall, precision, and F1-score. In addition, the AUC value was used to assess the robustness of the classifier. The closer the AUC is to 1, the better is the performance of the class-distinguishing model, and it is sometimes used as a measurement parameter to replace accuracy [61]. XGBoost showed the highest accuracy of 90.57% and an AUC value of 97.48. LightGBM showed good performance with an accuracy of 89.36% and an AUC value of 96.96% (Table 4, Fig. 5).

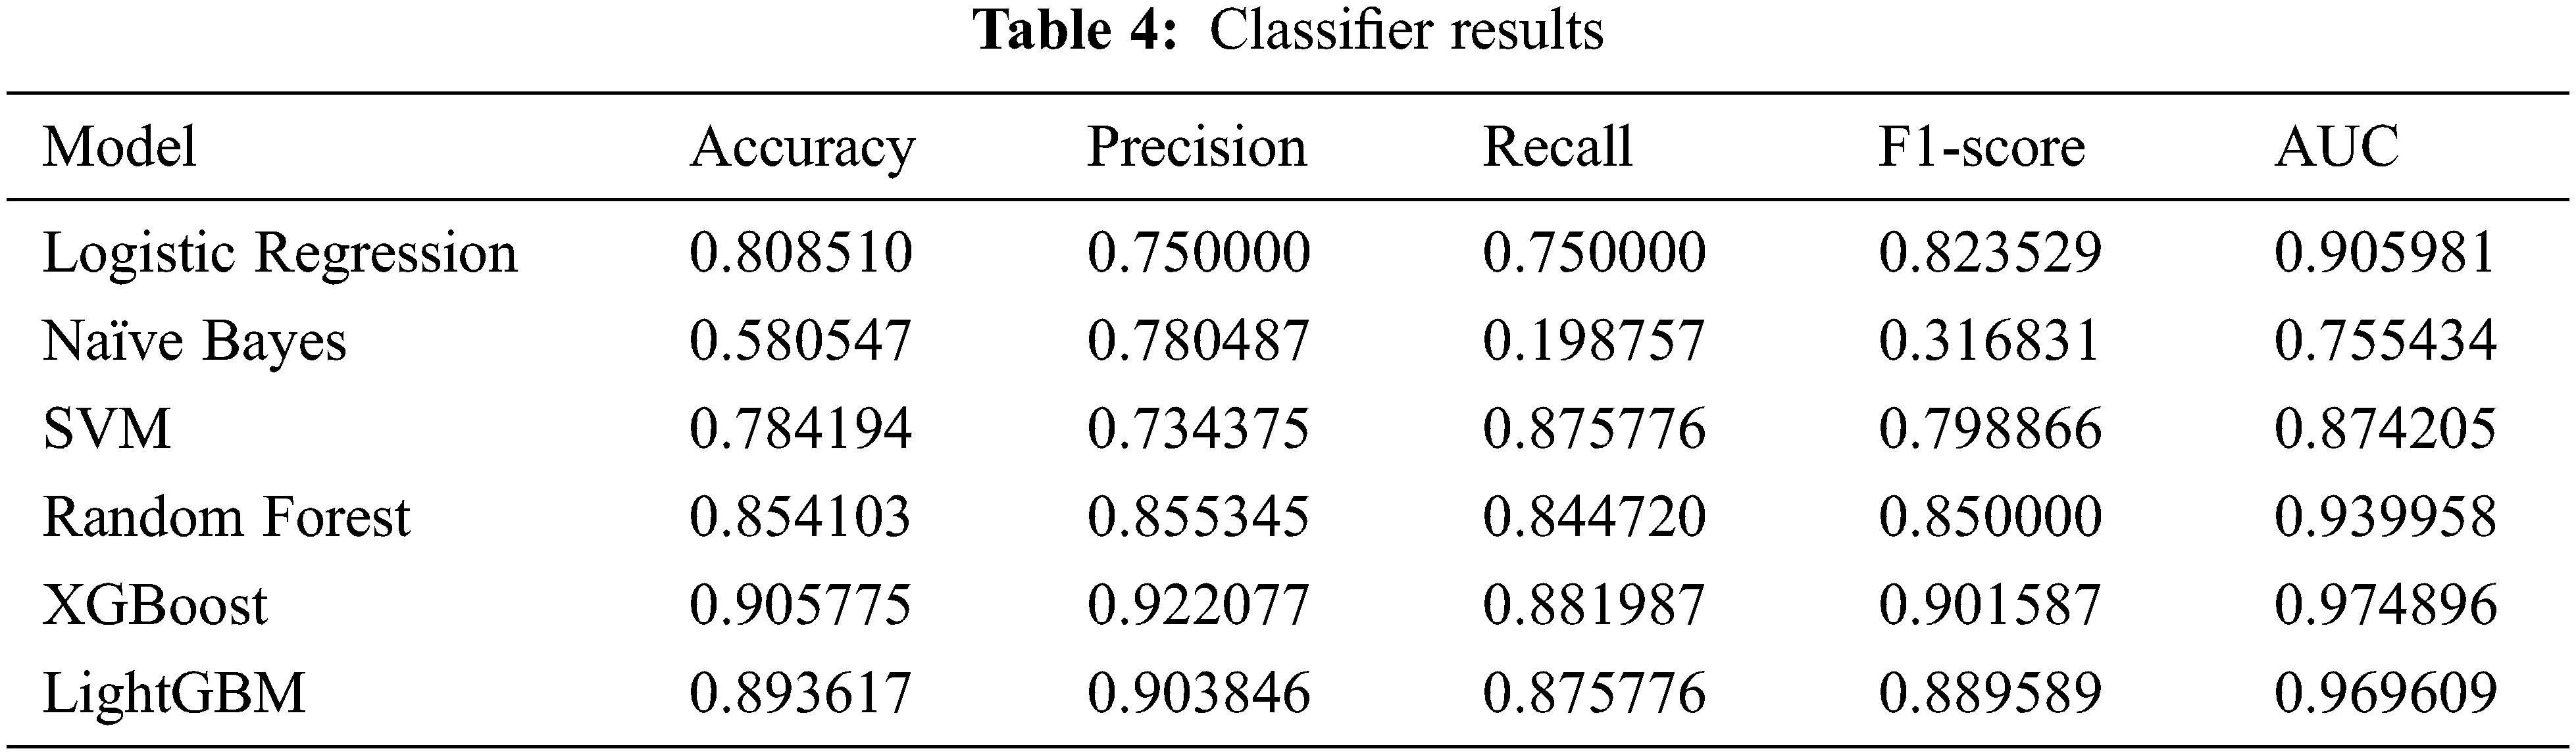
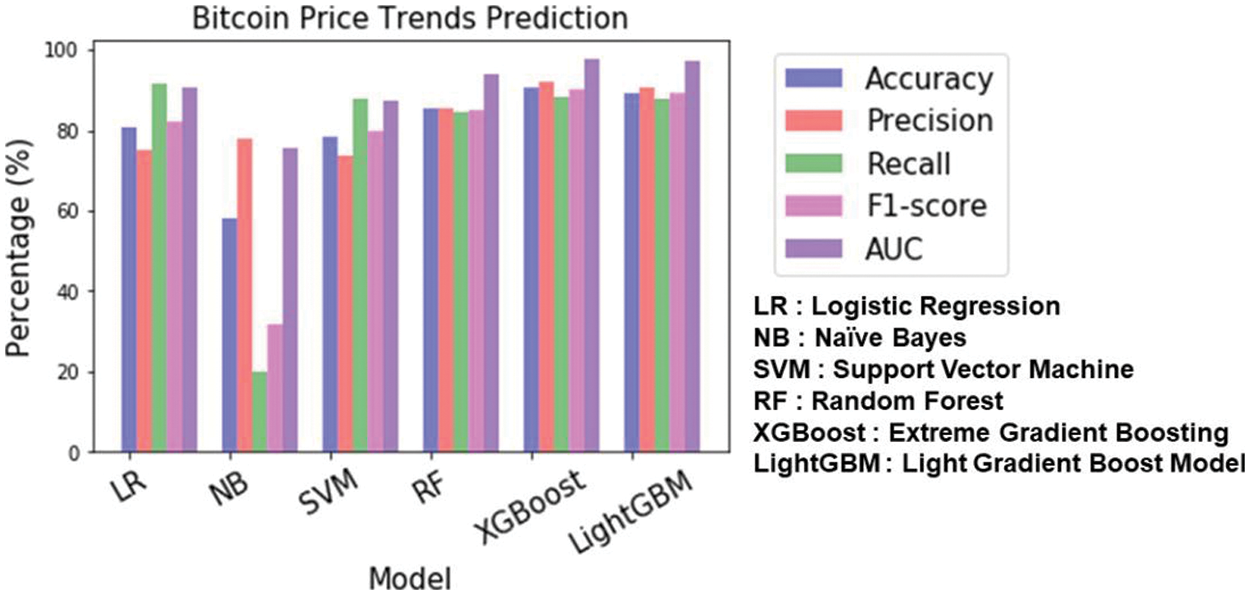
Figure 5: Results of predicting the trends in the price of Bitcoin
The cryptocurrency market has grown rapidly and market awareness continues to increase [62]. As the number of institutions and individual investors increases, cryptocurrencies are being recognized as a type of asset. Thus, predicting the price of Bitcoin is a necessary financial task. To predict the trends in the price of Bitcoin, logistic regression with tweets and news headlines was used, and a 61.9% accuracy for price decreases and 43.9% accuracy for price increases were obtained [15]. In [63], an accuracy of 72% and precision of 76% were achieved using a multilayer perceptron, SVM, and random forest classifiers with Twitter data.
However, previous studies have certain shortcomings. First, the data collected using the Twitter API were limited because only 180 tweets were amassed every 15 min, indicating that the experiment was conducted using only a fraction of all posts that were posted. Second, the prediction task for Bitcoin prices was performed over a short period.
To overcome the limitations of previous studies, this study gathered data from Reddit, another representative social media platform, to complement the limitations of Twitter data [64]. Unlike Twitter, which is limited in terms of data collection using the API, all submissions and comments were collected using Reddit's Pushshift API. In addition to the amount of data, data from Reddit are less noisy because users communicate within a specific topic bulletin board called a subreddit. In addition, experiments were performed using data spanning four years.
Finally, three indicators were applied as inputs to the model: technical indicators calculated using Bitcoin price data, sentiment index, and volume calculated from Reddit and news text. XGBoost showed the highest performance on the task, with an accuracy of 90.57% and an AUC value of 97.48%.
Based on this accuracy, upward and downward fluctuations in the price of Bitcoin may be predicted. Our study demonstrated that using technical indicators with a sentiment index and post volume helps predict trends in the price of Bitcoin. Therefore, the input features can be applied in future research on Bitcoin price prediction.
Current study has limitations that need to be improved in the future. First, lexicon-based unsupervised learning has lower accuracy than labeled data. Additionally, lexicon-based learning may not have optimal performance on unstructured text data. Second, the trend was not predicted in real time using inputs in hours or minutes but rather on a daily basis. Finally, the model showed high performance in predicting price trends. However, the magnitude of the fluctuations or the actual price was not predicted.
Acknowledgement: We would like to thank Editage (www.editage.co.kr) for English language editing.
Funding Statement: This study was supported by a National Research Foundation of Korea (NRF) (http://nrf.re.kr/eng/index) grant funded by the Korean government (NRF-2020R1A2C1014957).
Conflicts of Interest: The authors declare that they have no conflicts of interest to report regarding the present study.
References
1. R. Böhme, N. Christin, B. Edelman and T. Moore, “Bitcoin: Economics, technology, and governance,” Journal of Economic Perspectives, vol. 29, no. 2, pp. 213–238, 2015. [Google Scholar]
2. CoinDesk, 2017. [Online]. Available: https://www.coindesk.com/markets/2017/12/29/from-900-to-20000-bitcoins-historic-2017-price-run-revisited/. [Google Scholar]
3. Fortune, 2018. [Online]. Available: https://fortune.com/2018/01/03/ripple-price-crypto-currency/. [Google Scholar]
4. Time, 2022. [Online]. Available: https://time.com/nextadvisor/investing/cryptocurrency/things-to-know-for-new-crypto-investors/. [Google Scholar]
5. Cointelegraph, 2021. [Online]. Available: https://cointelegraph.com/news/institutional-investors-increase-their-crypto-holdings-for-5th-straight-week. [Google Scholar]
6. Cointelegraph, 2022. [Online]. Available: https://cointelegraph.com/news/total-crypto-market-cap-reclaims-1-trillion-as-bitcoin-ethereum-and-altcoins-breakout. [Google Scholar]
7. E. Bouri, P. Molnár, G. Azzi, D. Roubaud and L. I. Hagfors, “On the hedge and safe haven properties of Bitcoin: Is it really more than a diversifier?,” Finance Research Letters, vol. 20, no. 19, pp. 192–198, 2017. [Google Scholar]
8. K. Guesmi, S. Saadi, I. Abid and Z. Ftiti, “Portfolio diversification with virtual currency: Evidence from bitcoin,” International Review of Financial Analysis, vol. 63, no. 19, pp. 431–437, 2019. [Google Scholar]
9. A. Urquhart and H. Zhang, “Is Bitcoin a hedge or safe haven for currencies? An intraday analysis,” International Review of Financial Analysis, vol. 63, no. 2, pp. 49–57, 2019. [Google Scholar]
10. A. Kliber, P. Marszałek, I. Musiałkowska and K. Świerczyńska, “Bitcoin: Safe haven, hedge or diversifier? Perception of bitcoin in the context of a country’s economic situation—A stochastic volatility approach,” Physica A: Statistical Mechanics and its Applications, vol. 524, no. 50, pp. 246–257, 2019. [Google Scholar]
11. S. Corbet, A. Meegan, C. Larkin, B. Lucey and L. Yarovaya, “Exploring the dynamic relationships between cryptocurrencies and other financial assets,” Economics Letters, vol. 165, no. 1, pp. 28–34, 2018. [Google Scholar]
12. S. Nakamoto, “Bitcoin: A peer-to-peer electronic cash system,” Decentralized Business Review, pp. 21260, 2008. [Google Scholar]
13. MakeUseOf, 2022. [Online]. Available: https://www.makeuseof.com/what-is-btc-dominance/. [Google Scholar]
14. P. Ciaian and M. Rajcaniova, “Virtual relationships: Short-and long-run evidence from BitCoin and altcoin markets,” Journal of International Financial Markets, Institutions and Money, vol. 52, no. 2, pp. 173–195, 2018. [Google Scholar]
15. O. Kraaijeveld and J. De Smedt, “The predictive power of public Twitter sentiment for forecasting cryptocurrency prices,” Journal of International Financial Markets, Institutions and Money, vol. 65, no. 4, pp. 101188, 2020. [Google Scholar]
16. M. Poongodi, T. N. Nguyen, M. Hamdi and K. Cengiz, “Global cryptocurrency trend prediction using social media,” Information Processing & Management, vol. 58, no. 6, pp. 102708, 2021. [Google Scholar]
17. T. Pano and R. Kashef, “A complete VADER-based sentiment analysis of bitcoin (BTC) tweets during the era of COVID-19,” Big Data and Cognitive Computing, vol. 4, no. 4, pp. 33, 2020. [Google Scholar]
18. I. Georgoula, D. Pournarakis, C. Bilanakos, D. Sotiropoulos and G. M. Giaglis, “Using time-series and sentiment analysis to detect the determinants of bitcoin prices,” 2015. [Online]. Available: SSRN-id2607167. [Google Scholar]
19. C. Lamon, E. Nielsen and E. Redondo, “Cryptocurrency price prediction using news and social media sentiment,” SMU Data Science Review, vol. 1, no. 3, pp. 1–22, 2017. [Google Scholar]
20. T. Panagiotidis, T. Stengos and O. Vravosinos, “The effects of markets, uncertainty and search intensity on bitcoin returns,” International Review of Financial Analysis, vol. 63, no. 1, pp. 220–242, 2019. [Google Scholar]
21. A. H. Dyhrberg, “Bitcoin, gold and the dollar—A GARCH volatility analysis,” Finance Research Letters, vol. 16, no. 2, pp. 85–92, 2016. [Google Scholar]
22. P. Ciaian, M. Rajcaniova and D. A. Kancs, “The economics of BitCoin price formation,” Applied Economics, vol. 48, no. 19, pp. 1799–1815, 2016. [Google Scholar]
23. L. Kristoufek, “What are the main drivers of the Bitcoin price? Evidence from wavelet coherence analysis,” PLoS One, vol. 10, no. 4, pp. e0123923, 2015. [Google Scholar]
24. R. Hakim das Neves, “Bitcoin pricing: Impact of attractiveness variables,” Financial Innovation, vol. 6, no. 1, pp. 1–18, 2020. [Google Scholar]
25. Y. Kaya, “Analysis of cryptocurrency market and drivers of the Bitcoin price: Understanding the price drivers of Bitcoin under speculative environment,” M.S. thesis, Department of Industrial Engineering and Management, KTH Royal Institute of Technology, Stockholm, Sweden, 2018. [Google Scholar]
26. T. R. Li, A. S. Chamrajnagar, X. R. Fong, N. R. Rizik and F. Fu, “Sentiment-based prediction of alternative cryptocurrency price fluctuations using gradient boosting tree model,” Frontiers in Physics, vol. 7, no. 98, pp. 170623, 2019. [Google Scholar]
27. D. Shrestha, T. Wenan, B. Gaudel, N. Rajkarnikar and S. R. Jeong, “Multi-dimensional analysis and prediction model for tourist satisfaction,” KSII Transactions on Internet and Information Systems (TIIS), vol. 16, no. 2, pp. 480–502, 2022. [Google Scholar]
28. H. Jung and B. G. Lee, “The impact of transforming unstructured data into structured data on a churn prediction model for loan customers,” KSII Transactions on Internet and Information Systems (TIIS), vol. 14, no. 12, pp. 4706–4724, 2020. [Google Scholar]
29. S. H. Lee, H. Lee and J. H. Kim, “Enhancing the prediction of user satisfaction with metaverse service through machine learning,” Computers, Materials & Continua, vol. 72, no. 3, pp. 4983–4997, 2022. [Google Scholar]
30. H. Lee, S. H. Lee, D. Nan and J. H. Kim, “Predicting user satisfaction of mobile healthcare services using machine learning: Confronting the COVID-19 pandemic,” Journal of Organizational and End User Computing (JOEUC), vol. 34, no. 6, pp. 1–17, 2022. [Google Scholar]
31. A. Sharma and M. O. Shafiq, “A comprehensive artificial intelligence based user intention assessment model from online reviews and social media,” Applied Artificial Intelligence, vol. 36, no. 1, pp. 1–26, 2022. [Google Scholar]
32. C. Krittanawong, H. U. H. Virk, S. Bangalore, Z. Wang, K. W. Johnson et al., “Machine learning prediction in cardiovascular diseases: A meta-analysis,” Scientific Reports, vol. 10, no. 1, pp. 1–11, 2020. [Google Scholar]
33. C. C. Wu, W. C. Yeh, W. D. Hsu, M. M. Islam, P. A. A. Nguyen et al., “Prediction of fatty liver disease using machine learning algorithms,” Computer Methods and Programs in Biomedicine, vol. 170, pp. 23–29, 2019. [Google Scholar]
34. M. K. Hasan, M. A. Alam, D. Das, E. Hossain and M. Hasan, “Diabetes prediction using ensembling of different machine learning classifiers,” IEEE Access, vol. 8, pp. 76516–76531, 2020. [Google Scholar]
35. T. S. Heo, Y. S. Kim, J. M. Choi, Y. S. Jeong, S. Y. Seo et al., “Prediction of stroke outcome using natural language processing-based machine learning of radiology report of brain MRI,” Journal of Personalized Medicine, vol. 10, no. 4, pp. 286, 2020. [Google Scholar]
36. S. Kumar and M. Zymbler, “A machine learning approach to analyze customer satisfaction from airline tweets,” Journal of Big Data, vol. 6, no. 1, pp. 1–16, 2019. [Google Scholar]
37. A. Rane and A. Kumar, “Sentiment classification system of Twitter data for US airline service analysis,” in 2018 IEEE 42nd Annual Computer Software and Applications Conf. (COMPSAC), Tokyo, Japan, vol. 1, pp. 769–773, 2018. [Google Scholar]
38. S. Chatterjee, A. Ghatak, R. Nikte, S. Gupta and A. Kumar, “Measuring SERVQUAL dimensions and their importance for customer-satisfaction using online reviews: A text mining approach,” Journal of Enterprise Information Management, vol. 11, no. 1, pp. 1, 2022. [Google Scholar]
39. S. Chatterjee, D. Goyal, A. Prakash and J. Sharma, “Exploring healthcare/health-product ecommerce satisfaction: A text mining and machine learning application,” Journal of Business Research, vol. 131, no. 2, pp. 815–825, 2021. [Google Scholar]
40. A. K. Ahmad, A. Jafar and K. Aljoumaa, “Customer churn prediction in telecom using machine learning in big data platform,” Journal of Big Data, vol. 6, no. 1, pp. 1–24, 2019. [Google Scholar]
41. M. Chiny, O. Bencharef, M. Y. Hadi and Y. Chihab, “A client-centric evaluation system to evaluate guest’s satisfaction on AirBNB using machine learning and NLP,” Applied Computational Intelligence and Soft Computing, vol. 2021, no. 9, pp. 1–14, 2021. [Google Scholar]
42. P. Ciaian and M. Rajcaniova, “Virtual relationships: Short-and long-run evidence from BitCoin and altcoin markets,” Journal of International Financial Markets, Institutions and Money, vol. 52, no. 2, pp. 173–195, 2018. [Google Scholar]
43. Y. Zhai, A. Hsu and S. K. Halgamuge, “Combining news and technical indicators in daily stock price trends prediction,” in Proc. ISNN, Nanjing, China, pp. 1087–1096, 2007. [Google Scholar]
44. R. Rosillo, D. De la Fuente and J. A. L. Brugos, “Technical analysis and the Spanish stock exchange: Testing the RSI, MACD, momentum and stochastic rules using Spanish market companies,” Applied Economics, vol. 45, no. 12, pp. 1541–1550, 2013. [Google Scholar]
45. C. A. Ellis and S. A. Parbery, “Is smarter better? A comparison of adaptive, and simple moving average trading strategies,” Research in International Business and Finance, vol. 19, no. 3, pp. 399–411, 2005. [Google Scholar]
46. M. J. S. de Souza, D. G. F. Ramos, M. G. Pena, V. A. Sobreiro and H. Kimura, “Examination of the profitability of technical analysis based on moving average strategies in BRICS,” Financial Innovation, vol. 4, no. 1, pp. 1–18, 2018. [Google Scholar]
47. J. Wang and J. Kim, “Predicting stock price trend using MACD optimized by historical volatility,” Mathematical Problems in Engineering, vol. 2018, no. 4, pp. 1–12, 2018. [Google Scholar]
48. Y. Ni, Y. C. Liao and P. Huang, “Momentum in the Chinese stock market: Evidence from stochastic oscillator indicators,” Emerging Markets Finance and Trade, vol. 51, no. sup1, pp. S99–S110, 2015. [Google Scholar]
49. C. Hutto and E. Gilbert, “Vader: A parsimonious rule-based model for sentiment analysis of social media text,” in Proc. of the Int. AAAI Conf. on Web and Social Media, Ann Arbor, Michigan, USA, vol. 8, pp. 216–225, 2014. [Google Scholar]
50. S. Wu, Y. Liu, Z. Zou and T. H. Weng, “S_I_LSTM: Stock price prediction based on multiple data sources and sentiment analysis,” Connection Science, vol. 34, no. 1, pp. 44–62, 2022. [Google Scholar]
51. J. V. Critien, A. Gatt and J. Ellul, “Bitcoin price change and trend prediction through twitter sentiment and data volume,” Financial Innovation, vol. 8, no. 1, pp. 1–20, 2022. [Google Scholar]
52. A. Al-Alyan and S. Al-Ahmadi, “Robust URL phishing detection based on deep learning,” KSII Transactions on Internet and Information Systems (TIIS), vol. 14, no. 7, pp. 2752–2768, 2020. [Google Scholar]
53. D. R. Cox, “The regression analysis of binary sequences,” Journal of the Royal Statistical Society: Series B (Methodological), vol. 20, no. 2, pp. 215–232, 1958. [Google Scholar]
54. I. Rish, “An empirical study of the Naive Bayes classifier,” in IJCAI 2001 Workshop on Empirical Methods in Artificial Intelligence, Seattle, Washington, USA, vol. 3, no. 22, pp. 41–46, 2001. [Google Scholar]
55. B. E. Boser, I. M. Guyon and V. N. Vapnik, “A training algorithm for optimal margin classifiers,” in Proc. of the Fifth Annual Workshop on Computational Learning Theory, New York, USA, pp. 144–152, 1992. [Google Scholar]
56. L. Breiman, “Random forests,” Machine learning, vol. 45, no. 1, pp. 5–32, 2001. [Google Scholar]
57. T. Chen and C. Guestrin, “Xgboost: A scalable tree boosting system,” in Proc. KDD, New York, USA, pp. 785–794, 2016. [Google Scholar]
58. G. Ke, Q. Meng, T. Finley, T. Wang, W. Chen et al., “Lightgbm: A highly efficient gradient boosting decision tree,” in Proc. NeurIPS, California, USA, vol. 30, 2017. [Google Scholar]
59. S. Visa, B. Ramsay, A. L. Ralescu and E. Van Der Knaap, “Confusion matrix-based feature selection,” MAICS, vol. 710, no. 1, pp. 120–127, 2011. [Google Scholar]
60. J. H. Han, I. S. Kim, C. H. Lee and Y. S. Moon, “Crack detection method for tunnel lining surfaces using ternary classifier,” KSII Transactions on Internet and Information Systems (TIIS), vol. 14, no. 9, pp. 3797–3822, 2020. [Google Scholar]
61. J. Huang and C. X. Ling, “Using AUC and accuracy in evaluating learning algorithms,” IEEE Transactions on Knowledge and Data Engineering, vol. 17, no. 3, pp. 299–310, 2005. [Google Scholar]
62. D. E. Diaconaşu, S. Mehdian and O. Stoica, “An analysis of investors’ behavior in Bitcoin market,” PLoS One, vol. 17, no. 3, pp. e0264522, 2022. [Google Scholar]
63. F. Valencia, A. Gómez-Espinosa and B. Valdés-Aguirre, “Price movement prediction of cryptocurrencies using sentiment analysis and machine learning,” Entropy, vol. 21, no. 6, pp. 17–29, 2019. [Google Scholar]
64. S. Priya, R. Sequeira, J. Chandra and S. K. Dandapat, “Where should one get news updates: Twitter or Reddit,” Online Social Networks and Media, vol. 9, pp. 17–29, 2019. [Google Scholar]
Cite This Article
 Copyright © 2023 The Author(s). Published by Tech Science Press.
This work is licensed under a Creative Commons Attribution 4.0 International License , which permits unrestricted use, distribution, and reproduction in any medium, provided the original work is properly cited.
 Downloads
 Citation Tools