
 Submit a Paper
 Propose a Special lssue
 Open Access
ARTICLE

Covid-19 Detection Using Deep Correlation-Grey Wolf Optimizer
1 Department of Computer Science and Engineering, Karpagam College of Engineering, Coimbatore, 641032, India
2 Department of Computer Engineering, Lebanese French University, Erbil, 44001, Iraq
3 Department of Computer Science, College of Computers and Information Technology, Taif University, P. O. Box 11099, Taif, 21944, Saudi Arabia
4 Department of Information Technology, College of Computer and Information Technology, Taif University, PO Box 11099, Taif, 21994, Saudi Arabia
5 Department of Mathematics, Faculty of Science, Mansoura University, Mansoura, 35516, Egypt
6 Department of Computational Mathematics, Science, and Engineering (CMSE), Michigan State University, East Lansing, 48824, MI, USA
* Corresponding Author: Mohamed Abouhawwash. Email:
Computer Systems Science and Engineering 2023, 46(3), 2933-2945. https://doi.org/10.32604/csse.2023.034288
Received 13 July 2022; Accepted 28 December 2022; Issue published 03 April 2023
A correction of this article was approved in:
Correction: Covid-19 Detection Using Deep Correlation-Grey Wolf Optimizer
Read correction
 View Full Text
 Download PDF
Abstract
The immediate and quick spread of the coronavirus has become a life-threatening disease around the globe. The widespread illness has dramatically changed almost all sectors, moving from offline to online, resulting in a new normal lifestyle for people. The impact of coronavirus is tremendous in the healthcare sector, which has experienced a decline in the first quarter of 2020. This pandemic has created an urge to use computer-aided diagnosis techniques for classifying the Covid-19 dataset to reduce the burden of clinical results. The current situation motivated me to choose correlation-based development called correlation-based grey wolf optimizer to perform accurate classification. A proposed multistage model helps to identify Covid from Computed Tomography (CT) scan image. The first process uses a convolutional neural network (CNN) for extracting the feature from the CT scans. The Pearson coefficient filter method is applied to remove redundant and irrelevant features. Finally, the Grey wolf optimizer is used to choose optimal features. Experimental analysis proves that this determines the optimal characteristics to detect the deadly disease. The proposed model’s accuracy is 14% higher than the krill herd and bacterial foraging optimization for severe accurate respiratory syndrome image (SARS-CoV-2 CT) dataset. The COVID CT image dataset is 22% higher than the existing krill herd and bacterial foraging optimization techniques. The proposed techniques help to increase the classification accuracy of the algorithm in most cases, which marks the stability of the stated result. Comparative analysis reveals that the proposed classification technique to predict COVID-19 with maximum accuracy of 98% outperforms other competitive approaches.Keywords
The Corona Virus (COVID-19) outbreak in China on Dec 2019 [1,2] has affected millions of individuals, with a 2% fatality rate. The World Health Organization (WHO) declared COVID-19 a global emergency in the early 2020s. A Computed Tomography (CT) scan is used to predict the deadly disease. Since the clinicians exposed to Covid patients were also infected, there existed a shortage of clinicians and radiologists [1]. Covid symptoms are recorded from time to time in Electronic Health Records (EHRs). Data stored in an EHR can be used to extract functional patterns from it that can assist physicians in detecting disease [2]. Clinical decision-making systems help physicians in disease detection using bio-inspired algorithms and machine-learning techniques. The distribution of data and the quality of the data serve as the main determinants of prediction accuracy [3–5].
Machine learning models suffer from overfitting if the number of features becomes similar or higher than the number of observations. Feature extraction and feature selection extract and choose the appropriate concepts for building the model [6]. Dimensionality reduction, a crucial step in lowering the model’s complexity and overfitting, makes use of both feature extraction and selection. Feature extraction builds valuable information from raw data by combining, reformatting, and transforming primary features to obtain a new data set that machine learning models can use. The main work of feature selection is to prevent redundancy and avoid irrelevant features [7]. The most salient features selected by feature selection techniques focus on the learning algorithm used for analysis or prediction.
This work attempts to develop a classifier that effectively classifies Covid infected and non-Covid patients using CT scans. Initially, to mine the features, CNN is used. The contribution of this research is as follows,
• Since the feature vector dimension is high, a multistage filter method is used for feature selection from a high-dimensional feature set.
• The first step is to find the features’ correlation and select the components with less correlation.
• The Second step uses the same statistical measure to identify the correlation between two features and their class. This removes the irrelevant features that are bound to the feature set. These two steps help remove the irrelevant parts and feature redundancy from the feature vector.
• A Feature subset obtained from this stage is applied to the Grey Wolf Optimizer to choose optimal features. The SVM classifier develops an efficient classification model with the selected optimal features to classify positive and negative samples.
This paper is presented as follows: A detailed review of the survey paper is described in Section 2. Section 3 details the background and the motivation of the proposed work. The proposed multi-stage feature selection method is presented in Section 4. Section 5 discusses the results and experimental outcome. Section 6 discusses the conclusion section with future research directions.
Support Vector Machines are widely used to classify more diseases in the medical field. Murugesan et al. [8] employed a super learner to detect the disease. A wrapper approach was developed using the cat optimization algorithm (CSO), bacterial foraging (BFO), and krill herd (KH) optimization. Features selected from CSO, KH, and BFO are stored in separate databases, and three backpropagation techniques are used in neural networks with an efficient conjugate gradient algorithm.
Sun et al. [9] discuss the feature selection model with Adaptive Deep learning techniques for classifying COVID-19 chest CT scans. The deep learning-based forest is used to classify images in the database. Deep forest introduces a trained model to decrease the feature redundancy here. The feature selected from the proposed model organizes the COVID-19 database. Experimental evaluation shows that the proposed AFS-DF performance is higher than existing techniques.
Mostert et al. [10] introduced baseline metrics to improve the fitness for selecting the feature. The measures of baseline fitness index (BFI) compare various algorithms on selection performance in the defined datasets. The classifier’s version changes the performance measurement of feature selection based on baseline metrics, which include all features. A final result shows feature selection performance on various real-world datasets.
Kononenko [11] analyzes eleven bias measures for quality estimating among attributes. It presents an asymmetric version of minimum description length (MDL) and relief. The symmetrical measure of uncertainty using bias is the same as relief and MDL. Calculating inter-correlation among features helps measure the required characters for predicting the ability between the details.
Liu et al. [12] implement the levy flight (LVF) algorithm to handle domains with high noise. The approximate level of noise is called a priority. The subset is generated randomly using LVF called S in the feature space of the subset at execution time. The S consists of fewer features than the current subset. The inconsistency is decreased for further description and comparison with the best subsets value. At last, the most excellent subset is replaced for S. Matching groups are described with an overall inconsistency rate.
In [13], González et al. discuss an evolutionary technique called multi-objective selection based on wrapper technology. The overfitting problem is eliminated, the set is evaluated using classification, and the training set is optimized using data validation. Final features are ranked based on the spearman Correlation Coefficient. The result evaluation shows ranked features are stable. Song et al. [14] proposed an embedded selection strategy for features with a medical dataset for diabetes prediction using the present kidney disease. This research proved Gradient Boosting is stable compared to the existing algorithm. It lacks clarity on generalization capability on feature selection.
Pre-diagnostic clinical datasets are used for infected person records with severe and death cases. KC et al., [15] predict COVID-19 severity based on the risk factors analyzed. Research shows the top factor is age significance, and age is highly affected. Zhang et al., [16] used a supervised technique for COVID-19 prediction and investigated outbreaks. This paper uses a WHO Dataset with 300 Covid patients [17], and the covid-19 mortality rate is predicted using machine learning algorithms such as SVM, KNN, LASSO, and RF. Maghdid et al. [18,19] implemented a deep transfer learning algorithm to detect Covid from CT scans. DL performance is evaluated, and the resultant response is swift and effective.
Leema et al. [20] proposed a backpropagation-based neural network for fixing appropriate parameters. Here 12 propagation algorithms are used. The resulting experiment uses datasets of Hepatitis, PID, and WBC from the UCI repository. Zhang et al. [21] discussed a new selection technique with a dataset. S-SVM is proposed to identify relevant feature terms, and it works based on metrics of F-measure. Tashi et al. [22] proposed a new binary-based MOGWO with a sigmoid transfer function. It is also called BMOGW-S to optimize approximate feature selection. In the UCI repository, fifteen datasets are evaluated for the experiment, and performance is assessed for classification with the selected feature subset.
The drastic spread of coronaviruses is considered the most disruptive disaster of the current century. The rapid virus spread in early 2020 infected many clinicians and radiologists, leading to a shortage of doctors to treat the disease. This prompted many researchers to develop computer-aided models to predict the disease at an early stage. CT scan images have an essential role to play.
Datasets generated during the present technological era with high information are collected using millions of IoT sensors. This leads to a standard high dimensionality with hundreds of thousands of attributes. Clinical datasets often suffer from high dimensionality. Machine learning excels at analyzing data with more attributes, but developing efficient models with more dimensions becomes challenging. As the dimensionality increases in the feature with configurations, the experimental design decreases exponentially. No learning strategy is better in every circumstance, according to several researchers, and different learning algorithms frequently yield identical outcomes [23]. The discovering tasks have patterns that can be made simpler and time-consuming by extracting and selecting redundant and irrelevant features to the training process. Feature selection has the potential of automation and is highly computational. The model developed with the chosen features improves predictive accuracy and reduces execution time.
4 Proposed Multistage Feature Selection Algorithm
The impact of the spread of the deadly coronavirus has welcomed a new standard environment. This pandemic has become worse due to the shortage of clinicians and equipment. A step has been taken to develop a classifier to predict the devastating disease. Making a classification model is significantly complicated by the clinical datasets’ inclusion of pointless and redundant variables. Feature selection is considered a challenging redundancy removal and irrelevant object elimination model. The relevant feature selection helps to increase the learning accuracy and minimize the computation time of the proposed method. A Dataset of SARS CoV-2 CT and COVID CT from the Kaggle platform are evaluated to study the effectiveness of the multistage selection method. SARS CoV-2 CT and COVID CT datasets are referred to in [24,25], respectively. SARS-CoV-2 has a total of 2482 CT chests, out of which 1253 are chest images patients’ of Covid infected patients and the rest are non-infected patients’ chest images. The dataset of COVID-CT consists of 812 images of CT scans, out of which 349 are Covid-infected patients’ CT images, and 463 are studied non-Covid patient images. Sample CT images from the above datasets are stated in Figs. 1 and 2 respectively.
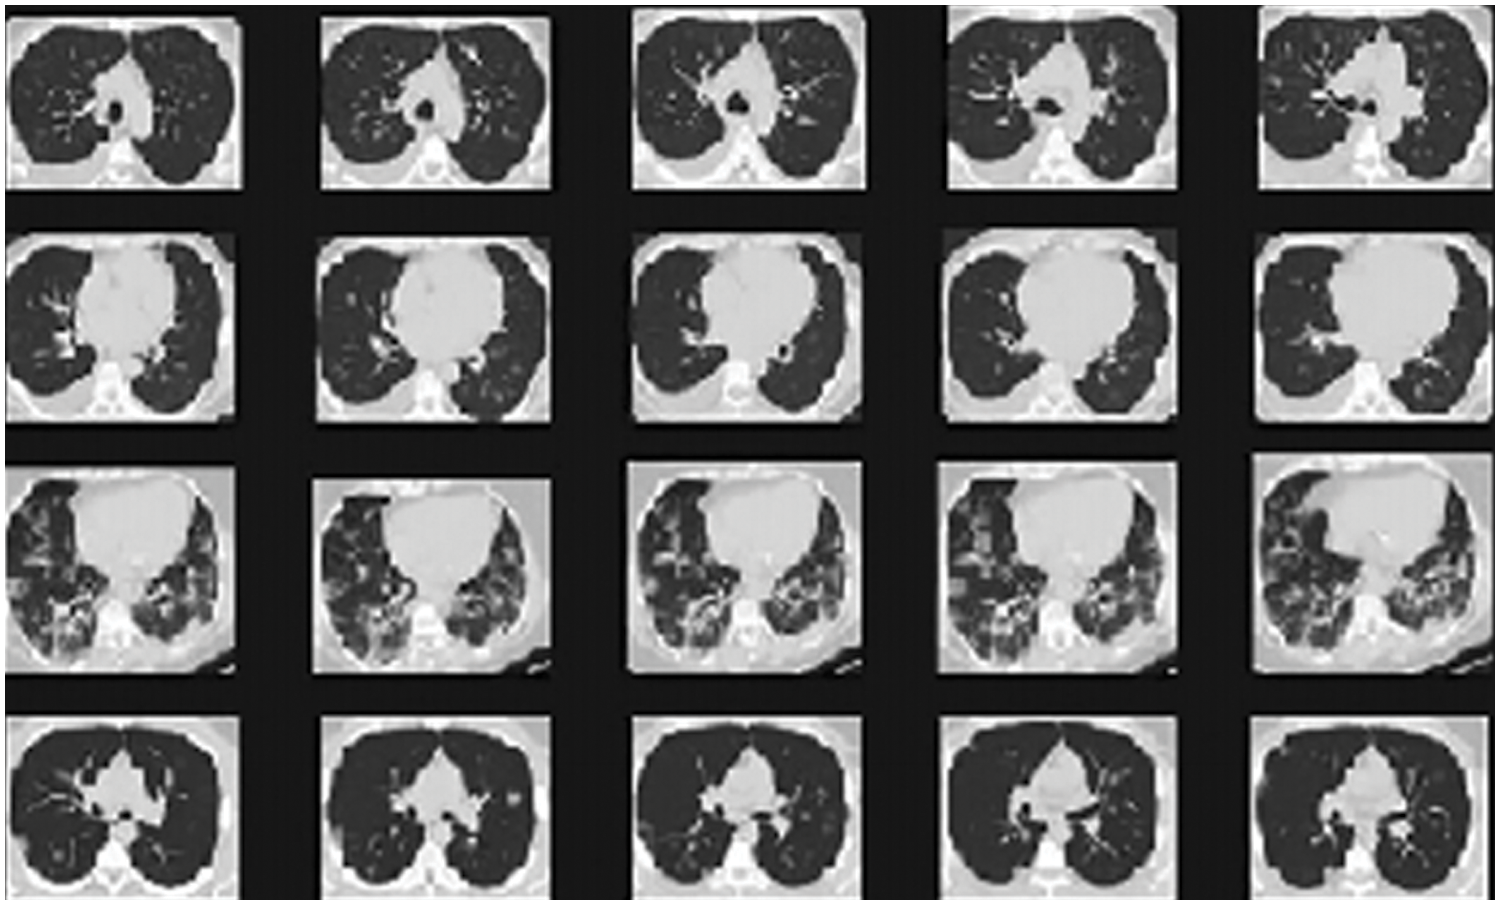
Figure 1: Sample image from dataset SARS-CoV-2
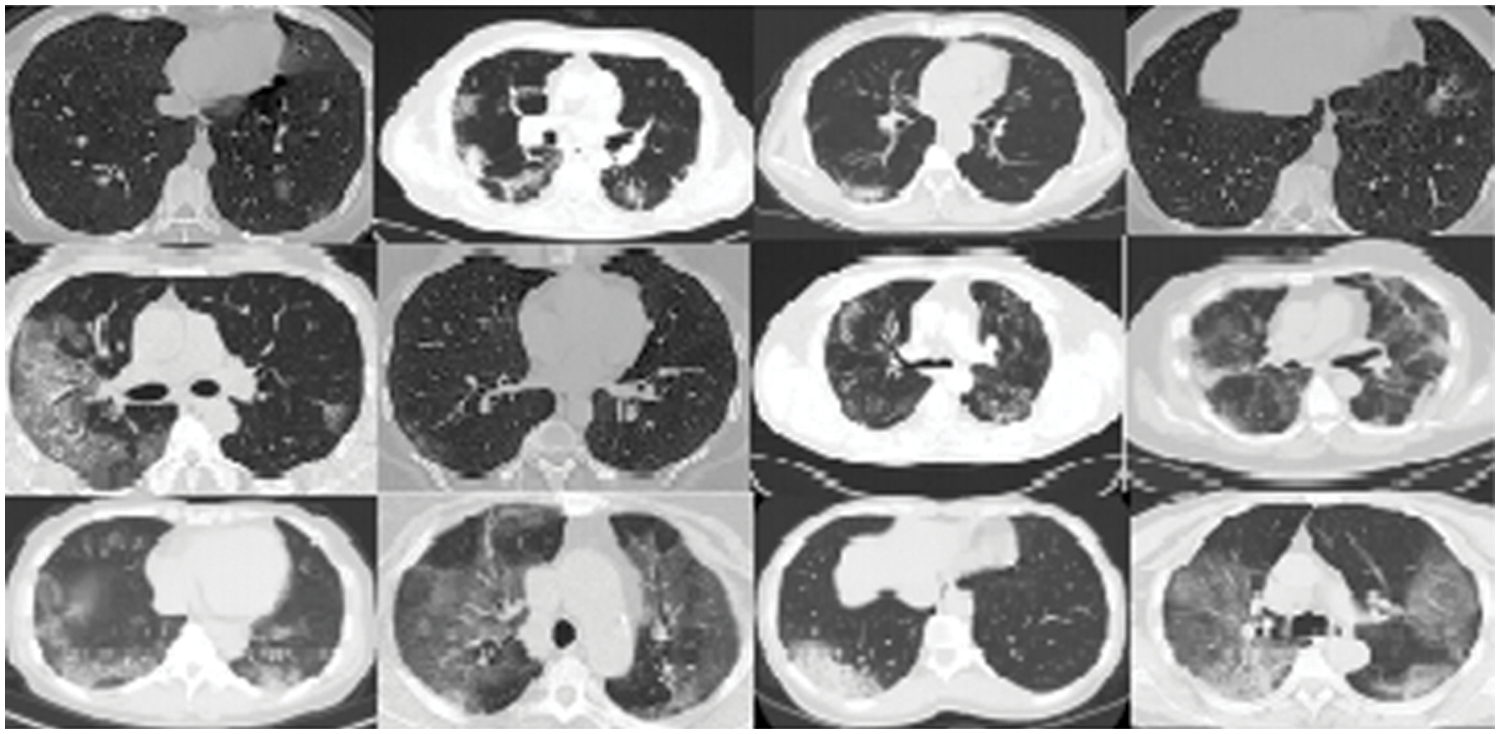
Figure 2: Sample COVID-CT image dataset
A multistage feature extraction and selection technique is proposed to choose optimal features to enhance classification accuracy. A Convolutional neural network (CNN) is computed on the dataset for extracting related features in the first step. CNN produces 769 features from the CT images. Since it is of high dimension, the proposed method’s second stage involves two steps: statistical correlation measures to find the feature-to-feature correlations and feature-to-class correlation to take away redundant and irrelevant features. The proposed flow diagram is stated in Fig. 3. This optimized subset of features is used to predict the positive and negative samples using the SVM model. The third stage uses the Grey wolf optimizer to choose the optimal features.
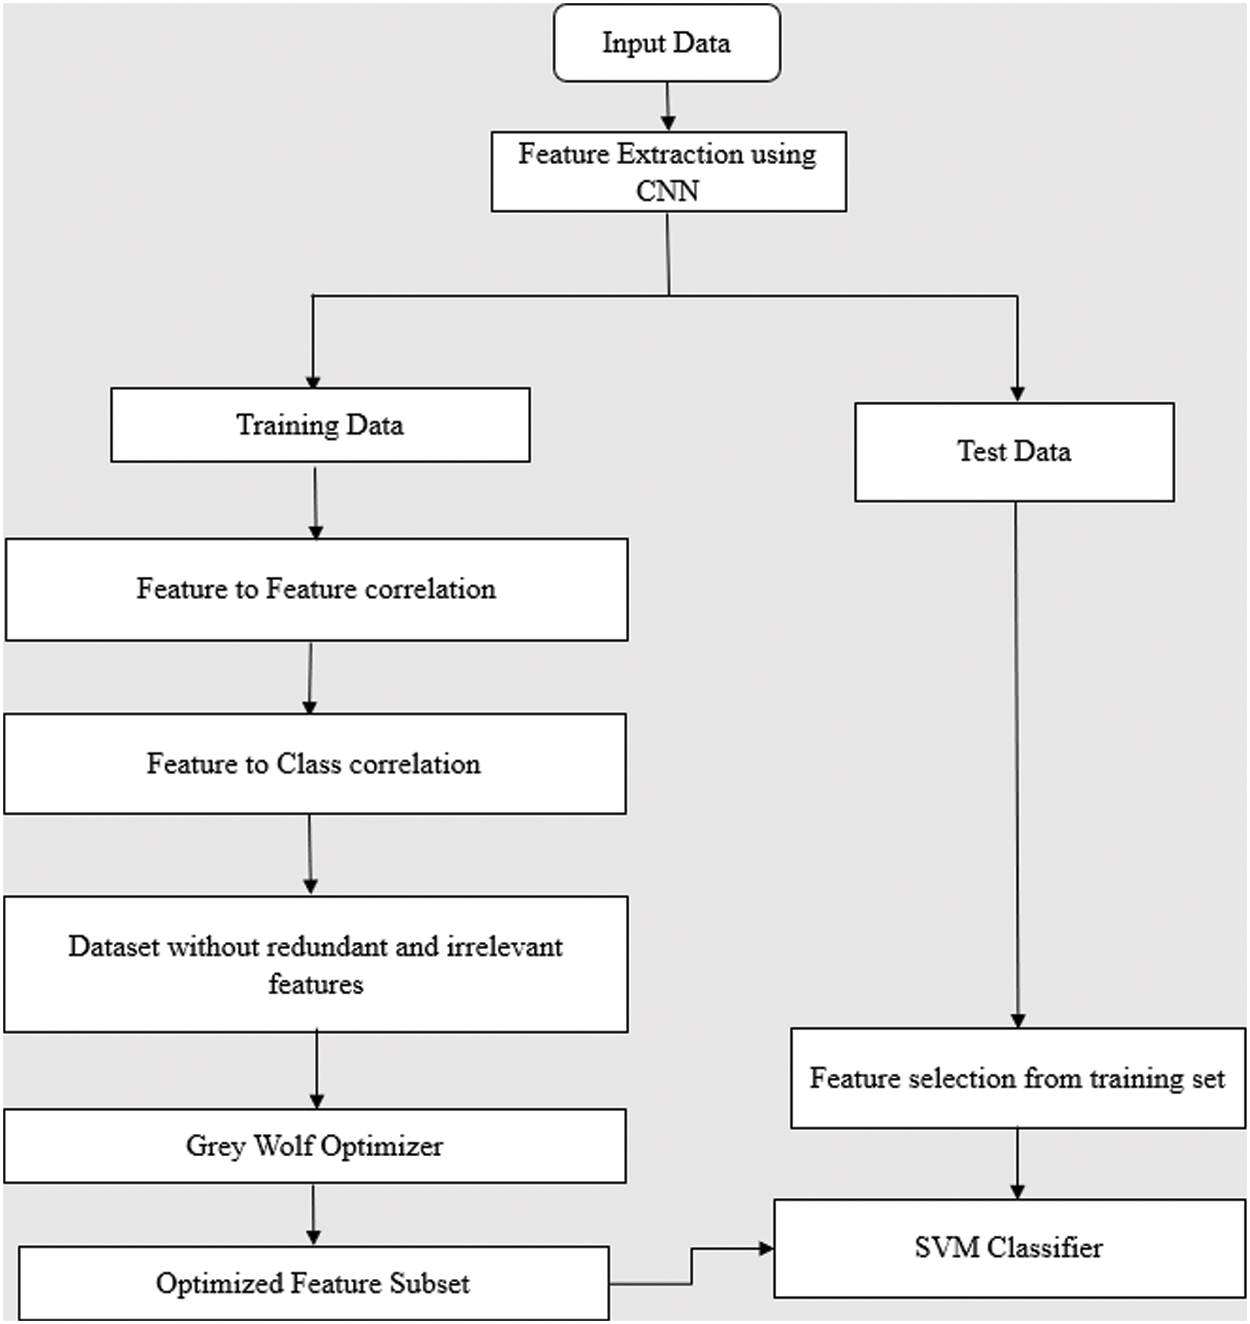
Figure 3: Flowchart of the proposed
4.1 Feature Extraction Using CNN
CNN is used in extracting features from the Image. With an extensive training dataset, the CNN model can reasonably predict the disease. Since we have a limited Covid dataset for feature extraction using CNN, accuracy is achieved. The Image is sent to the input section propagated in the hidden layer, and finally, the output section produces a probability prediction. The CNN models are very successful in various applications because of convolution and pooling layers in the hidden layer. The CNN model in the proposed method takes an image size of 218 × 218 in the input. The Convolution layer, batch normalization, and pooling layer follow the input layer. The Activation function used on CNN is a hyperbolic Tangent Activation function (tanh). This function uses absolute values at the input and output with the range of −1 to 1. CNN generates 769 features from each Image, which are then fed to the next stage for feature selection. An overview of the CNN proposed architecture is depicted in Fig. 4.
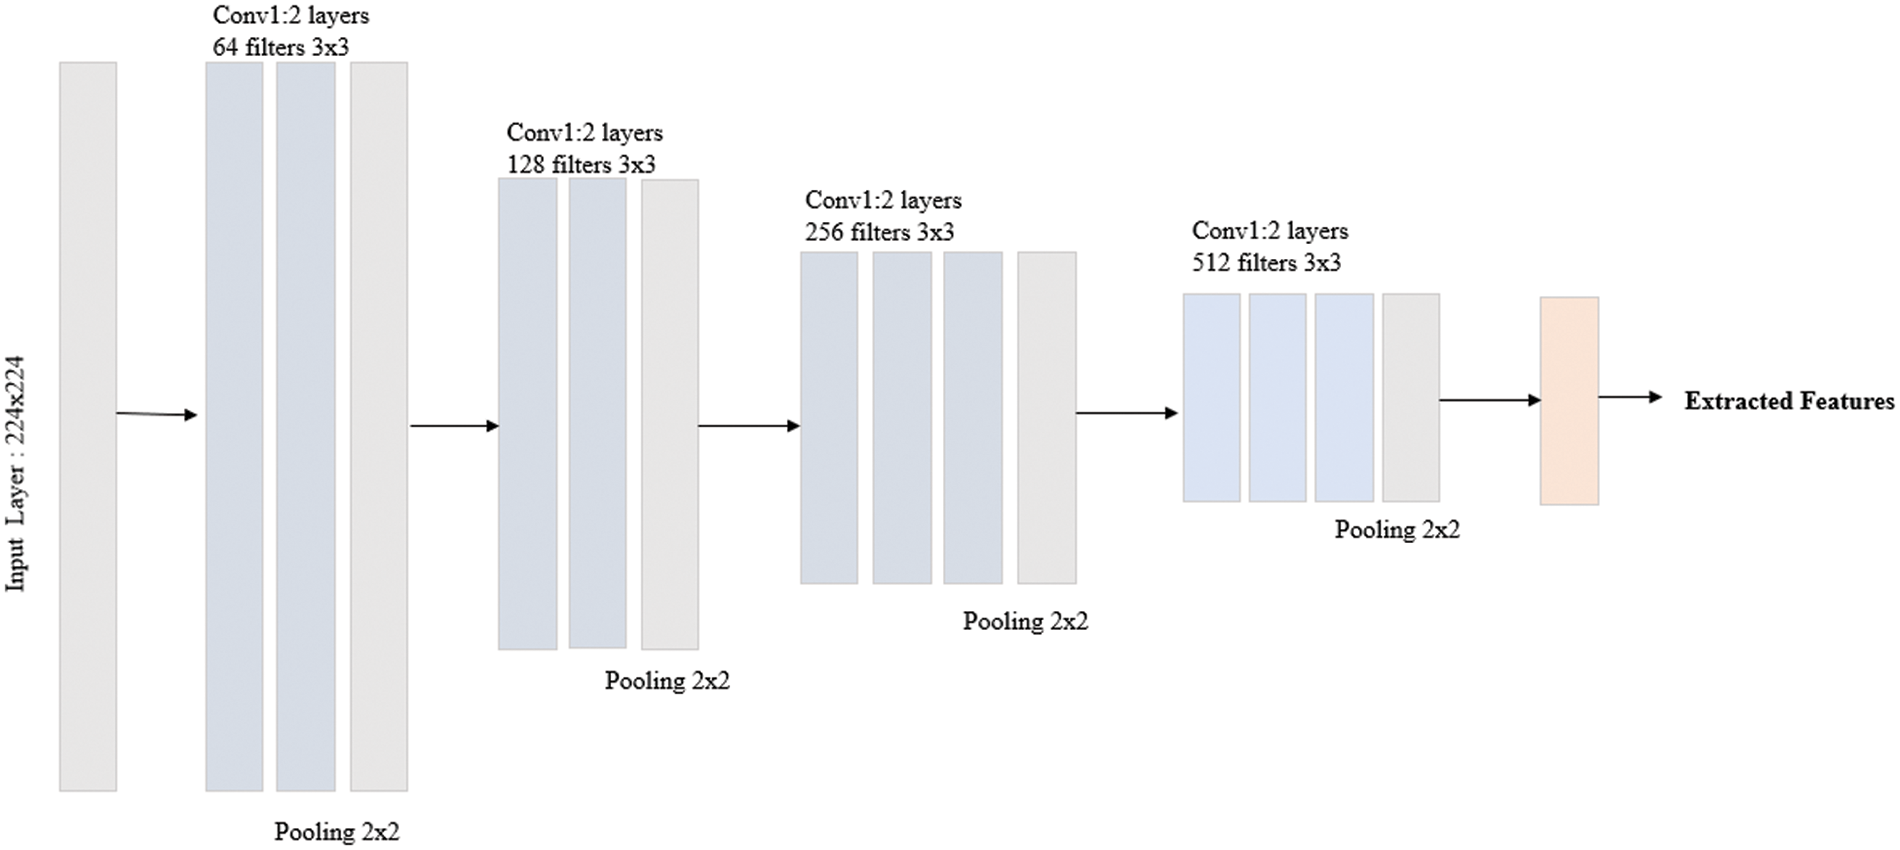
Figure 4: CNN architecture for the proposed
The first step in stage 2 removes the redundant features by implementing a personal correlation between the components. The correlation coefficient ranges between −1 to +1. Two elements are strongly correlated when the value of the correlation coefficient is 1. The parts are weakly correlated and have a stronger negative correlation when the correlation coefficient values are 0 and −1, respectively. The correlation coefficient of all the features is calculated, and most correlated features are removed. Feature-to-feature correlation is found using the most standard statistical measure, Pearson correlation. Features are sorted based on the correlation value, and the elements with the highest values are removed, considering they are redundant features. This step helps to remove the redundant features by finding the parts with strong correlations. The following formula is used to calculate the value of the Pearson correlation coefficient
4.3 Irrelevant Feature Removal
Despite removing the redundant features in the previous step, classification accuracy is not up to the mark. So, an attempt is made in step 2 of stage 2 to identify the irrelevant features and remove them. For the features obtained in step 1, a Pearson correlation factor is determined between the parts and the class. This step finds the correlation between the elements and the class. This correlation value identifies the features that have weak correlations within the class. Thus, the two steps in stage 2 remove the redundant and irrelevant features from the whole feature set.
4.4 Optimal Feature Selection Using Grey Wolf Optimizer
Grey wolf optimizer (GWO) is a technique in the family of swarm intelligence. Grey wolf packs’ guidance and hunting behavior contribute to the development of GWO. Alpha, beta, omega, and delta wolves have their responsibilities. Demonstrating a subset of the solution is the primary step in GWO’s application of feature selection. The alpha, beta and delta are fittest solution respectively. The delta and beta are used as the second and third-best outcomes. Omega is another option. Encircling behavior is represented in Eqs. (2) and (3).
where ‘t’ represents present iteration, C and A are considered a coefficient vector, w is total number of wolves, Xp is preys position. During optimization alpha, beta and delta are the w wolves update their positions. Therefore, w wolves are repositioned based on alpha, beta, and delta values. The mathematical model of omega wolf’s positions being readjusted is given in Eq. (4). Final position will be within the circle of alpha, beta and delta.
In the proposed method, GWO selects the optimal features that result in maximising accuracy. The fitness function is calculated using Eq. (4).
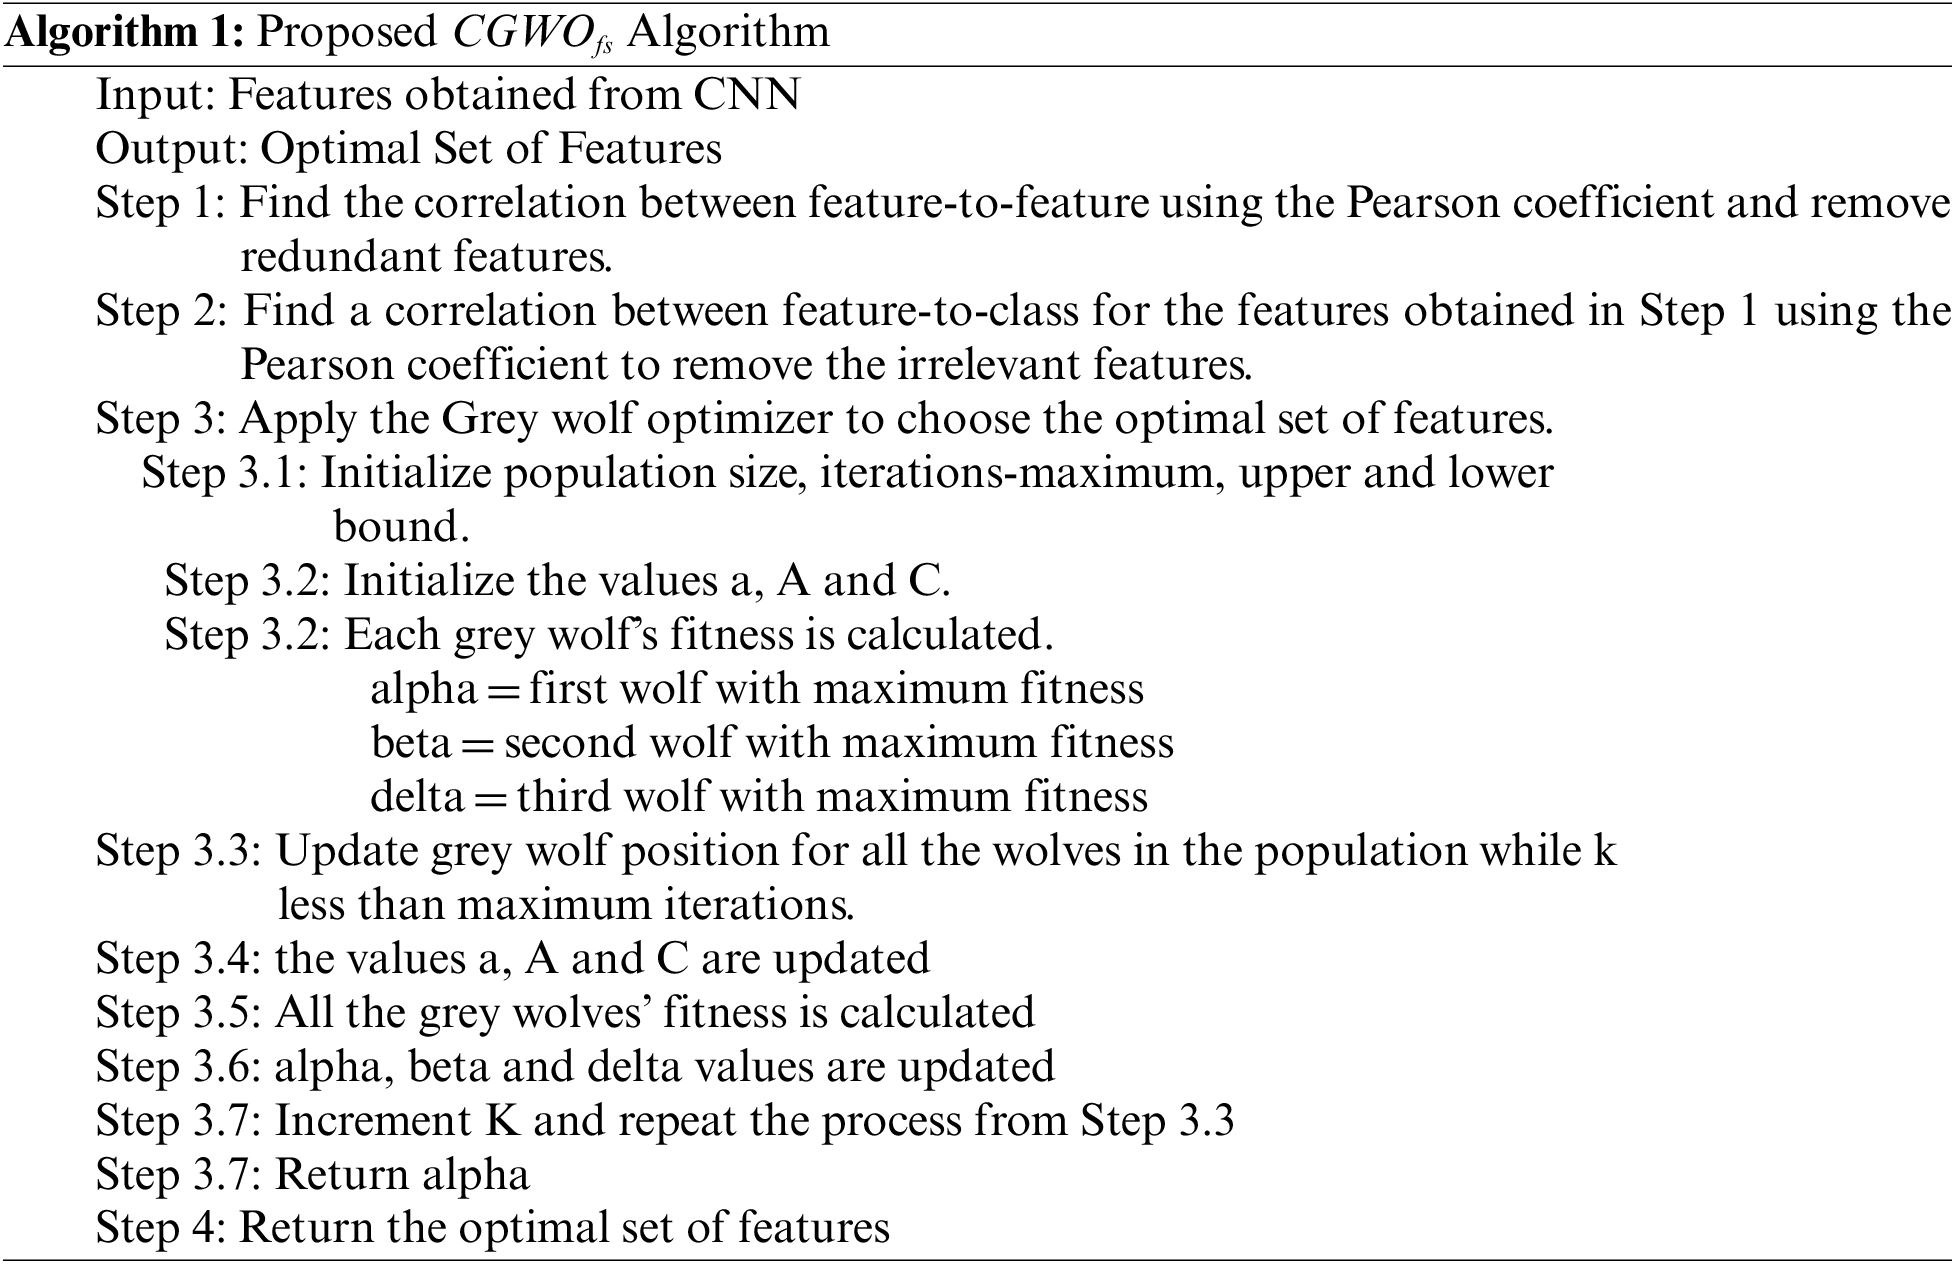
where N is considered as total number of feature present in dataset, L is selected a number of features, p represents accuracy, μ is the weight of classification accuracy, (1 − μ) is the quality weight of feature selection. Algorithm 1 presented below shows the steps covered in the proposed
5 Experimental Results and Analysis
Fig. 5 depicts a comparison of the recall, accuracy, precision, and AUC values for the selected features using existing cat swarm optimization (CSO), bacterial foraging optimization (BFO) and krill herd (KH) methods for the SARS-CoV-2 CT scan dataset.
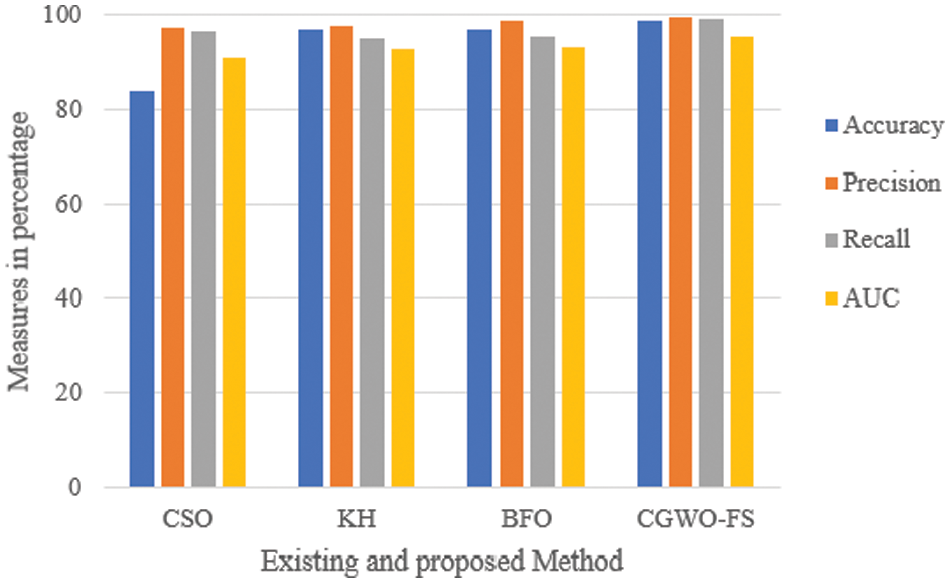
Figure 5: Comparison of evaluation metrics for existing CSO, KH, BFO and
It is observed from the results that the accuracy obtained is 14% higher than the accuracy in CSO and approximately 2% higher than KH and BFO. Similarly, precision and recall seem higher in the proposed than in existing CSO, KH, and BFO algorithms. The recall for KH and BFO is the same, which is 4% less than before. Fig. 6 compares the accuracy, recall, precision and AUC values for the selected features for the COVID-CT dataset using existing cat swarm optimization (CSO), bacterial foraging optimization (BFO) and krill herd (KH) optimization.
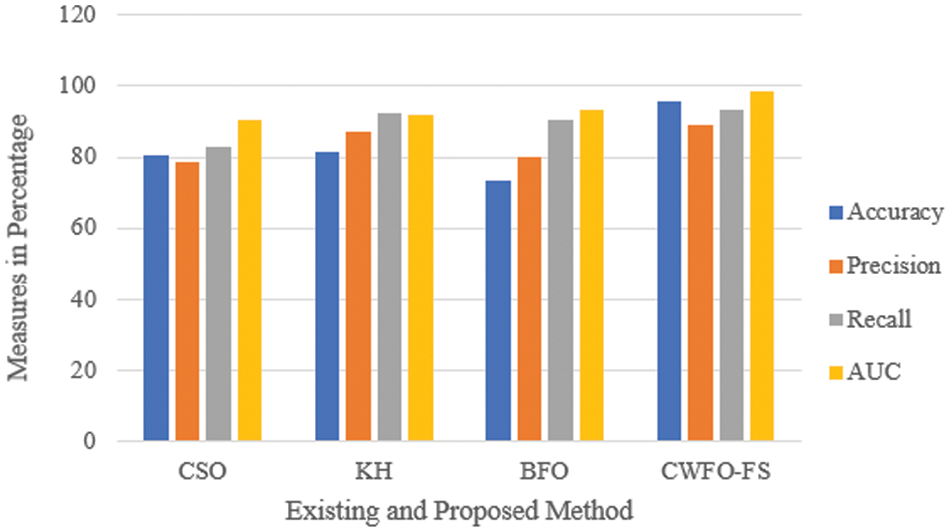
Figure 6: Comparison of evaluation metrics for existing CSO, KH, BFO and
The accuracy of proposed
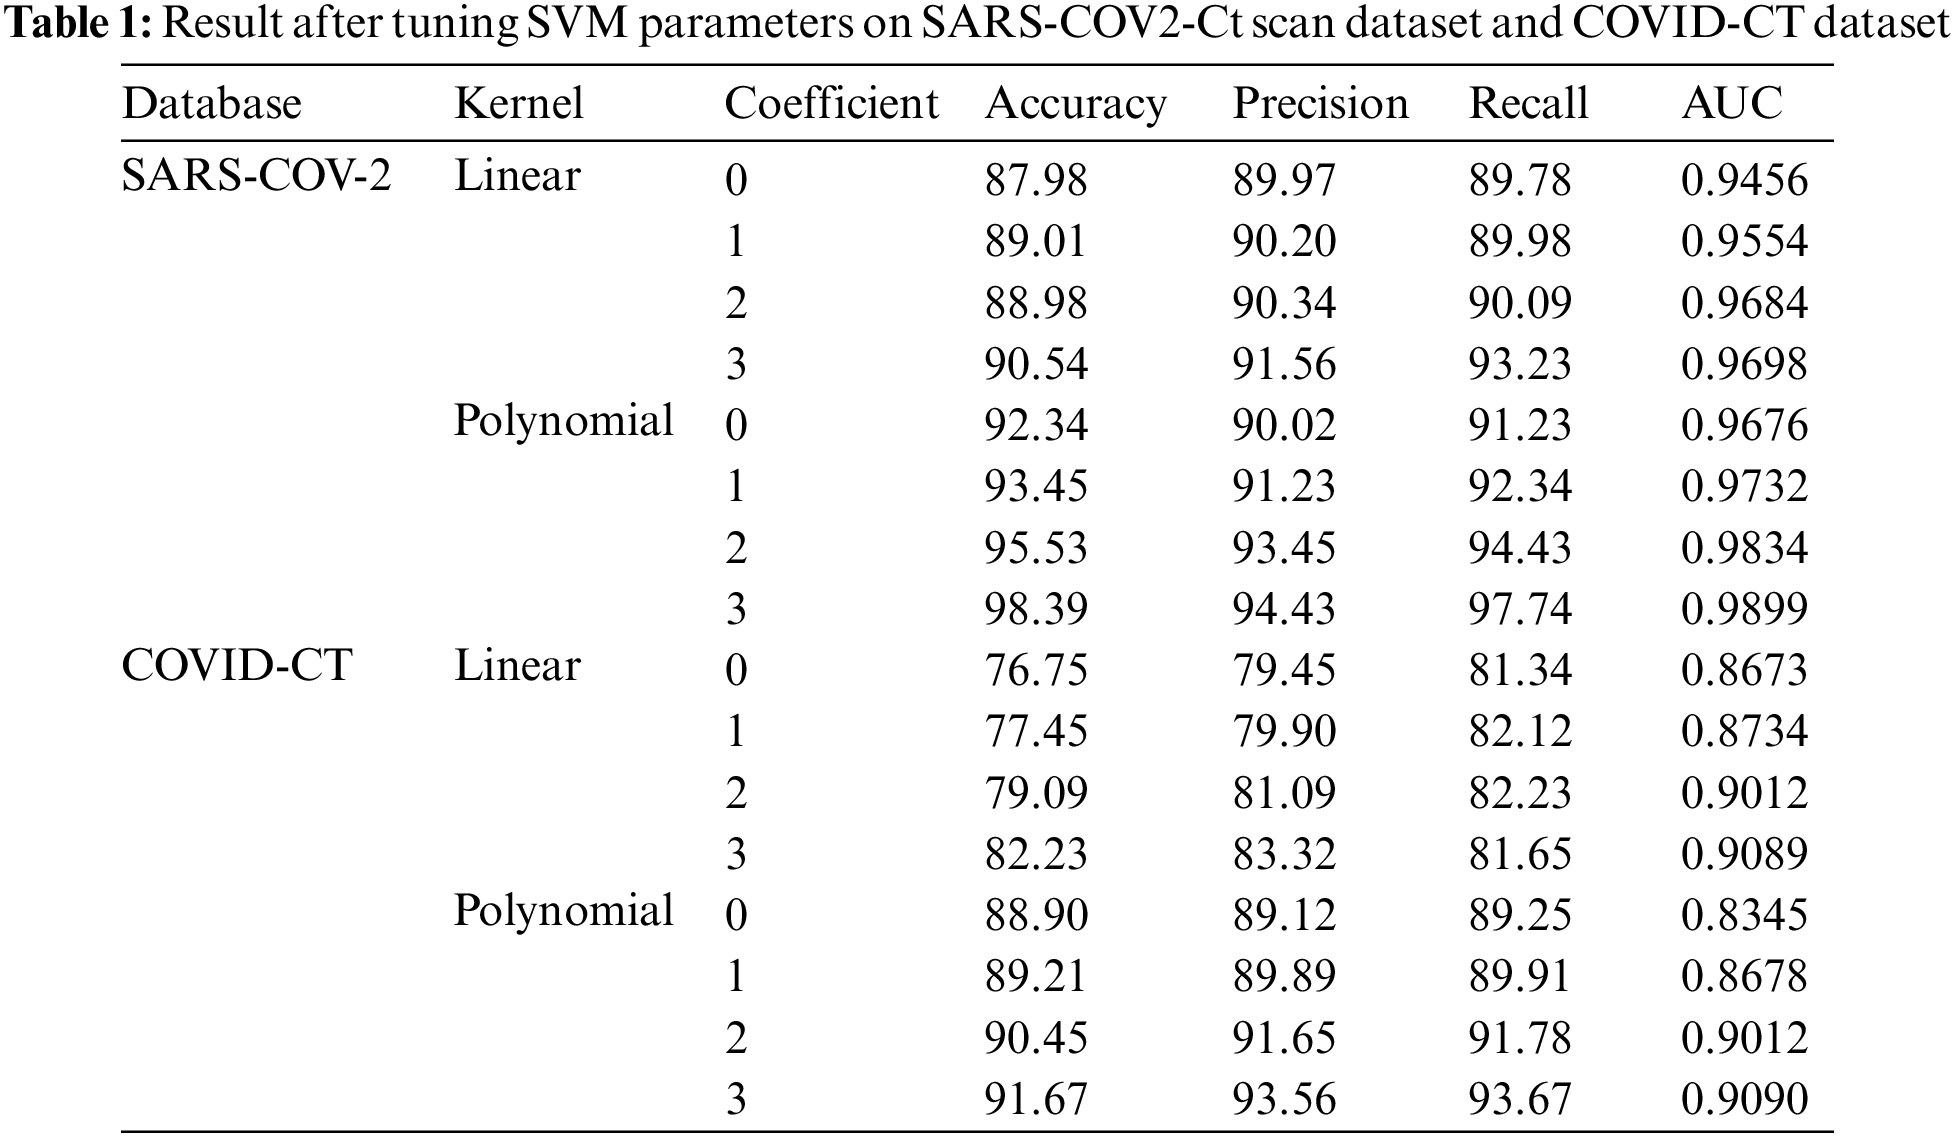
SVM classifier has a polynomial kernel with the value of the parameter coefficient set as three, which is used for prediction. To justify choosing the value of coefficient 3, an exhaustive analysis of SVM with a linear kernel with parameter coefficient 0 to 3 is also tested, for which the results are shown in Table 1. It is observed from Table 1. The polynomial kernel used to identify best outcome when the value of the coefficient is 3.
The primary significance and advantage of the proposed techniques are it improves the efficacy of the feature extraction process. Covid-19 is a dangerous disease that intelligent techniques are required to predict in the early stage. These computer-aided deep learning techniques, like CNN and GWO, help accurately predict features. The learning capacity of CNN is fast due to multiple pooling layers and activation functions. When learning is perfect, then prediction rate will be improved. Finally, the correlation filter obtains perfect feature subsets for the optimization process. Grey wolf optimizer optimizes the feature based on its attacking strategy. This selected feature is classified using the SVM tuning parameter to evaluate the feature selection accuracy.
The current pandemic draws researchers’ attention to developing a classifier to detect positive and negative Covid cases. Medical datasets often have a property of high dimensionality. Relevant features in the feature vector are very few compared to available features. The proposed feature selection method develops an effective classification model to classify the disease. The multi-stage feature selection method uses CNN to extract the features from CT scan images.
Further feature-to-feature correlation is identified using a statistical metric, the Pearson coefficient, using which the highly correlated features are removed to avoid redundancy. The same statistical measure is used to find the feature’s and class’s correlation. Elements with a high correlation with the class are selected. This helps to remove irrelevant features. These two steps choose the highly relevant features applied to Grey Wolf Optimizer to select optimal features. SVM classifier is used to build a classifier with the optimal selected features to detect the positive and negative Covid cases.
The proposed method effectiveness is evaluated using two Covid datasets from the Kaggle portal. Accuracy shows a significant improvement in both datasets. The major advantage of this research is that multiple feature analyses are performed before the selection process. Accuracy is 14% higher than CSO and approximately 2% higher than KH and BFO for the SARS-CoV-2 scan dataset. Precision and Recall are more elevated than existing CSO, KH, and BFO algorithms. The COVID-CT dataset’s accuracy is 22% higher than the existing BFO. The experimental analysis shows that the proposed method effectively develops a prediction model. This work can be extended by creating a fuzzy-based classification model to enhance the prediction process. Further, to assess the severity of the patient to reduce the mortality rate.
Acknowledgement: The authors would like to thank you for the support of the Taif University Researchers Supporting Project Number (TURSP-2020/10), Taif University, Taif, Saudi Arabia.
Funding Statement: Taif University Researchers are supporting project Number (TURSP-2020/10), Taif University, Taif, Saudi Arabia.
Conflicts of Interest: The authors declare that they have no conflicts of interest to report regarding the present study.
References
1. Z. Y. Zu, M. D. Jiang, P. P. Xu, W. Chen, Q. Q. Ni et al., “Coronavirus disease 2019 (COVID-19A perspective from China,” Radiology, vol. 296, no. 2, pp. 15–25, 2020. [Google Scholar]
2. E. K. Jeong, O. Park, Y. J. Park, S. Y. Park, Y. M. Kim et al., “Coronavirus disease-19: The first 7,755 cases in the Republic of Korea,” Korea, vol. 10, pp. 85–90, 2020. [Google Scholar]
3. A. S. Albahri, R. A. Hamid, J. K. Alwan, Z. A. Qays, A. Zaidan et al., “Role of biological data mining and machine learning techniques in detecting and diagnosing the novel coronavirus (COVID-19A systematic review,” Journal of Medical Systems, vol. 44, no. 2, pp. 1–11, 2020. [Google Scholar]
4. R. Zagrouba, M. A. Khan, R. Atta, S. Muhammad Aamer, M. Muhammad Faheem et al., “Modelling and simulation of COVID-19 outbreak prediction using supervised machine learning,” Computers, Materials & Continua, vol. 13, no. 2, pp. 2397–2407, 2021. [Google Scholar]
5. A. Kumar, A. Sharma and A. Arora, “Anxious depression prediction in real-time social data,” in Proc. Int. Conf. on Advances in Engineering, Science and Management (ICAESM), Dehradun, India, pp. 16–28, 2019. [Google Scholar]
6. M. E. Chowdhury, T. Rahman, A. Khandakar, S. Al-Madeed, S. M. Zughaier et al., “An early warning tool for predicting mortality risk of COVID-19 patients using machine learning,” Cognitive Computation, vol. 5, no. 4, pp. 1–16, 2021. [Google Scholar]
7. M. Nemati, J. Ansary and N. Nemati, “Machine-learning approaches in COVID-19 survival analyze and discharge-time likelihood prediction using clinical data,” Patterns, vol. 1, no. 5, pp. 100074, 2020. [Google Scholar] [PubMed]
8. S. Murugesan, R. Bhuvaneswaran, H. K. Nehemiah, S. K. Sankari and Y. N. Jane, “Feature selection and classification of clinical datasets using bioinspired algorithms and super learner,” Computational and Mathematical Methods in Medicine, vol. 2021, no. 4, pp. 5–25, 2021. [Google Scholar]
9. L. Sun, Z. Mo, F. Yan, L. Xia, F. Shan et al., “Adaptive feature selection guided deep forest for covid-19 classification with chest ct,” IEEE Journal of Biomedical and Health Informatics, vol. 24, no. 10, pp. 2798–2805, 2020. [Google Scholar] [PubMed]
10. W. Mostert, K. M. Malan and A. P. Engelbrecht, “A feature selection algorithm performance metric for comparative analyzes,” Algorithms, vol. 14, no. 3, pp. 100, 2021. [Google Scholar]
11. I. Kononenko, “On biases in estimating multi-valued attributes,” in Proc. Int. Joint Conf. on Artificial Intelligence (IJCAI), Stockholm, Sweden, vol. 95, no. 3, pp. 1034–1040, 1995. [Google Scholar]
12. H. Liu and R. Setiono, “A probabilistic approach to feature selection-a filter solution," in Proc. Int. Conf. on Machine Learning (ICML), San Francisco, United States, vol. 96, no. 3, pp. 319–327, 1996. [Google Scholar]
13. J. González, J. Ortega, M. Damas, P. M. Smith and J. Q. Gan, “A new multi-objective wrapper method for feature selection–Accuracy and stability analyzes for BCI,” Neurocomputing, vol. 333, no. 5, pp. 407–418, 2019. [Google Scholar]
14. X. Song, L. R. Waitman, Y. Hu, A. S. Yu, D. Robins et al., “Robust clinical marker identification for diabetic kidney disease with ensemble feature selection,” Journal of the American Medical Informatics Association, vol. 26, no. 3, pp. 242–253, 2019. [Google Scholar] [PubMed]
15. W. KC and H. So, “Uncovering clinical risk factors and prediction of severe COVID-19: A machine learning approach based on UK biobank data,” MedRxiv, vol. 4, no. 4, pp. 2020–2029, 2021. [Google Scholar]
16. J. Zhang, Y. Xie, Y. Li, C. Shen and Y. Xia, “Covid-19 screening on chest x-ray images using deep learning based anomaly detection,” Arxiv Preprint Arxiv:2003.12338, vol. 27, 2020. [Google Scholar]
17. A. M. Anter and M. Ali, “Feature selection strategy based on hybrid crow search optimization algorithm integrated with chaos theory and fuzzy c-means algorithm for medical diagnosis problems,” Soft Computing, vol. 24, no. 3, pp. 1565–1584, 2020. [Google Scholar]
18. H. S. Maghdid, A. T. Asaad, K. Z. Ghafoor, A. S. Sadiq, S. Mirjalili et al., “Diagnosing COVID-19 pneumonia from X-ray and CT images using deep learning and transfer learning algorithms,” Multimodal Image Exploitation and Learning, vol. 11734, no. 4, pp. 117340, 2021. [Google Scholar]
19. A. Rehman, S. Naz, A. Khan, A. Zaib and I. Razzak, “Improving coronavirus (COVID-19) diagnosis using deep transfer learning,” MedRxiv, vol. 4, no. 3, pp. 23–27, 2020. [Google Scholar]
20. N. Leema, K. H. Nehemiah, E. C. VR and A. Kannan, “Evaluation of parameter settings for training neural networks using backpropagation algorithms: A study with clinical datasets,” International Journal of Operations Research and Information Systems (IJORIS), vol. 11, no. 4, pp. 62–85, 2020. [Google Scholar]
21. C. Zhang, G. Wang, Y. Zhou, L. Yao, Z. L. Jiang et al., “Feature selection for high dimensional imbalanced class data based on F-measure optimization,” in Proc. Student Professional Awareness Conf. (SPAC), Shenzhen, China, pp. 278–283, 2017. [Google Scholar]
22. Q. A. Tashi, S. J. Abdulkadir, H. M. Rais, S. Mirjalili, H. Alhussian et al., “Binary multi-objective grey wolf optimizer for feature selection in classification,” IEEE Access, vol. 8, no. 6, pp. 106247–106263, 2020. [Google Scholar]
23. P. Langley and H. A. Simon, “Applications of machine learning and rule induction,” Communications of the ACM, vol. 38, no. 11, pp. 54–64, 1995. [Google Scholar]
24. P. Angelov and E. Almeida Soares, “SARS-CoV-2 CT-scan dataset: A large dataset of real patients CT scans for SARS-CoV-2 identification,” MedRxiv, vol. 5, no. 4, pp. 1–8, 2020. [Google Scholar]
25. J. Zhao, Y. Zhang, X. He and P. Xie, “Covid-ct-dataset: A ct scan dataset about covid-19,” Arxiv Preprint Arxiv:2003.13865, vol. 490, no. 7, pp. 1–5, 2020. [Google Scholar]
Cite This Article
 Copyright © 2023 The Author(s). Published by Tech Science Press.
This work is licensed under a Creative Commons Attribution 4.0 International License , which permits unrestricted use, distribution, and reproduction in any medium, provided the original work is properly cited.
 Downloads
 Citation Tools