
 Submit a Paper
 Propose a Special lssue
 Open Access
ARTICLE

Optimal Deep Learning Based Intruder Identification in Industrial Internet of Things Environment
1 Department of Computer Science, College of Science and Arts, Sharurah, Najran University, Saudi Arabia
2 Department of Information Systems, College of Computer and Information Sciences, Princess Nourah bint Abdulrahman University, P.O. Box 84428, Riyadh, 11671, Saudi Arabia
3 Department of Industrial Engineering, College of Engineering at Alqunfudah, Umm Al-Qura University, Saudi Arabia
4 Department of Computer Science, Faculty of Computers and Information Technology, Future University in Egypt, New Cairo, 11835, Egypt
5 Computer Department, Applied College, Najran University, Najran, 66462, Saudi Arabia
6 Department of Computer Science, College of Computer Engineering and Sciences, Prince Sattam bin Abdulaziz University, Al-Kharj, 16273, Saudi Arabia
* Corresponding Author: Mesfer Al Duhayyim. Email:
Computer Systems Science and Engineering 2023, 46(3), 3121-3139. https://doi.org/10.32604/csse.2023.036352
Received 27 September 2022; Accepted 25 November 2022; Issue published 03 April 2023
 View Full Text
 Download PDF
Abstract
With the increased advancements of smart industries, cybersecurity has become a vital growth factor in the success of industrial transformation. The Industrial Internet of Things (IIoT) or Industry 4.0 has revolutionized the concepts of manufacturing and production altogether. In industry 4.0, powerful Intrusion Detection Systems (IDS) play a significant role in ensuring network security. Though various intrusion detection techniques have been developed so far, it is challenging to protect the intricate data of networks. This is because conventional Machine Learning (ML) approaches are inadequate and insufficient to address the demands of dynamic IIoT networks. Further, the existing Deep Learning (DL) can be employed to identify anonymous intrusions. Therefore, the current study proposes a Hunger Games Search Optimization with Deep Learning-Driven Intrusion Detection (HGSODL-ID) model for the IIoT environment. The presented HGSODL-ID model exploits the linear normalization approach to transform the input data into a useful format. The HGSO algorithm is employed for Feature Selection (HGSO-FS) to reduce the curse of dimensionality. Moreover, Sparrow Search Optimization (SSO) is utilized with a Graph Convolutional Network (GCN) to classify and identify intrusions in the network. Finally, the SSO technique is exploited to fine-tune the hyper-parameters involved in the GCN model. The proposed HGSODL-ID model was experimentally validated using a benchmark dataset, and the results confirmed the superiority of the proposed HGSODL-ID method over recent approaches.Keywords
With the gradual advancements of informatization and industrialization, the safety and controllability of the industrial Internet of things (IIoT) have gained significant interest among research communities. The main idea behind the development of IIoT is to reap the advantages of Internet of Things (IoT) technologies and apply it in Industrial Control Systems (ICSs). ICSs have become an essential part of critical structures. ICSs are used for a known period in monitoring industrial machinery and the associated processes [1]. It accomplishes real-time observation and communication with machines, performs real-time data collection and analysis, and keeps a log of every activity of the industrial systems. The application of IoT in such mechanisms improves the network’s security and brings intelligence to the automation and optimization of industrial progressions [2]. Supervisory Control and Data Acquisition (SCADA) mechanism is one of the major components of ICSs. It offers a Graphical User Interface (GUI) via Human Machine Interface (HMI) [3]. HMI eases the processes, for an operator, in terms of system status monitoring, communication with IIoT gadgets, and triggering the alarm in case of abnormal actions. Network intrusion is any effort to destroy the integrity, availability, or confidentiality of the network and its host [4]. It is considered the most typical menace in cyberspace. This is because the existing intrusion prevention conditions are insufficient and static in nature. Conventional Network Intrusion Detection (ID) techniques are generally passive and cannot efficiently identify different types of unknown intrusions [5,6]. Thus, developing a precise and effective intellectual network ID approach is imperative.
An intrusion Detection System (IDS) is a network security gadget that observes real-time network trafficking and triggers a warning or takes proactive actions in case of any suspicious communications [7]. IDSs vary from other prevention mechanisms by detecting the ongoing invasion or invasion that happened earlier [8]. ID can generally be modelled as a binary classification issue that differentiates whether a network traffic conduct is anomalous or normal or a multi-class classifier issue, in which the network traffic conduct is recognized and the network attack type is fixed [9]. Over the past few years, various developments have occurred in the field of Artificial Intelligence (AI), like Deep Learning (DL) and Machine Learning (ML) methods that aim to enhance IoT IDS. The existing demands have been discussed up-to-date via a critical review and the taxonomy of literature [10,11]. Several relevant researchers have applied different ML and DL methods, using numerous datasets, to execute and authenticate the enhancement of IoT IDS. However, it is still a debate whether the ML method or DL method is highly efficient in framing a potential IoT IDS [12]. In literature, the time taken to develop, train, test, and validate an IoT IDS was not considered so far to assess certain IDSs approaches. However, this is an important factor that decides the efficiency of online IDSs [13]. Recently, DL methods have gained popularity since they can resolve network ID issues [14].
In this background, the current study introduces a Hunger Games Search Optimization with Deep Learning-Driven Intrusion Detection (HGSODL-ID) model in an IIoT environment. The presented HGSODL-ID model exploits the linear normalization approach to transform the input data into a useful format. The HGSO algorithm is employed for Feature Selection (HGSO-FS) to reduce the curse of dimensionality. Moreover, Sparrow Search Optimization (SSO) is utilized with Graph Convolutional Network (GCN) for classification and identifying intrusions in the network. Finally, the SSO method is exploited to fine-tune the hyper-parameters related to the GCN model. The proposed HGSODL-ID approach was experimentally validated using a benchmark dataset. In short, the paper’s contribution is summarized as follows.
• Develop a new HGSODL-ID technique for intrusion detection in the IIoT environment.
• Design a new HGSO-FS technique for the feature selection process.
• Employ GCN-based classification with an SSO-based hyperparameter tuning process to improve the detection rate.
Awotunde et al. [15] presented a DL-based ID paradigm for IIoT, with hybrid rule-based Feature Selection (FS), for training and verifying the dataset. The trained method was executed using a hybrid rule-based FS and Deep Feedforward Neural Network (FFNN) technique. Li et al. [16] presented a DL technique for ID in which the Multi-Convolutional Neural Network (CNN) fusion approach was used. Based on the correlation values, the feature data was separated into four portions, after which 1D feature data was transformed into a grayscale graph. By employing flow data visualization system, CNN was established as a solution for ID problems with four optimal outcomes. In the study conducted earlier [17], the authors presented a forensic-based DL technique (termed Deep-IFS) for intrusion recognition in IIoT traffic. This method learnt local representation with the help of the Local Gated Recurrent Unit (LocalGRU) and established a Multihead Attention (MHA) layer to capture and learn about global representations (e.g., long-range dependency). A residual connection was planned amongst the layers to prevent data loss. One of the important challenges faced by the present IIoT forensics structure is its restricted scalability, which limits its efficiency in controlling huge volumes of IIoT traffic data generated by IIoT devices.
Al-Hawawreh et al. [18] introduced a detection method based on DL approaches, while the model was trained and tested using the data retrieved from the Remote Telemetry Unit (RTU) streams of the gas pipeline model. The model employed the Sparse and Denoising Autoencoder (AE) approach upon unsupervised learning. In contrast, Deep Neural Network (DNN) was employed upon supervised learning to generate high-level data representation in unlabelled and noisy data. Gyamfi et al. [19] presented a lightweight IDS based on the Online Incremental Support Vector Data Description (OI-SVDD) anomaly detection method on IIoT devices and Adaptive Sequential Extreme Learning Machine (AS-ELM) on Multi-access Edge Computing (MEC) servers. Furthermore, the authors employed MEC servers that offered computational resources to execute the AS-ELM technique at network edges. Fatani et al. [20] established an extraction feature and selective approaches for the IDS model with the help of the SI technique. The authors designed a feature extraction process based on CNNs. Afterwards, the authors examined an alternative FS technique with the help of the newly-established SI technique, i.e., Aquila Optimizer (AQU).
In the current research, an HGSODL-ID technique has been proposed for detecting and classifying intrusions in the IIoT environment. The presented HGSODL-ID model follows a series of sub-processes: linear normalization, HGSO-FS-based feature selection, GCN classification, and SSO-based hyperparameter optimization. HGSO-based feature selection and SSO-based optimization of the parameters increase the detection performance of the HGSODL-ID model. Fig. 1 depicts the block diagram of the HGSODL-ID approach.

Figure 1: Block diagram of the HGSODL-ID approach
Initially, the presented HGSODL-ID model exploits the linear normalization approach to transform the input data into a useful format. The data should be normalized so that the dataset in the sample lies in the interval of 0 and 1. Since the dataset generally contains normal and anomalous traffic, avoiding the adverse effects of sample mean and variance is important. A simple linear normalization function is employed herewith for numerical features.
In Eq. (1),
3.2 Process Involved in HGSO-FS Technique
In this study, the HGSO-FS technique is employed to reduce the curse of dimensionality. HGSO algorithm imitates the animal hunger-driven action and their behavioural preference. The model was proposed by Yang et al. recently [21]. During food search, an animal shows two social behaviours; initially, the animal cooperates in a group; in the next phase, some individuals do not participate in collaborative action. To simulate social performance, the subsequent formula is used.
In Eq. (2), a constant number, designated to be 0.03, is denoted by the term L, and the vector that lies in the range of
Let
For the ranging controller
In Eq. (4),
Given that
In this equation,
where
In Eq. (8),
The fitness Function (FF) can be defined from the classification accuracy and the number of selected features. It maximizes the classification accuracy and reduces the set size of the selected features. Thus, a subsequent fitness function can be utilized in the evaluation of individual solutions, as given in Eq. (9) below.
Here, ErrorRate refers to the classification error rate utilizing the selected features. ErrorRate can be computed as a percentage of false classifications to the number of classifications created and exhibited. It is written as a value in the range of 0 and 1. While ErrorRate can complement the classification accuracy,
3.3 GCN-Based Intrusion Detection
For intrusion detection and classification, the GCN model is exploited in the current study. In GCN models, the nodes are represented through pass and aggregate messages amongst the neighbouring nodes. Though various types of GCN models have been proposed earlier, the most utilized version has been used in this study, too [23]. Properly, a GCN layer is determined as given below.
Here,
For the primary layer,
The framework of GCN is to provide end-to-end training and incorporate task-specific loss functions. At the time of original analysis, GCN executes the semi-supervised classification tasks. So, Cross Entropy (CE) loss is estimated with the addition of the Softmax function as the final resultant layer. The entire CE errors are estimated on a graph for every sample as labelled below.
Here, L implies the group of nodes with a label, C denotes the count of classes, Y represents the label, and
3.4 Hyperparameter Tuning Using SSO Algorithm
Finally, the SSO technique is exploited to fine-tune the hyper-parameters related to the GCN method. SSO is inspired by the vigilant and predatory behaviours of the sparrow population [25]. Discoverer, entrant, and vigilant are the roles played by every sparrow in its population. In this work, if the fitness of an entrant is highly efficient than the discoverer, then the entrant becomes a discoverer to find their food. The updated position of the discoverer is formulated as follows.
Here,
In Eq. (15),

Figure 2: Steps involved in SSO
In the sparrow population, some sparrows are named vigilant sparrows. These sparrows are generally accountable for 10%–20% of the overall population. Once it realizes the danger, the sparrow near the edge of the group moves quickly to a secure central area to avoid the danger. The sparrows at the optimum location of the population randomly walk toward other sparrows to avoid danger. The updated position of the vigilant sparrow is formulated as follows.
In Eq. (3), the optimum location of the existing population is denoted by
SSO approach extracts a Fitness Function (FF) to achieve enhanced classification outcomes. It allocates a positive numeral to indicate the superior execution of a candidate solution. In this research, the reduced classification error rate is treated as the Fitness Function as given in Eq. (17).
The proposed HGSODL-ID model was experimentally validated using the NSL-KDD dataset [26]. The dataset was generated in the year 2009 and is broadly utilized in network intrusion detection experiments. In modern literature, all the researchers employ the NSL-KDD dataset as a potential baseline dataset since it is highly helpful for researchers to compare different types of intrusion detection methodologies. Tables 1 and 2 show a detailed description of binary and multiclass classification.


4.1 Result Analysis on Binary Dataset
Fig. 3 shows the confusion matrices created by the HGSODL-ID model on the applied binary dataset. On 70% of training (TR) data, the proposed HGSODL-ID model categorized 53,207 samples under the Normal class and 49,746 samples under the Abnormal class. Also, on 30% of testing (TS) data, the presented HGSODL-ID technique recognized 22,916 samples as Normal class and 21,214 samples as Abnormal class.

Figure 3: Confusion matrices of HGSODL-ID approach upon binary dataset (a) 70% of TR dataset and (b) 30% of TS dataset
Table 3 offers the overall classification outcomes accomplished by the proposed HGSODL-ID model on the binary dataset. Fig. 4 provides the analytical results of the proposed HGSODL-ID model on 70% of TR data. The experimental outcomes imply that the proposed HGSODL-ID model achieved maximum performance in all aspects. For example, the HGSODL-ID method classified the normal class samples with an


Figure 4: Results of the analysis of the HGSODL-ID approach on 70% of TR data in the binary dataset
Fig. 5 portrays the results of the analysis of the HGSODL-ID approach on 30% of TS data. The experimental outcomes infer that the proposed HGSODL-ID technique obtained the maximum performance under all prospects. For example, the HGSODL-ID algorithm classified the normal class samples with an

Figure 5: Results of the analysis of the HGSODL-ID approach on 30% of TS data in the binary dataset
Both Training Accuracy (TA) and Validation Accuracy (VA) values acquired by the proposed HGSODL-ID algorithm on the binary dataset are illustrated in Fig. 6. The experimental outcomes denote that the proposed HGSODL-ID algorithm obtained the maximal TA and VA values, while VA values were higher than TA.

Figure 6: TA and VA analyses results of the HGSODL-ID approach on a binary dataset
Both Training Loss (TL) and Validation Loss (VL) values, accomplished by the proposed HGSODL-ID technique on a binary dataset, are established in Fig. 7. The experimental outcomes infer that the proposed HGSODL-ID method accomplished the minimal TL and VL values. In contrast, VL values were lesser than TL.

Figure 7: TL and VL analyses results of the HGSODL-ID approach in the binary dataset
To demonstrate the betterment of the proposed HGSODL-ID model, a detailed comparison study was conducted, and the results are shown in Table 4 and Fig. 8. The results confirmed that the AE model attained the least


Figure 8: Comparative analysis results of the HGSODL-ID approach on the binary dataset
4.2 Result Analysis on Multiclass Dataset
Fig. 9 portrays the confusion matrices generated by the HGSODL-ID method on the applied Multiclass dataset. On 70% of TR data, the proposed HGSODL-ID technique categorized 53,275 samples under the Normal class, 36,991 samples under the Denial of Service (DoS) class, 9,651 samples under the Probe class, 2,385 samples under the Remote-to-Local (R2L) class, and 136 samples under User to Root (U2R) class respectively. Along with that, on 30% of TS data, the presented HGSODL-ID methodology recognized 22,871 samples as Normal class, 15,837 samples as DoS class, 4,165 samples as Probe class, 999 samples as R2L class, 81 samples as U2R class.
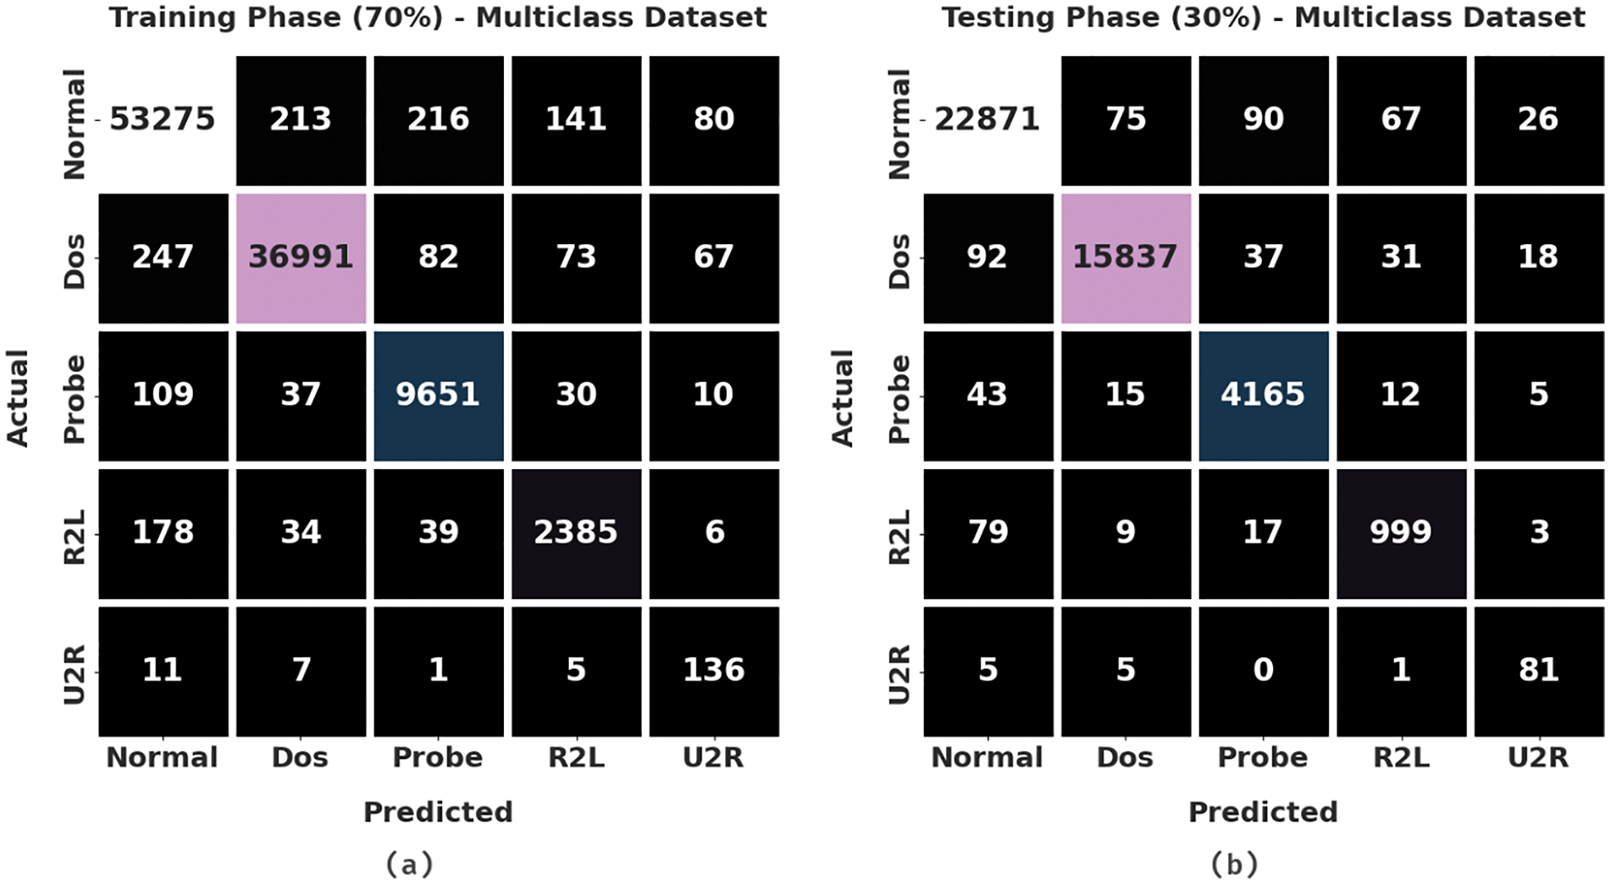
Figure 9: Confusion matrices of HGSODL-ID approach upon multiclass dataset (a) 70% of TR data and (b) 30% of TS data
Table 5 provides the overall classification outcomes of the proposed HGSODL-ID model on the Multiclass dataset. Fig. 10 presents the analytical results of the HGSODL-ID algorithm on 70% of TR data. The experimental outcomes infer that the proposed HGSODL-ID methodology produced the maximum performance under all aspects. For instance, the HGSODL-ID technique classified the normal class samples with an


Figure 10: Results of the analysis of the HGSODL-ID approach on 70% of TR data in the multiclass dataset
Fig. 11 shows the analytical results of the proposed HGSODL-ID method on 30% of TS data. The experimental outcomes imply that the presented HGSODL-ID algorithm achieved the maximum performance under all aspects. For example, the HGSODL-ID approach classified the normal class samples with an

Figure 11: Results of the analysis of the HGSODL-ID approach on 30% of TS data in the multiclass dataset
To establish the supremacy of the proposed HGSODL-ID methodology, a detailed comparative analysis was conducted and the results are shown in Table 6 and Fig. 12 [12]. The results state that Stacked Autoencoder (SAE) algorithm reached the least


Figure 12: Comparative analysis results of HGSODL-ID approach on multiclass dataset
From the detailed results and discussion, it is evident that the proposed HGSODL-ID model is an excellent performer compared to other models.
In this study, an HGSODL-ID method has been developed for the detection and classification of intrusions in the IIoT environment. The presented HGSODL-ID technique follows a series of sub-processes namely, linear normalization, HGSO-FS-based feature selection, GCN classification, and SSO-based hyperparameter optimization. HGSO-based Feature Selection and SSO-based optimal parameter tuning enhance the detection performance of the HGSODL-ID model. The proposed HGSODL-ID method was experimentally validated with the help of benchmark datasets and the outcomes signify the supremacy of the HGSODL-ID technique over recent approaches since the method achieved the highest accuracy of 99.43%. Thus, the HGSODL-ID model can be exploited to accomplish network security in a smart factory environment. In future, the outcomes of the HGSODL-ID model can be boosted with the help of data clustering or outlier removal approaches.
Funding Statement: Princess Nourah bint Abdulrahman University Researchers Supporting Project Number (PNURSP2022R319), Princess Nourah bint Abdulrahman University, Riyadh, Saudi Arabia. The authors would like to thank the Deanship of Scientific Research at Umm Al-Qura University for supporting this work by Grant Code: 22UQU4340237DSR44. The authors are thankful to the Deanship of Scientific Research at Najran University for funding this work under the Research Groups Funding program Grant Code (NU/RG/SERC/11/4).
Conflicts of Interest: The authors declare that they have no conflicts of interest to report regarding the present study.
References
1. S. Latif, Z. Idrees, Z. Zou and J. Ahmad, “DRaNN: A deep random neural network model for intrusion detection in industrial iot,” in 2020 Int. Conf. on UK-China Emerging Technologies (UCET), Glasgow, United Kingdom, pp. 1–4, 2020. [Google Scholar]
2. T. Hasan, J. Malik, I. Bibi, W. U. Khan, F. N. A. Wesabi et al., “Securing industrial internet of things against botnet attacks using hybrid deep learning approach,” IEEE Transactions on Network Science and Engineering, pp. 1, 2022. https://doi.org/10.1109/TNSE.2022.3168533 [Google Scholar] [CrossRef]
3. S. Tharewal, M. W. Ashfaque, S. S. Banu, P. Uma, S. M. Hassen et al., “Intrusion detection system for industrial internet of things based on deep reinforcement learning,” Wireless Communications and Mobile Computing, vol. 2022, pp. 1–8, 2022. [Google Scholar]
4. I. Essop, J. C. Ribeiro, M. Papaioannou, G. Zachos, G. Mantas et al., “Generating datasets for anomaly-based intrusion detection systems in iot and industrial iot networks,” Sensors, vol. 21, no. 4, pp. 1528, 2021. [Google Scholar] [PubMed]
5. M. A. Hawawreh, N. Moustafa and E. Sitnikova, “Identification of malicious activities in industrial internet of things based on deep learning models,” Journal of Information Security and Applications, vol. 41, pp. 1–11, 2018. [Google Scholar]
6. A. A. Albraikan, S. B. Haj Hassine, S. M. Fati, F. N. Al-Wesabi, A. M. Hilal et al., “Optimal deep learning-based cyberattack detection and classification technique on social networks,” Computers, Materials & Continua, vol. 72, no. 1, pp. 907–923, 2022. [Google Scholar]
7. P. L. S. Jayalaxmi, R. Saha, G. Kumar and T. -H. Kim, “Machine and deep learning amalgamation for feature extraction in industrial internet-of-things,” Computers & Electrical Engineering, vol. 97, pp. 107610, 2022. [Google Scholar]
8. A. M. Hilal, J. S. Alzahrani, I. Abunadi, N. Nemri, F. N. Al-Wesabi et al., “Intelligent deep learning model for privacy preserving iiot on 6g environment,” Computers, Materials & Continua, vol. 72, no. 1, pp. 333–348, 2022. [Google Scholar]
9. M. A. Alohali, F. N. Al-Wesabi, A. M. Hilal, S. Goel, D. Gupta et al., “Artificial intelligence enabled intrusion detection systems for cognitive cyber-physical systems in industry 4.0 environment,” Cognitive Neurodynamics, 2022. https://doi.org/10.1007/s11571-022-09780-8 [Google Scholar] [PubMed] [CrossRef]
10. E. Gyamfi and A. Jurcut, “Intrusion detection in internet of things systems: A review on design approaches leveraging multi-access edge computing, machine learning, and datasets,” Sensors, vol. 22, no. 10, pp. 3744, 2022. [Google Scholar] [PubMed]
11. A. M. Hilal, M. A. Alohali, F. N. Al-Wesabi, N. Nemri, J. Hasan et al., “Enhancing quality of experience in mobile edge computing using deep learning based data offloading and cyberattack detection technique,” Cluster Computing, 2021. https://doi.org/10.1007/s10586-021-03401-5 [Google Scholar] [CrossRef]
12. A. Fatani, A. Dahou, M. A. A. Al-Qaness, S. Lu and M. A. Abd Elaziz, “Advanced feature extraction and selection approach using deep learning and aquila optimizer for iot intrusion detection system,” Sensors, vol. 22, no. 1, pp. 140, 2021. [Google Scholar] [PubMed]
13. G. Altan, “SecureDeepNet-IoT: A deep learning application for invasion detection in industrial internet of things sensing systems,” Transactions on Emerging Telecommunications Technologies, vol. 32, no. 4, 2021. [Google Scholar]
14. S. T. Park, G. Li and J. C. Hong, “A study on smart factory-based ambient intelligence context-aware intrusion detection system using machine learning,” Journal of Ambient Intelligence and Humanized Computing, vol. 11, no. 4, pp. 1405–1412, 2020. [Google Scholar]
15. J. B. Awotunde, C. Chakraborty and A. E. Adeniyi, “Intrusion detection in industrial internet of things network-based on deep learning model with rule-based feature selection,” Wireless Communications and Mobile Computing, vol. 2021, pp. 1–17, 2021. [Google Scholar]
16. Y. Li, Y. Xu, Z. Liu, H. Hou, Y. Zheng et al., “Robust detection for network intrusion of industrial IoT based on multi-CNN fusion,” Measurement, vol. 154, pp. 107450, 2020. [Google Scholar]
17. M. A. Basset, V. Chang, H. Hawash, R. K. Chakrabortty and M. Ryan, “Deep-IFS: Intrusion detection approach for industrial internet of things traffic in fog environment,” IEEE Transactions on Industrial Informatics, vol. 17, no. 11, pp. 7704–7715, 2021. [Google Scholar]
18. M. Al-Hawawreh, E. Sitnikova and F. den Hartog, “An efficient intrusion detection model for edge system in brownfield industrial internet of things,” in Proc. of the 3rd Int. Conf. on Big Data and Internet of Things, Melbourn VIC Australia, pp. 83–87, 2019. [Google Scholar]
19. E. Gyamfi and A. D. Jurcut, “Online network intrusion detection system for industrial IoT based on OI-SVDD and AS-ELM,” IEEE Internet Things Journal, pp. 1, 2022. https://doi.org/10.1109/JIOT.2022.3172393 [Google Scholar] [CrossRef]
20. A. Fatani, A. Dahou, M. A. A. Al-qaness, S. Lu and M. A. A. Elaziz, “Advanced feature extraction and selection approach using deep learning and aquila optimizer for iot intrusion detection system,” Sensors, vol. 22, no. 1, pp. 140, 2021. [Google Scholar] [PubMed]
21. Y. Yang, H. Chen, A. A. Heidari and A. H. Gandomi, “Hunger games search: Visions, conception, implementation, deep analysis, perspectives, and towards performance shifts,” Expert Systems with Applications, vol. 177, pp. 114864, 2021. [Google Scholar]
22. H. Nguyen and X. -N. Bui, “A hunger games search optimization-based artificial neural network for predicting ground vibration intensity induced by mine blasting,” Natural Resources Research, vol. 30, no. 5, pp. 3865–3880, 2021. [Google Scholar]
23. T. N. Kipf and M. Welling, “Semi-supervised classification with graph convolutional networks,” arXiv preprint arXiv:1609.02907, 2016. [Google Scholar]
24. Y. Pei, T. Huang, W. van Ipenburg and M. Pechenizkiy, “ResGCN: Attention-based deep residual modeling for anomaly detection on attributed networks,” Machine Learning, vol. 111, no. 2, pp. 519–541, 2022. [Google Scholar]
25. Z. Wang, X. Huang and D. Zhu, “A multistrategy-integrated learning sparrow search algorithm and optimization of engineering problems,” Computational Intelligence and Neuroscience, vol. 2022, pp. 1–21, 2022. [Google Scholar]
26. S. K. Sahu, S. Sarangi and S. K. Jena, “A detail analysis on intrusion detection datasets,” in 2014 IEEE Int. Advance Computing Conf. (IACC), Gurgaon, India, pp. 1348–1353, 2014. [Google Scholar]
Cite This Article
 Copyright © 2023 The Author(s). Published by Tech Science Press.
This work is licensed under a Creative Commons Attribution 4.0 International License , which permits unrestricted use, distribution, and reproduction in any medium, provided the original work is properly cited.
 Downloads
 Citation Tools