
 Submit a Paper
 Propose a Special lssue
 Open Access
ARTICLE

An Automated Classification Technique for COVID-19 Using Optimized Deep Learning Features
1 School of Engineering, RMIT University, Melbourne, Australia
2 Department of Electrical Engineering, HITEC University Taxila, 47080, Pakistan
3 Department of Cyber Security, Pakistan Navy Engineering College, NUST, Karachi 75350, Pakistan
4 Department of Computer Science, College of Computer, Qassim University, Buraydah 51452, Saudi Arabia
5 James Watt School of Engineering, University of Glasgow, Glasgow, G12 8QQ, UK
6 School of Computing, Edinburgh Napier University, Edinburgh, EH10 5DT, UK
* Corresponding Author: Suliman A. Alsuhibany. Email:
Computer Systems Science and Engineering 2023, 46(3), 3799-3814. https://doi.org/10.32604/csse.2023.037131
Received 25 October 2022; Accepted 02 February 2023; Issue published 03 April 2023
 View Full Text
 Download PDF
Abstract
In 2020, COVID-19 started spreading throughout the world. This deadly infection was identified as a virus that may affect the lungs and, in severe cases, could be the cause of death. The polymerase chain reaction (PCR) test is commonly used to detect this virus through the nasal passage or throat. However, the PCR test exposes health workers to this deadly virus. To limit human exposure while detecting COVID-19, image processing techniques using deep learning have been successfully applied. In this paper, a strategy based on deep learning is employed to classify the COVID-19 virus. To extract features, two deep learning models have been used, the DenseNet201 and the SqueezeNet. Transfer learning is used in feature extraction, and models are fine-tuned. A publicly available computerized tomography (CT) scan dataset has been used in this study. The extracted features from the deep learning models are optimized using the Ant Colony Optimization algorithm. The proposed technique is validated through multiple evaluation parameters. Several classifiers have been employed to classify the optimized features. The cubic support vector machine (Cubic SVM) classifier shows superiority over other commonly used classifiers and attained an accuracy of 98.72%. The proposed technique achieves state-of-the-art accuracy, a sensitivity of 98.80%, and a specificity of 96.64%.Keywords
In 2020, an infection swiftly spread throughout the world [1]. The highly contiguous nature of this disease became the reason for its worldwide spread in a short span of time. The virus SARS-CoV2 is the cause of this infection [2]. In February 2020, the World Health Organization (WHO) recognized this disease as COVID-19 [3]. The WHO has issued guidelines that include social distancing, travel rules, and so on, in order to suppress the spread of COVID-19. COVID-19 not only has an impact on the health sector, but it has also had a negative impact on the economy and day-to-day activities [4,5]. The continuous rapid spread of COVID-19 throughout the world forced the WHO to declare it a pandemic in March 2020 [6]. A reverse transcription-polymerase chain reaction (RT-PCR) is the first method used to examine COVID-19. This test is not only time-consuming and painful but also exposes medical staff to the virus while testing [7]. Different vaccinations have been developed over time. Vaccinations have been carried out on a massive scale throughout the world to build immunity against COVID-19. Vaccinations significantly reduce the severity of infection, but the evolving nature of the virus after mutation is still a threat. After a few months, a new variant of the virus emerged. Numerous approaches for deep learning have been developed and applied for medical diagnostics that include the detection and classification of COVID-19 infection. Deep learning techniques are used to evaluate X-rays and CT scans for an early and timely diagnosis of COVID-19 chest [8,9]. Usually, the X-ray is considered the first measure to examine the chest, but the CT scan is found to be more effective as it represents 3D volumes of the chest.
During the last two decades, artificial intelligence techniques have made great advances in the domain of image processing [10,11]. Before the boom of artificial intelligence, specifically deep learning, traditional computer vision techniques had been used to perform different image processing tasks. Computer vision techniques are usually slow, and they need handcrafted features for processing [12]. On the other hand, deep learning techniques only need clean data for processing. Automatic feature extraction is performed using deep learning techniques, and later, using these features, different tasks, including classification, segmentation, etc., are performed. It has been found in the literature that deep learning techniques are applied in almost every field of life, including medical [13], agriculture [14], self-driving cars [15], robotics [16], etc. Deep learning techniques have a few constraints: data availability and computation power. Generally, deep learning approaches need a massive amount of data for training the models. Even in this age of digitalization, data availability is a problem [17]. Nonetheless, deep learning techniques significantly improved performance in terms of accuracy and time for the problems mentioned above.
In medical imaging, deep learning has played a vital role and has been applied for different purposes, including real-time monitoring of organs, diagnosis, classification, and detection of other diseases [18]. It has been found in the literature that deep learning-based techniques have been applied for the treatment and diagnosis of cancer and tumors [19]. Moreover, these techniques are used for the classification of ulcers in gastrointestinal endoscopy [13], but deep learning techniques are not confined to these limits. Deep learning techniques are also used to classify skin disorders [20,21] and various lung diseases [22,23], and recently, after the COVID-19 pandemic, deep learning techniques were applied for the detection and classification of COVID-19 [24]. Deep learning-based systems for detecting and classifying COVID-19 are an additional aid for doctors in the early and timely detection of COVID-19 and their manual diagnosis. These techniques showed significant performance and reduced the probability of human error.
In this work, a novel deep learning-based technique has been proposed for the detection of COVID-19. The main contributions of this research are as follows:
• A transfer learning method is used to fine-tune two deep learning models, the DenseNet201 and the SqueezeNet for classifying COVID-19 infections.
• The extracted features are optimized using the Ant Colony Optimization (ACO) technique.
• Six different classifiers with a k-fold cross-validation strategy have been used to classify the COVID-19 infection using an optimized feature set.
• The classification results of six classifiers are compared using several evaluation parameters.
• A comprehensive comparison of classification performance based on optimized and raw features has been conducted.
The rest of the paper is organized into four sections. Section 2 discusses the techniques already present in the literature. The proposed methodology has been thoroughly discussed in Section 3. Section 4 presents the results of the proposed technique and a comparison with other state-of-the-art techniques. Section 5 concludes the paper and provides future directions.
Numerous techniques based on deep learning have been found in the literature to classify and detect COVID-19. Shankar et al. [25] presented a hybrid approach for classifying COVID-19 infection. The dataset used was comprised of X-ray images. As a preprocessing step, Gaussian filtering was used, and handcrafted features were extracted using the local binary pattern (LBP). Moreover, the deep learning model Inceptionv3 was used to extract deep features. In this technique, both handcrafted and deep features are fused together before classification. The proposed technique achieved 94.08% accuracy. Ismael et al. [26] presented a deep learning-based COVID-19 classification method. To extract features, various deep learning techniques were used, which were then classified using a support vector machine (SVM) classifier using different kernel functions for classification. Experimentation was performed on X-ray images, and the proposed method obtained an accuracy of 94.7% with a linear kernel function. Shah et al. [27] proposed a deep learning model, the CTnet-10, to diagnose COVID-19 infection. The presented approach used CT scans for diagnosis, and different deep learning models were employed to evaluate the performance of CTnet-10. The VGG-19 shows promising results, with a classification accuracy of 94.52%.
Alshazly et al. [28] presented a methodology for classifying COVID-19 CT scans. With the help of transfer learning, this technique used different deep learning frameworks for classification. The results reported in the paper showed the superiority of this method. Hasan et al. [29] presented a technique incorporating deep learning features with hand-crafted features to achieve good classification accuracy. Three different datasets are used in this work, and as a preprocessing step, histogram thresholding is employed to segregate the background of the images. Handcrafted features are extracted using Q-deformed entropy; later, deep learning features are combined with the Q-deformed features and classified using a neural network with Long Short Time Memory (LSTM). Ragab et al. [30] presented an ensemble-based deep learning model for the classification and detection of COVID-19. The ensemble deep learning models are optimized using the Shark optimization algorithm. Classification is performed using Multiclass Support Vector Machine (M-SVM) along with Bat optimization. The proposed technique achieved good classification accuracy on CT scans. Zheng et al. [31] proposed a technique for the detection of COVID-19 using 3D volumes of CT scans. The pre-trained U-Net is used to segment the lung region by removing the background. The segmented lung is provided to DeCOVNet for COVID-19 classification. The convolutional neural network DeCOVNet is comprised of vanilla 3D convolution, two 3D residual blocks, and a progressive classifier. The technique attained good classification accuracy. Loey et al. [32] proposed a new optimization-based convolutional neural network to detect COVID-19 infection using X-ray images of the chest. Deep features are extracted using a deep learning model. The hyperparameters of the model were optimized using a Bayesian optimization algorithm with the help of an objective function. Moreover, different training strategies have been evaluated. The best classification accuracy using the Bayesian-based convolutional neural network is 96%. Xu et al. [33] described a method for differentiating COVID infection from normal chest X-rays. Various deep learning models are used in this study for feature extraction and classification. The dataset used was divided into 85:15 training and testing ratios. The model Xception showed superior results when compared with other models.
Hall et al. [34] proposed a technique that uses deep learning models to classify COVID-19 infections using X-ray images. The transfer learning approach was adopted for efficient training of ResNet50. To avoid overfitting, a 10-fold cross-validation strategy was used. The proposed technique attained a classification accuracy of 89.2%. Mahin et al. [35] presented a technique for binary classification of chest X-rays using a transfer learning approach. The technique utilizes three pre-trained deep learning models that are fine-tuned for binary chest X-ray classification. The used models are VGG-16, InceptionV3, and MobileNetV2. MobileNetV2 showed better results with an accuracy of 98%, whereas VGG-16 attained an accuracy of 92.72%. Tammina et al. [36] proposed a deep learning-based technique that utilizes several deep learning models. The pre-trained models were fine-tuned using transfer learning. Classification was performed based on the majority voting system of the ensemble models. The system attained an accuracy of 96.83% and shows promising potential for aiding radiologists in COVID diagnosis. In the work proposed by Reddy et al. [37], a multi-modal fusion technique was introduced using a deep transfer learning approach. The proposed technique comprises three stages: pre-processing, feature extraction, and classification. Three different deep learning models were used for feature extraction, namely ResNet50, Inceptionv3, and VGG-16. The extracted features are fused together and classified using the softmax classifier. This technique efficiently classifies COVID-19 with an accuracy of 93.60%.
A number of techniques have been discussed to provide an overview of the literature regarding deep learning-based COVID diagnosis. However, there is a need to improve detection and classification accuracy. In previous studies, very few techniques focused on optimizing deep learning-based features. Optimization techniques can discard redundant and irrelevant features, which leads to improvements in classification accuracy.
This section discusses in detail the proposed workflow for COVID-19 classification. Fig. 1 illustrates the systematic workflow for the proposed work. The figure depicts that the proposed work is composed of various steps, starting with the preprocessing step, to improve the quality of the raw dataset. Two different deep learning models are used in this study to extract features, and the acquired features from the deep learning models are then optimized to increase the classification accuracy. Each step of the workflow is shown in Fig. 1 and discussed thoroughly in the following subsections.
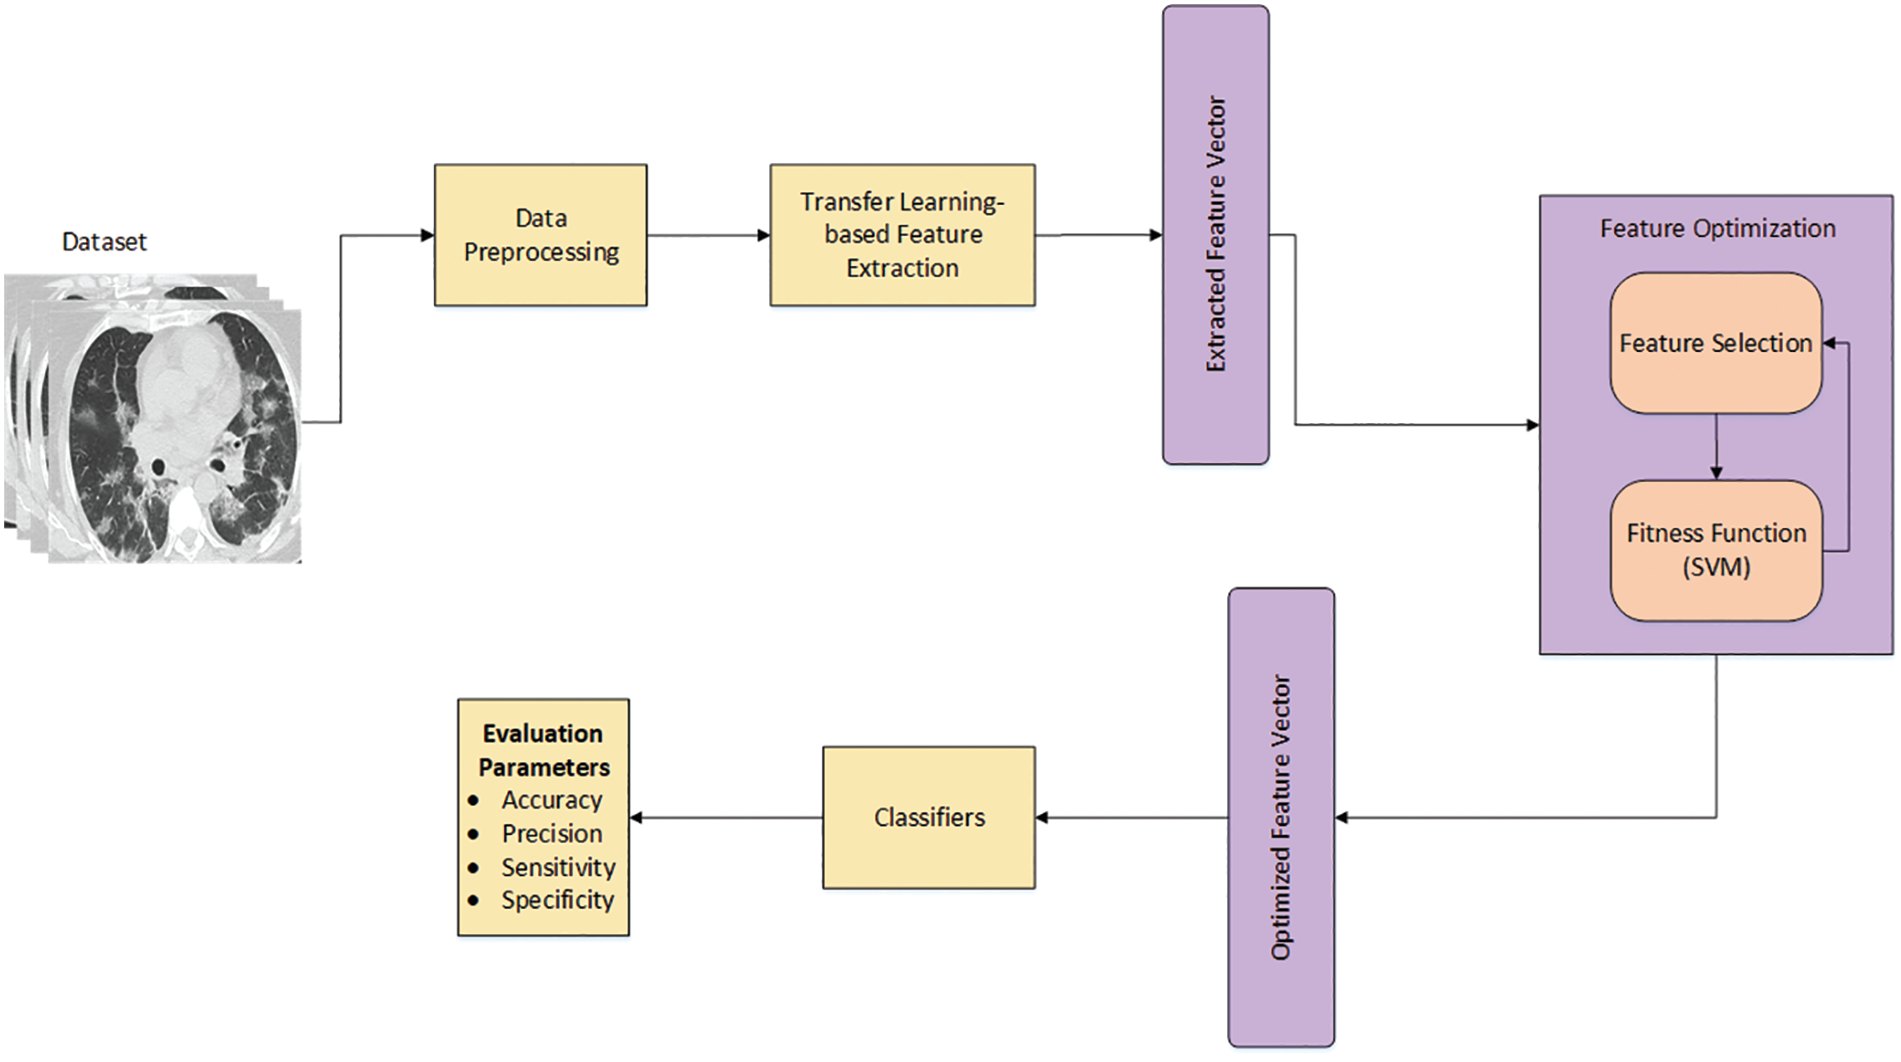
Figure 1: The proposed workflow for COVID-19 classification
3.1 Dataset and Data Preprocessing
The CT scan dataset is used in this work to train and test the proposed technique. It is composed of two classes: COVID-19 and Non-COVID. There are 1252 CT scan images in the COVID-19 class, ranging from mild to severe COVID-19 infection. The Non-Covid class contains 1229 CT scan images that are not infectious. The dataset used has no class imbalance and is publicly available [38]. To improve the visual quality of the dataset, pixel normalization is applied, which significantly improves the visual quality of the dataset. The dataset is split into 70:30 for the purpose of training and testing. Table 1 covers the numeric details of the dataset.
3.2 Transfer Learning-Based Feature Extraction
Efficient feature extraction is crucial for accurate classification. In the literature, various deep learning models are available that can be used for the purpose of feature extraction. In this work, two different pre-trained models have been used for feature extraction: SqueezeNet and DenseNet201. Both models were previously trained on the known ImageNet dataset. ImageNet is quite a large dataset consisting of 1000 classes [39]. SqueezeNet is a lightweight model having an accuracy close to that of AlexNet (a renowned model) with 50% fewer parameters, while DenseNet201 is one of the models that are able to attain superior accuracy on a specific dataset. Transfer learning (TL) is used to train both models instead of training them from scratch. TL helps in swift feature learning [40]. The following subsections cover the details of the deep learning models employed in this work.
SqueezeNet is a lightweight deep learning model that has been employed in this work [41]. In comparison, it is half the size of AlexNet. Lightweight models are easy to integrate into end devices. The pre-trained SqueezeNet is used for feature extraction. The model was previously trained on the ImageNet dataset [39]. Transfer learning has been used to train the model on the COVID-19 CT scan dataset. The SqueezeNet model is composed of Fire modules, which consist of two different convolutional layers, squeeze and expand layers. A visual illustration of the Fire module is shown in Fig. 2. The filter size in the squeeze layer has been reduced to 1 × 1, which is usually 3 × 3 in the convolutional layers. Two different sizes of filters are used in expand layers which are 1 × 1 and 3 × 3. ReLU activation is used in between the squeeze and the expand layers. To get enriched low-level features, downsampling is avoided on early fire modules instead of a fully connected layer. The final features are extracted using global average pooling. The output feature vector size of SqueezeNet is of size N × 1000. Moreover, the activation function (softmax) was replaced with a binary cross-entropy loss that is a combination of the sigmoid activation function plus cross-entropy loss. Mathematically, it is expressed as follows:
where GT is the ground truth and PS is the prediction score. M represents the number of classes.
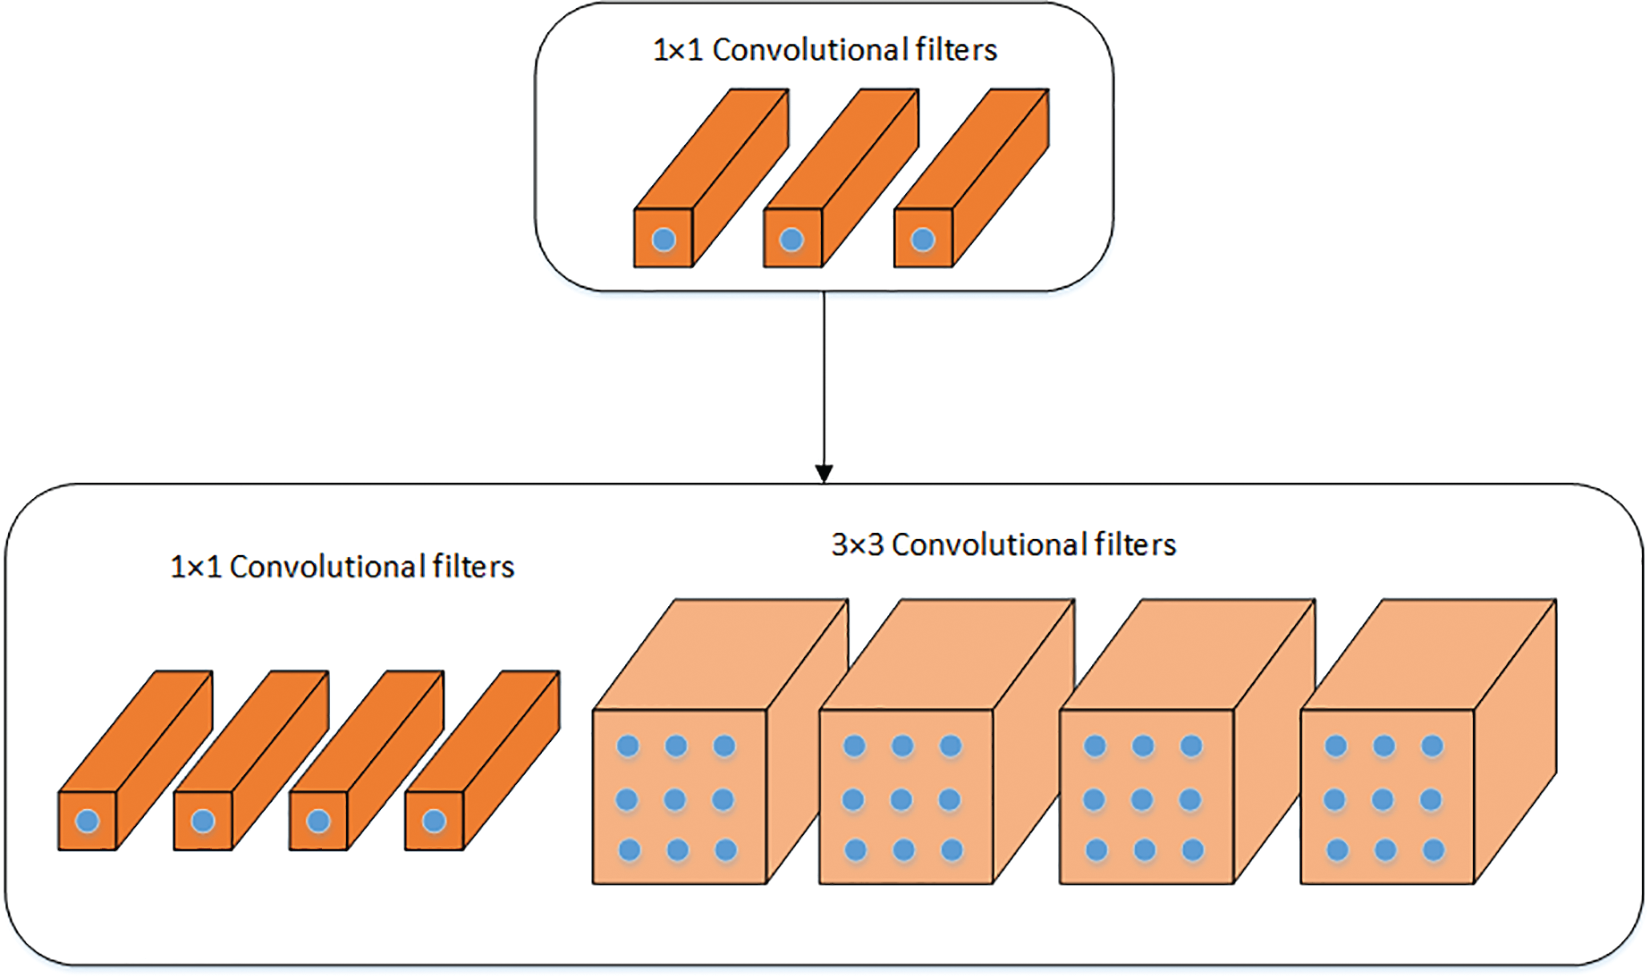
Figure 2: Visual illustration of the fire module of SqueezeNet
DenseNet is the other model that has been used in this work [42] and is a variant of the DenseNet family having 201 layers, thus known as DenseNet201. DenseNet201 consists of two blocks, namely the dense block and the transition block. There are 4 dense blocks where prime feature extraction takes place. The initial dense blocks extract low-level features, while the successive layers extract high-level features. Different numbers of filters are used in the dense block. Each dense block is connected to the previous dense block through a transition block, which provides facilitation in the process of feature concatenation. The concatenation of extracted features from the dense blocks provides a diversified feature set. There are three transition blocks used in DenseNet201, which include convolution and pooling layers. The final feature vector of DenseNet201 is of size N × 1920. where N is the number of images used to train the model. To train both models on the COVID-19 dataset, a learning rate of 0.001 is used. The batch size and momentum used in this work are 32 and 0.9, respectively. Moreover, the weight decay of 0.2 is employed during training.
3.3 Feature Optimization and Classification
Optimizing the extracted features is an important step, as effective optimization not only improves the system’s performance but also reduces the processing time. In this work, the extracted features are optimized using ACO. The ACO algorithm is one of the metaheuristic algorithms that is based on the behavior of ants. ACO mathematically models the natural behavior of ants for the optimized solution. The extracted features from deep learning models are fed to ACO for optimization.
where
In Eq. (4),
where
where, the factor
Section 4 explains the evaluation of the proposed work. Results have been discussed thoroughly, and extensive experimentation along with comparisons are presented. The results are grouped into two main categories. Subsection 4.1 explains the experimental setup. In Subsection 4.2, classification results are presented using raw deep learning features, while in Subsection 4.3, classification results are discussed using optimized deep learning features.
The technique proposed in this work is assessed using the dataset mentioned earlier. The dataset is split into 70:30 training and testing subsets. Classification is performed using 6 different classifiers to evaluate the proposed technique. The purpose of using multiple classifiers is to authenticate the performance of the technique. A K-fold cross-validation strategy has been adopted, where K = 5 and K = 10. In this work, SVM and KNN-based classifiers were used. The time complexity factor of SVM classifiers is
4.2 Classification Using Raw Deep Learning Features
As mentioned in Section 3, two deep learning models were fine-tuned to extract features from the dataset. Classification is performed based on the extracted features using multiple classifiers.
This subsection presents the results of classification based on the features extracted from DenseNet201. Six different classifiers are used to classify the extracted features. The classifiers used in this work are Quadratic SVM, Cubic SVM, Medium Gaussian SVM, Fine KNN, Weighted KNN, and Ensemble Subspace KNN. The results were computed using the K-fold cross-validation technique. The cross-validation methodology is used to avoid overfitting. All the findings are validated on K = 5 and K = 10. The outcomes of this strategy are reported in Table 2. The table shows that Cubic SVM attained the best results in terms of accuracy. For K = 5, the Cubic SVM attained an accuracy of 96.21%, and the highest accuracy was also attained by the Cubic SVM, recorded as 96.61% when validated on K = 10 folds. Sensitivity and specificity are recorded as 97.29% and 95.93%, whereas precision and MCC are 95.99% and 93.23%, respectively. It has been noticed that a 10-fold cross-validation strategy takes more computation time as compared to a 5-fold cross-validation strategy, but the 10-fold strategy shows superiority over the 5-fold strategy in terms of classification accuracy. The classifier ensemble subspace KNN shows the worst performance on both folds, i.e., K = 5 and K = 10.
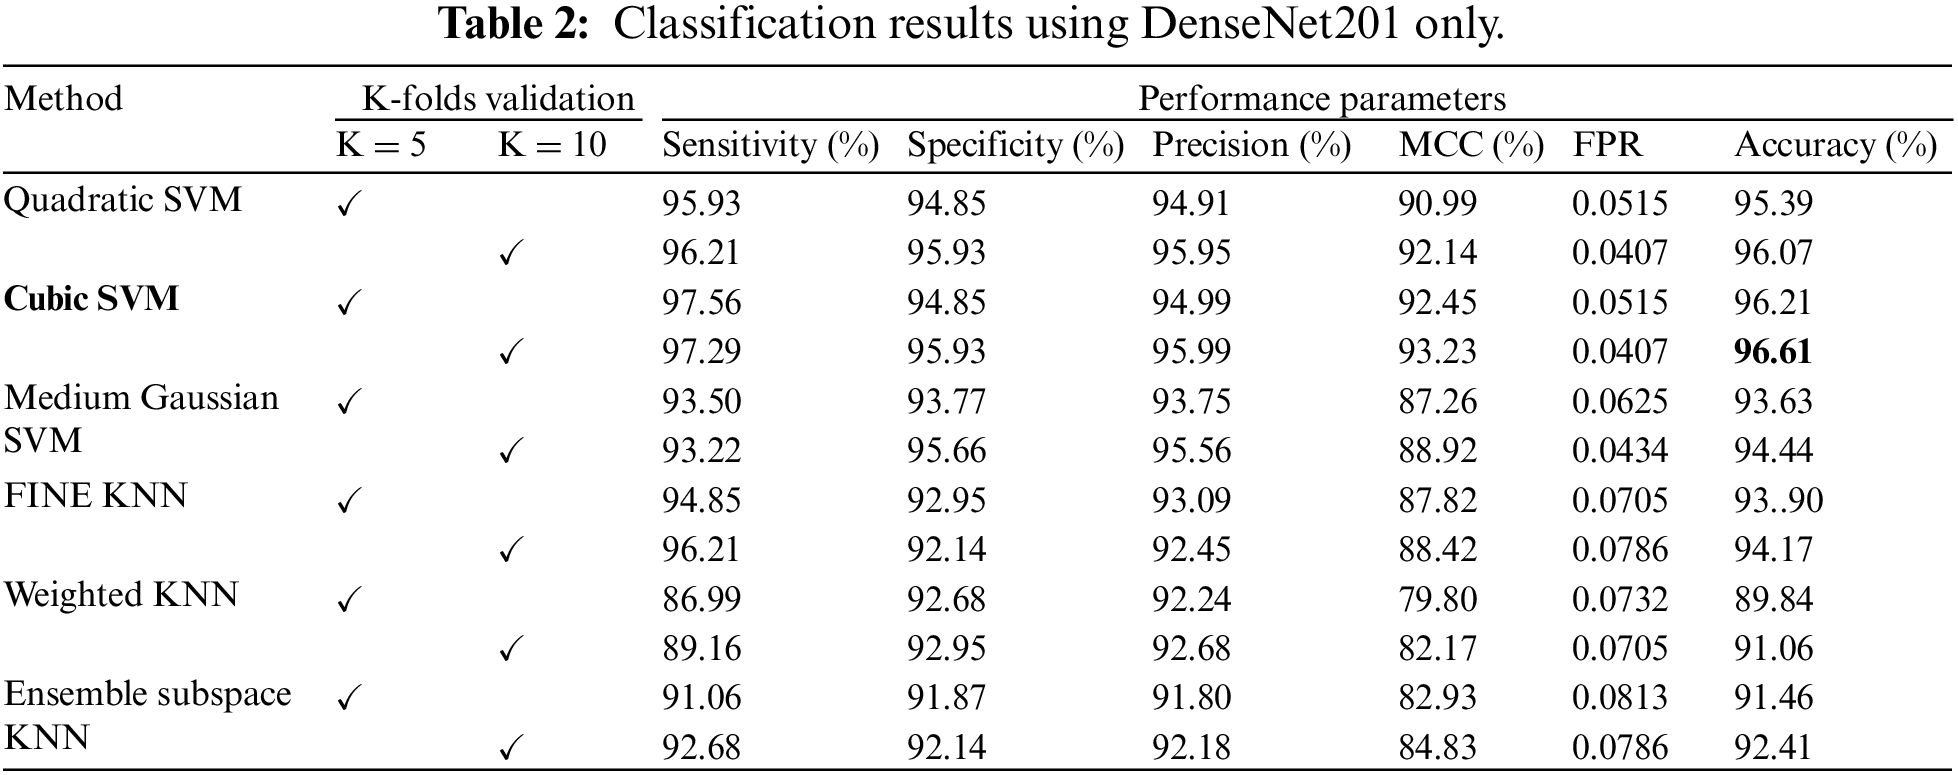
Fig. 3 illustrates the confusion matrix for the Cubic SVM classifier. Fig. 3a shows the results of Cubic SVM for 5 folds. Fig. 3a depicts that the COVID class is accurately classified with 98% accuracy, while the Non-COVID class shows 95% accuracy. Fig. 3b shows the confusion matrix for the Cubic SVM classifier when validated with 10 folds. It shows that the COVID and Non-COVID classes are accurately classified with 97% and 96% accuracy, respectively.
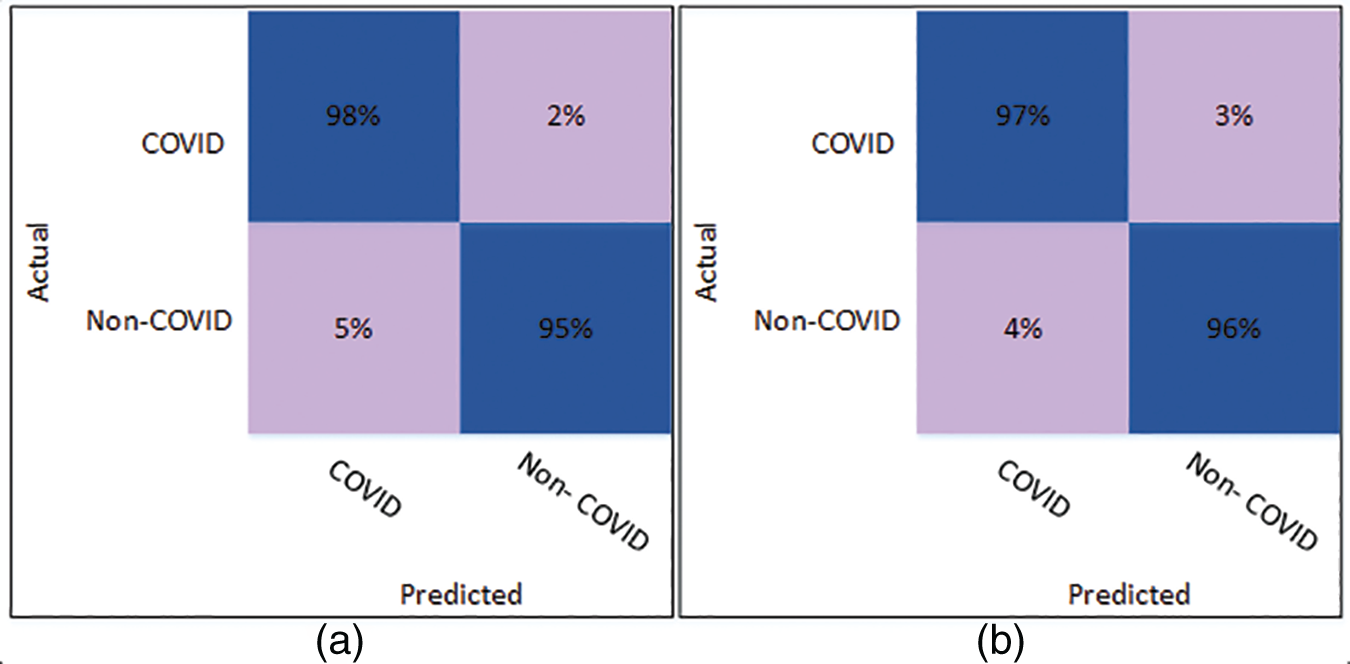
Figure 3: Confusion matrix of Cubic SVM using DenseNet201 (a) represents K = 5 folds. (b) Represents K = 10 folds
The classification results using the SqueezeNet model for all 6 classifiers are presented in Table 3. The results have also been validated using K = 5 and K = 10. The highest accuracy is obtained by Cubic SVM when validated through K = 5. The accuracy was recorded as 91.46%. Other parameters, including sensitivity and specificity, are recorded as 92.68% and 90.24% to further authenticate results using the proposed strategy. Moreover, the precision and MCC are 90.48% and 82.95%. Weighted KNN using SqueezeNet features recorded the lowest classification accuracy, whereas for K = 10, the highest classification accuracy is also obtained by the Cubic SVM, i.e., 90.51%.
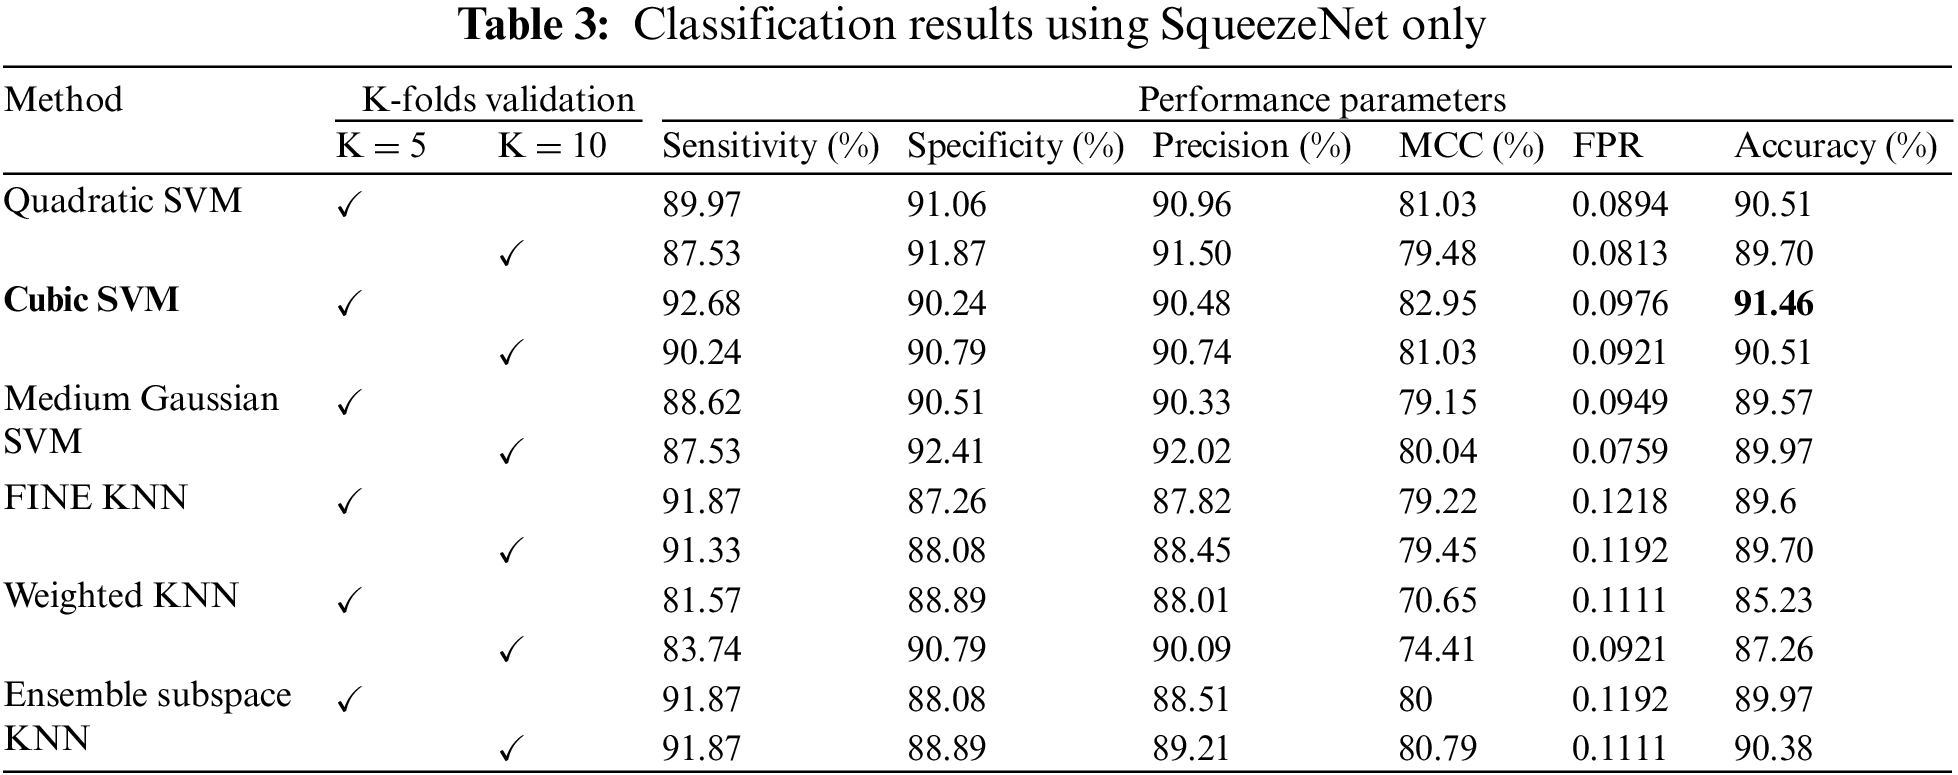
The confusion matrix of Cubic SVM is shown in Fig. 4. Fig. 4a shows the confusion matrix on 5-fold cross-validation. The COVID class is accurately classified with 93% accuracy, while the Non-COVID class is classified with 90% accuracy. Fig. 4b represents the confusion matrix of Cubic SVM on 10-fold cross-validation, where COVID and Non-COVID classes are accurately classified with 90% and 91% accuracy, respectively.
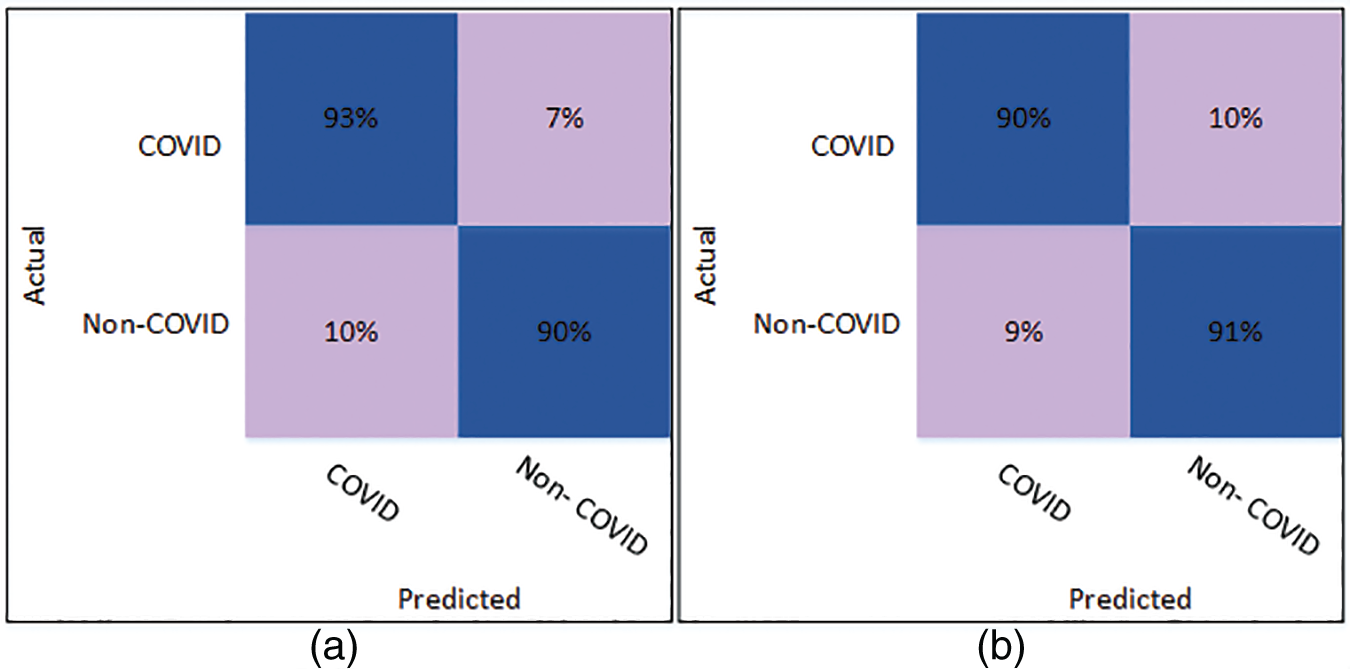
Figure 4: Confusion matrix of Cubic SVM using SqueezeNet (a) represents K = 5 folds. (b) Represents K = 10 folds
4.3 Classification Using Optimized Deep Learning Features
In this section, the COVID classification results using the optimized features from two deep learning models are presented. The features extracted from the deep learning models are optimized using the ACO algorithm. The process of feature optimization was discussed in Section 3.4. Multiple classifiers have been tested for the evaluation of classification accuracy.
The classification results of the optimized DenseNet201 features are discussed in this subsection. Classification has been performed using 6 different classifiers: Quadratic SVM, Cubic SVM, Medium Gaussian SVM, Fine KNN, Weighted KNN, and Ensemble Subspace KNN. The Cubic SVM classifier outperforms all the other classifiers based on accuracy and other evaluation parameters. When validated with K = 5, the Cubic SVM achieved a classification accuracy of 97.74%, as shown in Table 4. Moreover, the best overall performance is attained by the Cubic SVM when validated using K = 10. A classification accuracy of 98.72% is achieved, which outperforms all the scenarios. The sensitivity and specificity are recorded as 98.80% and 96.64%. Other parameters, including precision and MCC, are 98.65% and 97.44%, respectively. The lowest false positive rate (FPR) is 0.0136, which may be considered negligible.
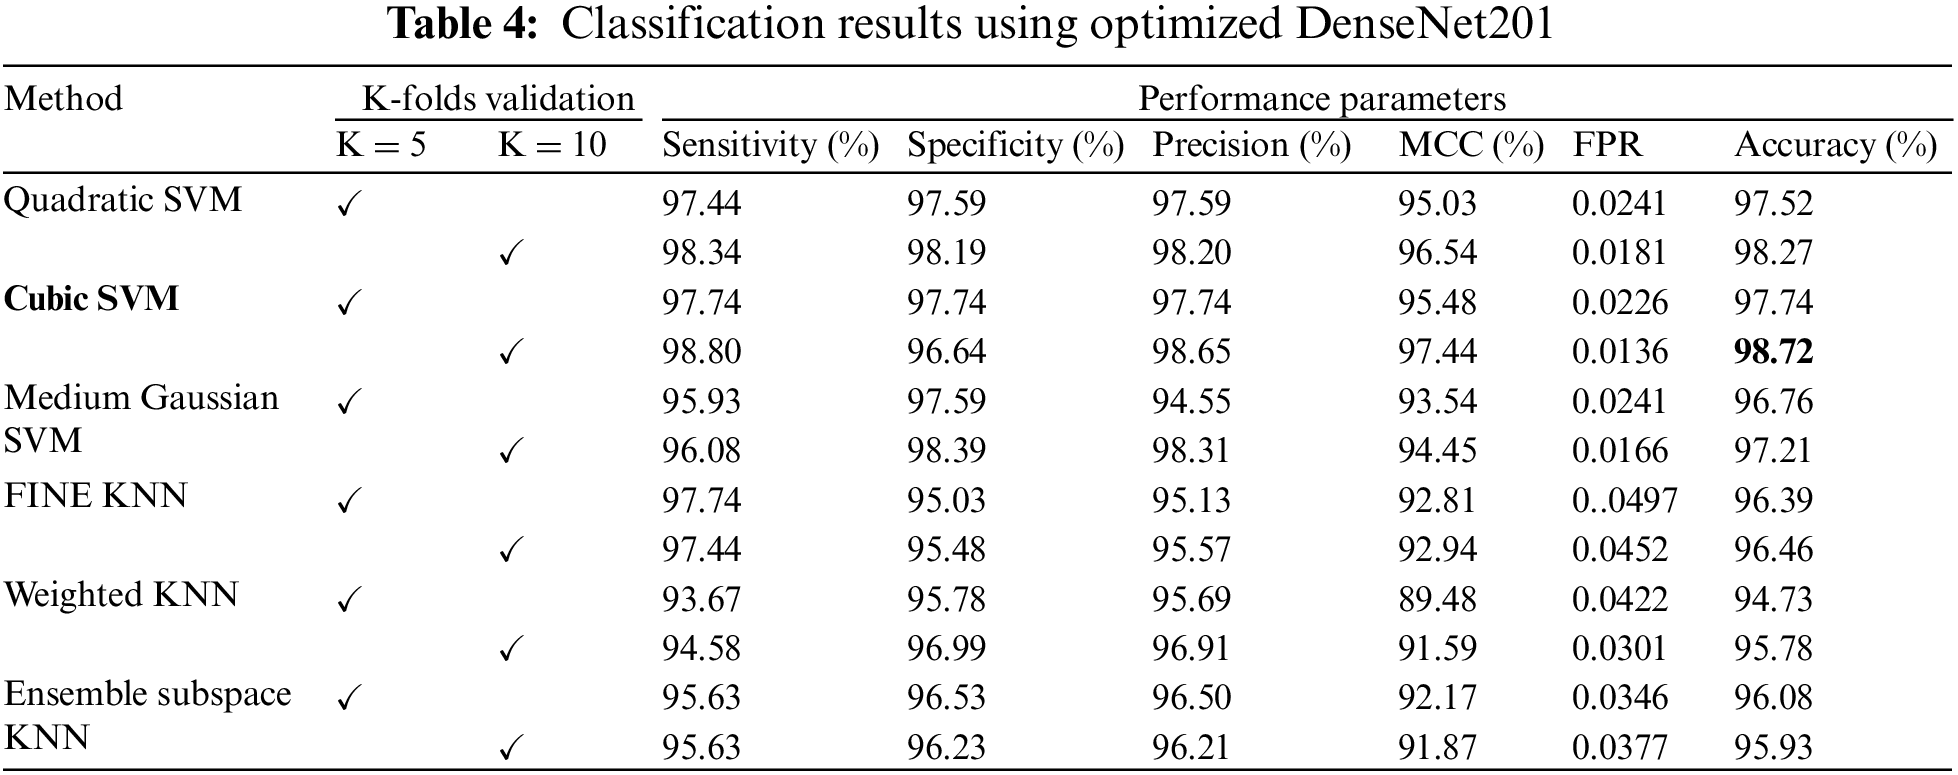
Fig. 5 shows the confusion matrix of Cubic SVM using the optimized DenseNet201 features. Fig. 5a shows the confusion matrix on K = 5 folds and depicts that both classes are accurately classified with 98% accuracy. Fig. 5b shows the confusion matrix of the Cubic SVM on 10-fold cross-validation. The figure depicts that COVID and Non-COVID classes are only 1% misclassified and have attained an accuracy of 99% in both classes.
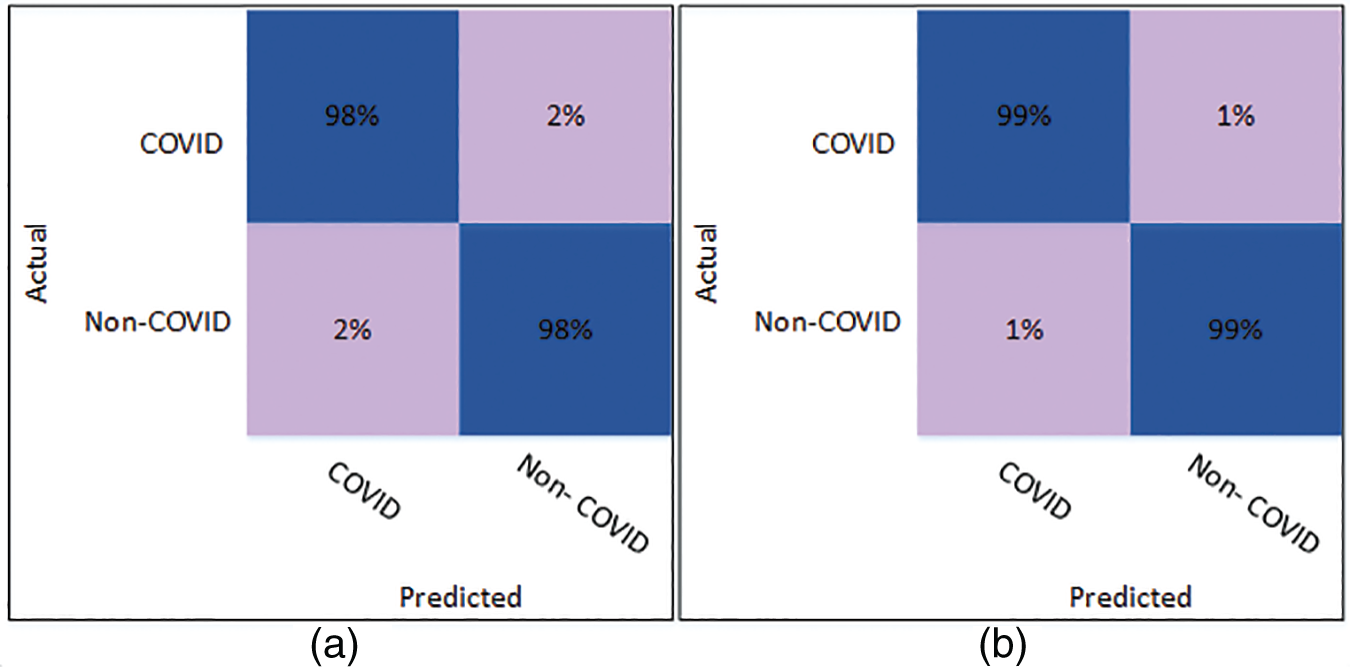
Figure 5: Confusion matrix of Cubic SVM using optimized DenseNet201 (a) represents K = 5 folds. (b) Represents K = 10 folds
The results of classification using optimized SqueezeNet features are presented in Table 5. A thorough comparison is presented among the different classifiers in the table. The table shows that Cubic SVM attained the best classification accuracy. For K = 5, the Cubic SVM classifier achieved an accuracy of 96.16%. The sensitivity is 96.23%, and the specificity is 96.08%. The precision achieved by the Cubic SVM is 96.09%, while MCC is recorded as 92.32%. Fig. 6 represents the confusion matrix of Cubic SVM on K = 5 folds, which supports the findings presented in Table 5. The best performance on K = 10 folds is also attained by the Cubic SVM, where the classifier obtains an accuracy of 95.78%. Other parameters also performed well; sensitivity is 95.51% and specificity is recorded as 96.06%. The precision for Cubic SVM on 10-fold is recorded as 96.08%.
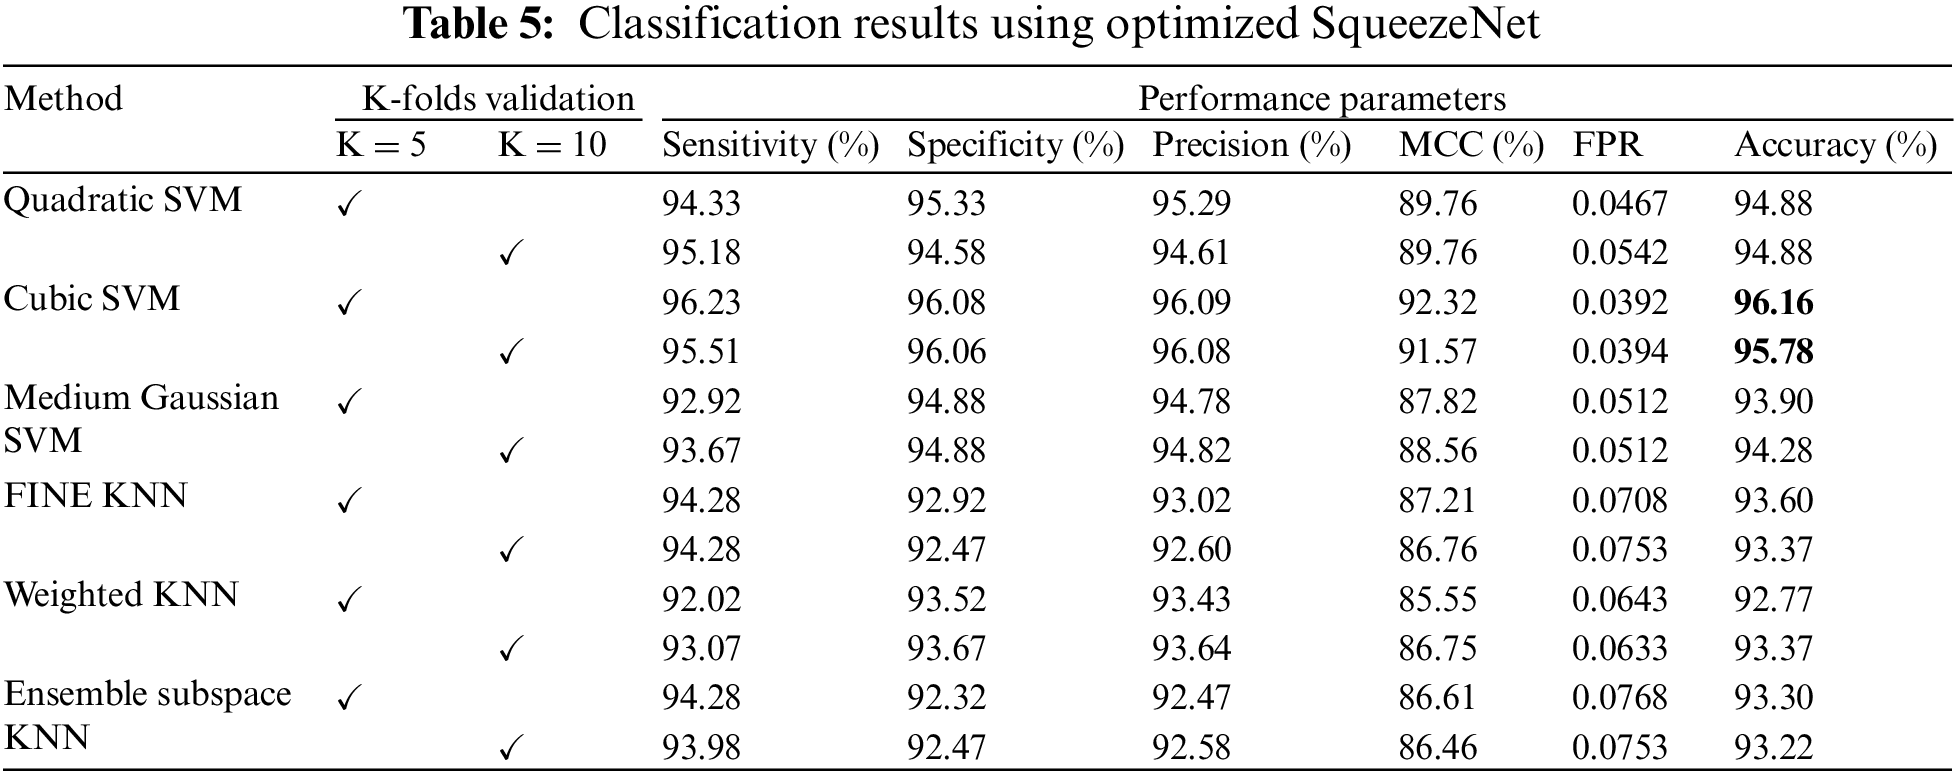
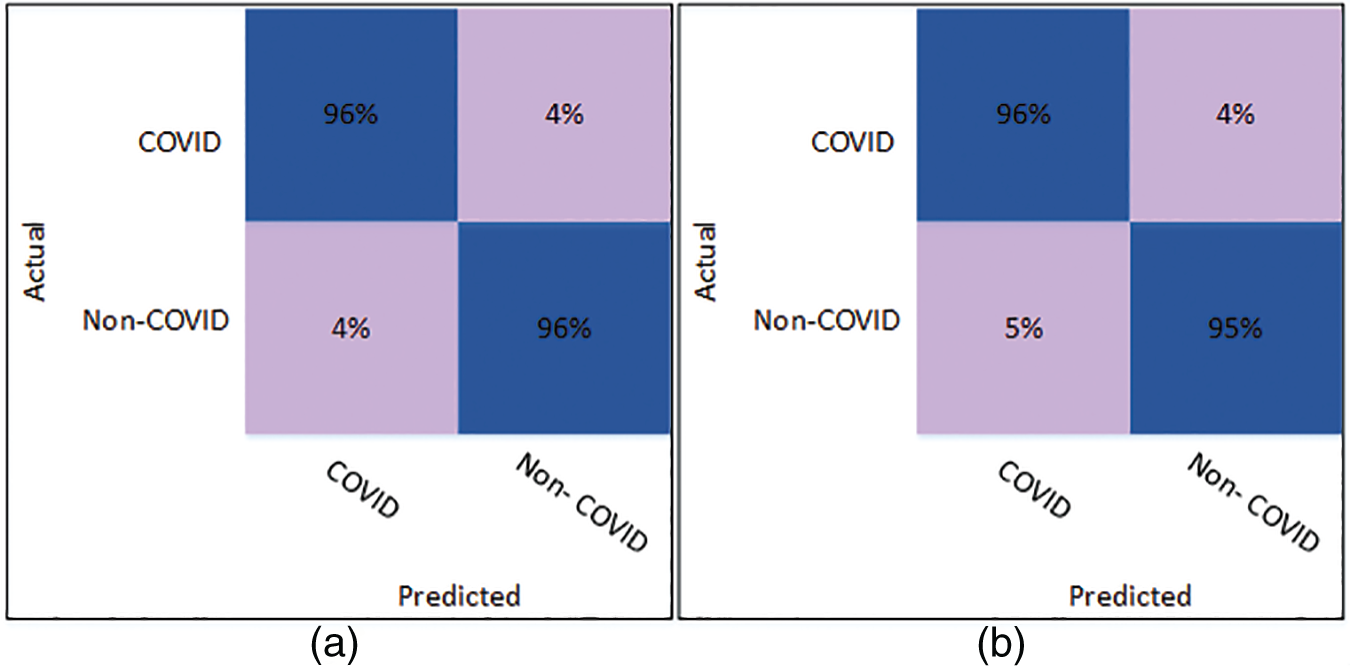
Figure 6: Confusion matrix of Cubic SVM using optimized SqueezeNet (a) represents K = 5 folds. (b) Represents K = 10 folds
Fig. 6 shows the confusion matrix of the Cubic SVM. When validated on 5-fold cross-validation, the confusion matrix for Cubic SVM is shown in Fig. 6a. The confusion matrix shows 96% accuracy for both classes. Fig. 6b shows the confusion matrix of the Cubic SVM classifier when validated on 10-fold cross-validation. It shows that the COVID class is classified with 96% accuracy, while the Non-COVID class is classified with 95% accuracy.
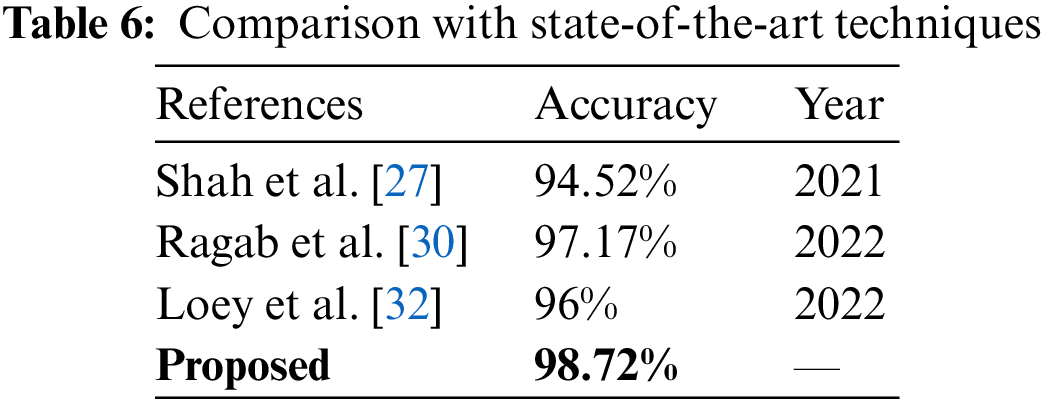
Fig. 7 illustrates the comparison between different strategies of the proposed work. Cubic SVM has achieved the highest accuracy in all four scenarios; thus, a detailed comparison of the SVM classifier is shown in Fig. 7. The proposed technique is also compared with the state-of-the-art methods present in the literature. The proposed technique shows its dominance over other methods in terms of accuracy for the COVID-19 classification. A comparison with other techniques is presented in Table 6.
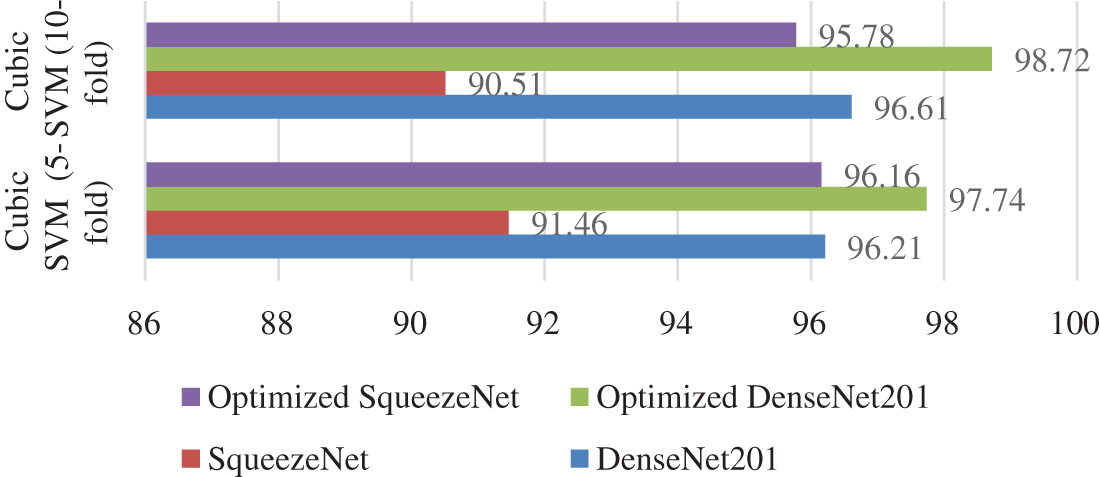
Figure 7: Accuracy comparison of the proposed scenarios
A new approach is presented in this paper for classifying COVID infections based on deep learning models. The presented technique used deep learning features that were optimized using the ACO optimization strategy. Extensive testing demonstrates that the optimized features significantly improve the model’s ability to classify COVID infections. Experimentation is done using a K-fold cross-validation strategy. Experimentation is done using a K-fold cross-validation strategy. The experimental results demonstrate that employing 10-fold cross-validation results in higher classification accuracy than using 5-fold cross-validation. Furthermore, the proposed work demonstrates the superiority of the DenseNet201 model in feature extraction, as DenseNet201 outperformed SqueezeNet in all scenarios tested.
The research can be further extended by performing classification on a large dataset with multiple infection classes. In addition, other heuristic optimization techniques can be used for the optimization of extracted deep learning features. The presented research can be applied to diagnose other diseases, such as tumors and cancers.
Acknowledgement: This research work was funded by Institutional Fund Projects under grant no. (IFPIP: 1614-611-1442). Therefore, authors gratefully acknowledge technical and financial support from the Ministry of Education and King Abdulaziz University, DSR, Jeddah, Saudi Arabia.
Funding Statement: The researchers would like to thank the Deanship of Scientific Research, Qassim University for funding the publication of this project.
Conflicts of Interest: The authors declare that they have no conflicts of interest to report regarding the present study.
References
1. C. Wang, P. W. Horby, F. G. Hayden and G. F. Gao, “A novel coronavirus outbreak of global health concern,” The Lancet, vol. 395, no. 10223, pp. 470–473, 2020. [Google Scholar]
2. S. B. Stoecklin, P. Rolland, Y. Silue, A. Mailles, C. Campese et al., “First cases of coronavirus disease 2019 (COVID-19) in France: Surveillance, investigations and control measures,” Eurosurveillance, vol. 25, no. 6, pp. 2000094–2000101, 2020. [Google Scholar]
3. Coronaviridae study group of the international committee on taxonomy of viruses, “The species severe acute respiratory syndrome-related coronavirus: classifying 2019-nCoV and naming it SARS-CoV-2,” Nature Microbiology, vol. 5, no. 4, pp. 536–544, 2020. [Google Scholar]
4. A. Girdhar, H. Kapur, V. Kumar, M. Kaur, D. Singh et al., “Effect of COVID-19 outbreak on urban health and environment,” Air Quality, Atmosphere & Health, vol. 14, pp. 389–397, 2021. [Google Scholar]
5. S. D. Khan, L. Alarabi and S. Basalamah, “Toward smart lockdown: A novel approach for COVID-19 hotspots prediction using a deep hybrid neural network,” Computers, vol. 9, no. 4, pp. 99, 2020. [Google Scholar]
6. D. Cucinotta and M. Vanelli, “WHO declares COVID-19 a pandemic,” Acta Bio Medica: Atenei Parmensis, vol. 91, no. 1, pp. 157, 2020. [Google Scholar] [PubMed]
7. O. Hayakijkosol, W. Jaroenram, L. Owens and J. Elliman, “Reverse transcription polymerase chain reaction (RT-PCR) detection for Australian Cherax reovirus from redclaw crayfish (Cherax quadricarinatus),” Aquaculture, vol. 530, no. 3, pp. 735881, 2021. [Google Scholar]
8. S. H. Wang, D. R. Nayak, D. S. Guttery, X. Zhang and Y. D. Zhang, “COVID-19 classification by CCSHNet with deep fusion using transfer learning and discriminant correlation analysis,” Information Fusion, vol. 68, no. 2, pp. 131–148, 2021. [Google Scholar] [PubMed]
9. T. Akram, M. Attique, S. Gul, A. Shahzad, M. Altaf et al., “A novel framework for rapid diagnosis of COVID-19 on computed tomography scans,” Pattern Analysis and Applications, vol. 24, no. 3, pp. 951–964, 2021. [Google Scholar] [PubMed]
10. A. Majid, M. A. Khan, Y. Nam, U. Tariq, S. Roy et al., “COVID19 classification using CT images via ensembles of deep learning models,” Computers, Materials and Continua, vol. 69, no. 1, pp. 319–337, 2021. [Google Scholar]
11. M. Hammad, A. M. Iliyasu, A. Subasi, E. S. Ho and A. A. Abd El-Latif, “A multitier deep learning model for arrhythmia detection,” IEEE Transactions on Instrumentation and Measurement, vol. 70, pp. 1–9, 2020. [Google Scholar]
12. M. Al-Faris, J. Chiverton, D. Ndzi and A. I. Ahmed, “A review on computer vision-based methods for human action recognition,” Journal of Imaging, vol. 6, no. 6, pp. 46, 2020. [Google Scholar] [PubMed]
13. M. A. Khan, M. A. Khan, F. Ahmed, M. Mittal, L. M. Goyal et al., “Gastrointestinal diseases segmentation and classification based on duo-deep architectures,” Pattern Recognition Letters, vol. 131, pp. 193–204, 2020. [Google Scholar]
14. M. Z. U. Rehman, F. Ahmed, M. A. Khan, U. Tariq, S. S. Jamal et al., “Classification of citrus plant diseases using deep transfer learning,” Computers, Materials & Continua, vol. 70, no. 1, pp. 1401–1417, 2022. [Google Scholar]
15. J. Ni, Y. Chen, Y. Chen, J. Zhu, D. Ali et al., “A survey on theories and applications for self-driving cars based on deep learning methods,” Applied Sciences, vol. 10, no. 8, pp. 2749, 2020. [Google Scholar]
16. H. A. Pierson and M. S. Gashler, “Deep learning in robotics: A review of recent research,” Advanced Robotics, vol. 31, no. 16, pp. 821–835, 2017. [Google Scholar]
17. D. Chen, S. Liu, P. Kingsbury, S. Sohn, C. B. Storlie et al., “Deep learning and alternative learning strategies for retrospective real-world clinical data,” NPJ Digital Medicine, vol. 2, no. 1, pp. 1–5, 2019. [Google Scholar]
18. A. U. Ibrahim, M. Ozsoz, S. Serte, F. Al-Turjman and P. S. Yakoi, “Pneumonia classification using deep learning from chest X-ray images during COVID-19,” Cognitive Computation, vol. 6, no. 3, pp. 1–13, 2021. [Google Scholar]
19. C. Srinivas, K. S. N. Prasad, M. Zakariah, Y. A. Alothaibi, K. Shaukat et al., “Deep transfer learning approaches in performance analysis of brain tumor classification using MRI images,” Journal of Healthcare Engineering, vol. 2022, no. 2, pp. 1–17, 2022. [Google Scholar]
20. M. Arshad, M. A. Khan, U. Tariq, A. Armghan, F. Alenezi et al., “A computer-aided diagnosis system using deep learning for multiclass skin lesion classification,” Computational Intelligence and Neuroscience, vol. 2021, no. 3, pp. 1–15, 2021. [Google Scholar]
21. T. M. Alam, K. Shaukat, W. A. Khan, I. A. Hameed, L. A. Almuqren et al., “An efficient deep learning-based skin cancer classifier for an imbalanced dataset,” Diagnostics, vol. 12, no. 9, pp. 2115, 2022. [Google Scholar] [PubMed]
22. S. Kido, Y. Hirano and N. Hashimoto, “Detection and classification of lung abnormalities by use of convolutional neural network (CNN) and regions with CNN features (R-CNN),” in Proc. IWAIT, Chiang Mai, Thailand, IEEE, pp. 1–4, 2018. [Google Scholar]
23. L. Devnath, S. Luo, P. Summons, D. Wang, K. Shaukat et al., “Deep ensemble learning for the automatic detection of pneumoconiosis in coal worker’s chest x-ray radiography,” Journal of Clinical Medicine, vol. 11, no. 18, pp. 5342, 2022. [Google Scholar] [PubMed]
24. A. Amyar, R. Modzelewski, H. Li and S. Ruan, “Multi-task deep learning based CT imaging analysis for COVID-19 pneumonia: Classification and segmentation,” Computers in Biology and Medicine, vol. 126, no. 8, pp. 104037, 2020. [Google Scholar] [PubMed]
25. K. Shankar and E. Perumal, “A novel hand-crafted with deep learning features based fusion model for COVID-19 diagnosis and classification using chest X-ray images,” Complex & Intelligent Systems, vol. 7, no. 3, pp. 1277–1293, 2021. [Google Scholar]
26. A. M. Ismael and A. K. Şengür, “Deep learning approaches for COVID-19 detection based on chest X-ray images,” Expert Systems with Applications, vol. 164, no. 4, pp. 114054, 2021. [Google Scholar] [PubMed]
27. V. Shah, R. Keniya, A. Shridharani, M. Punjabi, J. Shah et al., “Diagnosis of COVID-19 using CT scan images and deep learning techniques,” Emergency Radiology, vol. 28, no. 3, pp. 497–505, 2021. [Google Scholar] [PubMed]
28. H. Alshazly, C. Linse, E. Barth and T. Martinetz, “Explainable covid-19 detection using chest CT scans and deep learning,” Sensors, vol. 21, no. 2, pp. 455, 2021. [Google Scholar] [PubMed]
29. M. A. Hasan, M. M. Al-Jawad, H. A. Jalab, H. Shaiba, R. W. Ibrahim et al., “Classification of Covid-19 coronavirus, pneumonia and healthy lungs in CT scans using Q-deformed entropy and deep learning features,” Entropy, vol. 22, no. 5, pp. 517, 2020. [Google Scholar] [PubMed]
30. M. Ragab, K. Eljaaly, N. A. Alhakamy, H. A. Alhadrami, A. A. Bahaddad et al., “Deep ensemble model for COVID-19 diagnosis and classification using chest CT images,” Biology, vol. 11, no. 1, pp. 43, 2022. [Google Scholar]
31. C. Zheng, X. Deng, Q. Fu, Q. Zhou, J. Feng et al., “Deep learning-based detection for COVID-19 from chest CT using weak label,” MedRxiv, 2020. [Google Scholar]
32. M. Loey, S. El-Sappagh and S. Mirjalili, “Bayesian-based optimized deep learning model to detect COVID-19 patients using chest X-ray image data,” Computers in Biology and Medicine, vol. 142, pp. 105213, 2022. [Google Scholar] [PubMed]
33. X. Xu, X. Jiang, C. Ma, P. Du, X. Li et al., “A deep learning system to screen novel coronavirus disease 2019 pneumonia,” Engineering, vol. 6, no. 10, pp. 1122–1129, 2020. [Google Scholar] [PubMed]
34. L. O. Hall, R. Paul, D. B. Goldgof and G. M. Goldgof, “Finding COVID-19 from chest x-rays using deep learning on a small dataset,” arXiv preprint arXiv:2004.02060, 2020. [Google Scholar]
35. M. Mahin, S. Tonmoy, R. Islam, T. Tazin, M. M. Khan et al., “Classification of COVID-19 and pneumonia using deep transfer learning,” Journal of Healthcare Engineering, vol. 2021, no. 4, pp. 1–11, 2021. [Google Scholar]
36. S. Tammina, “Covidsort: Detection of novel covid-19 in chest x-ray images by leveraging deep transfer learning models,” in Proc. ICDSMLA, Singapore, Springer, pp. 431–447, 2022. [Google Scholar]
37. A. Reddy, K. N. Rao, N. R. Soora, K. Shailaja, N. C. Kumar et al., “Multi-modal fusion of deep transfer learning based COVID-19 diagnosis and classification using chest X-ray images,” Multimedia Tools and Applications, vol. 7, no. 4, pp. 1–25, 2022. [Google Scholar]
38. E. Soares, P. Angelov, S. Biaso, M. H. Froes and D. K. Abe, “SARS-CoV-2 CT-scan dataset: A large dataset of real patients CT scans for SARS-CoV-2 identification,” MedRxiv, 2020. [Online]. Available: https://www.kaggle.com/plameneduardo/sarscov2-ctscan-dataset [Google Scholar]
39. J. Deng, W. Dong, R. Socher, L. Li, K. Li et al., “Imagenet: A large-scale hierarchical image database,” in Proc. CVPR, Miami, FL, USA, IEEE, pp. 248–255, 2009. [Google Scholar]
40. Z. U. Rehman, M. A. Khan, F. Ahmed, R. Damaševičius, S. R. Naqvi et al., “Recognizing apple leaf diseases using a novel parallel real-time processing framework based on MASK RCNN and transfer learning: An application for smart agriculture,” IET Image Processing, vol. 15, no. 10, pp. 2157–2168, 2021. [Google Scholar]
41. F. N. Iandola, S. Han, M. W. Moskewicz, K. Ashraf, W. J. Dally et al., “SqueezeNet: AlexNet-level accuracy with 50× fewer parameters and <0.5 MB model size,” arXiv preprint arXiv, 2016. [Google Scholar]
42. G. Huang, Z. Liu, L. V. D. Maaten and K. Q. Weinberger, “Densely connected convolutional networks,” in Proc. CVPR, Honolulu, HI, USA, IEEE, pp. 4700–4708, 2009. [Google Scholar]
43. M. Dorigo, M. Birattari and T. Stutzle, “Ant colony optimization,” IEEE Computational Intelligence Magazine, vol. 1, no. 4, pp. 28–39, 2006. [Google Scholar]
44. K. Shaukat, S. Luo, S. Chen and D. Liu, “Cyber threat detection using machine learning techniques: A performance evaluation perspective,” in Proc. (ICCWS), Islamabad, Pakistan, IEEE, pp. 1–6, 2020. [Google Scholar]
Cite This Article
 Copyright © 2023 The Author(s). Published by Tech Science Press.
This work is licensed under a Creative Commons Attribution 4.0 International License , which permits unrestricted use, distribution, and reproduction in any medium, provided the original work is properly cited.
 Downloads
 Citation Tools