
 Submit a Paper
 Propose a Special lssue
 Open Access
ARTICLE

Robust Counting in Overcrowded Scenes Using Batch-Free Normalized Deep ConvNet
1 Institute of Computer Sciences and Information Technology (ICS/IT), The University of Agriculture, Peshawar, 25130, Khyber Pakhtunkhwa, Pakistan
2 Department of Convergence Engineering for Intelligent Drone, Sejong University, Seoul, 05006, Korea
3 Collaborative Robotics and Intelligent Systems (CoRIS) Institute, Oregon State University, OR, USA
4 Department of Software, Sejong University, Seoul, 05006, Korea
* Corresponding Authors: Amin Ullah. Email: ; Mi Young Lee. Email:
Computer Systems Science and Engineering 2023, 46(3), 2741-2754. https://doi.org/10.32604/csse.2023.037706
Received 14 November 2022; Accepted 09 February 2023; Issue published 03 April 2023
 View Full Text
 Download PDF
Abstract
The analysis of overcrowded areas is essential for flow monitoring, assembly control, and security. Crowd counting’s primary goal is to calculate the population in a given region, which requires real-time analysis of congested scenes for prompt reactionary actions. The crowd is always unexpected, and the benchmarked available datasets have a lot of variation, which limits the trained models’ performance on unseen test data. In this paper, we proposed an end-to-end deep neural network that takes an input image and generates a density map of a crowd scene. The proposed model consists of encoder and decoder networks comprising batch-free normalization layers known as evolving normalization (EvoNorm). This allows our network to be generalized for unseen data because EvoNorm is not using statistics from the training samples. The decoder network uses dilated 2D convolutional layers to provide large receptive fields and fewer parameters, which enables real-time processing and solves the density drift problem due to its large receptive field. Five benchmark datasets are used in this study to assess the proposed model, resulting in the conclusion that it outperforms conventional models.Keywords
In computer vision problems, crowd counting is a crucial task that automatically approximates people in unconstrained scenes. One of the main issues in visual scene analytics is extracting patterns [1] from several objects [2] present in a single scene, particularly humans. As the number of targeted objects increases, the difficulty and complexity grow, which remains a research gap. Several deep neural network models are recently developed to offer promising solutions for crowd movement monitoring and various security features. Due to its application in crowd management through video surveillance, transportation management, and public welfare, crowd counting, and localization are receiving more and more attention in the research community. In recent years, computer vision has drawn significant attention to counting and tracking crowds on drones and estimating the automatic density map [3]. Crowd analysis and management can be powerful tools for avoiding panic and saving lives. Thus, to prevent any disaster, crowd analysis is of the greatest significance for early crowd forecast and choosing the appropriate crowd control and management measures [4]. Many researchers have encouraged various applications and efficient methods for crowd counting, including tracking, segmentation, scene understanding, and behavior analysis.
Early research methods addressed crowd counting as a pedestrian detection problem and used counting the number of pedestrian detection boxes in each scene to determine the number of people [5]. Some researchers used HAAR wavelets and histograms of oriented gradients (HoG) methods to obtain the feature from pedestrians. Still, these methods were not promising in the overcrowded scene because many people are congested. Consequently, their spotting is impossible with conventional detection methods. Researchers have also developed different methods which manually extract features and use a regressor to improve accuracy and quickly generate the total sum of the individuals. Despite this, such methods do not consider a person’s location. Furthermore, in most scenarios, the extraction capability of handcrafted features is inadequate due to inconsistencies in environmental changes. The generalization ability of these methods is inadequate because different scenarios’ handcrafted features need to be physically devised.
Analyzing crowds and surveilling them present significant problems and present a variety of obstacles, such as people distribution, background noise, occlusion, and variations in lighting scale. The crowd analysis method scene ranges from predicting the individuals in the total number of a scene to density map estimating, which expresses the attributes of crowd distribution. In extremely congested crowds, the detection-based method’s performance is not enough to overwhelm this concern; several studies in the literature used regression methods to solve this problem [6]. The regression-based techniques are good but do not consider the essential features known as saliency. Along with the assistance of the saliency features, the local region can produce good results due to ignoring the saliency feature. The outcomes of the regression-based method are not realistic. Researchers have applied linear mapping methods to address this problem, which includes saliency information in statistics related to local region features and density distribution maps [7,8]. For varied scenes the traditional techniques are very limited in producing high-quality and precise allocation maps to tackle this problem. Deep neural networks (DNNs) show significant growth in segmentation problems [7] and can also be used to correct outstanding density distribution maps. In different scenarios, people’s scale deviation is still far from being completely resolved [9]. To mitigate this problem, a few researchers from the vision community utilized multi-column CNN with different receptive fields to extract multiple features, as well as some situations that need to be manually designed, producing the problem of low accuracy and manual feature extraction by using the traditional density estimation method. In contrast, some researchers used a CNN-based density map, the powerful feature extraction function of CNNs for crowd counting. However, these models are of very large size with high computational complexity and are limited to being implemented in real-time surveillance scenarios.
To address the issues in the current crowd-counting literature, we proposed our framework with the following key contributions:
• The fine-tuning of the pre-trained model has been proven to be very effective for visual feature extraction. However, most ImageNet pre-trained models depend on the Batch Normalization layer (BN). The BN layer requires a large batch size and trained time statistics, including mean and variance. These statistics perform very poorly on out-of-distribution samples, and in crowd senses, the new data is always different from the one that appeared at the train time. Therefore, we utilized the pre-trained ResNet34 as the backbone model but modified the BN with evolving normalization-activation layers.
• The evolving normalization-activation (EvoNorm) layers are batch-independent. The model can be trained even with a single sample batch size, achieving BN-level accuracy and better generalization for test samples.
• In visual feature extraction, convolution is one of the expensive operations, due to which many crucial real-time applications have a time delay in analysis and decision-making. In the paper, we employed dilated convolutional neural network (CNN) as a decoder model to generate density maps. The dilated CNN covers a large receptive field in the feature maps, resulting in fast processing for feature extraction.
The remainder of this paper is organized as follows: A summary of the crowd analysis literature is given in section two, and our system’s technical specifications are covered in section three. The experimental findings, as well as objective and subjective assessments, are presented in Section four. The work is summarized in section five, along with some recommendations for further research.
In this section, we discussed how other researchers addressed the crowd-counting problem, their contributions, and limitations. Furthermore, we also discussed what type of pattern extraction strategy they have used for visual feature extraction. For instance, Wang et al. [10] proposed a real-time multiple pedestrian tracker for movies captured from both stationary and moving cameras in an area with no restrictions. In a similar method, Shi et al. [11] created a CNN-based model capable of analyzing congested scenarios in real-time. Furthermore, Ari et al. [12] analyzed inter-effects for an intelligent camera connection in the middle of computation and communication power. The study by Migniot et al. [13] discussed the problem of estimating a purchasing action using human movement data in three dimensions. At the same time, Poiesi et al. developed a static and dynamic rendezvous technique for predicting areas. Using motion intelligence features such as particle energy and motion direction, Nam et al. [14] developed a real-time approach for identifying irregular practices. In another method, Migniot et al. [13] incorporated several depth cameras as part of an automated real-time lighting control framework. Zhou et al. used density map regression and head segmentation to develop a cascading depth-aware counting network based on RGBD crowd-counting methods. Idrees et al. [15] suggested a model for computing and estimating the visible people present in a highly-dense crowd in a single image using SWIFT and Markov random fields, and they utilized global consistency constraints on counts. In another method, Zhang et al. [16] implemented a multi-column convolutional neural network to predict an image’s density map by utilizing different sizes of filters where they discovered features by each column CNN. Babu Sam et al. [17] proposed a model for crowd counting novel to handle the variation of crowd density. Li et al. [18] constructed an architecture for CSRSNET for congested scene recognition that presents accurate count estimation and learns highly congested scenes apart from these extant high-quality density maps. According to Cao et al. [19], a new encoder-decoder network is proposed by abstracting the multi-scale features and decoding them with high-resolution maps using transposed convolutions. Nam et al. [14] suggested a crowded real-time scene analysis method to detect abnormal situations based on the crowd motion characteristics and the motion directions. Using correlation information along with samples for crowd counting, Wan et al. [20] proposed a framework for improving density maps for crowd counting by using correlation information. Lempitsky et al. [21] implemented a model for visual object tasks to count the number of humans in surveillance video frames and develop a new loss function that is best suited for supervised learning.
In another line of methods, Sun et al. [22] used novel techniques, including contextual information and scale-invariance. In order to make the method of head detection scale-invariant, and then suggest modifications to the scale and context of the head. Li et al. [18] used a CNN for the front end and a dilated convolutional neural network for the back end to improve the quality of contextual information. In Kumagai et al. [23], multiple CNNs (MO CNNs) are used to predict the average count for all final outputs using the gating CNN and the expert CNNs. Song et al. [24] proposed a deep recognition CNN for depth image counting in a crowded environment based on FASTER R-CNN. Sun et al. [22] presented a CNN based on density for counting people in images using two-branch CNNs. Zhao et al. [25] used an active learning module with limited supervision for precise crowd calculation. Liu et al. [26] proposed a self-training system to generate the most consistent and robust generic feature extractor for crowd-counting tasks. Sindagi et al. [27] proposed an iterative learning model based on Gaussian process used for reducing the observation effort by realizing the total count of the crowd with limited data.
The primary mechanics of the proposed method are thoroughly explored in this section. The proposed approach is broken down into four major components, with details in Fig. 1. Firstly, raw image data is preprocessed to create the ground truth labels for training and applying data augmentation. Secondly, the images are passed to an encoder network for feature representations. Next, the latent representations of the feature encoder are passed to the decoder to generate density maps. As a final step, the total number of cells obtained in the generated density distribution maps for the input images are used to count the crowds. Each step is discussed in a separate section below.
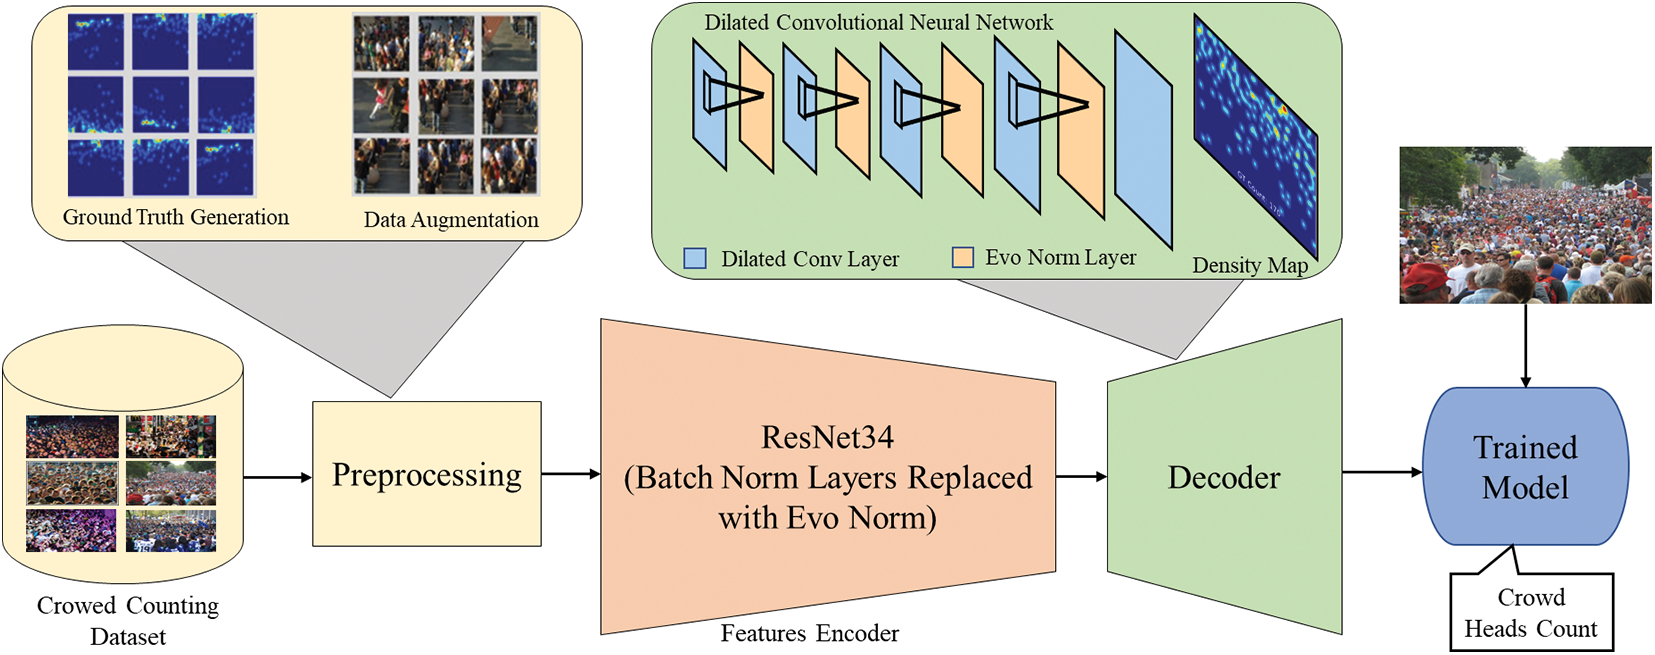
Figure 1: The proposed end-to-end crowd-counting framework
Discriminative feature encoding is a very crucial step for crowd pattern analysis. This paper employs the Residual Convolutional Neural Network (ResNet) [28] for feature encoding. ResNet outperforms shallow CNNs because it addresses the vanishing gradient and exploding gradient problems in feature learning. With ResNet, we can construct deeper networks to achieve better feature representation of thousands of trainable layers as long as we have computational power. In shallow deep networks with high numbers of trainable convolutional and fully connected layers, the gradients of the parameters with respect to loss become very low, resulting in the vanishing gradient issue and the neural network optimizer stuck in some local minima. The ResNet addressed this issue by introducing skip connections inside the convolutional layers, also known as “identity shortcut connections”. The shortcut layers are concatenated with the later layers in the network to boost the feature from the activations of the previous layer. The purpose of shortcut connection is to train the network with smoother gradient flow and ensure that the discriminative features reach the final layers. ResNet has many variants known by the number of layers in the network. In the paper, we employed ResNet-34 for feature encoding, which perfectly matches the processing of crowd counting in real-time with sufficient accuracy. This network has 33 convolutional layers and one linear layer. The final Conv layer’s encodings are the latent features passed to the decoder network for density map generation. We do not utilize the pre-trained weights of the ImageNet dataset because we have changed the ResNet batch norm layers to the evolving normalization layers. If we freeze the batch norm layers weights, the fine-tune the network, it has the same results as random initialization. This is because the pre-trained weight depends on batch statistics of the training data. Therefore, to address the issue of batch statistics for crowd counting, we utilized EvoNorm, which is batch independent and results in robust density maps generation in complex scenarios.
Deep networks’ core elements, normalization layers, and activation functions are frequently found together. The state-of-the-art (SOTA) normalization layers, such as Batch Norm, Group Norm, Layer Norm, and Instance Norm, either suffer from train time statistic issues or are ineffective for convolutional neural networks. For instance, in the batch norm, we have to collect the mean and variance of the features for any particular layer where we are applying the normalization layer. These statistics are purely related to training data, and at test time, we have to use the same statistics, and it is evident that the test set distribution is always different from the training set. Therefore, when we apply it during inference time, the performance is disturbing due to this issue. Notably, this procedure is ineffective for the crowed counting task because the crowed distribution is unpredictable and can be very different from the training data distribution. Therefore, this paper employs the Evolving normalization layer (EvoNorm) [29], which is free from the training time statistics issue and proved effective in various computer vision tasks. The automated approach used by the EvoNorm layer combines normalization layers and activation functions. Instead of designing them separately, EvoNorm unifies them into a normalization-activation layer. The formulation of the EvoNorm is derived using a deterministic generative algorithmic approach, where many normalization formulations and activation layer combinations are passed to the algorithm in data-driven fashion to know which formulation and activation combination works best. In this paper, we use a variant of EvoNorm, which is proven adequate for independent batch tasks. The formula for EvoNorm is given in Eq. (1).
where x represents the feature maps, σ is the sigmoid function, ϴv and γ are trainable parameters, β is the bias, s1 is the group standard deviation for data x, where w, h, c, and g are feature maps width, height, channels and number of groups. EvoNorm-S0 is asymptotically scale-invariant, and the scale-invariance property has been proven helpful in optimizing deep neural networks.
3.3 Decoder Network and Density Maps Generation
The computer vision research community has applied dilated convolutional layers to segmentation and other tasks to achieve excellent results compared to pooling layers in research regarding segmentation problems. Most commonly, maximum and average pooling is employed to diminish the overfitting problem, shape, and invariance issues, resulting in some special information being lost. A deconvolutional layer can handle the loss of special information, but it increases the complexity, thus requiring more time for execution. There can be a significant difference between the results obtained when using pooling, convolutions, and deconvolutions. The results obtained using dilated convolutional layers can be as good or even better. By using sparse kernels and expanding the receptive fields without additional parameters or computations, dilated convolutional layers extend the receptive fields.
Additionally, the receptive field can be enhanced by using extra convolutional layers, but additional operations and parameters are required to perform these operations. When (d) is the dilation rate, a simple kernel having size (m × m) can be transformed into m + (m − 1) (d − 1). As a result of the discussion above, it is evident that dilated convolution can be used to adaptably aggregate multi-scale appropriate information by preserving the same resolution. Considering a small size kernel (3 × 3), Fig. 2 shows that the dilation rate effects receptive fields differently. With dilation rate 1, the dilated convolution acquires a (3 × 3) receptive field; with dilation rate 2, it acquires a (5 × 5) receptive field; with dilation rate 3, it produces a (7 × 7) receptive field; and with dilation rate 4, it produces a (9 × 9) receptive field. Compared to convolution, pooling, and deconvolution, dilated convolutions capture more detail of the feature map and preserve the resolution more effectively. A detailed example is provided to demonstrate these advantages.
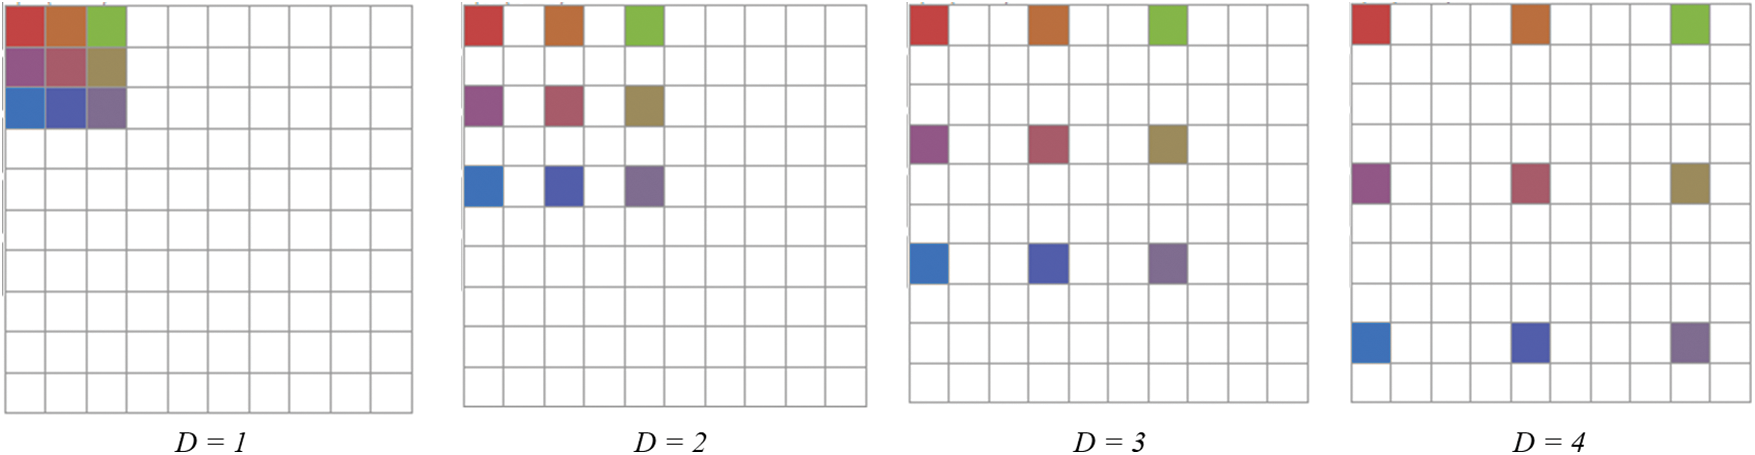
Figure 2: The impact of dilation rate (d) on the receptive field; when the dilation rate increases, the receptive field (color squares) expands completely, covering the rest of the image (white square area)
Take an input picture of a crowded scene that will be processed separately by two different approaches; however, both approaches should result in the same output image after they have been applied. The first technique performs three primary operations: downsampling, convolution, and upsampling. In order to reduce the size of the image, max pooling is applied to the initial input image while keeping the window size two so that the size of the image is half of its initial shape. After pooling is finished, a Sobel filter of the shape (3 × 3) is convolved with the processed image. An up-sampling operation is applied to the processed image after bilinear interpolation with a Sobel filter of the same shape is applied. Using the second technique, the same filter is convolved with the original input image using a dilated convolution concept, namely the Sobel of the same size (3 × 3) with a dilation rate of (d = 2). A similar shape is obtained from the resultant picture without pooling and up-sampling.
Additionally, the convolution output from a dilated convolution has a more comprehensive set of information. A dilated convolution feature map provides more detailed information than a pooled convolution or deconvolution one, according to [18]. This article illustrates that dilated convolution is a powerful tool capable of extracting deeper salient features which can be used in real-time applications due to its small number of parameters, large receptive fields, and a small number of parameters.
3.4 Training and Hyper Parameters Tuning
The proposed model is trained for 200 epochs on the train set of all datasets. Before the training, the mean and standard deviation of the train set are calculated, and all the samples are normalized using it before feeding to the network. Several data augmentation techniques, including horizontal flip, center crop, and 10-degree random rotation, are utilized to generalize the model to the unseen test data. The data augmentation is applied similarly to other image analysis problems. However, as we have labels in the form of an image (a 2D matrix of heads annotations), therefore, along with the image, we augment its label as well. For example, if we flip the image, we also flip its label. We utilized the Adam optimizer with distinct learning rates for encoder and decoder networks to enhance the model parameters. The initial learning rate for the encoder and decoder are set to 1e-2 and 1e-3, respectively, and the multi-step learning rate scheduler is used to decrease the learning rate after 83 and 125 epochs by a factor of 10. The models with low error rates and final epoch models are saved for test set evaluations.
In this section, we demonstrate the experimental assessment of the proposed network utilizing several metrics and parameters, including Mean Absolute Error (MAE), Mean Squared Error (MSE), Peak Signal to Noise Ratio (PSNR), and Structural Similarity Index Measure (SSIM). The proposed model is evaluated by comparing it to several benchmark datasets. Previous research and SOTA models were used to compare our approach performance. Python 3.7 was used to develop and evaluate the suggested framework, running on a Windows 10 computer with a Core i7-9700F processor, 64 GB of RAM, and an 8 GB Nvidia RTX 3070 Super GPU. DL model ResNet was utilized to extract features from data sets, while the EvoNorm layer used an automated method to merge normalization layers and activation functions.
For the purpose of evaluating the proposed architecture, Mean Absolute Error (MAE) and Mean Square Error (MSE) is used as performance metrics [30]. In the following equations, we express these metrics.
In Eqs. (2) and (3), the number of input photos used as testing input is presented by (M). In a test picture, the real person’s number is represented by (ViGT), while the suggested architecture’s counting predictions are represented by (Vi), which may be expressed mathematically as follows:
In Eq. (4), the density distribution map’s height and width are denoted by (H) and (B), respectively. The (gh, b) is used at position (h, b) to display the pixel value in the density distribution map that was constructed, whereas (Vi) displays the anticipated individual numbers in a test image of a packed crowd. In addition to the preprocess used in [31], two additional metrics are used to evaluate the quality of the density distribution map resulting from the preprocessing. These metrics are Peak Signal to Noise Ratio (PSNR) and Structural Similarity Index Measure (SSIM). The PSNR and SSIM are expressed in Eqs. (6) and (7), respectively.
A discussion of five challenging crowd datasets is presented in this section. In the first case, ShanghaiTech Part (A) and UCF_CC_50 display extremely clogged patterns with free-view samples, and in the second case, ShanghaiTech Part (B) and UCSD display relatively low-density patterns with surveillance views. Looking at Table 1, we can see that statistics were calculated for all datasets used for the evaluation. Table 1 shows that (Tn) represents the overall sample size, while (Mn) and (Mx) illustrates the number of individuals in an image at the minimum and maximum levels. An average value represents an average person (Av), resolution of images is shown by (R), along with an overall tally of annotated heads by (Th).
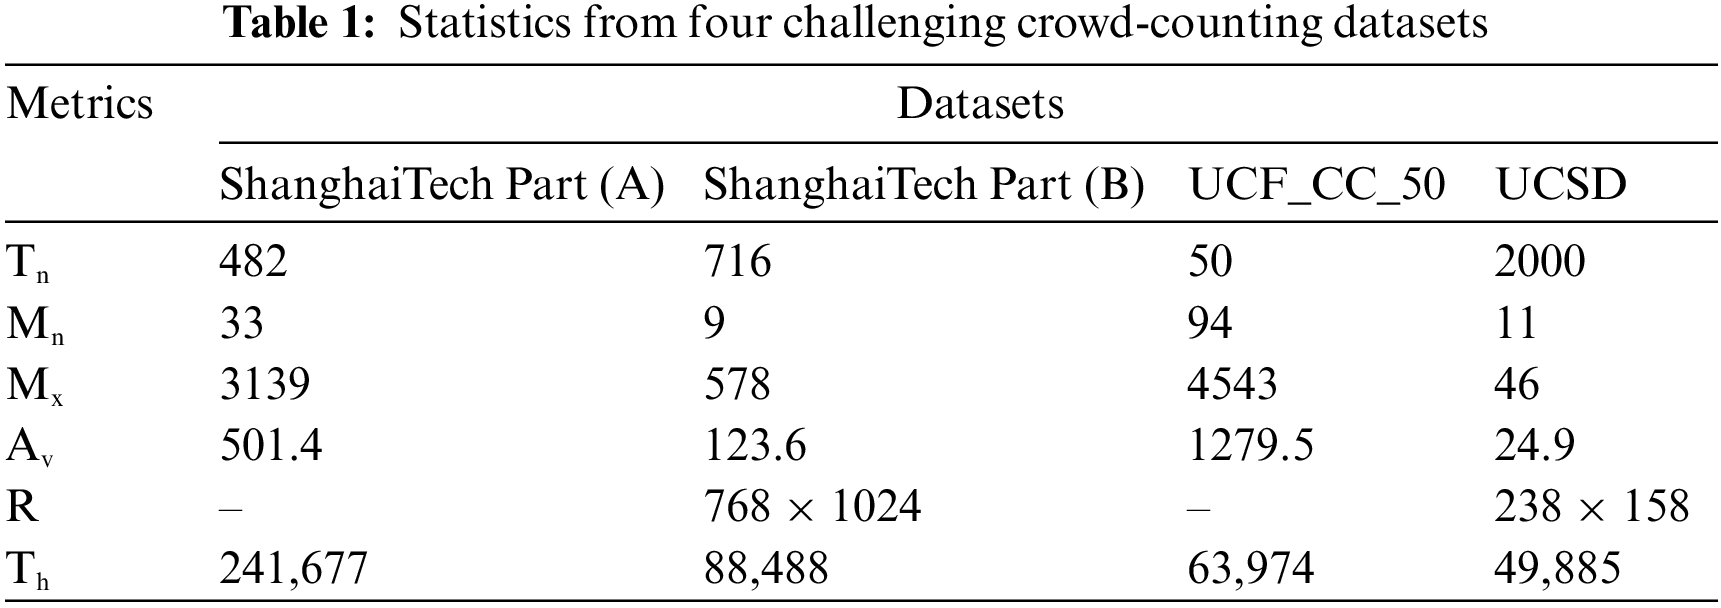
Datasets from Shanghai Tech are used to count crowds on a large scale. It includes 1198 crowd photos with annotations. The dataset contains 330,165 individuals, all of whom have had their centers of heads tagged in the crowd image. The dataset is divided into two sections: 482 samples are included in Part (A), while 716 samples are included in Part (B). With 300 and 182 samples, respectively, Part (A) is further divided into train and test sets. Part (A) features a packed scene with several possible resolutions. While Part (B) has a fixed resolution of (768–1024) and consists of a sparse crowd scene, Part(A) comprises 716 samples from a busy street in Shanghai that are divided into 400 and 316 samples for training and testing purposes, respectively.
Counting people from this dataset is extremely complex, containing 50 different samples and distinct views and resolutions. Congested crowd scenes are the most prevalent in the dataset. There is a total head count difference between all the dataset sample respondents. The minimum and maximum numbers of people in a sample are 94 and 4543, respectively. A sample of the dataset comprises an average of 1280 individuals, while the dataset is annotated with 63,974 individuals overall.
UCSD is a crowd dataset containing 2000 frames; to obtain these frames, one surveillance camera is used on the campus of UCSD. It is a meager dataset with different numbers of people in each frame ranging from 11 to 46, with 25 people on average. Each frame’s region of interest (ROI) and resolution (238–158) is constant across the board. With a tiny size frame and frequent layer pooling, accurate and effective density distribution prediction is particularly challenging. Applying bilinear interpolation to each frame's resizing procedure and increasing each frame’s resolution will help to confront this issue (900–600).
The number of images in this newly compiled large scale unconstrained crowd counting dataset (JHU-CROWD) [32] is about 2.8 more than that of the most recent crowd counting datasets. 4,250 images with 1.11 million annotations are included. The JHU-CROWD dataset is different from existing datasets in that it is gathered in a range of different scenarios and environmental conditions. The dataset is particularly difficult because it contains a number of images with weather-based degradations and light fluctuations in addition to many distractor images.
4.3 Results Discussion and Comparison with SOTA
The performance of our design is evaluated against seven other techniques in Table 3. The improved performance of the proposed network is shown in Tables 2 and 3, as well as improvements in counting people accuracy (MAE and MSE) and density map quality (SSIM and PSNR). The nearest result for MAE (68.2) was attained by [30] and for MSE (106.4) by [33], correspondingly, as shown in Table 3. The suggested design records the lowest possible values for MAE (64.21) and MSE (105.2) on ShanghaiTech Part (A). In terms of MAE, the suggested architecture outperforms the runner-up approach [30] by about (4%), while in terms of MSE, the nearest approach [30] is led by (1.2%). Based on MAE (8.27) and MSE (13.5), the proposed architecture outperforms the nearest technique by (2.33%) and (2.5%), respectively, as shown in Table 3 of ShanghaiTech Part (B). The proposed method achieves the minimum values for MAE (239.1) and MSE (357.3) compared to the nearest values for MAE (266.1) and MSE (320.9) achieved by [30,33] on the UCF_CC_50 dataset, respectively, as shown in Table 3. With respect to MAE, we were able to defeat the second-best method [30] by (27%) while with respect to MSE, we were able to beat the closest method [33] by (36.4%).
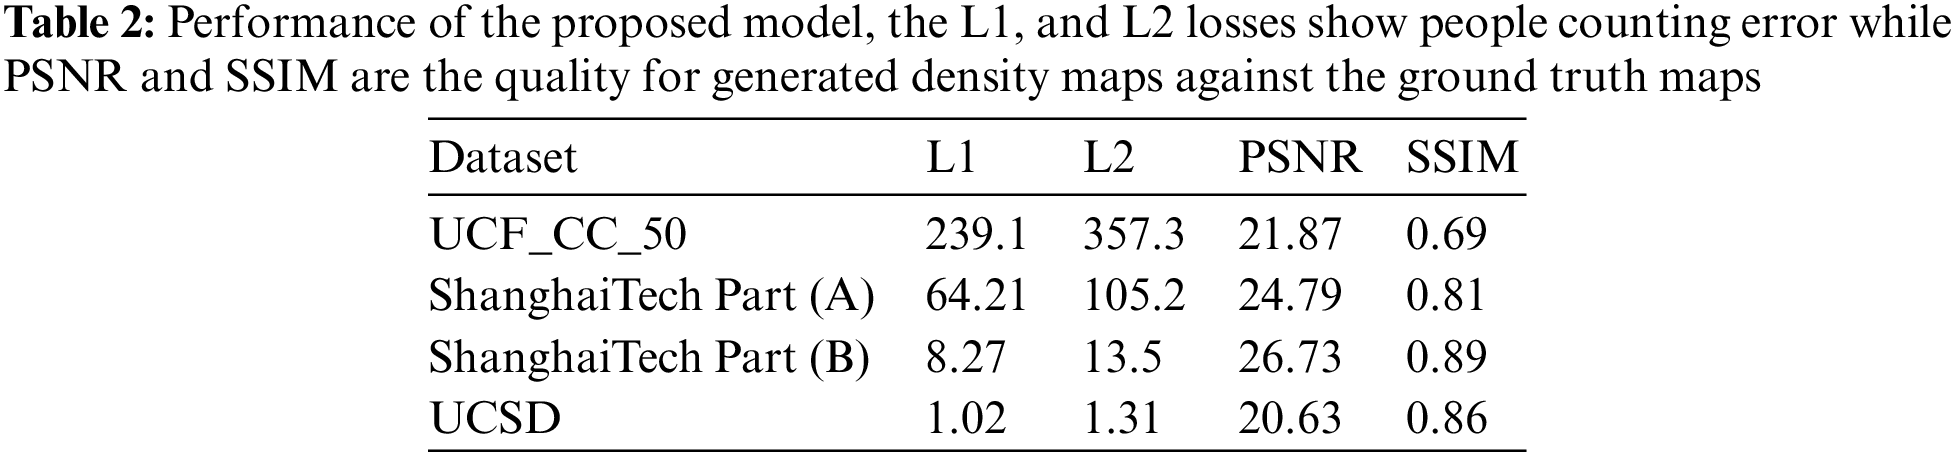
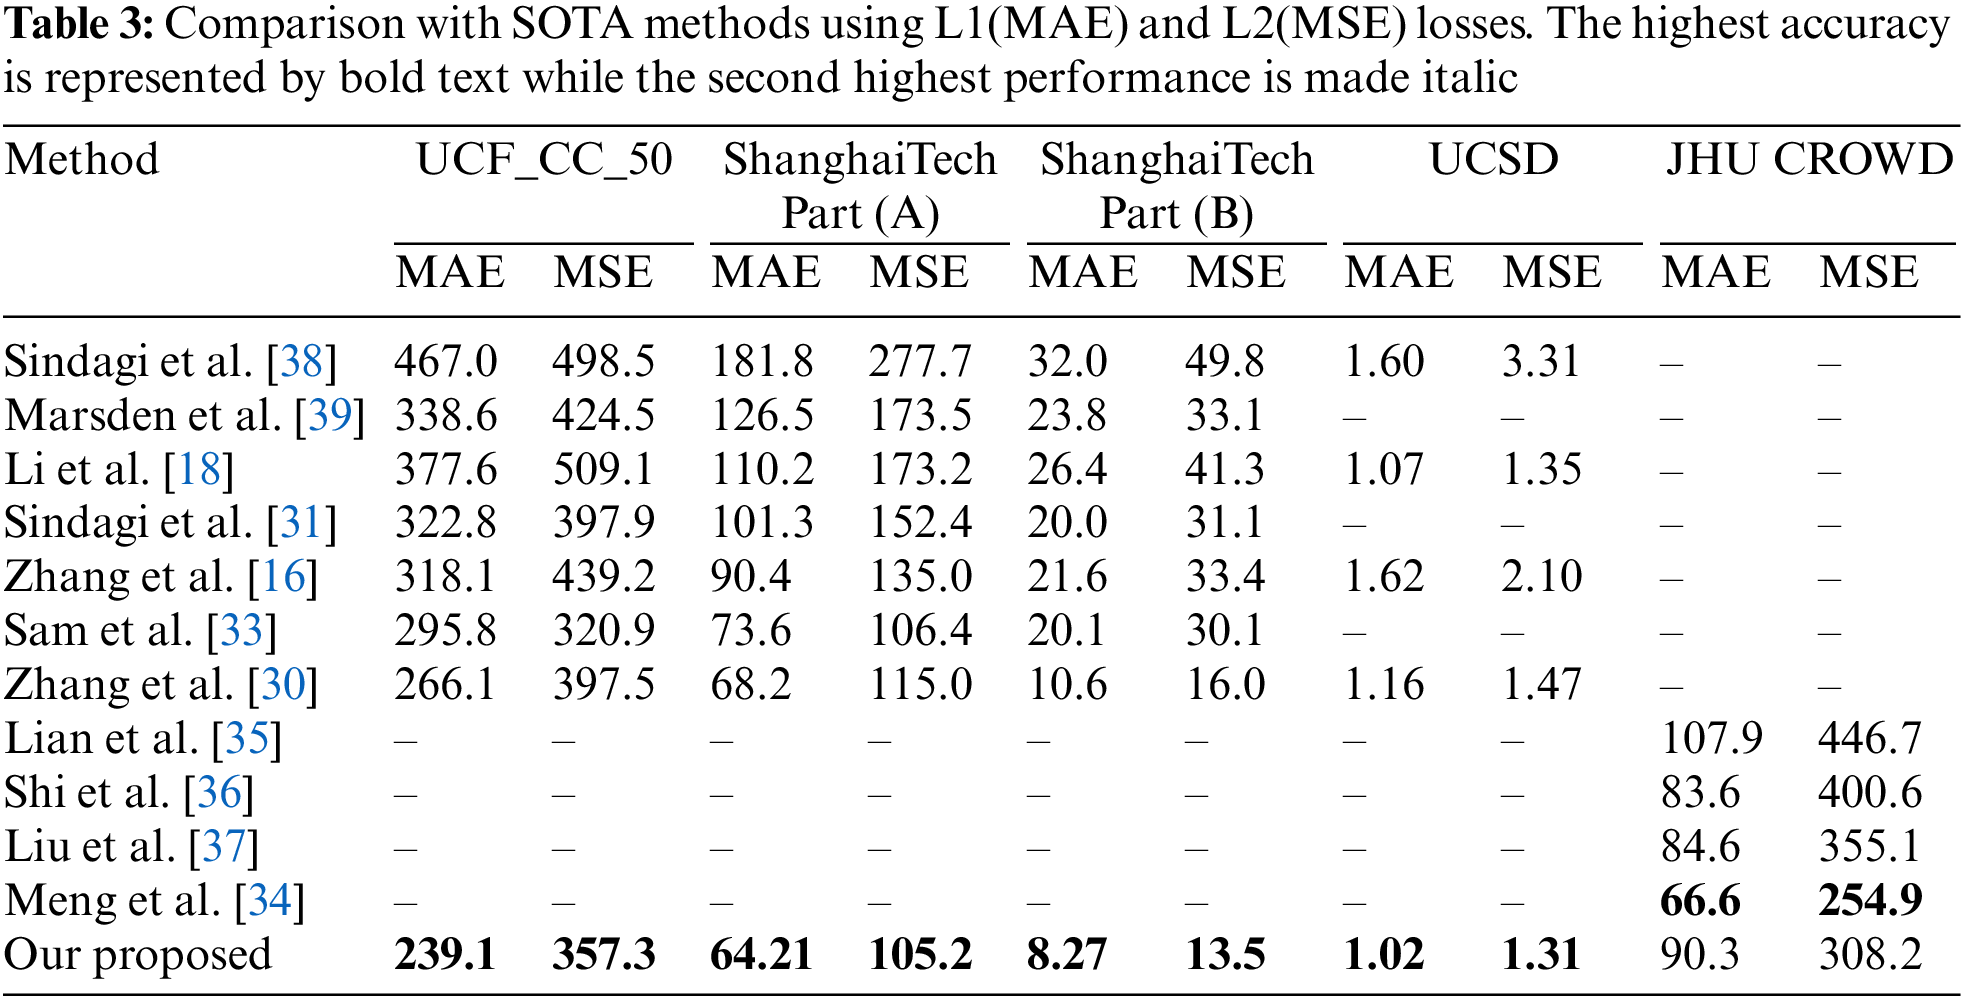
In comparison with four previous approaches [16,18,31,33] on the UCSD dataset, our architecture achieves the most optimal performance regarding MAE (1.02) and MSE (1.31), as shown in Table 3. With (0.05%) increase in MAE and (0.04%) enhancement in MSE, our architecture beats the closest approach [16]. By demonstrating the proposed network effectiveness on scant and extremely congested datasets, this significant increase in MAE and MSE is validated. Table 2 lists and compares the density map quality obtained from our architecture on benchmark datasets. Our architecture yielded the best results based on the benchmark datasets utilized, UCF_CC_50, ShanghaiTech Part (A), ShanghaiTech Part (B), and UCSD. The visual results comparison with ground truth and predicted density maps for ShanghaiTech Part-A and B test sets are depicted in Fig. 3. Based on the benchmark datasets listed in Table 2, the proposed architecture achieves (21.87, 24.79, 26.73, and 20.63) PSNRs and (0.69, 0.81, 0.89, and 0.86) SSIMs. On JHU CROWD dataset, our method achieved the second best MSE, achieving 308.2 MSE compared to Meng et al. [34], which gained 254.9. In the other techniques, Lian et al. [35], Shi et al. [36], and Liu et al. [37] achieved 446.7, 400.6, and 355.1 MSE, respectively. Our method did not perform better on MAE for the JHU Crowd dataset, achieving 90.3, which is lower than Shi et al. [36], Liu et al. [37], and Meng et al. [34], who reached 83.6, 84.6, and 66.6 MAE, respectively. The reason for not performing better on this dataset is that it has various environmental characteristics. The MAE is not a good loss for varying conditions because it averages the loss for the whole batch while backpropagating the loss. Therefore, we can reduce the training loss, but it is not robust enough to perform better on unseen test data.
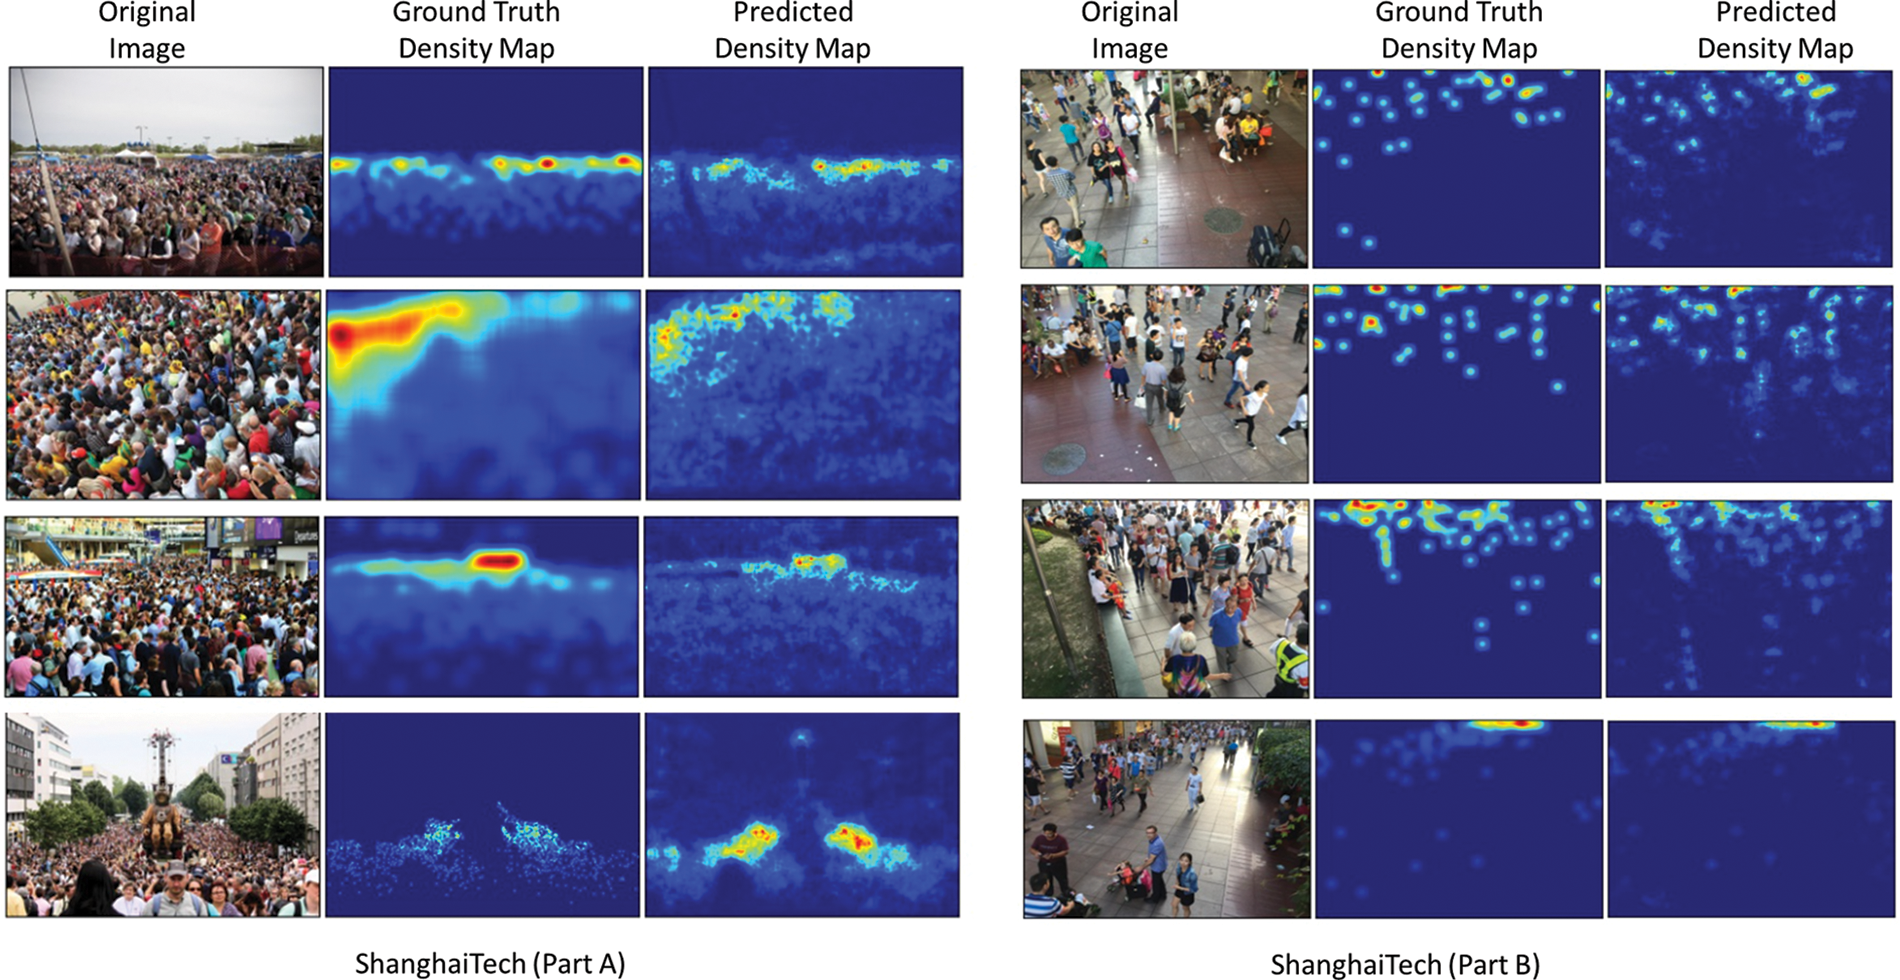
Figure 3: Visual results comparison with ground truth and predicted density maps for ShanghaiTech Part-A and B test sets
Due to its use of residual blocks and dilated convolutional layers, our architecture generates a high-quality density map, even if it is lightweight compared to previous approaches. The proposed network is evaluated against the aforementioned methods when it comes to people counting in terms of the MAE and MSE in Table 3. In contrast, the quality comparisons of the density map are shown in Table 2 based on PSNR and SSIM. The results shown in Tables 2 and 3 imply that the proposed network achieves the lowest values when it comes to MSE and MAE, while SSIM and PSNR achieve the peak accuracy figures. Hence, the proposed network is currently the most suitable to handle both meager and significantly crowded scenes, indicating that the proposed architecture will work well for both scenarios.
Finally, the proposed method can process 60 frames per second, which shows its efficiency and better time complexity for real-time crowd-counting application.
In this study, we suggested an end-to-end deep neural network that can take an input image sample and produce a crowd scene density map and head counts. It has encoder and decoder networks that employ evolving normalization (EvoNorm), a batch-free normalization technique, enabling our network to be adapted for unseen data. This is possible since EvoNorm does not need statistics from the training samples. With our network, real-time processing is possible with the utilization of dilated 2D convolutional layers in the decoder network, which offer wide receptive fields and fewer parameters. The proposed framework is evaluated using five benchmarked datasets using MAE, MSE, PSNR, and SSIM, which shows that the proposed method overperformed other methods. Finally, the proposed model is not adaptable for embedded devices and needs supervised head-annotated data. For this reason, we will emphasize effective and lightweight models in the future to create high-quality density maps over edge devices. This study can also be applied to other object-counting fields, including automobile and tree counting, by utilizing unsupervised approaches.
Acknowledgement: This research was supported by Basic Science Research Program through the National Research Foundation of Korea (NRF) funded by the Ministry of Education (No. 2021R1I1A1A01055652).
Funding Statement:: This research was supported by Basic Science Research Program through the National Research Foundation of Korea (NRF) funded by the Ministry of Education (No. 2021R1I1A1A01055652).
Conflicts of Interest:: The authors declare that they have no conflicts of interest to report regarding the present study.
References
1. S. Abdel-Khalek, M. Algarni, R. F. Mansour, D. Gupta and M. Ilayaraja, “Quantum neural network-based multilabel image classification in high-resolution unmanned aerial vehicle imagery,” Soft Computing, pp. 1–12, 2021. https://doi.org/10.1007/s00500-021-06460-3 [Google Scholar] [CrossRef]
2. M. F. Alotaibi, M. Omri, S. Abdel-Khalek, E. Khalil and R. F. Mansour, “Computational intelligence-based harmony search algorithm for real-time object detection and tracking in video surveillance systems,” Mathematics, vol. 5, no. 5, pp. 733, 2022. [Google Scholar]
3. N. Khan, A. Ullah, I. U. Haq, V. G. Menon and S. W. Baik, “SD-Net: Understanding overcrowded scenes in real-time via an efficient dilated convolutional neural network,” Journal of Real-Time Image Processing, vol. 5, no. 5, pp. 1729–1743, 2021. [Google Scholar]
4. R. Sundararaman, C. De Almeida Braga, E. Marchand and J. Pettre, “Tracking pedestrian heads in dense crowd,” in Proc. Computer Vision and Pattern Recognition, Virtual, 2021. [Google Scholar]
5. L. Wen, D. Du, P. Zhu, Q. Hu, Q. Wang et al., “Detection, tracking and counting meets drones in crowds: A benchmark,” in Proc. Computer Vision and Pattern Recognition, Virtual, 2021. [Google Scholar]
6. M. Hassaballah and A. I. Awad, “Detection and description of image features: An introduction,” in Image Feature Detectors and Descriptors, 1st ed., vol. 1. Manhattan, NY, USA: Springer, pp. 1–8, 2016. [Google Scholar]
7. T. Hussain, S. Anwar, A. Ullah, K. Muhammad and S. W. Baik, “Densely deformable efficient salient object detection network,” arXiv preprint arXiv:2102.06407, 2021. [Google Scholar]
8. N. Dilshad, A. Ullah, J. Kim and J. Seo, “Locateuav: Unmanned aerial vehicle location estimation via contextual analysis in an IoT environment,” IEEE Internet of Things Journal, vol. 10, no. 5, pp. 4021–4033, 2023. [Google Scholar]
9. N. Dilshad and J. Song, “Dual-stream siamese network for vehicle re-identification via dilated convolutional layers,” in Proc. Int. Conf. on Smart Internet of Things, Jeju Island, SK, pp. 350–352, 2021. [Google Scholar]
10. N. Wang, Q. Zou, Q. Ma, Y. Huang and D. Luan, “A light tracker for online multiple pedestrian tracking,” Journal of Real-Time Image Processing, vol. 1, no. 1, pp. 175–191, 2021. [Google Scholar]
11. X. Shi, X. Li, C. Wu, S. Kong, J. Yang et al., “A real-time deep network for crowd counting,” in Proc. Int. Conf. on Acoustics, Speech and Signal Processing, Virtual, 2020. [Google Scholar]
12. I. Shallari, S. Krug and M. O’Nils, “Communication and computation inter-effects in people counting using intelligence partitioning,” Journal of Real-Time Image Processing, vol. 6, no. 6, pp. 1869–1882, 2020. [Google Scholar]
13. C. Migniot and F. Ababsa, “Hybrid 3D-2D human tracking in a top view,” Journal of Real-Time Image Processing, vol. 4, no. 4, pp. 769–784, 2016. [Google Scholar]
14. Y. Nam and S. Hong, “Real-time abnormal situation detection based on particle advection in crowded scenes,” Journal of Real-Time Image Processing, vol. 4, no. 4, pp. 771–784, 2015. [Google Scholar]
15. H. Idrees, I. Saleemi, C. Seibert and M. Shah, “Multi-source multi-scale counting in extremely dense crowd images,” in Proc. Computer Vision and Pattern Recognition, Portland, Oregon, USA, 2013. [Google Scholar]
16. Y. Zhang, D. Zhou, S. Chen, S. Gao and Y. Ma, “Single-image crowd counting via multi-column convolutional neural network,” in Proc. Computer Vision and Pattern Recognition, Las Vegas, Nevada, USA, 2016. [Google Scholar]
17. D. Babu Sam, S. Surya and R. Venkatesh Babu, “Switching convolutional neural network for crowd counting,” in Proc. Computer Vision and Pattern Recognition, Honolulu, Hawaii, USA, 2017. [Google Scholar]
18. Y. Li, X. Zhang and D. Chen, “CSRNet: Dilated convolutional neural networks for understanding the highly congested scenes,” in Proc. Computer Vision and Pattern Recognition, Salt Lake City, Utah, USA, 2018. [Google Scholar]
19. X. Cao, Z. Wang, Y. Zhao and F. Su, “Scale aggregation network for accurate and efficient crowd counting,” in Proc. European Conf. on Computer Vision, Munich, Germany, 2018. [Google Scholar]
20. J. Wan, W. Luo, B. Wu, A. B. Chan and W. Liu, “Residual regression with semantic prior for crowd counting,” in Proc. Computer Vision and Pattern Recognition, Long Beach, California, USA, 2019. [Google Scholar]
21. V. Lempitsky and A. Zisserman, “Learning to count objects in images,” in Advances in Neural Information Processing Systems, Red Hook, NY, USA: Curran Associates Inc., pp. 1324–1332, 2010. [Google Scholar]
22. Z. Sun, D. Peng, Z. Cai, Z. Chen and L. Jin, “Scale mapping and dynamic re-detecting in dense head detection,” in Proc. Int. Conf. on Image Processing, Athens, Greece, 2018. [Google Scholar]
23. S. Kumagai, K. Hotta and T. Kurita, “Mixture of counting CNNs: Adaptive integration of CNNs specialized to specific appearance for crowd counting,” arXiv preprint arXiv:1703.09393, 2017. [Google Scholar]
24. D. Song, Y. Qiao and A. Corbetta, “Depth driven people counting using deep region proposal network,” in Proc. Int. Conf. on Information and Automation, Marina Bay Sands, Singapore, 2017. [Google Scholar]
25. Z. Zhao, M. Shi, X. Zhao and L. Li, “Active crowd counting with limited supervision,” in European Conference on Computer Vision, Glasgow, UK, 2020. [Google Scholar]
26. Y. Liu, L. Liu, P. Wang, P. Zhang and Y. Lei, “Semi-supervised crowd counting via self-training on surrogate tasks,” in European Conference on Computer Vision, Glasgow, UK, 2020. [Google Scholar]
27. V. A. Sindagi, R. Yasarla, D. S. Babu, R. V. Babu and V. M. Patel, “Learning to count in the crowd from limited labeled data,” in European Conference on Computer Vision, Glasgow, UK, 2020. [Google Scholar]
28. K. He, X. Zhang, S. Ren and J.[21] Sun, “Deep residual learning for image recognition,” in Proc. Computer Vision and Pattern Recognition, Las Vegas, Nevada, USA, 2016. [Google Scholar]
29. H. Liu, A. Brock, K. Simonyan and Q. Le, “Evolving normalization-activation layers,” in Advances in Neural Information Processing Systems, Red Hook, NY, USA: Curran Associates Inc., pp. 13539–13550, 2020. [Google Scholar]
30. C. Zhang, H. Li, X. Wang and X. Yang, “Cross-scene crowd counting via deep convolutional neural networks,” in Proc. Computer Vision and Pattern Recognition, Boston, Massachusetts, USA, 2015. [Google Scholar]
31. V. A. Sindagi and V. M. Patel, “Generating high-quality crowd density maps using contextual pyramid CNNs,” in Proc. Int. Conf. on Computer Vision, Venice, Italy, 2017. [Google Scholar]
32. V. A. Sindagi, R. Yasarla and V. M. Patel, “Pushing the frontiers of unconstrained crowd counting: New dataset and benchmark method,” in Proc. Int. Conf. on Computer Vision, Seoul, South Korea, 2019. [Google Scholar]
33. D. B. Sam, S. Surya and R. V. Babu, “Switching convolutional neural network for crowd counting,” in Conf. on Computer Vision and Pattern Recognition, Honolulu, Hawaii, USA, 2017. [Google Scholar]
34. Y. Meng, J. Bridge, M. Wei, Y. Zhao, Y. Qiao et al., “Counting with adaptive auxiliary learning,” arXiv preprint arXiv:2203.04061, 2022. [Google Scholar]
35. D. Lian, J. Li, J. Zheng, W. Luo and S. Gao, “Density map regression guided detection network for RGB-D crowd counting and localization,” in Proc. Conf. on Computer Vision and Pattern Recognition, Long Beach, California, USA, 2019. [Google Scholar]
36. Z. Shi, P. Mettes and C. G. Snoek, “Counting with focus for free,” in Proc. Int. Conf. on Computer Vision, Seoul, South Korea, pp. 4200–4209, 2019. [Google Scholar]
37. Y. Liu, Q. Wen, H. Chen, W. Liu, J. Qin et al., “Crowd counting via cross-stage refinement networks,” IEEE Transactions on Image Processing, vol. 29, pp. 6800–6812, 2020. [Google Scholar]
38. V. A. Sindagi and V. M. Patel, “CNN-based cascaded multi-task learning of high-level prior and density estimation for crowd counting,” in Proc. Int. Conf. on Advanced Video and Signal Based Surveillance, Lecce, Italy, 2017. [Google Scholar]
39. M. Marsden, K. McGuinness, S. Little and N. E. O’Connor, “Fully convolutional crowd counting on highly congested scenes,” arXiv preprint arXiv:1612.00220, 2016. [Google Scholar]
Cite This Article
 Copyright © 2023 The Author(s). Published by Tech Science Press.
This work is licensed under a Creative Commons Attribution 4.0 International License , which permits unrestricted use, distribution, and reproduction in any medium, provided the original work is properly cited.
 Downloads
 Citation Tools