
 Submit a Paper
 Propose a Special lssue
 Open Access
ARTICLE

Intelligent Beetle Antenna Search with Deep Transfer Learning Enabled Medical Image Classification Model
Department of Medical Equipment Technology, College of Applied Medical Sciences, Majmaah University, Al Majmaah, 11952, Saudi Arabia
* Corresponding Author: Mohamed Ibrahim Waly. Email:
Computer Systems Science and Engineering 2023, 46(3), 3159-3174. https://doi.org/10.32604/csse.2023.035900
Received 09 September 2022; Accepted 21 December 2022; Issue published 03 April 2023
 View Full Text
 Download PDF
Abstract
Recently, computer assisted diagnosis (CAD) model creation has become more dependent on medical picture categorization. It is often used to identify several conditions, including brain disorders, diabetic retinopathy, and skin cancer. Most traditional CAD methods relied on textures, colours, and forms. Because many models are issue-oriented, they need a more substantial capacity to generalize and cannot capture high-level problem domain notions. Recent deep learning (DL) models have been published, providing a practical way to develop models specifically for classifying input medical pictures. This paper offers an intelligent beetle antenna search (IBAS-DTL) method for classifying medical images facilitated by deep transfer learning. The IBAS-DTL model aims to recognize and classify medical pictures into various groups. In order to segment medical pictures, the current IBASDTLM model first develops an entropy based weighting and first-order cumulative moment (EWFCM) approach. Additionally, the DenseNet-121 technique was used as a module for extracting features. A BAS with an extreme learning machine (ELM) model is used to classify the medical photos. A wide variety of tests were carried out using a benchmark medical imaging dataset to demonstrate the IBAS-DTL model’s noteworthy performance. The results gained indicated the IBAS-DTL model’s superiority over its pre-existing techniques.Keywords
To help professionals in illness diagnosis or in-depth analysis, medical image classification, an important challenge in image detection, divides medical pictures into discrete groups [1]. In general, there are two processes to medical picture categorization. Effective feature extraction from the picture is the first step. The next step involves using that feature to create a model that classifies the picture collection [2]. In the past, physicians often used their specialist knowledge to extract characteristics and classify the medical picture into several groups, which was typically a tedious, time-consuming procedure. This approach is vulnerable to unpredictable or unstable outcomes [3]. When the study is considered, the application study for medical image classification has more advantages. Numerous published papers in the area as a consequence of the researcher’s work. But as of right now, we cannot complete this objective [4,5]. When we successfully completed the classifier task, the results let medical professionals identify diseases via further study. Therefore, resolving this procedure effectively is of utmost importance [6]. Accurate and quick annotation or categorization of medical pictures becomes an essential technique in CAD systems to develop an intelligent Computer-Aided Diagnosis (CAD) method in virtually all medical fields. In the US specifically, skin cancer is found in a number of people each year [7]. Numerous lives are saved when it is identified early on. Multiple research papers have been published in the area of medical image classifiers [8]. However, medical photographs obtained from specific locations may differ regarding focusing regions, white balance, and contrast [9]. The interior structure of a medical picture also contains various textures and pixel densities. It is difficult to adequately characterize specific categories after it has used conventional characteristics to classify medical images [10]. Deep learning has recently gained popularity in computer science and computer applications. Numerous researchers have attempted to use the developing technology to handle non-medical imagery as deep learning has advanced.
The modular group attention block, recorded feature dependence from medical pictures from 2 separate dimensions, such as channel and space, is examined by Cheng et al. [11]. These group attention blocks may be stacked ResNet-style to create a unique ResNet version known as ResGANet. Singh et al. [12] presented a few-shot learning issue and proposed a “MetaMed” solution based on meta-learning. Approaches regularise the process and improve the generalized ability in addition to advanced augmenting. A 2-stage ensemble of Convolutional Neural Network (CNN) branches using deep tree training, a unique learned technique, was reported by Yang et al. [13]. (DTT). In this method, DTT was used to jointly train a series of networks built in the hidden layers of CNN using a hierarchical approach. This technique can reduce the effects of vanishing gradient by enhancing the gradient for CNN’s hidden layers and fundamentally achieving base classifications on middle-level features with a low computational cost for an ensemble solution. TransMed for multi-modal medicinal image categorization is presented by Dai et al. [14]. TransMed combines the advantages of CNN and Transformer to extract low-level visual information and start long-range modal dependence efficiently. Our technique may be used to estimate it using two datasets, including classifications for knee injuries and parotid gland malignancies. In this work, an intelligent beetle antenna search (IBAS-DTL) model for classifying medical images is developed. To segment medical pictures, the current IBAS-DTLM model first generates an entropy based weighting and first-order cumulative moment (EWFCM) approach.
Additionally, the DenseNet-121 technique was run as a module for extracting features. A BAS with an extreme learning machine (ELM) model is used to classify the medical photos. A wide variety of tests were carried out using a benchmark medical imaging dataset to demonstrate the IBAS-DTL technique’s noteworthy performance. Tong et al. [15] presented an extended version of U-Net to the skin lesions segment utilizing the triple attention process model. It can be the primary chosen region using the attention coefficient calculated by the attention gate and contextual data. Secondary, a dual attention decoder element containing channel and spatial attention is utilized to capture the spatial correlation amongst features and enhance segmentation performance. In [16], the primary contour of AC without edge ‘Chan-Vese’ technique was optimized utilizing the GA to determine the optimum direct circular region percentage of skin lesion images in the entire image region.
Kadry et al. [17] applied a CNN-based technique to support the automated SM analysis. This work utilized the VGG-SegNet method for extracting the SM section in the Digital-Dermoscopy-Image (DDI). Afterward the extracting, a comparative assessment amongst the segmented SM and Ground Truth (GT) has been implemented and the vital performance indices are calculated. Hasan et al. [18] present an automated dermoscopic SLC structure called Dermoscopic Expert (DermoExpert). It integrates the pre-processed and hybrid CNN. The presented hybrid-CNN contains 3 feature extractor components fused to achieve an optimum-depth feature map of lesions. Individuals’ single and fused feature map is classified utilizing distinct FC layers, and next ensembled for predicting a lesion class.
YacinSikkandar et al. [19] examine a novel segmentation-based classifier method for skin lesion analysis by integrating GrabCut and Adaptive Neuro-Fuzzy classifier (ANFC) techniques. Primarily, the pre-processing step was implemented utilizing a Top hat filter and in-painting approach. Afterward, the Grabcut technique was employed for segmenting the pre-processed image. Then, the feature-extracting procedure occurs by using DL based Inception method. Lastly, an ANFC model is implemented for classifying the dermoscopic image into distinct classes.
Khan et al. [20] presented a fully automated multi-class skin lesion segment and classification technique by utilizing the most discriminant in-depth feature. The primary input images were improved using local color-controlled histogram intensity value (LCcHIV). Afterward, the segmentation color lesion image is utilized to feature extracting by deep pre-trained CNN technique. To avoid the curse of dimensionality, an improved moth flame optimization (IMFO) technique can be executed for selecting the most discriminant feature. The outcome feature is fused using a multiset maximum correlation analysis (MMCA) and KELM classification.
This study introduces a new IBAS-DTL model to identify and categorize medical images into distinct classes. The presented IBAS-DTLM model primarily designed a new EWFCM model to segment medical images. Besides, the DenseNet-121 model is applied as a feature extractor module. Moreover, BAS, with the ELM model, categorizes medical images. Fig. 1 illustrates the overall process of the IBAS-DTL technique. The presented intelligent beetle antenna search (IBAS-DTL) method for classifying medical images that are facilitated by deep transfer learning. The IBAS-DTL model aims to recognize and classify medical pictures into various groups. To segment medical pictures, the current IBAS-DTLM model first develops an entropy based weighting and first-order cumulative moment (EWFCM) approach. Additionally, the DenseNet-121 technique was used as a module for extracting features. A BAS with an extreme learning machine (ELM) model is used to classify the medical photos.
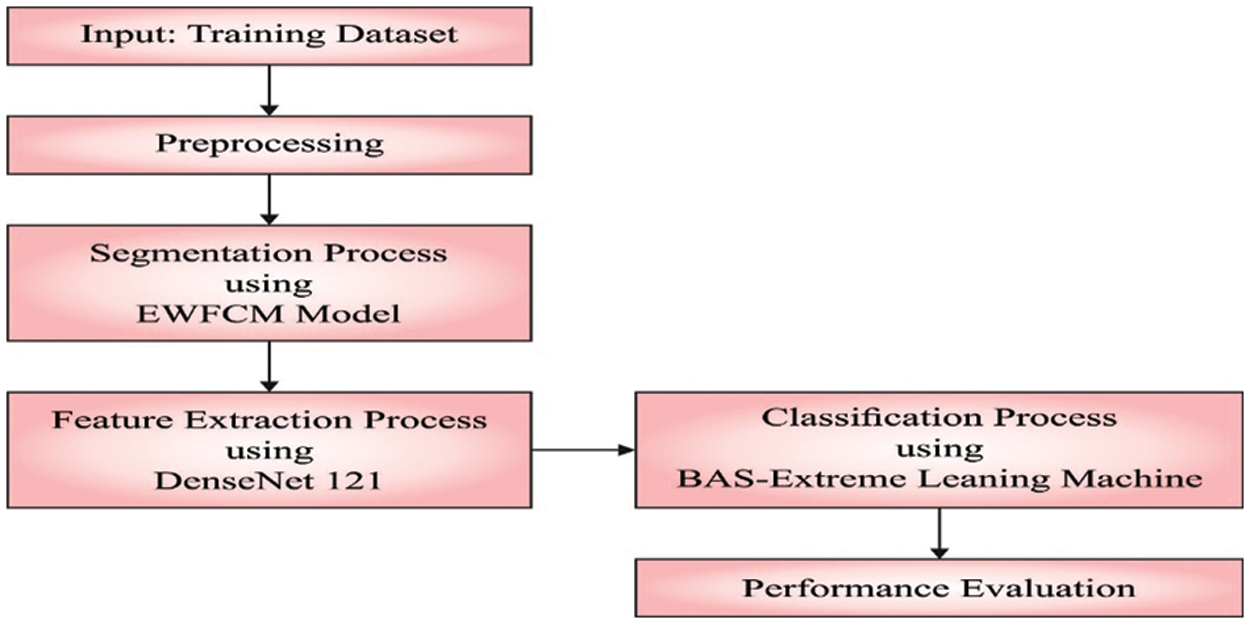
Figure 1: Overall process of IBAS-DTL technique
3.1 Process Involved in EWFCM Based Segmentation
The medical images are segmented at the primary level using the EWFCM model [21]. Initially, a brief analysis of the Otsu approach is presented. Next, histogram accumulation and EW moment are defined with the use of Fuzzy C-Means (FCM). At last, the novel image threshold method for segmenting images is introduced. Otsu is a widely referred thresholding method. Consider
Let the threshold
The medium gray level of class and the possibility of class existence, correspondingly, are estimated below:
where
In the Otsu method, the resultant threshold presentation can be estimated by examining the variance between the foreground and background. The optimum threshold
The fundamental concept Otsu method is the calculation of a weight
Image entropy defines the property of an image, an arithmetic measure of arbitrariness. Image with lower entropy values has slight data and multiple pixels with similar intensity values. An image with zero entropy implies that each pixel holds a similar gray value. It recommended an EW system by replacing weight
The objective entropy function is determined by:
whereas
Then, we discussed the initial order of the increasing moment. Let
The mean gray of the entire image is
The FCM
3.2 DenseNet-121 Based Feature Extraction
Once the input medical images are segmented, the diseased portions are effectively identified. Then, the DenseNet-121 model is employed to generate feature vectors [22]. The DenseNet-121 model has been developed to resolve the problems involved in the CNN models. It is due to reducing the flow of data from input to output layers. It will simplify the connectivity patterns that exist among the layers. In this work, the DenseNet-121 model produces a collection of feature vectors which are then fed into the ELM model for the classification process. Fig. 2 showcases the layered in DenseNet.
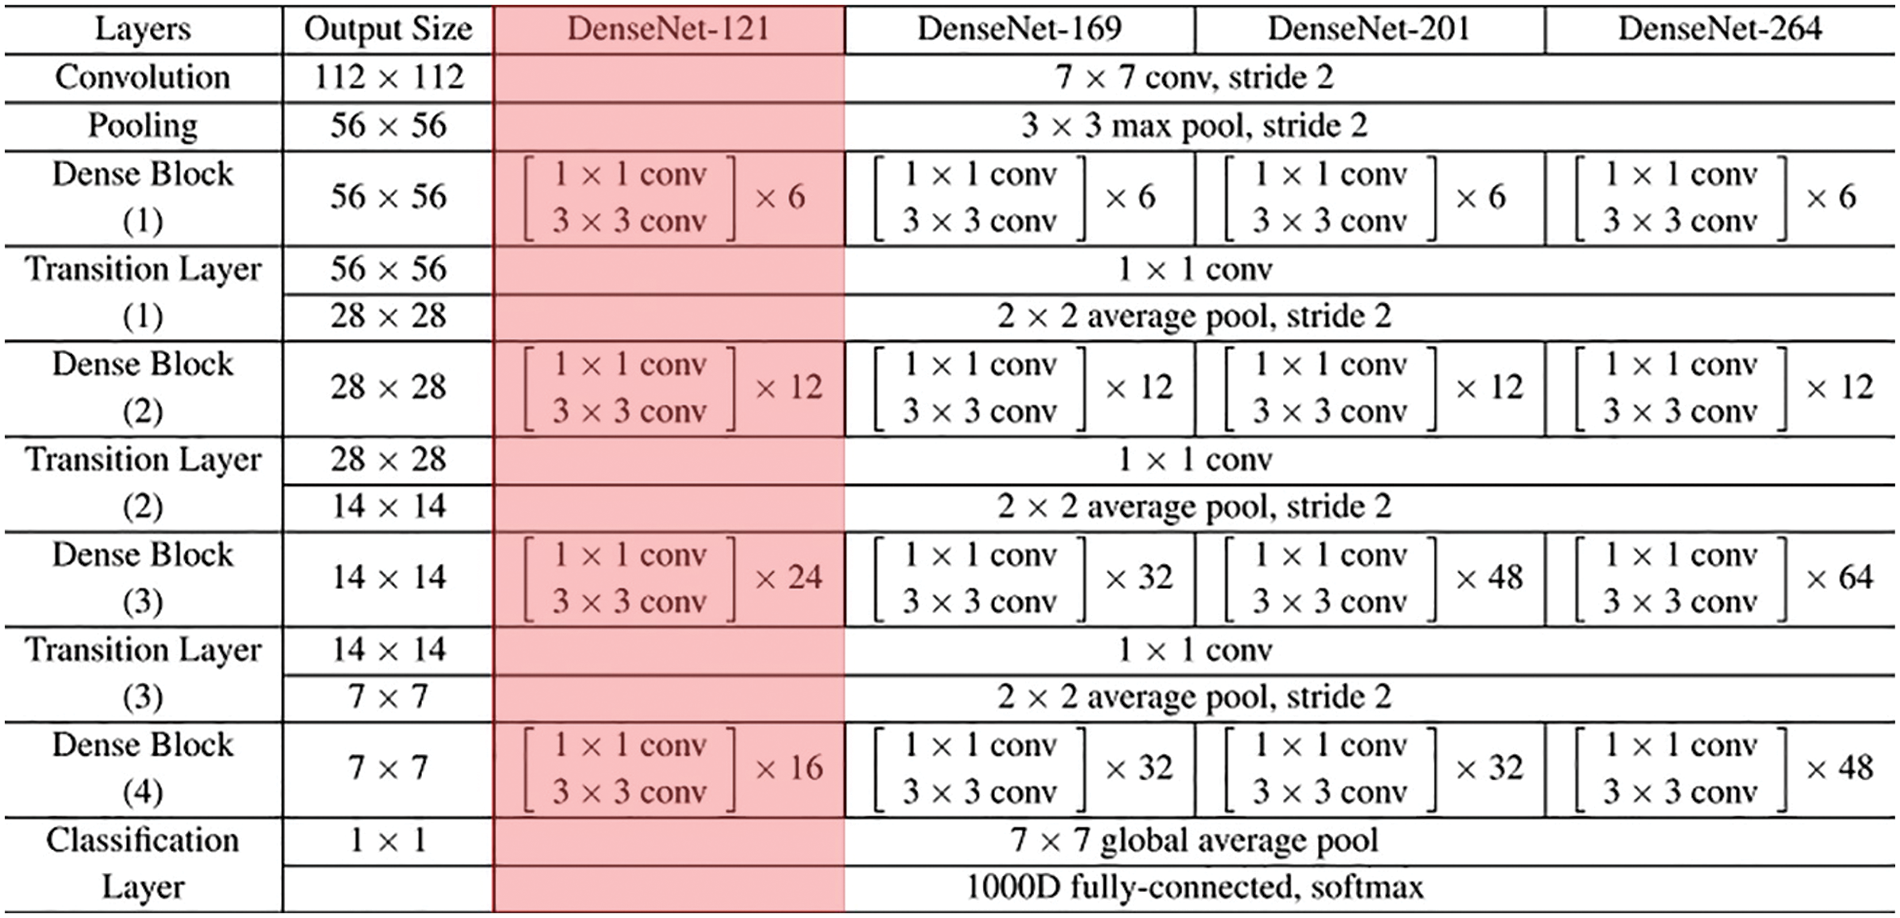
Figure 2: Layered in DenseNet
3.3 Optimal ELM Based Classification
The ELM model is used to appropriately identify the medical photos in the end. Because of their quick and effective learning speeds, suitable generalised abilities, quick convergence rates, and ease of execution, ELM is one of the most widely used SLNN learning techniques [23]. Their variations are also frequently used from batch learning, incremental learning, and sequential learning. A primary goal of the ELM, in contrast to classical learning approaches, is to achieve generalised efficiency by achieving both the resulting weight minimal norm and little trained error. An ELM primary computes the output state weighted using these arbitrary values after arbitrarily setting the weight and bias of the input state.
In comparison to standard NN approaches, this method has a quicker learning rate and maximum efficiency. The number n speaks for the number of input-state neurons, the number L stands for the number of hidden-state neurons, and the number m stands for the number of output-state neurons in the typical SLNN.The activation function is demonstrated in Eq. (12).
whereas
The initial purpose of training is to minimize ELM error or variance. The input bias and weight are stochastically selective. The activation function is that extremely differentiable in the convention ELM; however, the ELM training drives for obtaining the resultant weight (Q) using optimize the least-square process referred to in Eq. (15). The equivalent resulting weight is analytically calculated by utilizing the Moore-Penrose generalized in verse as complete in ELM (Eq. (16)) rather than some iterative tuning.
During this formula,
For tuning the ELM parameters, the BAS algorithm is utilized. The long-horned beetle takes two too-long antennae combined with the scent of prey to expand the recognition range and perform a protective alarm process [24–29]. The beetle explores neighboring regions by swinging its antennae on one side of its body to accept the smell. The beetle has moved nearby the side, indicating a higher odor concentration. The BAS was aimed based on this property of beetle. The search way of beetles is demonstrated by Eq. (17).
whereas
In which
whereas
The BAS approach develops a FF for achieving enhanced classifier performance. It defines a positive integer for representing the optimum performance of candidate solutions. During this case, the minimized classifier error rate is assumed as FF is offered in Eq. (20). A better outcome is a lower error rate, and a poor solution gains an enhanced error rate.
In this section, the performance validation of the IBAS-DTL method takes place utilizing 2 benchmark datasets, namely HIS2828 and ISIC2017. The first HIS2828 dataset includes 1026 samples under nervous tissue (NT), 484 under connective tissue (CT), 804 under epithelial tissue (ET), and 514 under muscular tissue (MT). The second ISIC2017 dataset includes 374 samples under the melanoma class and 1626 samples under NS Keratosis (NSK) class. Fig. 3 defines some sample images.
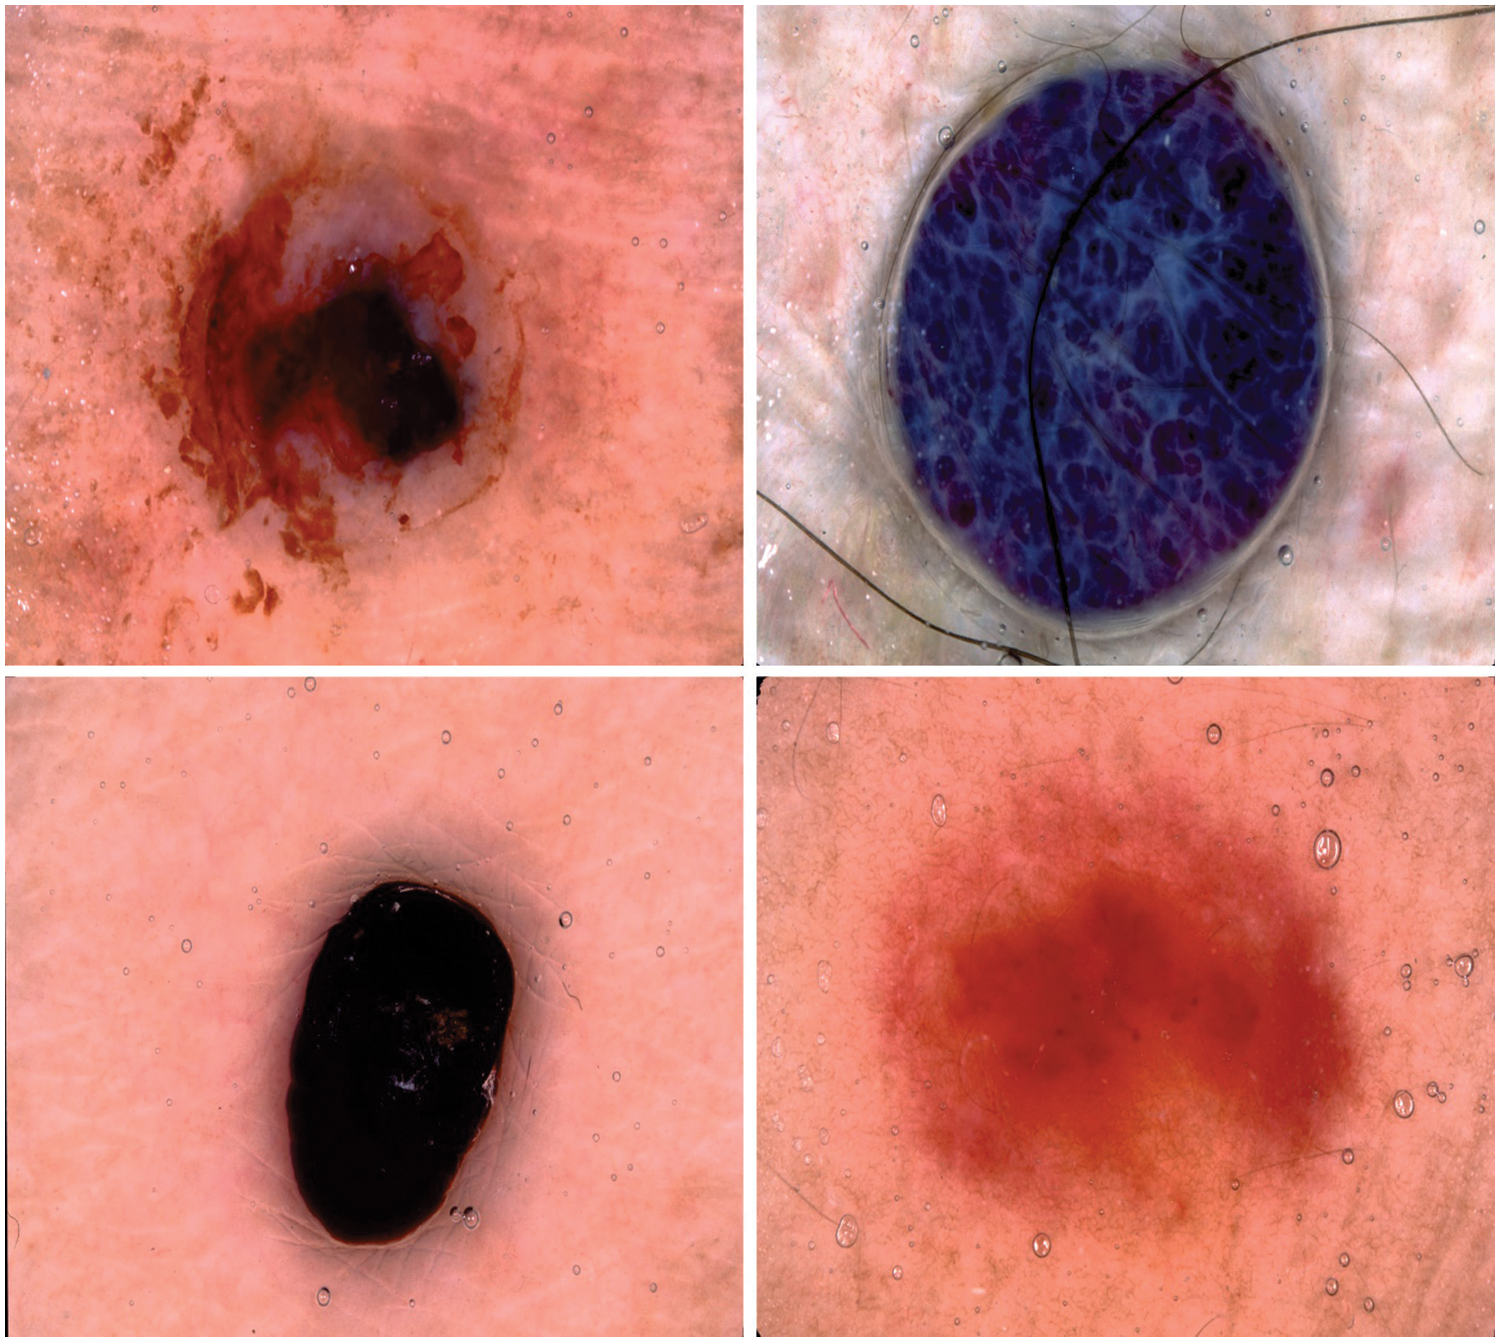
Figure 3: Sample images
Fig. 4 demonstrates the confusion matrices offered by the IBAS-DTL system on the HIS2828 dataset. On the entire dataset, the IBAS-DTL model has identified 984 samples under NT, 452 samples under CT, 788 samples under ET, and 479 samples under MT classes. Meanwhile, on 70% of the training dataset, the IBAS-DTL algorithm has identified 677 samples under NT, 324 samples under CT, 552 samples under ET, and 330 samples under MT classes. Eventually, on the 30% testing dataset, the IBAS-DTL methodology identified 307 instances under NT, 128 samples under CT, 236 samples under ET, and 149 samples under MT classes.
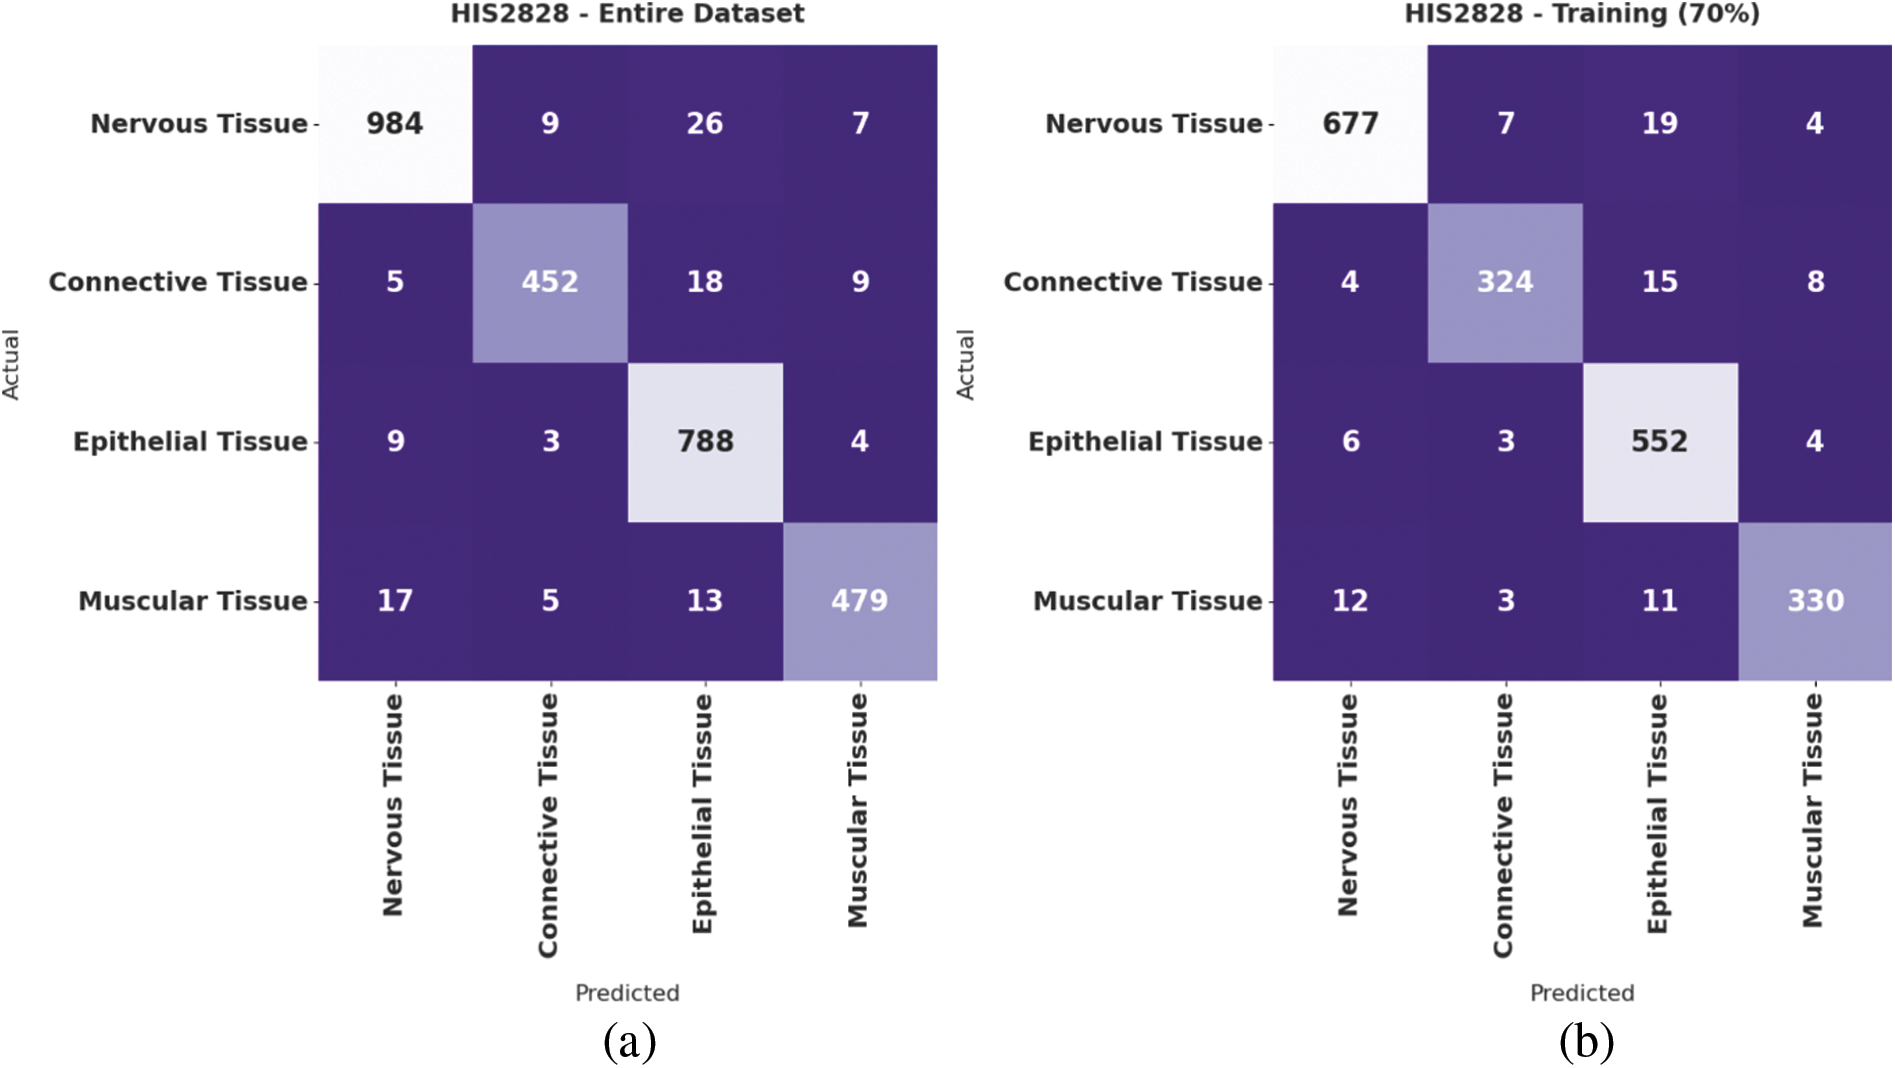
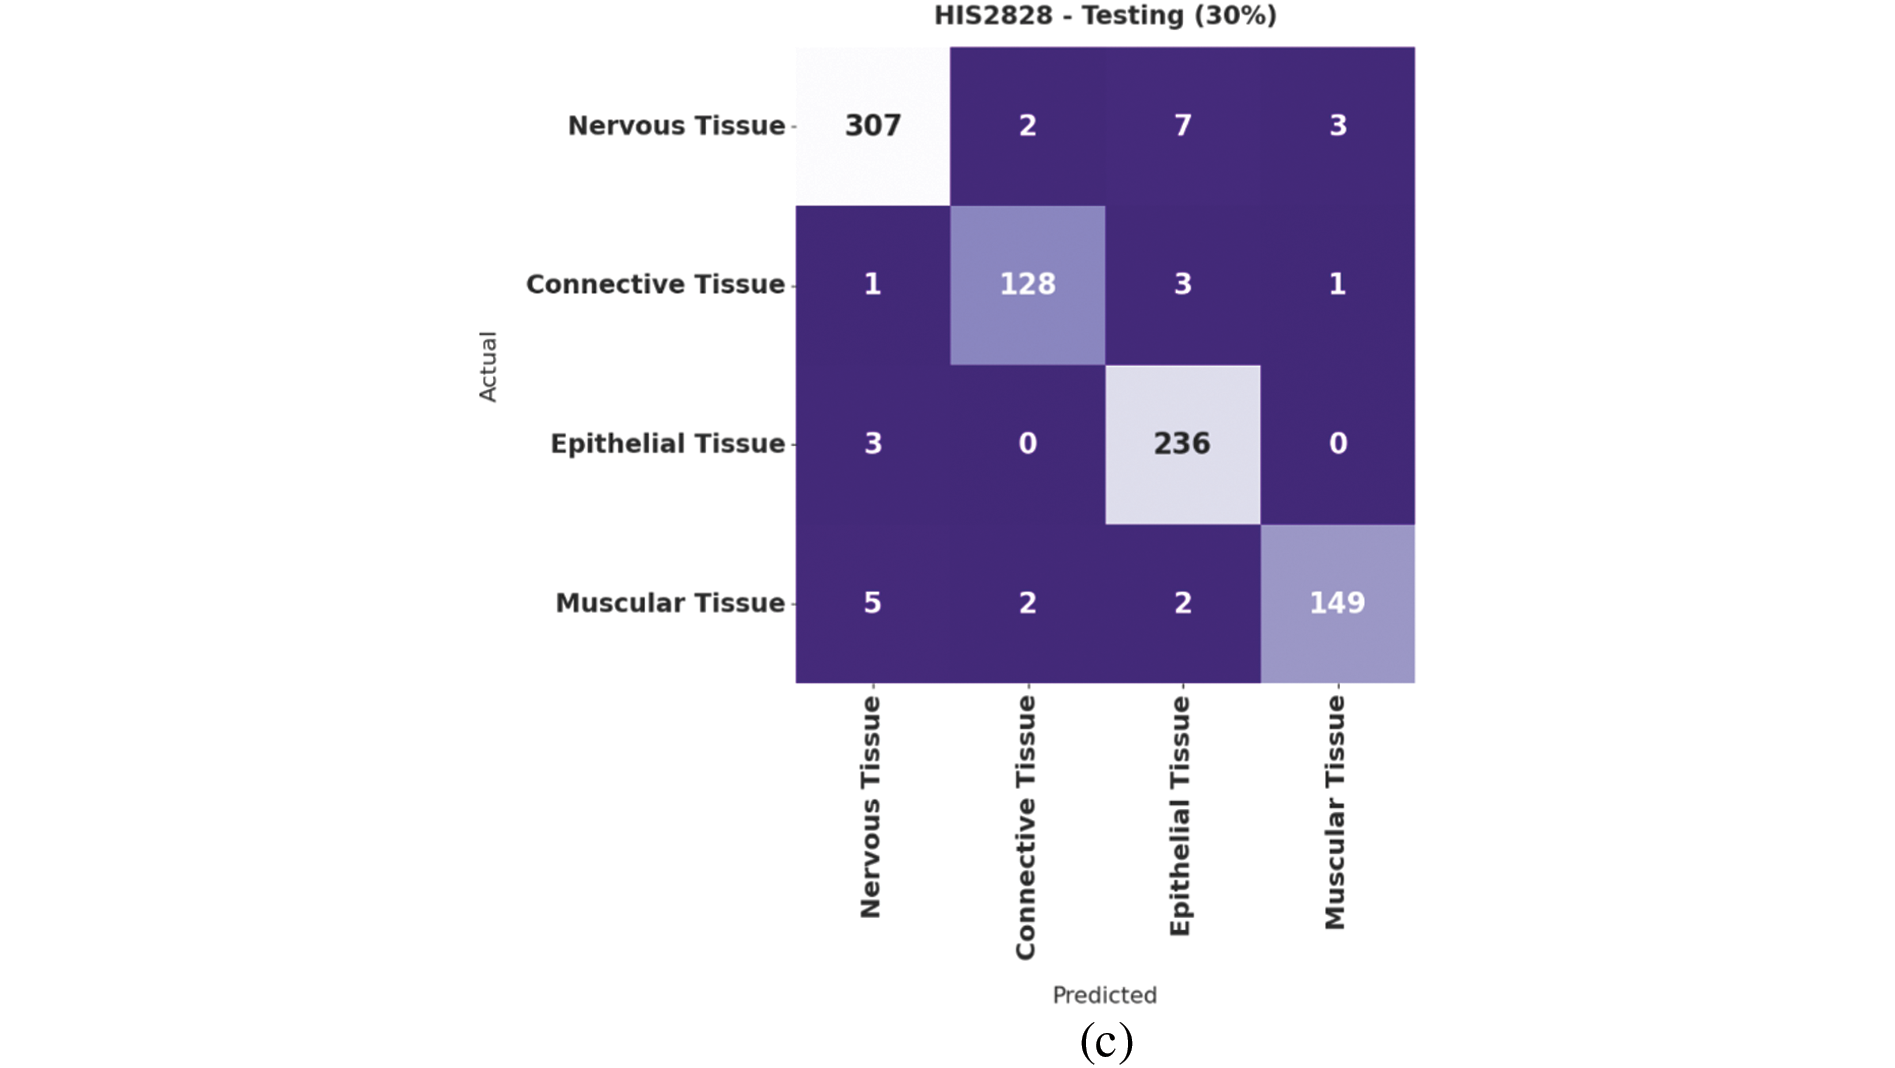
Figure 4: Confusion matrix of IBAS-DTL technique on HIS2828 dataset
Table 1 provides detailed classification results of the IBAS-DTL model on the HIS2828 dataset. The experimental outcomes pointed out that the IBAS-DTL model has resulted in maximum classification results under all datasets and class labels. For instance, with the entire dataset, the IBAS-DTL model has accomplished maximum average

Fig. 5 validates the accuracy assessment of the IBAS-DTL system on the HIS2828 dataset. The outcomes described that the IBAS-DTL method has the aptitude to gain improved training and validation accuracy values. The validation accuracy values are somewhat superior to training accuracy. A brief training and validation loss offered by the IBAS-DTL technique are reported in Fig. 6 on the HIS2828 dataset. The outcomes revealed that the IBAS-DTL methodology had been able minimum values of training and validation losses on the HIS2828 dataset.
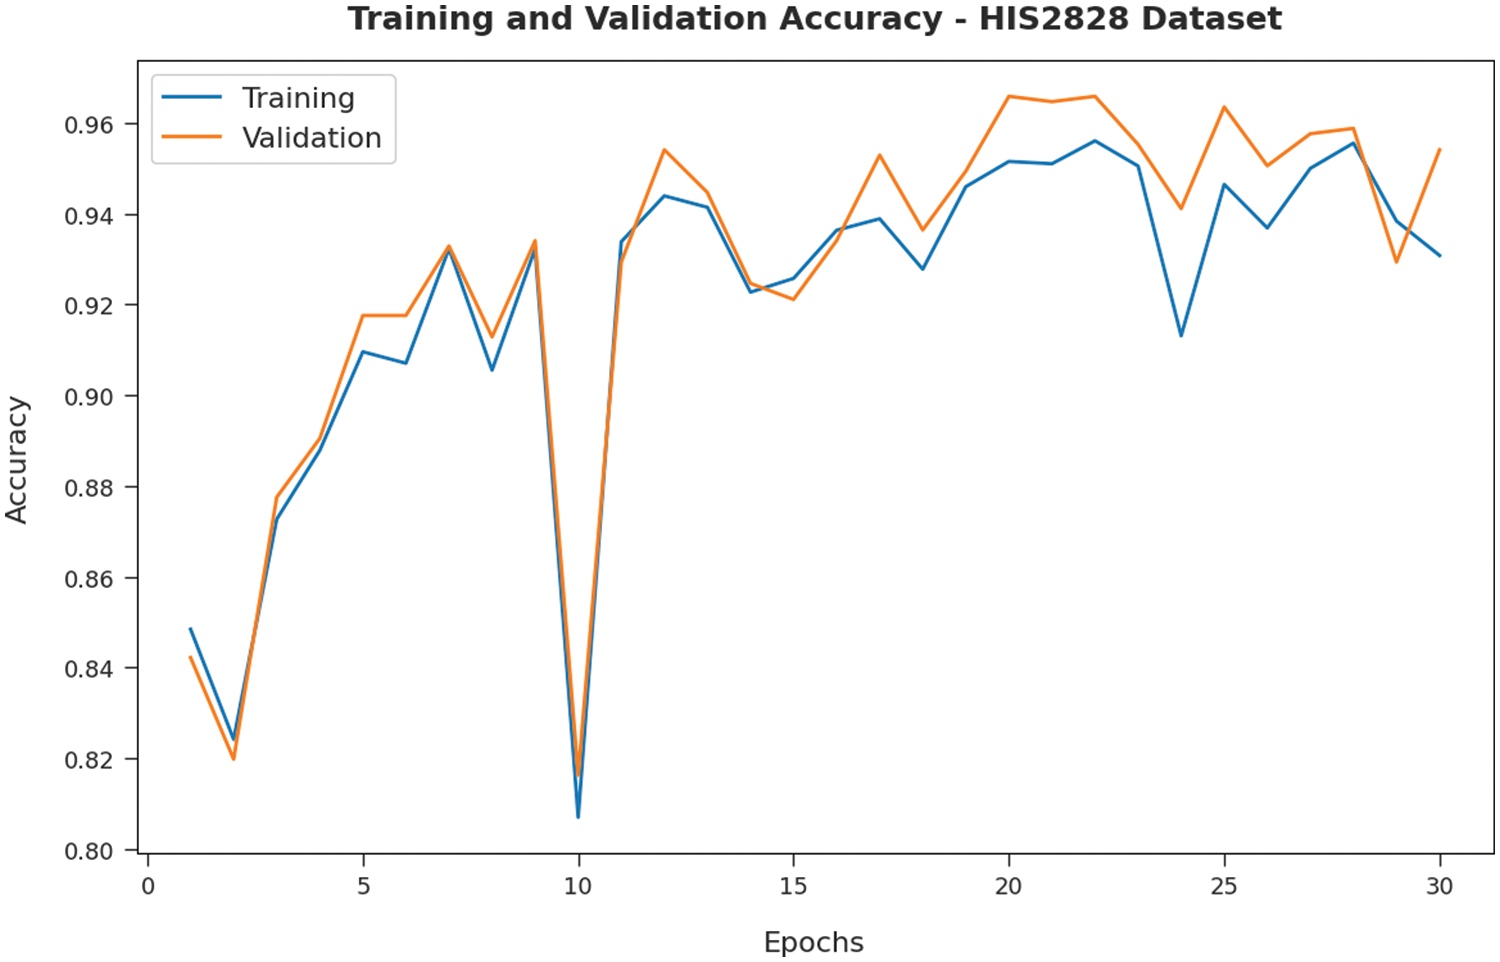
Figure 5: Accuracy analysis of IBAS-DTL technique on HIS2828 dataset
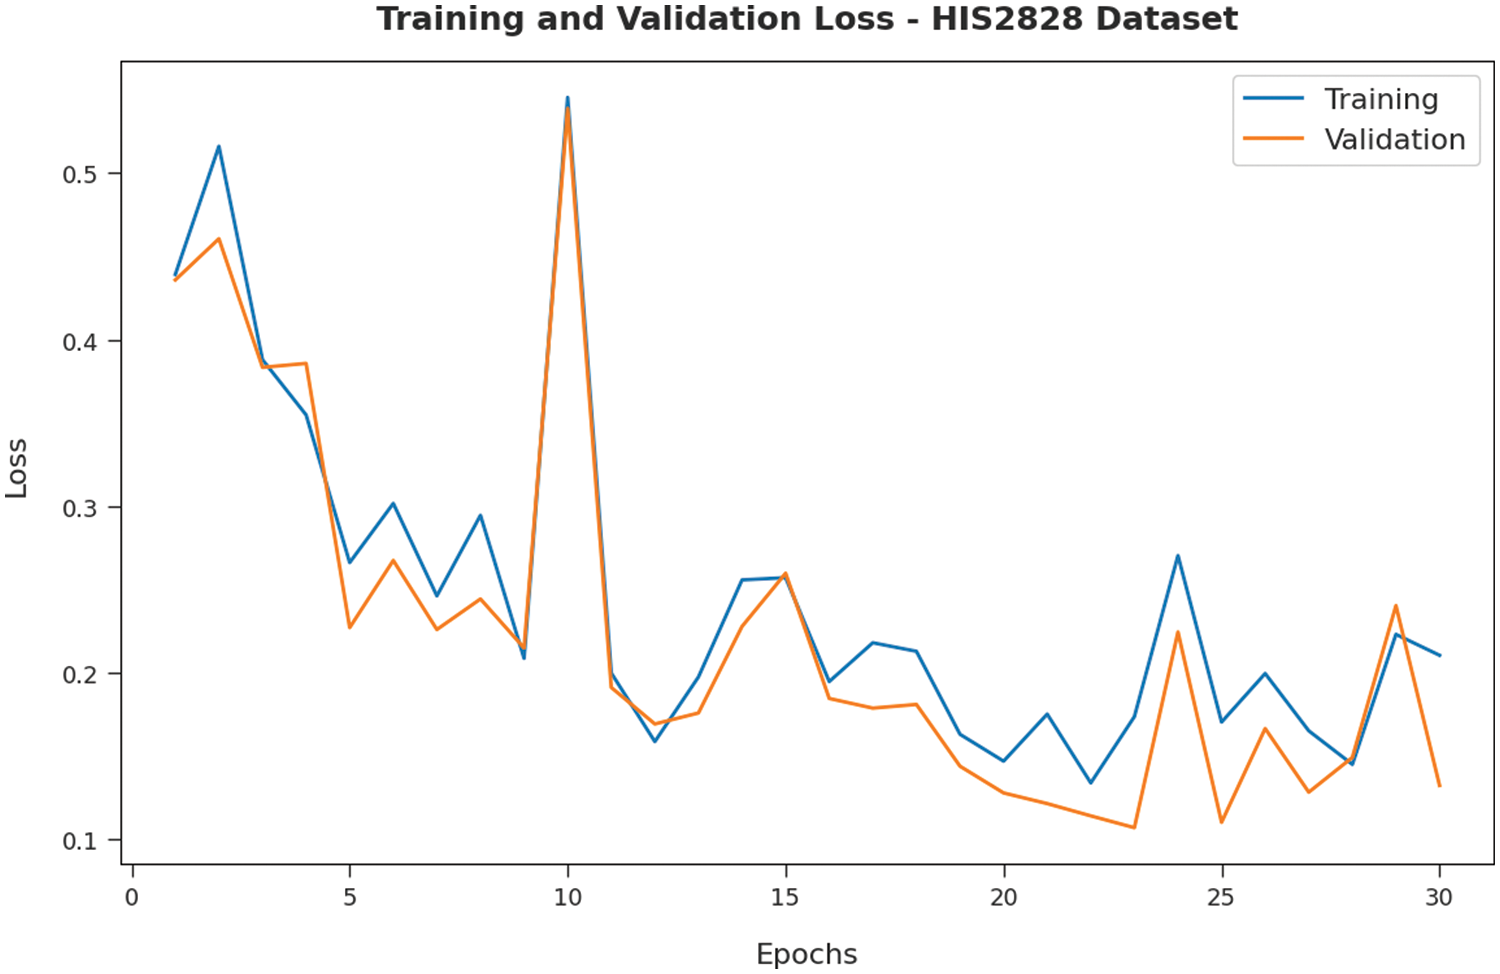
Figure 6: Loss analysis of IBAS-DTL technique on HIS2828 dataset
Fig. 7 illustrates the confusion matrices offered by the IBAS-DTL model on the ISIC2017 dataset. On the entire dataset, the IBAS-DTL model has identified 369 samples under melanoma and 1607 samples under NSK classes. In the meantime, on 70% of the training dataset, the IBAS-DTL model has identified 263 samples under melanoma and 1121 samples under NSK classes. Finally, on the 30% of the testing dataset, the IBAS-DTL model has placed 106 samples under melanoma and 486 samples under NSK classes.
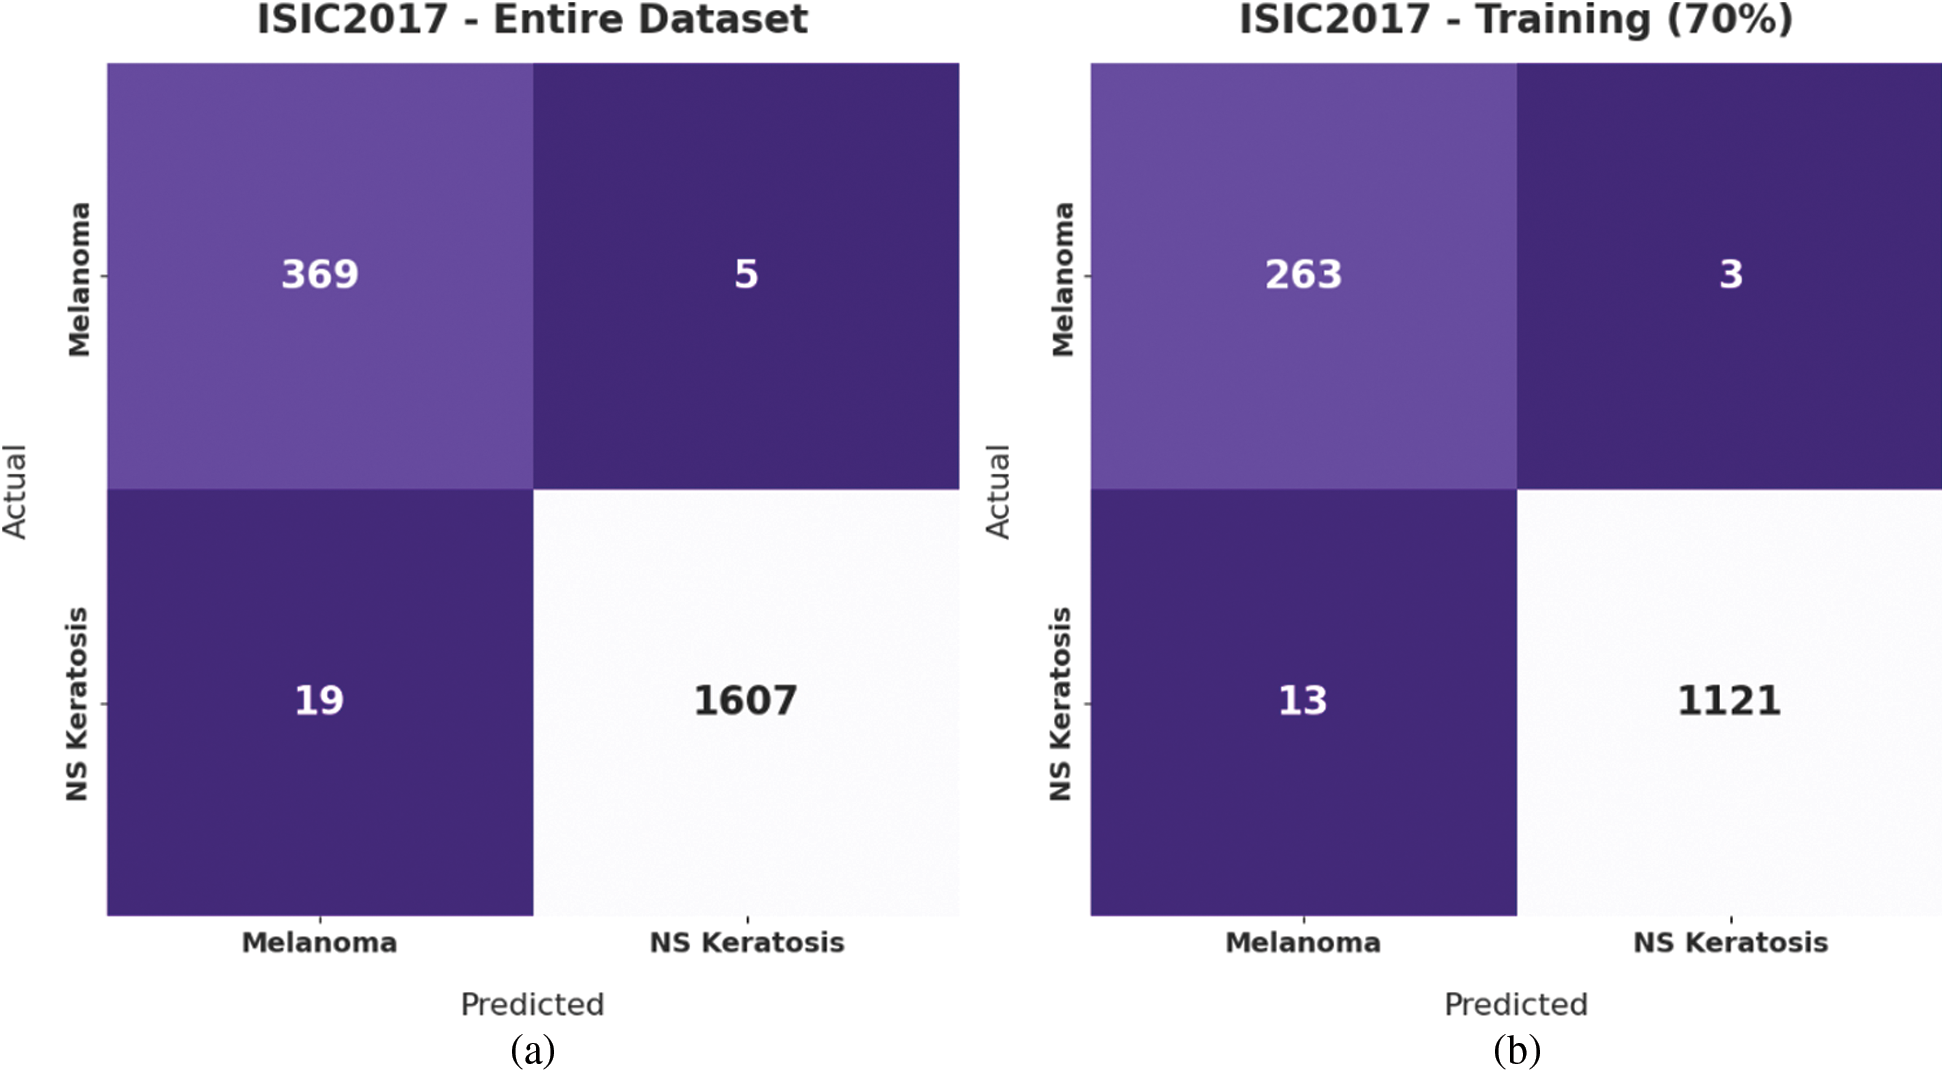
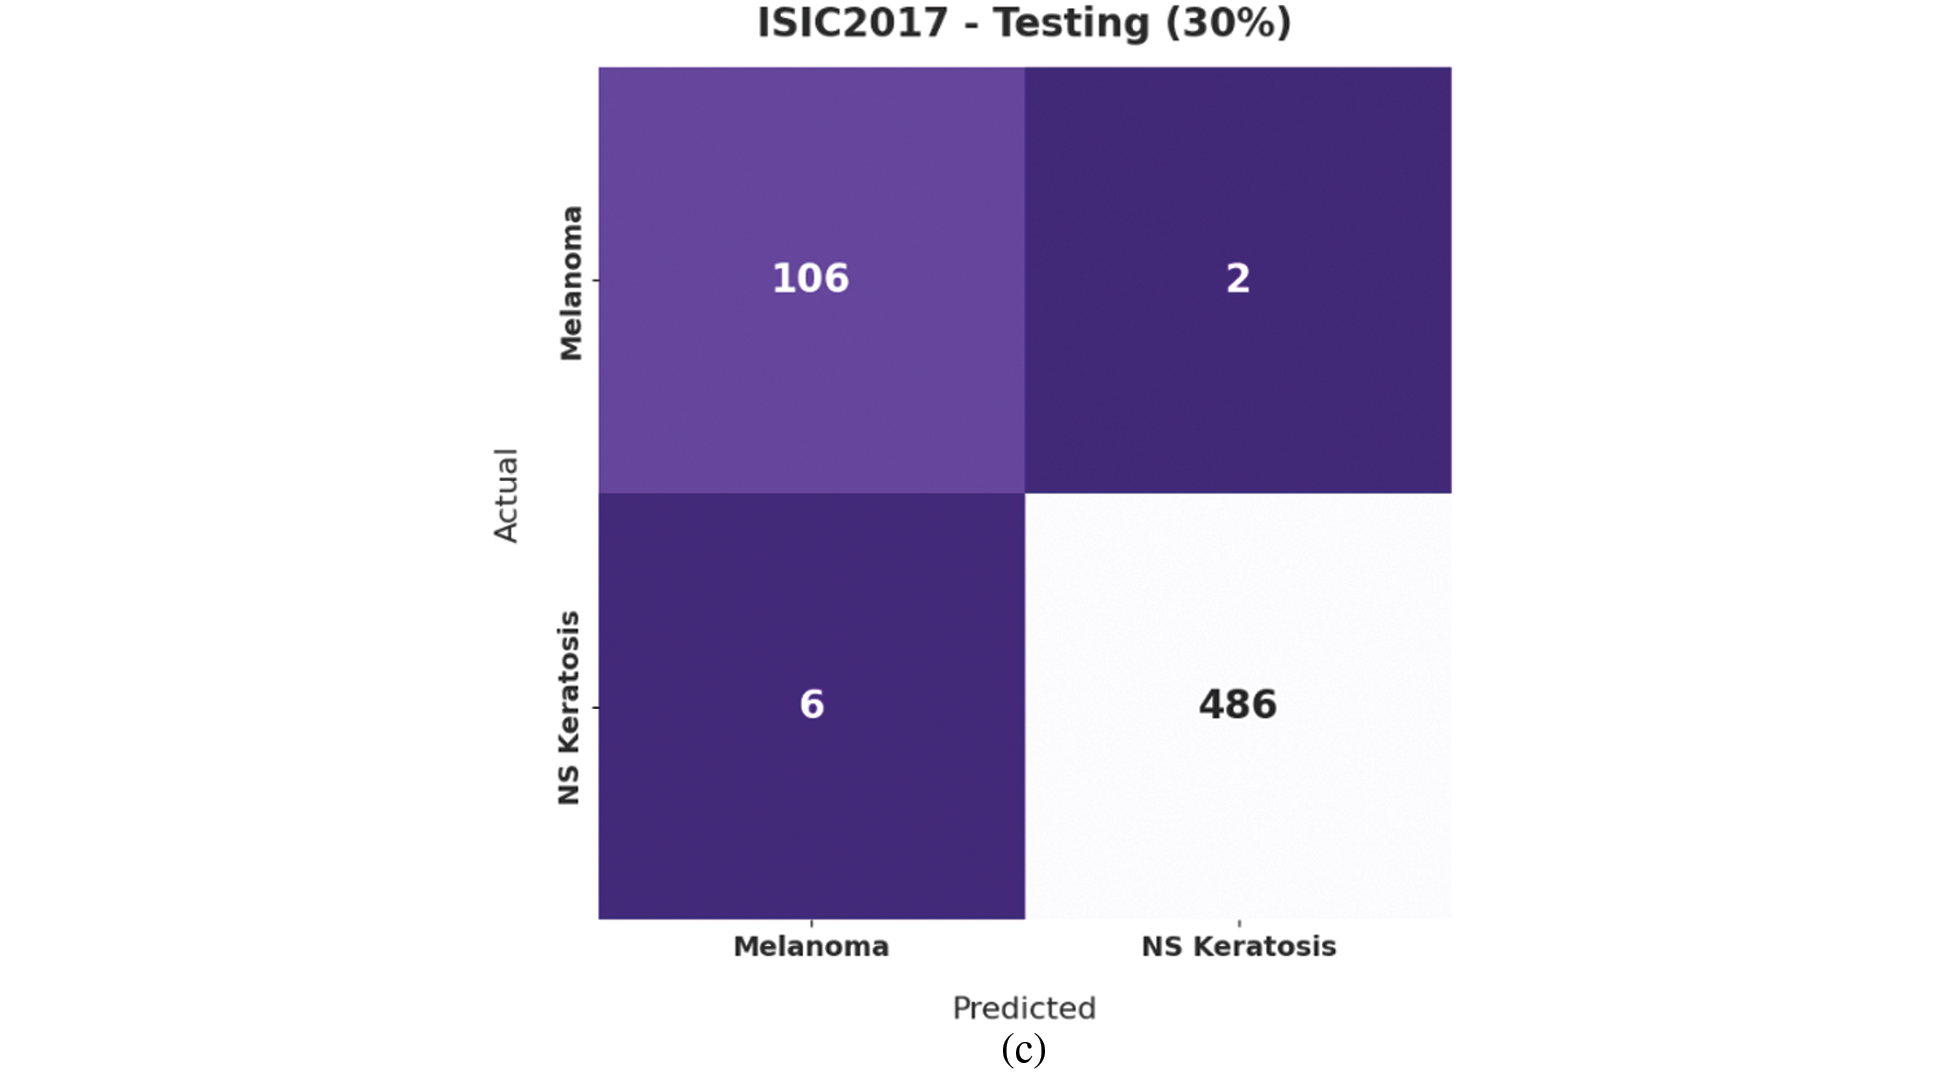
Figure 7: Confusion matrix of IBAS-DTL technique on ISIC2017 dataset
Table 2 provides detailed classification results of the IBAS-DTL technique on the ISIC2017 dataset. The experimental outcomes indicated that the IBAS-DTL approach has resulted in maximum classification results under all datasets and class labels. For instance, with the entire dataset, the IBAS-DTL system has accomplished maximum average

Fig. 8 validates the accuracy assessment of the IBAS-DTL system on the ISIC2017 dataset. The outcomes described that the IBAS-DTL method has the aptitude to gain improved training and validation accuracy values. It could be visible that the validation accuracy values are somewhat superior to training accuracy. A brief training and validation loss offered by the IBAS-DTL technique are reported in Fig. 9 on the ISIC2017 dataset. The outcomes revealed that the IBAS-DTL methodology had been able minimum values of training and validation losses on the ISIC2017 dataset.
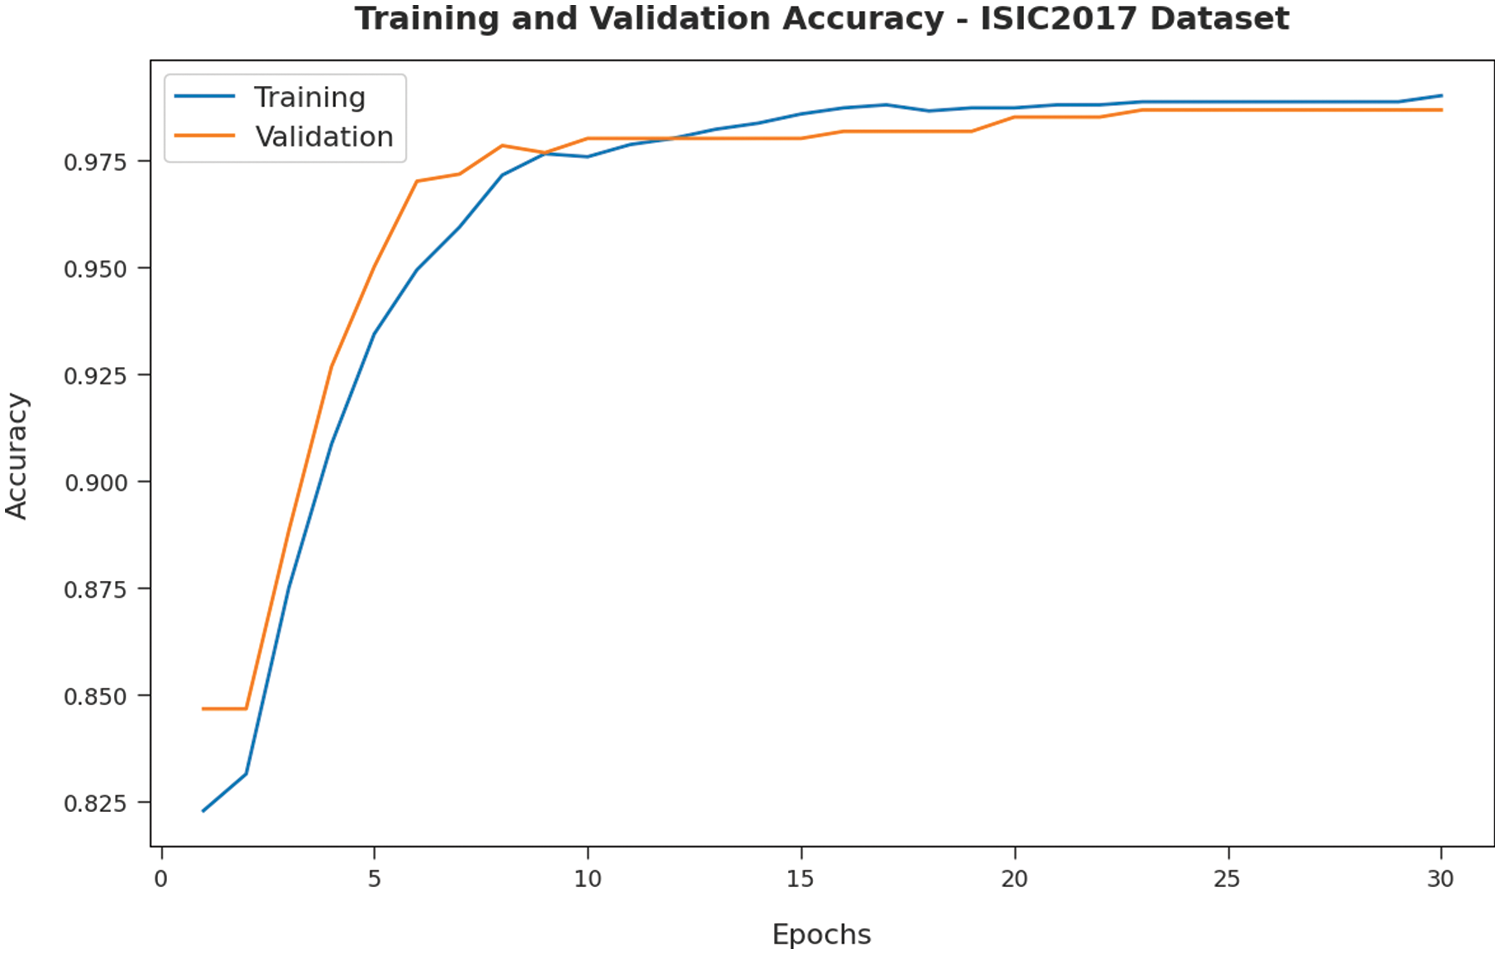
Figure 8: Accuracy analysis of IBAS-DTL technique on ISIC2017 dataset
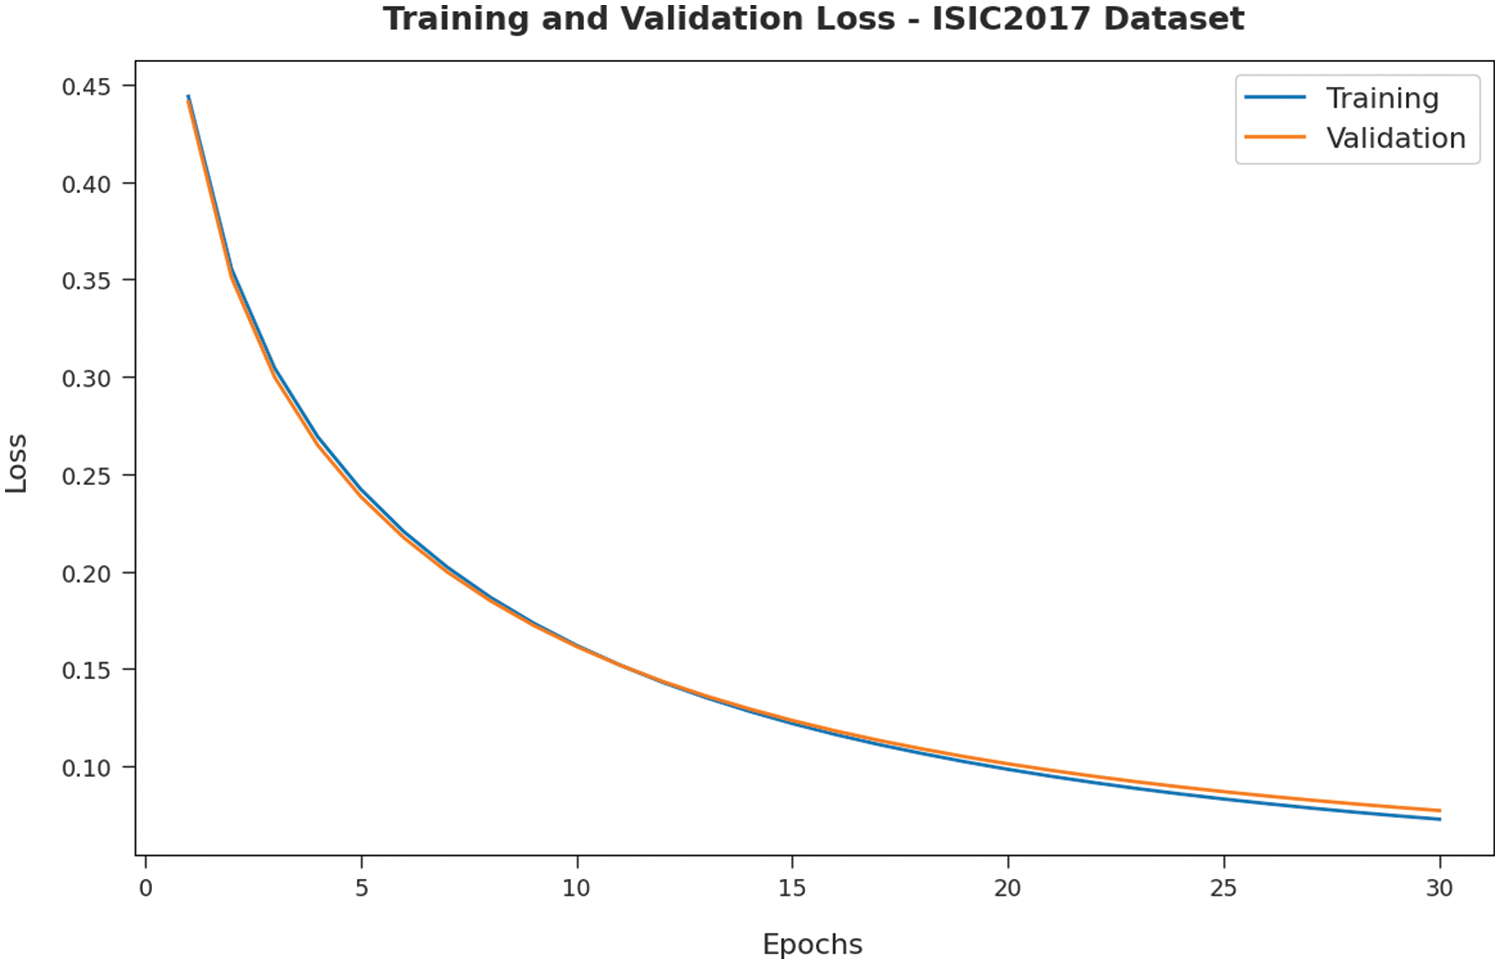
Figure 9: Loss analysis of IBAS-DTL technique on ISIC2017 dataset
To ensure the IBAS-DTL model’s enhanced performance on the HIS2828 dataset, a comparative analysis is made in Fig. 10 [19]. The figure highlighted that the SVM-TF and coding network approaches had reached lower accuracy of 74.74% and 81.34%, respectively. Then, the R-FF, SVM-TDF, and KPCA-FF models obtained slightly enhanced accuracy of 85.90%, 82.10%, and 85.55%, respectively. Next, the CNMP model has resulted in reasonable accuracy of 91.30%. However, the IBAS-DTL model has accomplished maximum accuracy of 98.29%.
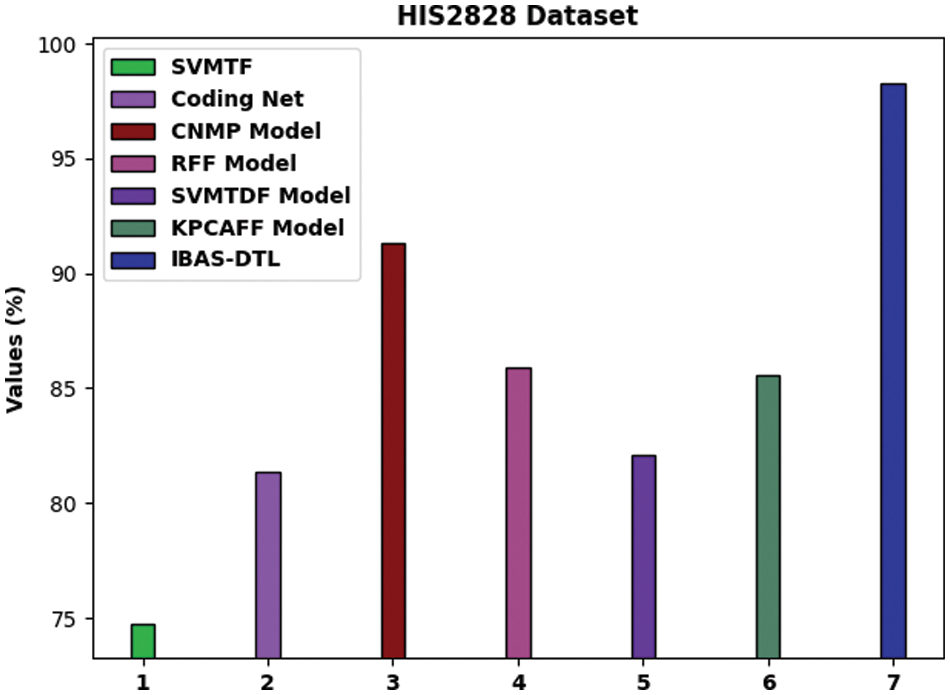
Figure 10: Comparative analysis of IBAS-DTL method on HIS2828 dataset
For providing the enhanced performance of the IBAS-DTL method on the ISIC2017 dataset, a comparative analysis is made in Fig. 11. The figure exposed that the SVM-TF and coding network approaches have reached lower accuracy of 68.16% and 74.79% correspondingly. Afterward, the R-FF, SVM-TDF, and KPCA-FF models obtained somewhat enhanced accuracy of 89.98%, 79.88%, and 89.78%, correspondingly. In addition, the CNMP methodology has resulted in reasonable accuracy of 90.86%. But, the IBAS-DTL model has accomplished maximal accuracy of 98.67%.
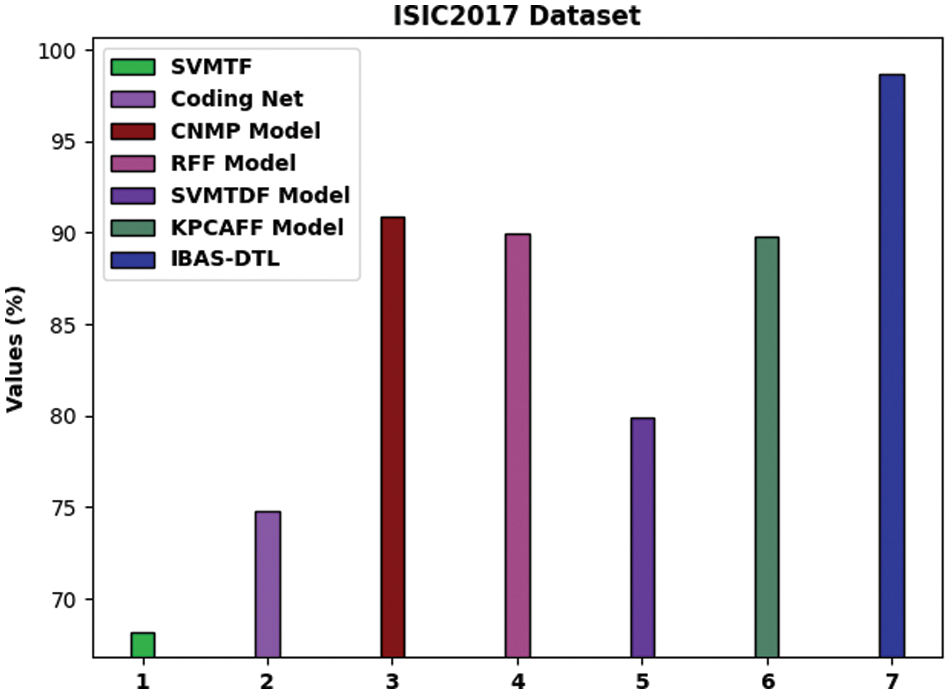
Figure 11: Comparative analysis of IBAS-DTL method on ISIC2017 dataset
By observing the above results and discussion, it can be concluded that the IBAS-DTL model can attain effective medical image classification performance.
In this work, a novel IBAS-DTL method was used to distinguish between the various types of medical photographs and to identify them. The novel EWFCM model for medical image segmentation was primarily created by the IBAS-DTLM model that was presented. Additionally, the DenseNet-121 technique was used as a module for extracting features. Additionally, the classification of the medical pictures uses the BAS with the ELM model. The best tuning of the ELM parameters is made possible by the use of BAS. The benchmark medical imaging dataset was used in various tests to demonstrate the IBAS-DTL technique’s noteworthy performance. The suggested system has a 98.67% accuracy rate. The results gained indicated the IBAS-DTL model’s superiority over its pre-existing techniques. Deep instance segmentation models may enhance the IBAS-DTLM model’s classification results.
Acknowledgement: The author extends their appreciation to the deputyship for Research & Innovation, Ministry of Education in Saudi Arabia for funding this research work through the project number (IFP-2020-110).
Funding Statement: The author received no specific funding for this study.
Conflicts of Interest: The author declares that he has no conflicts of interest to report regarding the present study.
References
1. W. Wang, D. Liang, Q. Chen, Y. Iwamoto, X. H. Han et al., “Medical image classification using deep learning,” in Deep Learning in Healthcare, Cham: Springer, pp. 33–51, 2020. [Google Scholar]
2. J. Zhang, Y. Xie, Q. Wu and Y. Xia, “Medical image classification using synergic deep learning,” Medical Image Analysis, vol. 54, pp. 10–19, 2019. [Google Scholar] [PubMed]
3. R. J. S. Raj, S. J. Shobana, I. V. Pustokhina, D. A. Pustokhin, D. Gupta et al., “Optimal feature selection-based medical image classification using deep learning model in internet of medical things,” IEEE Access, vol. 8, pp. 58006–58017, 2020. [Google Scholar]
4. P. R. Jeyaraj and E. R. Samuel Nadar, “Computer-assisted medical image classification for early diagnosis of oral cancer employing deep learning algorithm,” Journal of Cancer Research and Clinical Oncology, vol. 145, no. 4, pp. 829–837, 2019. [Google Scholar] [PubMed]
5. L. Faes, S. K. Wagner, D. J. Fu, X. Liu, E. Korot et al., “Automated deep learning design for medical image classification by health-care professionals with no coding experience: A feasibility study,” The Lancet Digital Health, vol. 1, no. 5, pp. 232–242, 2019. [Google Scholar]
6. S. S. Yadavand and S. M. Jadhav, “Deep convolutional neural network based medical image classification for disease diagnosis,” Journal of Big Data, vol. 6, no. 1, pp. 1–18, 2019. [Google Scholar]
7. X. Ma, Y. Niu, L. Gu, Y. Wang and Y. Zhao, “Understanding adversarial attacks on deep learning based medical image analysis systems,” Pattern Recognition, vol. 110, pp. 107332, 2019. [Google Scholar]
8. S. Azizi, B. Mustafa, F. Ryan, Z. Beaver, J. Freyberg et al., “Big self-supervised models advance medical image classification,” in Proc. of the IEEE/CVF Int. Conf. on Computer Vision, Montreal, BC, Canada,, pp. 3478–3488, 2021. [Google Scholar]
9. H. Hirano, A. Minagiand and K. Takemoto, “Universal adversarial attacks on deep neural networks for medical image classification,” BMC Medical Imaging, vol. 21, no. 1, pp. 1–13, 2021. [Google Scholar]
10. J. Wang, H. Zhu, S. H. Wang and Y. D. Zhang, “A review of deep learning on medical image analysis,” Mobile Networks and Applications, vol. 26, no. 1, pp. 351–380, 2021. [Google Scholar]
11. J. Cheng, S. Tian, L. Yu, C. Gao, X. Kang et al., “ResGANet: Residual group attention network for medical image classification and segmentation,” Medical Image Analysis, vol. 76, no. 12, pp. 102313–102334, 2022. [Google Scholar] [PubMed]
12. R. Singh, V. Bharti, V. Purohit, A. Kumar, A. K. Singh et al., “MetaMed: Few-shot medical image classification using gradient-based meta-learning,” Pattern Recognition, vol. 120, no. 1, pp. 108111–108124, 2021. [Google Scholar]
13. Y. Yang, Y. Hu, X. Zhang and S. Wang, “Two-stage selective ensemble of CNN via deep tree training for medical image classification,” IEEE Transactions on Cybernetics, vol. 52, no. 9, pp. 9194–9207, 2022. [Google Scholar] [PubMed]
14. Y. Dai, Y. Gao and F. Liu, “Transmed: Transformers advance multi-modal medical image classification,” Diagnostics, vol. 11, no. 8, pp. 1384–1397, 2021. [Google Scholar] [PubMed]
15. X. Tong, J. Wei, B. Sun, S. Su, Z. Zuo et al., “ASCU-Net: Attention gate, spatial and channel attention u-net for skin lesion segmentation,” Diagnostics, vol. 11, no. 3, pp. 501, 2021. [Google Scholar] [PubMed]
16. A. S. Ashour, R. M. Nagieb, H. A. El-Khobby, M. M. AbdElnaby and N. Dey, “Genetic algorithm-based initial contour optimization for skin lesion border detection,” Multimedia Tools and Applications, vol. 80, no. 2, pp. 2583–2597, 2021. [Google Scholar]
17. S. Kadry, D. Taniar, R. Damaševičius, V. Rajinikanth and I. A. Lawal, “Extraction of abnormal skin lesion from dermoscopy image using VGG-SegNet,” in 2021 Seventh Int. conf. on Bio Signals, Images, and Instrumentation (ICBSII), Kalavakkam, Tamil Nadu, India, IEEE, pp. 1–5, 2021. [Google Scholar]
18. M. K. Hasan, M. T. E. Elahi, M. A. Alam, M. T. Jawad and R. Martí, “DermoExpert: Skin lesion classification using a hybrid convolutional neural network through segmentation, transfer learning, and augmentation,” Informatics in Medicine Unlocked, pp.100819, 2022. [Google Scholar]
19. M. YacinSikkandar, B. A. Alrasheadi, N. B. Prakash, G. R. Hemalakshmi, A. Mohanarathinam et al., “Deep learning based an automated skin lesion segmentation and intelligent classification model,” Journal of Ambient Intelligence and Humanized Computing, vol. 12, no. 3, pp. 3245–3255, 2021. [Google Scholar]
20. M. A. Khan, M. Sharif, T. Akram, R. Damašsevičius and R. Maskeliūnas, “Skin lesion segmentation and multiclass classification using deep learning features and improved moth flame optimization,” Diagnostics, vol. 11, no. 5, pp. 811, 2021. [Google Scholar] [PubMed]
21. L. Hoang, S. H. Lee, E. J. Lee and K. R. Kwon, “Multiclass skin lesion classification using a novel lightweight deep learning framework for smart healthcare,” Applied Sciences, vol. 12, no. 5, pp. 2677–2693, 2022. [Google Scholar]
22. M. Talo, “Automated classification of histopathology images using transfer learning,” Artificial Intelligence in Medicine, vol. 101, no. 8, pp. 101743, 2019. [Google Scholar] [PubMed]
23. L. Li, R. Sun, S. Cai, K. Zhao and Q. Zhang, “A review of improved extreme learning machine methods for data stream classification,” Multimedia Tools and Applications, vol. 78, no. 23, pp. 33375–33400, 2019. [Google Scholar]
24. M. Zivkovic, N. Bacanin, K. Venkatachalam, A. Nayyar and A. Djordjevic, “COVID-19 cases prediction by using hybrid machine learning and beetle antennae search approach,” Sustainable Cities and Society, vol. 66, no. 3, pp. 102669–102685, 2021. [Google Scholar] [PubMed]
25. Z. Lai and H. Deng, “Medical image classification based on deep features extracted by deep model and statistic feature fusion with multilayer perceptron,” Computational Intelligence and Neuroscience, vol. 2018, pp. 1–16, 2018. [Google Scholar]
26. S. Mahajan and A. K. Pandit, “Hybrid method to supervise feature selection using signal processing and complex algebra techniques,” Multimedia Tools and Applications, vol. 2021, no. 4, pp. 1–14, 2021. [Google Scholar]
27. S. Mahajan, L. Abualigah, A. K. Pandit and M. Altalhi, “Hybrid Aquila optimizer with arithmetic optimization algorithm for global optimization tasks,” Soft Computing, vol. 26, no. 10, pp. 4863–4881, 2022. [Google Scholar]
28. N. Dilshad, A. Ullah, J. Kim and J. Seo, “LocateUAV: Unmanned aerial vehicle location estimation via contextual analysis in an IoT environment,” Internet of Things Journal, vol. 1, pp. 1, 2022. [Google Scholar]
29. N. Dilshad, J. Hwang, J. Song and N. Sung, “Applications and challenges in video surveillance via drone: A brief survey,” in Proc. ICTC, Jeju Island, SK, pp. 728–732, 2020. [Google Scholar]
Cite This Article
 Copyright © 2023 The Author(s). Published by Tech Science Press.
This work is licensed under a Creative Commons Attribution 4.0 International License , which permits unrestricted use, distribution, and reproduction in any medium, provided the original work is properly cited.
 Downloads
 Citation Tools