
 Submit a Paper
 Propose a Special lssue
 Open Access
ARTICLE

Automatic Diagnosis of Polycystic Ovarian Syndrome Using Wrapper Methodology with Deep Learning Techniques
1 Department of Mathematics, Faculty of Science, Mansoura University, Mansoura, 35516, Egypt
2 Department of Computational Mathematics, Science, and Engineering (CMSE), College of Engineering, Michigan State University, East Lansing, MI, 48824, USA
3 Sri Ramachandra Faculty of Engineering & Technology, Sri Ramachandra Institute of Higher Education and Research, Porur, Chennai, 600116, India
4 Department of Information Technology, Panimalar Institute of Technology, Chennai, 600123, India
5 Department of Computer Science and Engineering, School of Engineering, MIT Art, Design and Technology University, Pune, 412201, India
6 Department of Computer Sciences, College of Computer and Information Sciences, Princess Nourahbint Abdulrahman University, P.O. Box 84428, Riyadh, 11671, Saudi Arabia
* Corresponding Author: Doaa Sami Khafaga. Email:
Computer Systems Science and Engineering 2023, 47(1), 239-253. https://doi.org/10.32604/csse.2023.037812
Received 17 November 2022; Accepted 24 February 2023; Issue published 26 May 2023
 View Full Text
 Download PDF
Abstract
One of the significant health issues affecting women that impacts their fertility and results in serious health concerns is Polycystic ovarian syndrome (PCOS). Consequently, timely screening of polycystic ovarian syndrome can help in the process of recovery. Finding a method to aid doctors in this procedure was crucial due to the difficulties in detecting this condition. This research aimed to determine whether it is possible to optimize the detection of PCOS utilizing Deep Learning algorithms and methodologies. Additionally, feature selection methods that produce the most important subset of features can speed up calculation and enhance the effectiveness of classifiers. In this research, the tri-stage wrapper method is used because it reduces the computation time. The proposed study for the Automatic diagnosis of PCOS contains preprocessing, data normalization, feature selection, and classification. A dataset with 39 characteristics, including metabolism, neuroimaging, hormones, and biochemical information for 541 subjects, was employed in this scenario. To start, this research pre-processed the information. Next for feature selection, a tri-stage wrapper method such as Mutual Information, ReliefF, Chi-Square, and Xvariance is used. Then, various classification methods are tested and trained. Deep learning techniques including convolutional neural network (CNN), multi-layer perceptron (MLP), Recurrent neural network (RNN), and Bi long short-term memory (Bi-LSTM) are utilized for categorization. The experimental finding demonstrates that with effective feature extraction process using tri stage wrapper method + CNN delivers the highest precision (97%), high accuracy (98.67%), and recall (89%) when compared with other machine learning algorithms.Keywords
In women of reproductive age, PCOS tends to affect 12% to 21% of them, with 70% of cases going untreated. Menstrual irregularities, hyperandrogenism, reproductive issues, and metabolic consequences are frequently caused by this disease. In fact, PCOS frequently results in hormone imbalance, insulin sensitivity, and metabolic issues that dramatically increase the risks of infertility, 2 diabetes, and heart disease [1]. The early diagnosis of PCOS, which mainly depends on physical signs (such as abnormal hair developing under women’s chins), biochemical tests, and diagnostic procedures, is crucial and can help with the process of healing [2].
Considering the vagueness of the signs, detecting PCOS can be difficult. The Rotterdam definition, recommended by the Endocrine Association, calls for the existence of at least 2 different 3 health conditions: hyperandrogenism, ovulatory failure, and polycystic ovarian syndrome. In addition to these signs, a measurement of the luteinizing Harmon (LH) and Follicle-stimulating Harmon (FSH) concentrations can help determine the LH/FSH ratio. In actuality, PCOS is typically indicated by a ratio larger than two [3].
There really are a number of medical difficulties and complexity, whenever it refers to the diagnosis of PCOS, given the emergence of clinical guidelines. The uncertainty of PCOS signs and their wide range of intensity has led to a dearth of research on the identification of the condition. As an illustration, it’s been noted that PCOS has a variety of heterogeneous presentations that differ based on age and ethnicity and can be a sign of a number of additional co-morbidities. Despite the fact that doctors said they are knowledgeable about more frequent co-morbidity, including overweight, diabetic, insulin sensitivity, and melancholy, they have been less likely to link PCOS to illnesses including sleep problems, liver failure, endometrial, gestational, and stress [4].
A most commonly used machine learning approach used in medical conditions is classification systems that can distinguish between distinct groups. According to overfitting situations and expensive computing processes, large dimensional data can, nonetheless, have an impact on classifier performance. Thus, choosing the most valuable data can decrease the danger of overfitting and increase the speed and reliability of the classification techniques [5].
Some research has focused on follicle diagnosis and PCOS classification in female patients using ultrasound imaging [6,7], the initial stage of PCOS prognosis is typically evaluating people regarding clinical evaluations. Therefore, in this research, Kaggle PCOS clinical dataset was used to apply various machine learning algorithms, including Multi-Layer Perceptron (MLP), Ensemble Random Forest (RF), Ensemble Boosting, and Ensemble Extra Tree, to detect PCOS [8]. Additionally, after using several feature selection techniques (such as wrappers, filtering, and embedded methods), the average accuracy of every classifier was assessed.
As a result, the goal of this research is to develop a high-performing detection framework that uses deep learning to minimize and reduce errors that could affect the detection of PCOS. By incorporating ML within PCOS detection, This research can improve the quality of life of PCOS patients because an early diagnosis can aid in the earlier treatment of ailments, problems with reproduction, and the adoption of appropriate lifestyles to avoid excess weight and metabolic abnormalities.
The main contribution of this study is given below:
a) The feature selection process for PCOS diagnosis utilizes a three-step wrapper filter, consisting of Chi-square, Xvariance, and Relief. This approach effectively selects the optimal features for diagnosis.
b) By incorporating a deep learning classification method, the accuracy of PCOS diagnosis is improved, facilitating early detection of the condition.
c) This research endeavors to raise awareness of health issues associated with PCOS and facilitate early identification of the condition, thus promoting proactive and preventive health measures.
The rest of our research article is written as follows: Section 2 discusses the related work on PCOS detection methods and Deep learning classification methods. Section 3 shows the general working methodology of the proposed work. Section 4 evaluates the implementation and results of the proposed method. Section 5 concludes the work and discusses the result evaluation.
Research with 200 women was done in [9], of whom 150 had PCOS and the other 50 did not. The nine medical and metabolic variables that were gathered from the clients were: age, body mass index (BMI), LH, FSH, systolic and diastolic blood pressure, duration, fasting sugar levels, and post-prandial blood sugar. Using two-sample t-tests for statistical analysis, the four traits with a p-value of 0.001 or lower were chosen as being the most prominent ones. Using Bayesian (NB) and logistic regression classifiers, patients were divided into normal and PCOS categories. When applying threefold cross-validation, the Bayesian classifier was capable of achieving logistic regression (91.04 percent).
The author [10] assessed the effectiveness of numerous feature selection techniques (principal component analysis (PCA), Gain Ration, Information Gain, and Correlation-based Feature Selection (CFS)) and classifiers (support vector machine (SVM), artificial neural network (ANN)s, Decision Tree, and NB) in classifying their PCOS dataset in comparison to their proposed scheme selecting features and classification techniques (a combination of Neural Fuzzy Rough Set (NFRS) and ANNs). According to research observations, the hybrid technique would, along with other methods, obtain the best classification accuracy (83.83%) [11]. The PCOS database from Obafemi Awolowo University was classified using the C4.5 Decision Tree, NB, and MLP in [12]. The analysis indicates that C4.5 Decision Tree and MLP outperformed NB, with an average accuracy of 74.359 [13].
Implementing Kaggle PCOS the dataset, the author [14] implemented a filter-based uni-variate feature selection strategy to choose the most crucial features. Additionally, they classified PCOS using a set of ten variables utilizing gradient boosting, RF, Logistic Regression (LR), and Hybrid Random Forest and Logistic Regression (RFLR). The findings showed that RFLR may outperform alternative learners in classification performance (91.01%) and recall rate (90%) [15]. The author [16] classified the Kaggle PCOS dataset using a variety of machine-learning techniques, including RF, SVM, NB, and LR. Additionally, test results demonstrated that RF may function better than other algorithms by obtaining a categorization overall accuracy of 96%.
To categorize the Kaggle PCOS dataset, the researcher [17] assessed several feature selection and classification techniques using Python and Rapid Minder tools. According to their findings, K Nearest neighbor (KNN) and SVM acquired an accuracy rate of 90.83 percent using 10 selected features, while RF (using RapidMiner) was able to reach a rate of 93.12 percent without feature selection [18]. To choose the most useful features for their PCOS dataset, the author [19] used Decision Tree. Researchers also used RF, SVM, NB, and KNN to categorize the dataset. Results showed that RF may work better than other categories by 93.5 percent prediction performance [20]. Most of the conventional perform either feature selection or classification. This strategy of using either does not help to analyze the result perfectly. This research selected highly optimal features for predicting diseases and machine learning classifiers for the classification.
Automatic detection of polycystic ovarian syndrome consists of the following steps. Initially, collect the dataset, and next the collected dataset is pre-processed. Then the wrapper-based filter is used for feature selection. A tri-stage wrapper filter is used and then the deep learning classification methods are used for training and testing. Finally, it produces the desired output. Fig. 1 shows the overall architecture of the proposed method.
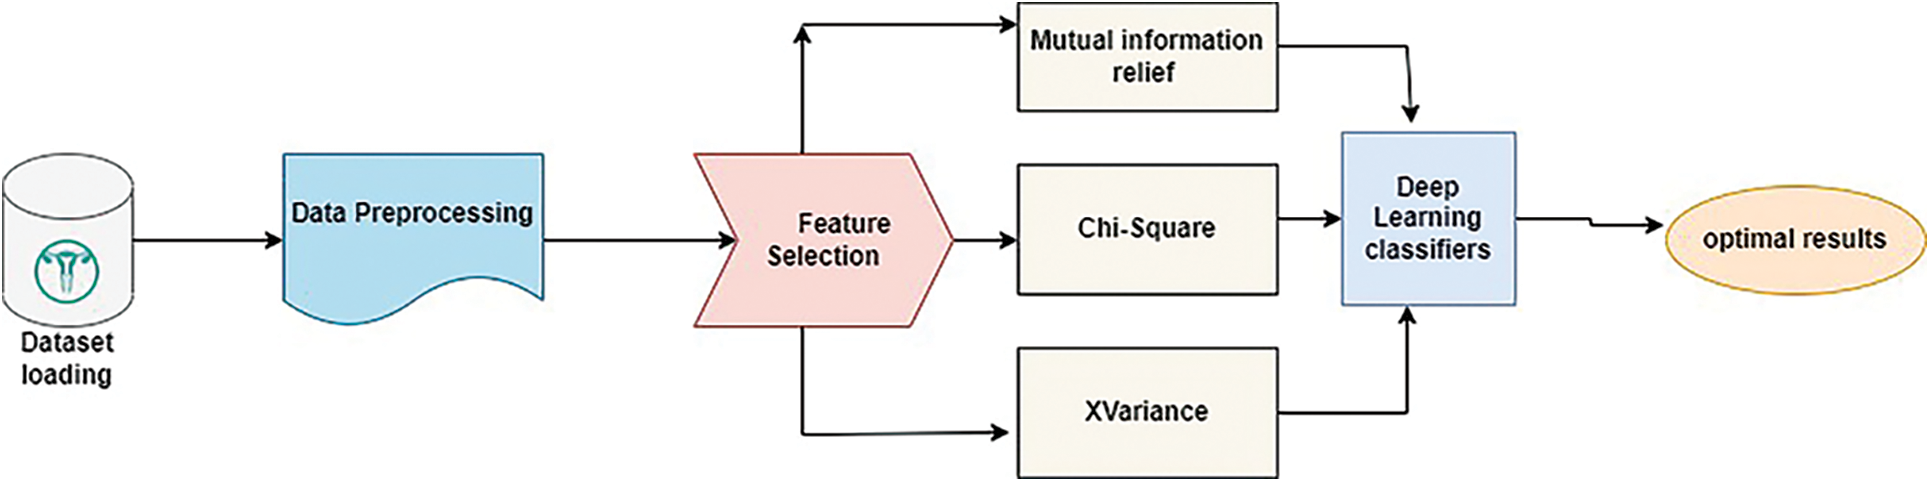
Figure 1: Architecture of proposed method
The disorder known as PCOS or polycystic ovarian syndrome is characterized by an abundance of primitive follicles in the ovary. This condition is detected through ultrasound scans that provide crucial details on the size and the number of ovarian follicles. Oocytes (eggs) grow in ovarian follicles, which are round, fluid-filled entities. Ovarian follicles showed up as dark, approximately round areas in two-dimensional ultrasound imaging. An ovary with 12 or even more follicles that are at least 2 mm in diameter and/or 10 cm3 in volume is considered to have PCOS. A good female’s uterus system depends on the quantity and size of her follicles, particularly if she’s attempting to get pregnant. Scanning with ultrasonography is non-intrusive, transportable, and reasonably priced.
As a result, ovarian ultrasound has emerged as a useful method for identifying ovarian follicles and diagnosing PCOS. Therefore, speckle noise in ultrasonic imaging results in poor image quality. This disruption makes it difficult for medical professionals to employ manual diagnostics to identify ovarian follicles. Manual assessment and classification are time-consuming, difficult, and frequently inaccurate. So the proposed deep-learning-based automatic diagnosis helps to reduce manual errors and also improves classification accuracy.
The “Polycystic Ovary Syndrome” dataset that we’re working with is one that was discovered in the databases of the online group “Kaggle”. There are 541 subjects—177 of whom have PCOS and 364 of whom are healthy—represented in the dataset along with their medical and physiological features. The dataset contains 39 variables, including metabolic control (9), physical dimensions (16), ultrasound imaging variables (3), hormone variables (9), and biochemical markers (2). Such characteristics have included patients’ body mass index (BMI), height, age, blood type, hypertension, cycle duration, endometrial thicknesses, and FSH concentrations, among others. In Kerala, India, ten separate hospitals provided the information.
Data from electronic health records (EHRs) is typically “complicated” in that it could be sparse, loud, or inaccurate. So, extensive data cleansing procedures are required before conducting any research. Therefore, preprocessing the available dataset is the initial step in any DL application. Preprocessing entails removing mistakes and incompleteness from the data as well as applying other modifications and adjustments.
3.2.1 Finding and Sorting Errors and Outliers
Outliers in medical records are excessive numbers in a database that aren’t usually thought of as mistakes, but instead as a sign of the patient’s health. In this situation, the outliers might offer valuable information about the patients’ ailments. However, alternative results can indicate human mistakes, so the information must be taken into account for elimination or modification to prevent creating a biased model. Following consultation with an OB-GYN, this research identified the result as almost an abnormality or a mistake. The subject whose information had a mistake was removed, but the outlier was left in the database [21–25].
3.2.2 Uniformity of the Information
Identification of the dataset was completed once the errors were found and eliminated. Data standardization, which converts the characteristics to match a similar scale such that the bigger numeric characteristics do not dominate others with lower values, is a crucial stage in the pre-processing method [26,27].
In this work, Adaptive Normalization is used after the standardization of data. It contains four normalization methods. They are Min-max, Interval, Decimal Scaling, and Z-score normalization. Fig. 2 shows the four types of normalization that forms the Adaptive Normalization method [28,29].
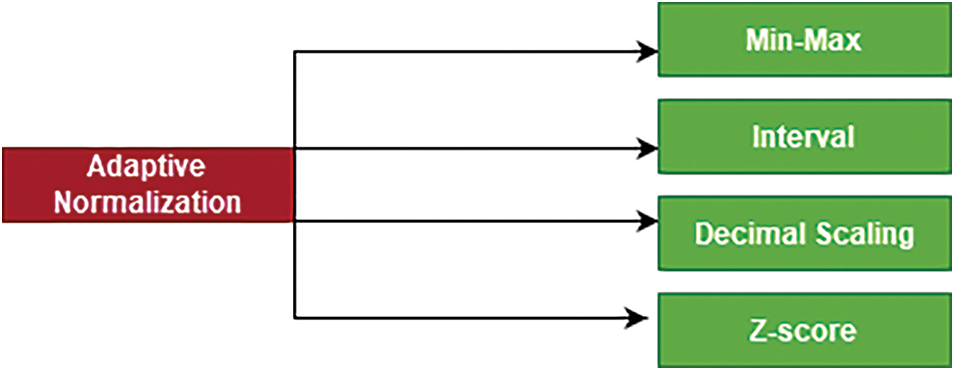
Figure 2: Adaptive normalization method
To enter the system, the input data is split into mini-batches. Next, the basic quantities like the mean and variance required for normalization are computed and modified. Every one of the updating techniques uses exponentially weighted means, which can eventually adapt to the worldwide spread by memorizing historical information. The normalizing layer also includes the z-score, intervals, decimal calibrating, and min-max normalization analytical approaches.
Z-score transforms the information to a phase with a mean of 0 and a variance of 1, while min-max normalizes the information to a range between (0–1). By deleting the positive and negative data, the decimal calibration normalization approach can swiftly scale the data and better affect negative values. The interval normalization is comparable to decimals calibrating in that it can normalize the information to the action-packed intervals of the activation function while retaining the negative information in the data. To produce results that have been normalized, the four normalization algorithms’ outputs must be computed using the normalization layer’s settings. The normalized values can be translated and scaled using the variables, sizing, and translating parameters. Backpropagation can be used to train the values such that adaptive normalization can be achieved.
3.3 Feature Selection Using a Tri-Stage Wrapper Filter
The MI of two different parameters is a measurement of how reliant they are on one another in cognitive science, probability, and statistics. By only monitoring how a random variable is changing in relation to some other binomial distribution, it may be measured how much data can be found from it. As the reduction of ambiguity of a random vector can be computed if a parameter is analyzed, it is closely related to the concept of entropy. Therefore, a higher MI number indicates a significant reduction in ambiguity, while a low value indicates a minor reduction in uncertainty. The randomly generated factors are said to be independent of one another if the MI is zero. The MI among P and Q, assuming they are both randomly initialized, can be expressed as
Here
The independence among a characteristic and its classes are measured by the CS
Here c describes the number of classes and I denote the number of intervals. Fm = z * pm, where z is the overall number of instances, and f pm is the possibility that event I will occur. Greater reliance here between features is seen when CS is lower.
Rendel and Kira created Relief at first. After addressing its shortcomings, the relief algorithm was extended to create RFF. RFF can categorize multiclass issues while the basic relief method can only categorize binary class problems. In essence, the relief method computes the rank of a feature based on how well it can distinguish among occurrences that are closely related to one another. RFF randomly chooses a candidate instance ‘Ii’, then searches for nearest neighbor hits with the same class ‘hc’, followed by k nearest failures ‘mc’ from each of the categories. The weight of each characteristic is then updated by RFF by combining the contributions of all pluses and minuses. The main distinction between relief and RFF is the number of hits and misses, which makes the method more resistant to disturbance.
The characteristic will be ranked higher if the range or XV value is higher. Assume that for a characteristic X, n instances of class I are available, as shown by Xi, and m examples of class k are visible, as shown by Xk. The variation of the n and m samples in the Xi and Xk sample sets must be computed in order to establish the XV of characteristic X with regard to class; the resulting sum would be taken into account.
3.4 Classification of PCOS Using Deep Learning Methods
The generated dataset was split into training and testing segments using tenfold cross-validation in diagnosing patients with PCOS or even without PCOS using deep learning techniques. Four classification techniques—MLP, CNN, RNN, and Bi-LSTM—were applied to the training dataset in 2 stages, either with or without feature selection techniques.
Although each patient may experience a unique set of symptoms or a variety of signs, the method of producing a diagnosis may be mostly based on the most important characteristics. Thus, feature selection methods might be extremely important in order to choose the most useful features and lower the dataset’s dimensionality to aid doctors in the process of diagnosis.
Across both datasets, including datasets with complete characteristics and datasets with reduced features, the efficiency of the classification algorithms was assessed. Consequently, the first stage was classifying the dataset using four classification methods and calculating each classifier’s efficiency. Fig. 3 shows the workflow of proposed method.
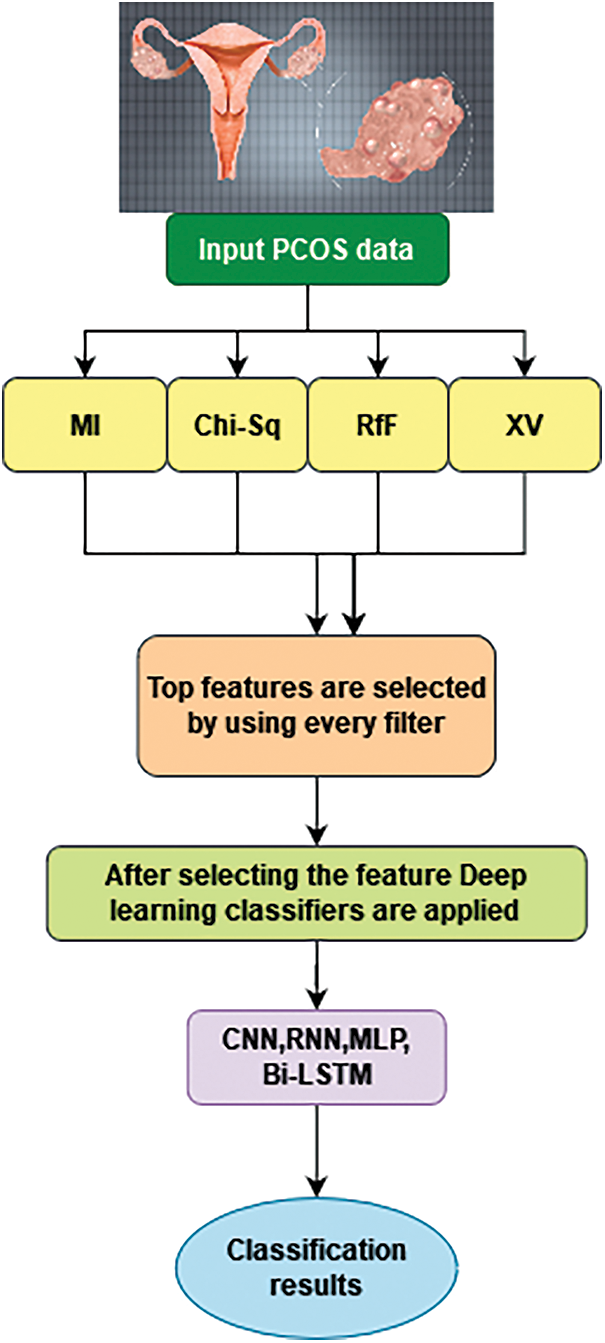
Figure 3: Workflow of the proposed method
After preprocessing, the features are selected using a tri-stage wrapper filter. A wrapper filter such as MI, RfF, Chi-Square, and XV are applied and the best features are selected. Next, deep learning classifiers such as CNN, RNN, MLP, and Bi-LSTM are applied. Finally, the optimal classification results are obtained.
Recurrent Neural Networks (RNNs), Convolutional Neural Networks (CNNs), Multi-Layer Perceptron (MLPs), and Bidirectional Long Short-Term Memory (Bi-LSTM) are all popular deep learning algorithms that have been used for PCOS (Polycystic Ovary Syndrome) classification. RNNs are well-suited for sequential data such as time series or sequential imaging data. They can handle temporal dependencies and maintain the memory of past inputs to predict the current output. CNNs are designed to process image data and have proven to be effective in medical image classification tasks. They have the ability to automatically learn hierarchical feature representations that capture spatial relationships in the image data. MLPs are feedforward neural networks with multiple layers and non-linear activation functions. They can be used to classify high-dimensional data, but may not be well-suited for sequential or spatial data. Bi-LSTM is a variant of RNNs that can handle sequential data and process the information in both forward and backward directions. This makes them useful for processing sequences with long-term dependencies and for tasks such as sentiment analysis and machine translation.
In this research obstetrician-gynecologist (OB-GYN) is used to learn more about the assessment metrics that physicians often seek within medical applications before deciding on the assessment metric to use for the wrappers. Following a detailed debate, it became obvious that lowering the frequency of false positives (FP) is crucial to preventing patients from receiving treatments that are more harmful than helpful. Fig. 4 shows the PCOS samples used for classification. This research uses python 3.4 for implementation in the windows 64-bit operating system.
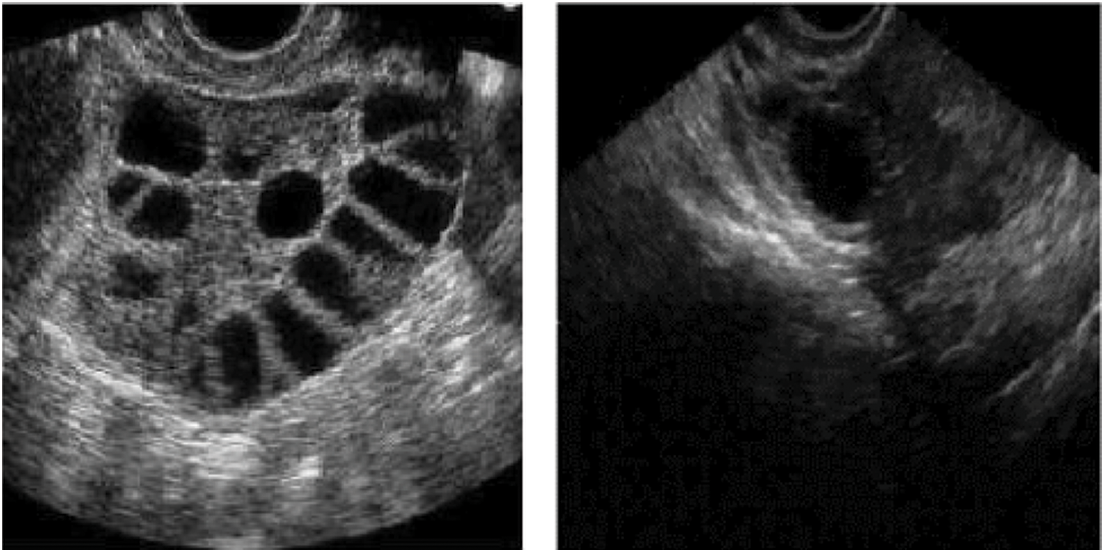
Figure 4: Sample PCOS dataset from Kaggle
The proposed automated polycystic ovarian syndrome detection uses the following metrics such as accuracy, precision, recall, ROC curve, and confusion matrix. Table 1 shows the PCOS features used for classification with physician suggestions.
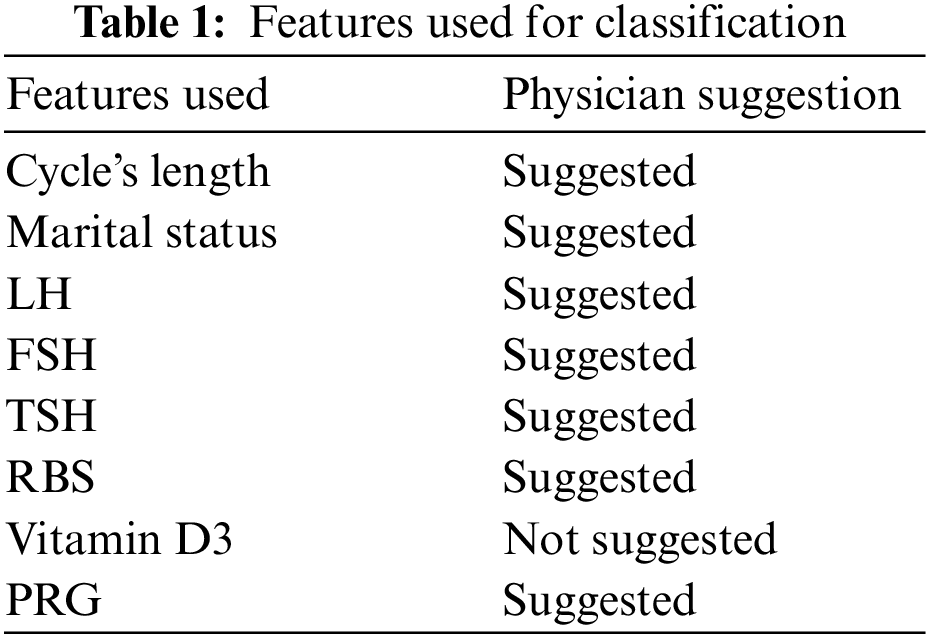
Fig. 5, shows the features used for classification suggested by the physician. The sphere plot shows the importance of features suggested by physicians. These features are used for further classification.
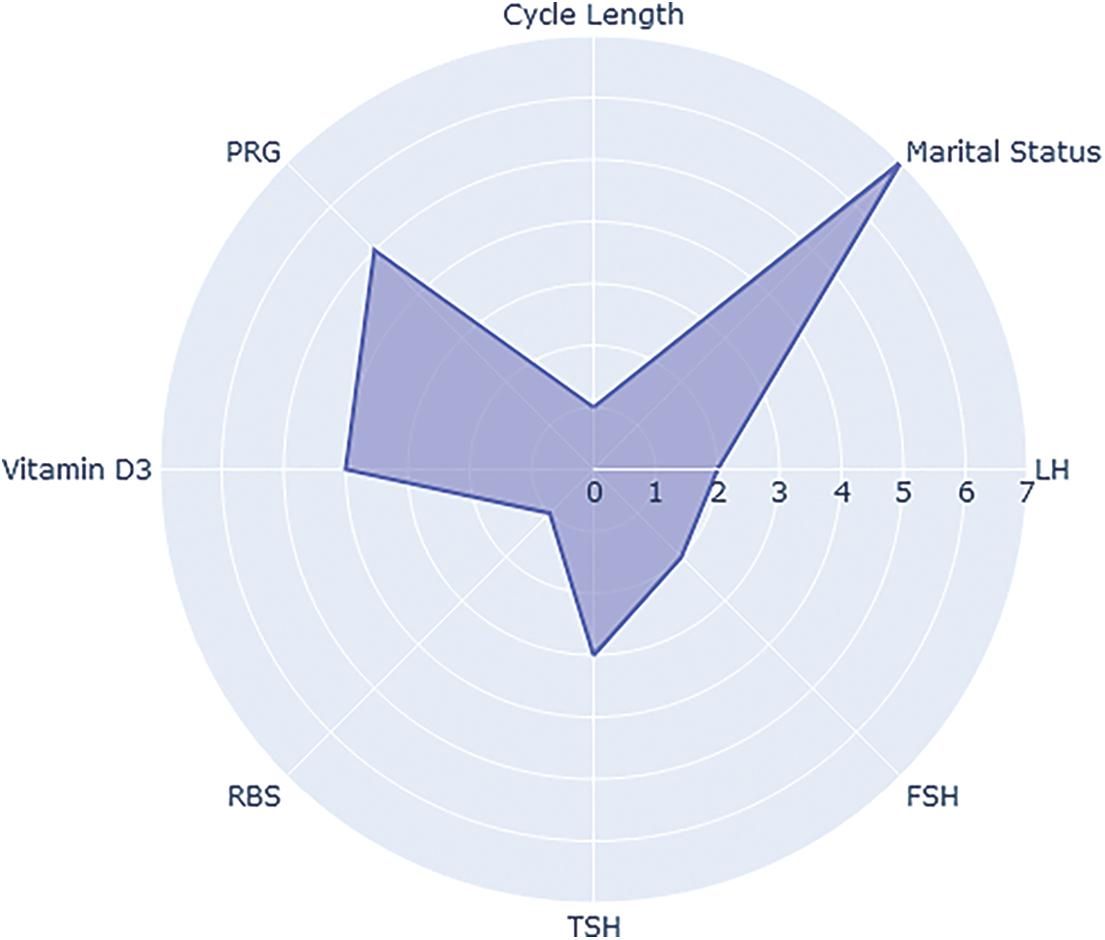
Figure 5: Sphere plot based on PCOS features
Considering high precision, accuracy, and recall [30] as demonstrated in Eqs. (3)–(5), indicates that a small quantity of FP was attained, and precision was selected as the examined value.
This displays the overall percentage of classes that were successfully predicted. The terms True positives (TP), true negatives (TP), and false negatives (FN) are used for result evaluation.
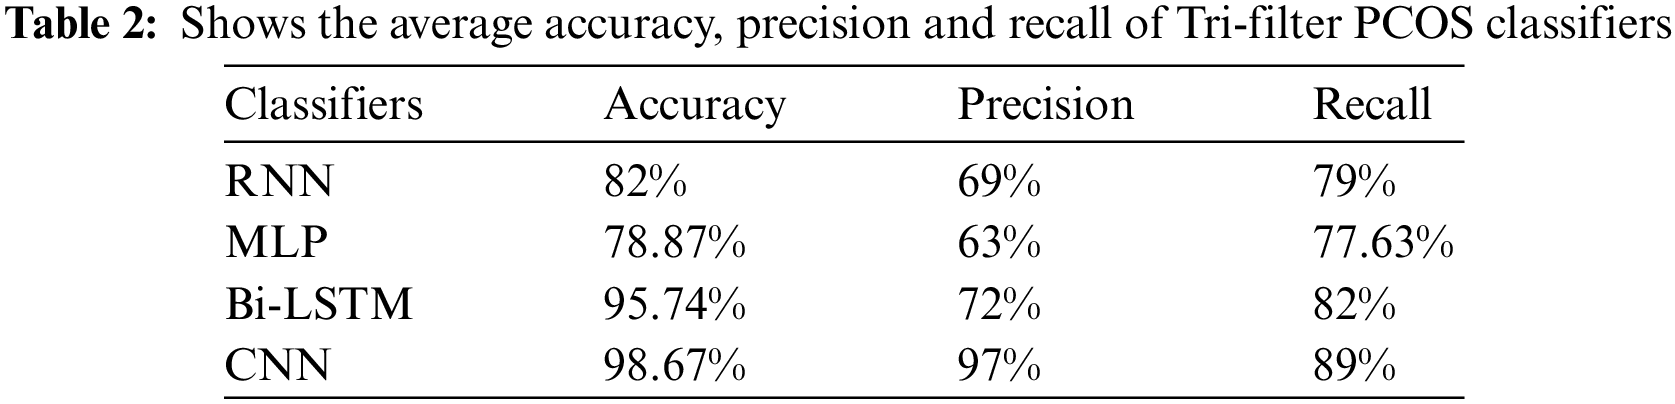
Fig. 6 shows the accuracy level of using deep learning methods. Even if the Bi-LSTM’s accuracy rate (95.74 percent) remained unchanged when compared to how well it performed when using the entire dataset, a Tri-Stage wrapper filter approach could raise the average accuracy of many other classifiers. Because CNN had the greatest values of TP and TN in the predictions of PCOS class labels, it was able to outperform all other classifiers in terms of accuracy rate (98.67%) on the smaller set of data Table 2. Furthermore, the MLP classifier performance (78.87) is better than that of its rivals based on the lowest level of FN. When the same techniques are computed with a double filter, the accuracy of the model is affected with a 10% loss on prediction.
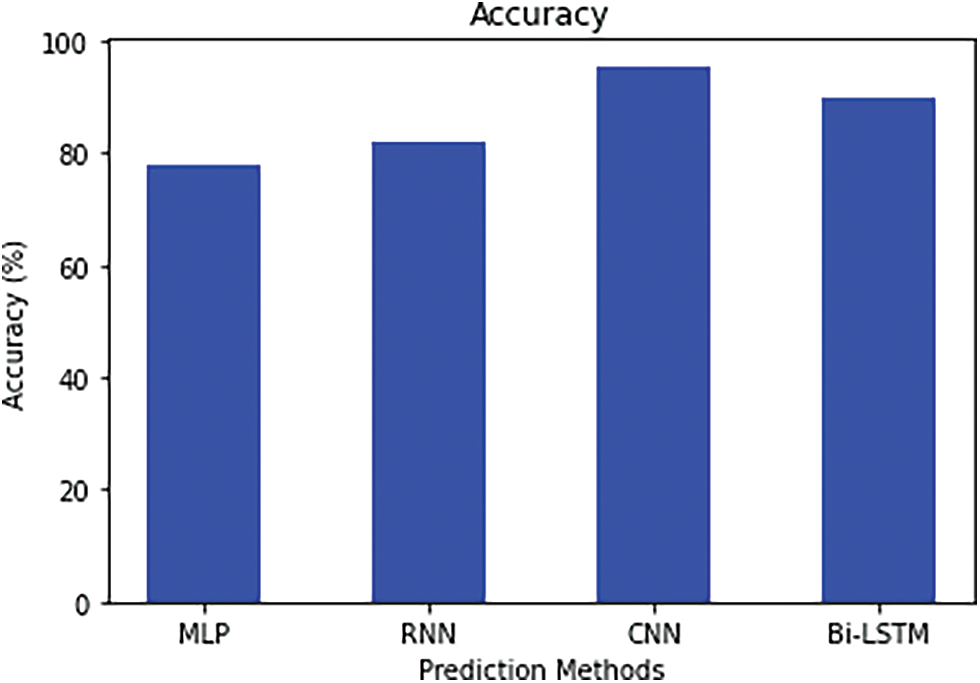
Figure 6: Accuracy
The percentage of anticipated classes that are labeled as all positive categorized labels is shown.
Fig. 7 the precision rate is shown. As a result, according to classifier’s high precision (97 percent) and MLP’s low precision 63%, respectively. Furthermore, the least rate of FN and highest sensitivity 72% of Bi-LSTM are related.
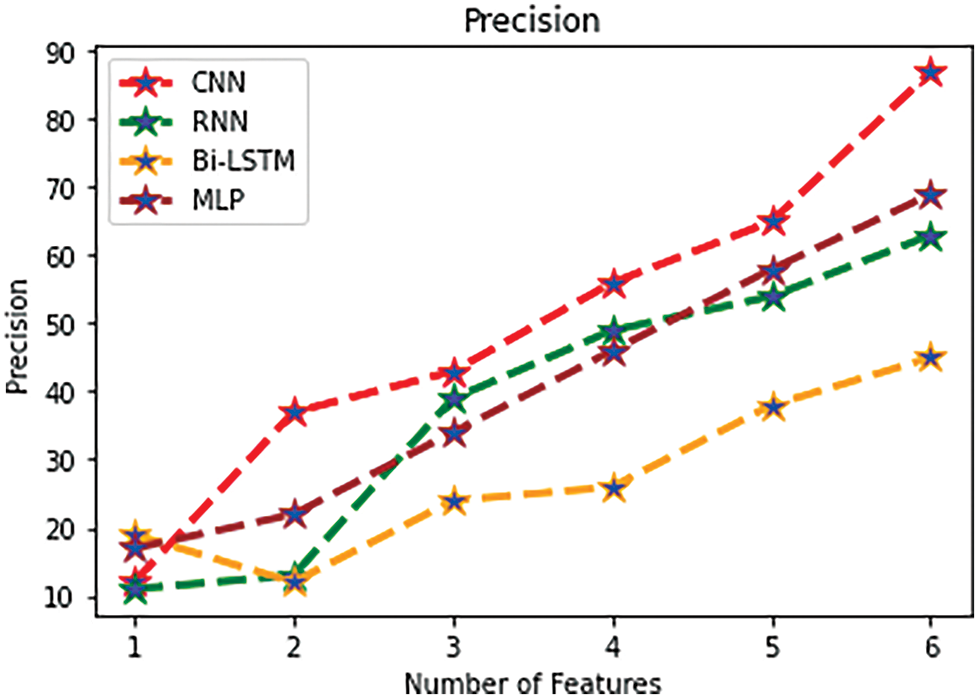
Figure 7: Precision
It specifies the percentage of PCOS-positive class labels that are actually positive labels.
Fig. 8 shows the recall rate of PCOS data. Additionally, because the recall rate of all classifiers displayed its best amount, the CNN method was able to successfully enhance the productivity among all classifiers by taking into account their accomplishments of the largest value of TN and TP and the smallest value of FN and FP. Consequently, a CNN classifier may achieve a greater recall rate using the dataset’s 28 attributes 89%.
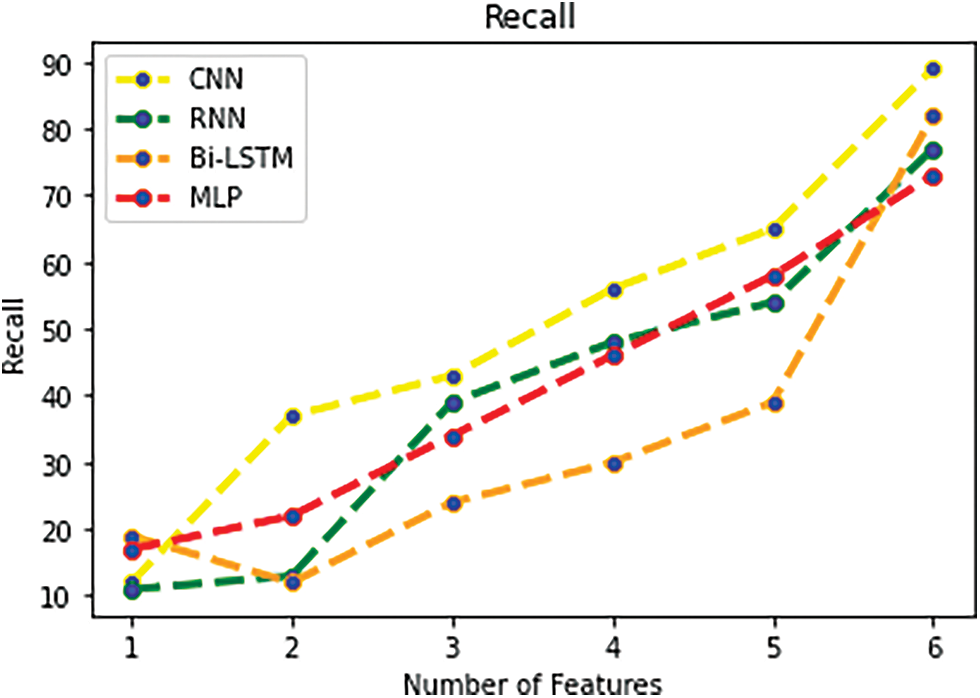
Figure 8: Recall
Fig. 9 shows the ROC curve of PCOS dataset. The CNN achieves higher performance using a tri-stage wrapper filter features. Comparing with other classifiers the CNN gains better performance.
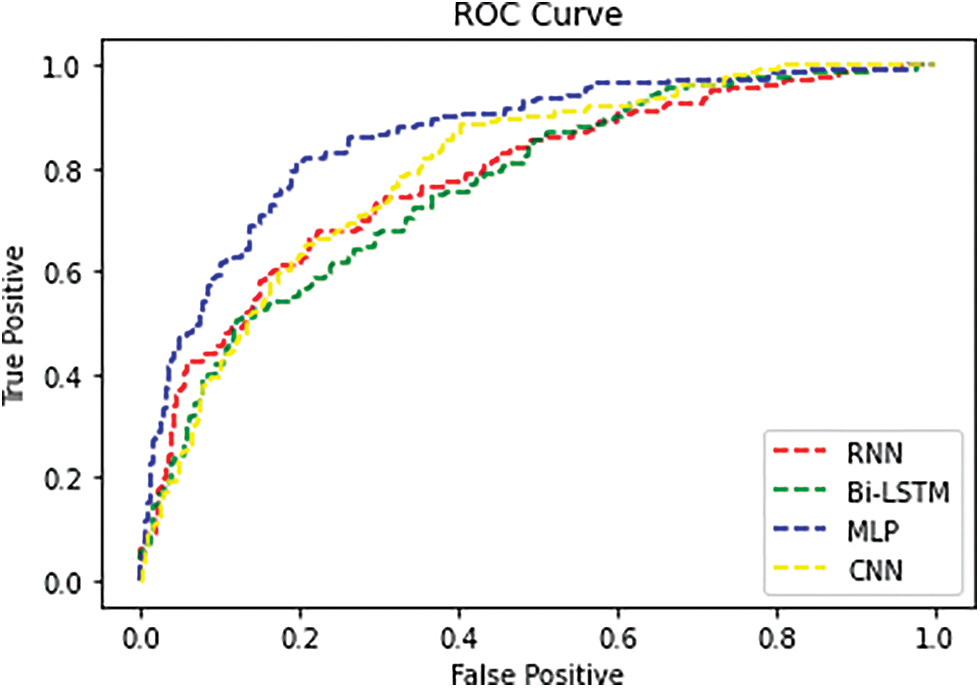
Figure 9: ROC curve for PCOS dataset
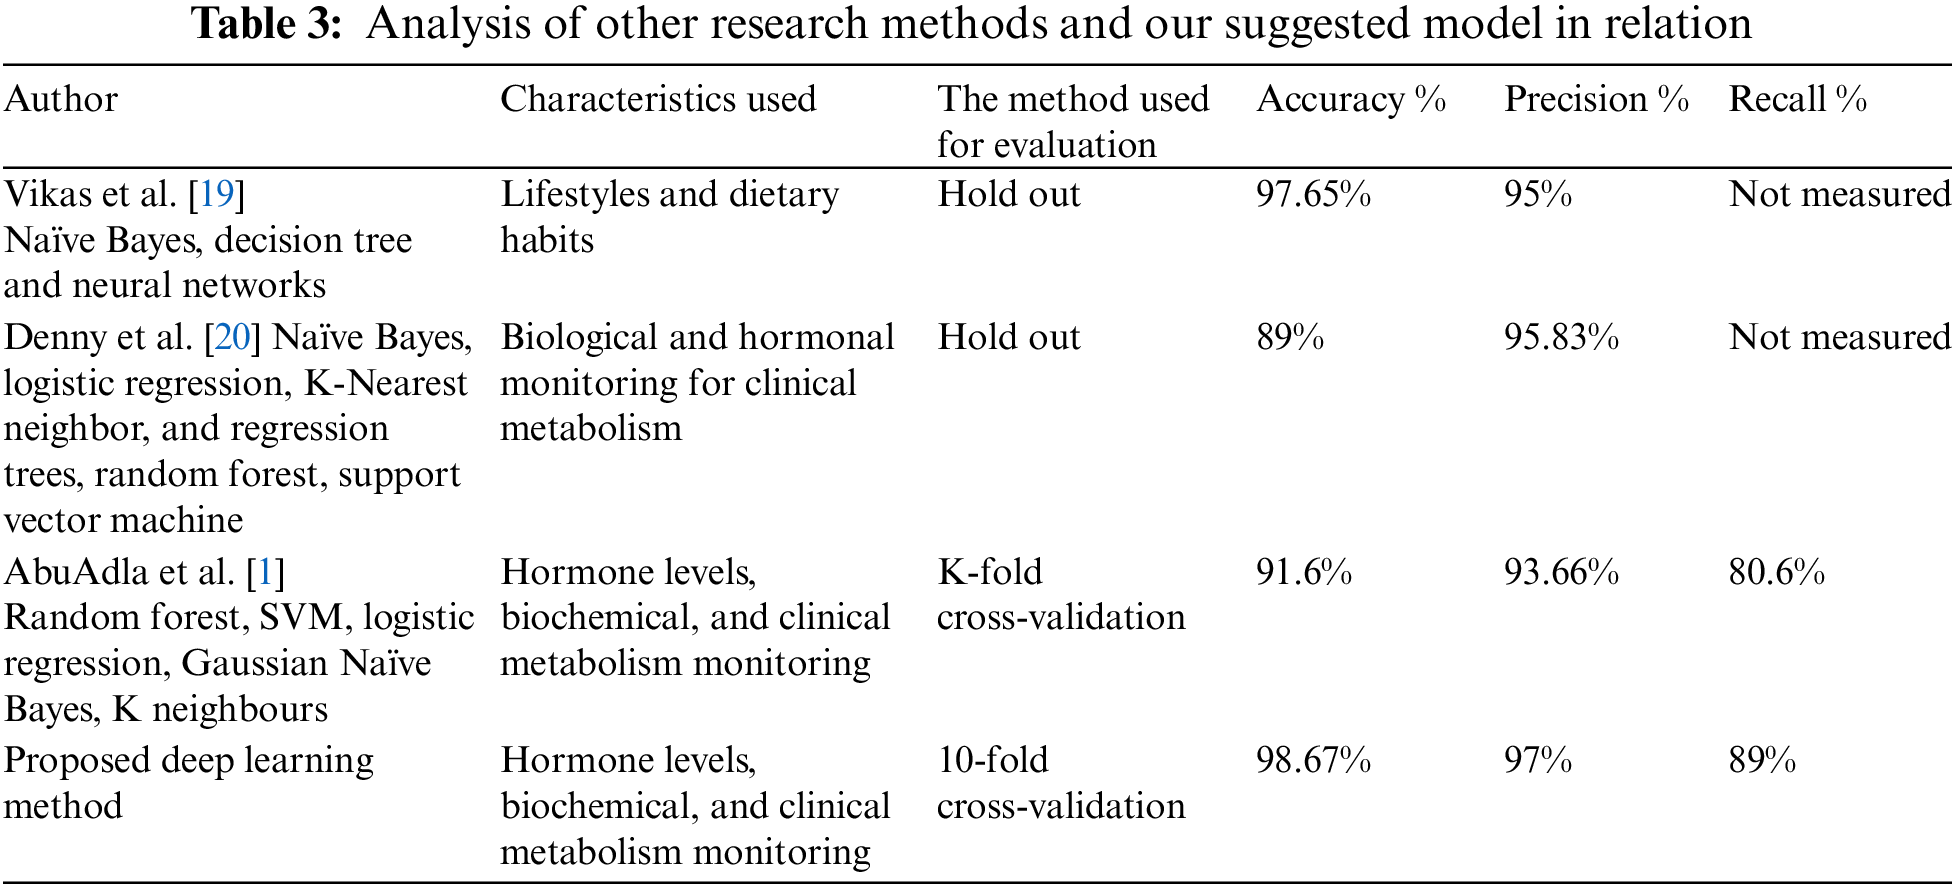
This research came to the conclusion that the suggested framework used characteristics that were dependent on medicine and performed very well when tested on a large number of people after comparing our findings to studies published on this topic. To give an example, all previous ones both did not incorporate all medically relevant variables or conducted hold-out testing on a small sample size of participants Table 3. One on either extreme, in our instance, we were able to accomplish excellent outcomes for a significant number of people despite accounting for the fact trustworthy aspects. The previously published work by Vikas et al., [19] achieved an accuracy 97.6% which is a good result. The major concern is, there is no accurate feature selection process carried out on PCOS parameters. Similarly, Denny et al. [20] obtained 89% of accuracy which is slightly smaller due to not giving importance to the feature extraction process. These researchers polished our proposed work by using better feature extraction techniques by combining the best models and testing with all the best deep learning classifiers.
The use of classification techniques to diagnose individuals with polycystic ovary syndrome has been analyzed in this section (PCOS). On a big dataset, this paper investigated various deep learning techniques employing cross-validation, statistical methods, and expert judgment. Depending on our conversations with doctors, our goal was to increase the model’s precision, recall, and accuracy. The proposed method uses a tri-stage wrapper filter method for feature selection and then the classifiers such as RNN, CNN, MLP, and Bi-LSTM are used for classification. Following recognizing the significance of automated PCOS diagnostics and achieving encouraging precision with 97%, recall with 90%, and accuracy findings with 98%, it is obvious that this study must continue and that the best strategy must be found to improve the classification results. Our investigation of the data revealed that while the classifiers’ precision was relatively good, their recall performance was not as strong. By using deep learning methods, it achieves better performance in precision, recall, and accuracy. CNN achieves greater results in automated PCOS diagnosis. In the future automatic early detection of PCOS can be detected with other symptoms in the body. Also, computer vision-based deep learning techniques can be used for early prediction.
Acknowledgement: The authors extend their appreciation to the Deputyship for Research & Innovation, Ministry of Education in Saudi Arabia for funding this research work through Project Number WE-44-0033.
Funding Statement: Deputyship for Research & Innovation, Ministry of Education in Saudi Arabia for funding this research work through Project Number WE-44-0033.
Conflicts of Interest: The authors declare that they have no conflicts of interest to report regarding the present study.
References
1. Y. A. AbuAdla, D. G. Raydan, M. Z. J. Charaf, R. A. Saad, J. Nasreddine et al., “Automated detection of polycystic ovary syndrome using machine learning techniques,” in Proc. Sixth Int. Conf. on Advances in Biomedical Engineering (ICABME), Werdanyeh, Lebanon, pp. 208–212, 2021. [Google Scholar]
2. S. Palomba, “Infertility in women with polycystic ovary syndrome,” Pathogenesis and Management, vol. 12, no. 3, pp. 213–226, 2018. [Google Scholar]
3. A. S. Peña, S. F. Witchel, K. M. Hoeger, S. E. Oberfield, M. G. Vogiatzi et al., “Adolescent polycystic ovary syndrome according to the international evidence-based guideline,” BMC Medicine, vol. 18, no. 1, pp. 1–16, 2020. [Google Scholar]
4. N. Ajmal, S. Z. Khan and R. Shaikh, “Polycystic ovary syndrome (PCOS) and genetic predisposition: A review,” European Journal of Obstetrics & Gynecology and Reproductive Biology, vol. 3, no. 4, pp. 100060, 2019. [Google Scholar]
5. K. Soucie, T. Samardzic, K. Schramer and R. Katzman, “The diagnostic experiences of women with polycystic ovary syndrome (PCOS) in Ontario,” Qualitative Health Research, vol. 31, no. 3, pp. 523–534, 2021. [Google Scholar] [PubMed]
6. T. Zhu, J. Cui and M. O. Goodarzi, “Polycystic ovary syndrome and risk of type 2 diabetes, coronary heart disease, and stroke,” Diabetes, vol. 70, no. 2, pp. 627–637, 2021. [Google Scholar] [PubMed]
7. S. Prasanth, M. R. Thanka, E. B. Edwin and V. Ebenezer, “Prognostication of diabetes diagnosis based on different machine learning classification algorithms,” Annals of the Romanian Society for Cell Biology, vol. 11, no. 4, pp. 372–395, 2021. [Google Scholar]
8. N. P. Smadja, T. M. Rawson, R. Ahmad, A. Buchard, P. Georgiou et al., “Machine learning for clinical decision support in infectious diseases: A narrative review of current applications,” Clinical Microbiology and Infection, vol. 26, no. 5, pp. 584–595, 2020. [Google Scholar]
9. K. S. Omar, P. Mondal, N. S. Khan, M. R. K. Rizvi and M. N. Islam, “A machine learning approach to predict autism spectrum disorder,” in Proc. Int. Conf. on Electrical, Computer and Communication Engineering (ECCE), Bangladesh, Cox’s Bazar, pp. 1–6, 2019. [Google Scholar]
10. S. Raghavendra and K. J. Santosh, “Performance evaluation of random forest with feature selection methods in prediction of diabetes,” International Journal of Electrical and Computer Engineering, vol. 10, no. 1, pp. 353–363, 2020. [Google Scholar]
11. H. Vassalou, M. Sotiraki and L. Michala, “PCOS diagnosis in adolescents: The timeline of a controversy in a systematic review,” Journal of Pediatric Endocrinology and Metabolism, vol. 32, no. 6, pp. 549–559, 2019. [Google Scholar] [PubMed]
12. B. Vikas, B. Anuhya, M. Chilla and S. Sarangi, “A critical study of polycystic ovarian syndrome (PCOS) classification techniques,” International Journal of Clinical and Experimental Medicine, vol. 21, no. 4, pp. 1–7, 2018. [Google Scholar]
13. R. J. Norman, D. Dewailly, R. S. Legro and T. E. Hickey, “Polycystic ovary syndrome,” The Lancet, vol. 370, no. 4, pp. 685–697, 2007. [Google Scholar]
14. D. Singh and B. Singh, “Investigating the impact of data normalization on classification performance,” Applied Soft Computing, vol. 97, no. 4, pp. 105524, 2020. [Google Scholar]
15. B. Remeseiro and V. B. Canedo, “A review of feature selection methods in medical applications,” Computers in Biology and Medicine, vol. 112, no. 5, pp. 103375, 2019. [Google Scholar] [PubMed]
16. Y. B. Wah, N. Ibrahim, H. A. Hamid, S. A. Rahman and S. Fong, “Feature selection methods: Case of filter and wrapper approaches for maximizing classification accuracy,” Pertanika Journal of Science & Technology, vol. 26, no. 1, pp. 1–15, 2018. [Google Scholar]
17. J. A. Balogun, N. C. Egejuru and P. A. Idowu, “Comparative analysis of predictive models for the likelihood of infertility in women using supervised machine learning techniques,” Computer Reviews Journal, vol. 2, no. 1, pp. 313–330, 2018. [Google Scholar]
18. I. Sumiya, N. Nabi, S. A. Khushbu, N. J. Ria and A. M. Masum, “A process of finding common symptoms and diagnosis age among PCOS patients through a survey,” in Proc. 12th Int. Conf. on Computing Communication and Networking Technologies (ICCCNT), Kharagpur, India, pp. 1–7, 2021. [Google Scholar]
19. B. Vikas, B. S. Anuhya, M. Chilla and S. Sarangi, “A critical study of Polycystic Ovarian Syndrome (PCOS) classification techniques,” The International Journal of Computational Engineering and Management, vol. 21, no. 4, pp. 1–17, 2018. [Google Scholar]
20. A. Denny, A. Raj, A. Ashok, M. C. Ram, R. George et al., “IHOPE: Detection and prediction system for Polycystic Ovary Syndrome (PCOS) using machine learning techniques,” in Proc. Conf. (TENCON), Kochi, India, pp. 673–678, 2019. [Google Scholar]
21. S. Bharati, P. Podder and M. R. H. Mondal, “Diagnosis of polycystic ovary syndrome using machine learning algorithms,” in IEEE Region 10 Symp. (TENSYMP), Kochi, India, pp. 1486–1489, 2020. [Google Scholar]
22. M. M. Hassan and T. Mirza, “Comparative analysis of machine learning algorithms in the diagnosis of the polycystic ovarian syndrome,” International Journal of Computers and Applications, vol. 975, no. 7, pp. 8887, 2020. [Google Scholar]
23. C. Neto, M. Silva, M. Fernandes, D. Ferreira and J. Machado, “Prediction models for polycystic ovary syndrome using data mining,” Advances in Intelligent Systems and Computing, vol. 1352, no. 12, pp. 1–22, 2021. [Google Scholar]
24. K. Deb, M. Abouhawwash and J. Dutta, “Evolutionary multi-criterion optimization,” in 8th Int. Conf., EMO 2015, Proc., Part II, Cham, Guimarães, Portugal, Springer International Publishing, pp. 18–33, 2015. [Google Scholar]
25. M. Awad, M. Abouhawwash and H. N. Agiza, “On NSGA-II and NSGA-III in portfolio management,” Intelligent Automation & Soft Computing, vol. 32, no. 3, pp. 1893–1904, 2022. [Google Scholar]
26. M. Abouhawwash and A. M. Alessio, “Evolutionary optimization of multiple machine learned objectives for PET image reconstruction,” IEEE Transactions on Radiation and Plasma Medical Sciences, vol. 4, no. 2, pp. 1–10, 2023. [Google Scholar]
27. A. Alessio and M. Abouhawwash, “Multi-objective optimization of machine learned objective functions for PET image reconstruction,” Journal of Nuclear Medicine, vol. 63, no. 2, pp. 2394, 2022. [Google Scholar]
28. G. Ravikumar, K. Venkatachalam, M. A. AlZain, M. Masud and M. Abouhawwash, “Neural cryptography with fog computing network for health monitoring using IOMT,” Computer Systems Science and Engineering, vol. 44, no. 1, pp. 945–959, 2023. [Google Scholar]
29. A. Garg, A. Parashar, D. Barman, S. Jain, D. Singhal et al., “Autism spectrum disorder prediction by an explainable deep learning approach,” Computers, Materials & Continua, vol. 71, no. 1, pp. 1459–1471, 2022. [Google Scholar]
30. H. D. Mehr and H. Polat, “Diagnosis of polycystic ovary syndrome through different machine learning and feature selection techniques,” Health Technology, vol. 12, no. 4, pp. 137–150, 2022. [Google Scholar]
Cite This Article
 Copyright © 2023 The Author(s). Published by Tech Science Press.
This work is licensed under a Creative Commons Attribution 4.0 International License , which permits unrestricted use, distribution, and reproduction in any medium, provided the original work is properly cited.
 Downloads
 Citation Tools