
 Submit a Paper
 Propose a Special lssue
 Open Access
ARTICLE

Efficient Explanation and Evaluation Methodology Based on Hybrid Feature Dropout
Department of Information Security, Hoseo University, Asan, 31499, Korea
* Corresponding Author: Taejin Lee. Email:
(This article belongs to the Special Issue: Artificial Intelligence for Cyber Security)
Computer Systems Science and Engineering 2023, 47(1), 471-490. https://doi.org/10.32604/csse.2023.038413
Received 12 December 2022; Accepted 03 March 2023; Issue published 26 May 2023
 View Full Text
 Download PDF
Abstract
AI-related research is conducted in various ways, but the reliability of AI prediction results is currently insufficient, so expert decisions are indispensable for tasks that require essential decision-making. XAI (eXplainable AI) is studied to improve the reliability of AI. However, each XAI methodology shows different results in the same data set and exact model. This means that XAI results must be given meaning, and a lot of noise value emerges. This paper proposes the HFD (Hybrid Feature Dropout)-based XAI and evaluation methodology. The proposed XAI methodology can mitigate shortcomings, such as incorrect feature weights and impractical feature selection. There are few XAI evaluation methods. This paper proposed four evaluation criteria that can give practical meaning. As a result of verifying with the malware data set (Data Challenge 2019), we confirmed better results than other XAI methodologies in 4 evaluation criteria. Since the efficiency of interpretation is verified with a reasonable XAI evaluation standard, The practicality of the XAI methodology will be improved. In addition, The usefulness of the XAI methodology will be demonstrated to enhance the reliability of AI, and it helps apply AI results to essential tasks that require expert decision-making.Keywords
AI research is ongoing in various fields. A technology creates real-like data by synthesizing audio, video, image, and text using an AI method, such as deepfake [1]. The recent spread of COVID-19 has further expanded AI-related industries [2]. Of course, analysis of chest radiographic image data of confirmed COVID-19 patients based on DNN/CNN and COVID-19 detection is also studied [3]. In addition, deep learning-based COVID-19 data analysis and prediction are being conducted to solve the privacy problem of the medical system [4]. A survey classifying deep learning models using COVID-19 data is also studied [5]. In particular, deep learning AI shows high accuracy and is studied more. AI models are classified into white-box methods, in which the internal structure of the model is disclosed, and black-box methods, which are difficult for humans to understand due to complex hierarchical structures. Much deep learning is a black-box model, and the accuracy of AI results is high, but it is not easy to know how the AI model came out with such developments. Especially since there is no confidence in AI outcomes, the person overseeing important decisions needs final predictions. In other words, AI results play a role in helping human experts make final decisions. Explainable AI (XAI) is a technique for measuring features’ contribution to improve AI’s reliability. XAI represents the contribution of features that influence the results predicted by an AI model. The contribution of a feature is a criterion that indicates how important and risk-sensitive it is. There are three standard XAI techniques for measuring the importance of such features. The back-propagation method [6–8] sums the neural network weights from the input to the predicted result.
In contrast, the perturbation method [9–11] evaluates the decrease in accuracy by adding Perturbation to the input value. A feature removal method also evaluates the decrease in accuracy after deleting arbitrary features by changing them to 0 or NaN (not a number) one by one [12–14]. In addition to the above methods, studies are gathering pace on various XAI technologies, and the range of XAI methods studied is expanding. There are ways to utilize XAI to MDSS (Medical Decision Support Systems) [15].
However, when explaining the results of AI, the feature removal method, which evaluates by changing arbitrary features to 0 or NaN, is problematic because when the value of the existing data set is the same as the modified value, this affects the feature importance [16]. For example, to determine the importance of a feature, the accuracy is measured by changing feature values to 0 and then measuring the difference from the original accuracy. Features A and B are compared when the ratio of a 0’s feature value to the feature value of A is high, and its ratio to feature B is low. In this environment, XAI determines that the importance of Feature B is high. This is because the higher the ratio of 0 to the feature value, the less the value of the changed feature, so there is no significant difference in accuracy, resulting in lower importance. Conversely, the smaller the ratio of 0 to the feature value, the more features change to 0, the accuracy significantly changed, and the importance was high. When XAI is affected by this environment, unfair results occur.
Therefore, research proposes Hybrid Feature Dropout, a hybrid XAI calculation technique that mitigates shortcomings. The proposed technology is evaluated by comparing it with other XAIs in an actual data set environment. For XAI evaluation, header features are extracted from the same malware data and used as a data set. Several models can be applied as an AI model; the XGBoost model has the highest accuracy and is used as a standard. Our experiments compare six XAI methods: changing features to minimum, maximum, and average values, the permutation method, the perturbation method, and our hybrid feature dropout method.
This XAI methodology shows different results in the same data set and exact model. For the same AI model, the ranking and score of the critical features should be the same, resulting in a clear label. However, depending on the data set and the AI model, the rank and score of features differ for each XAI method, and labeling is unclear. Therefore, evaluating whether each XAI method results represent the correct ranking and score is necessary. A fair evaluation should be based on the drop column that removes the critical features. The evaluation proceeds from two perspectives: XAI feature selection accuracy evaluation, which evaluates whether the upper features of the XAI are well selected, and XAI score accuracy evaluation, which evaluates whether the size and range of the XAI importance score are appropriate.
The structure of this paper is as follows. In Section 2, research related to existing XAI analysis tools and evaluation methods is reviewed, and in Section 3, a hybrid XAI calculation method, Hybrid Feature Dropout, is proposed. Section 4 presents an experimental approach to evaluate the proposed XAI technologies, including Hybrid Feature Dropout. Section 5 presents the experimental results and discusses the proposed model. Finally, Section 6 presents the main conclusions of this paper.
Representative XAI methods that assess the contribution of AI include Permutation, Perturbation, and Feature Drop, Drop Column. The Permutation method measures the loss value due to creating noise by randomly shuffling the feature values to check their contribution, as shown in Fig. 1 [17,18]. The idea is to find the change in the loss value before and after shuffling by one random feature, repeating as many times as the number of features. The more significant the difference between the loss values, the higher the contribution is judged; the calculation is quick and intuitive because there is no need for re-learning to measure the test data. The downside is that random shuffling created unrealistic data and generated bias. Importance is calculated by determining the difference between the loss values obtained by shuffling the features from the original loss values by repeating according to the number of features. By repeating c features, the difference between N Error, the loss value obtained by shuffling feature I, and the original loss value B Error are measured to determine the importance, as shown in Eq. (1).
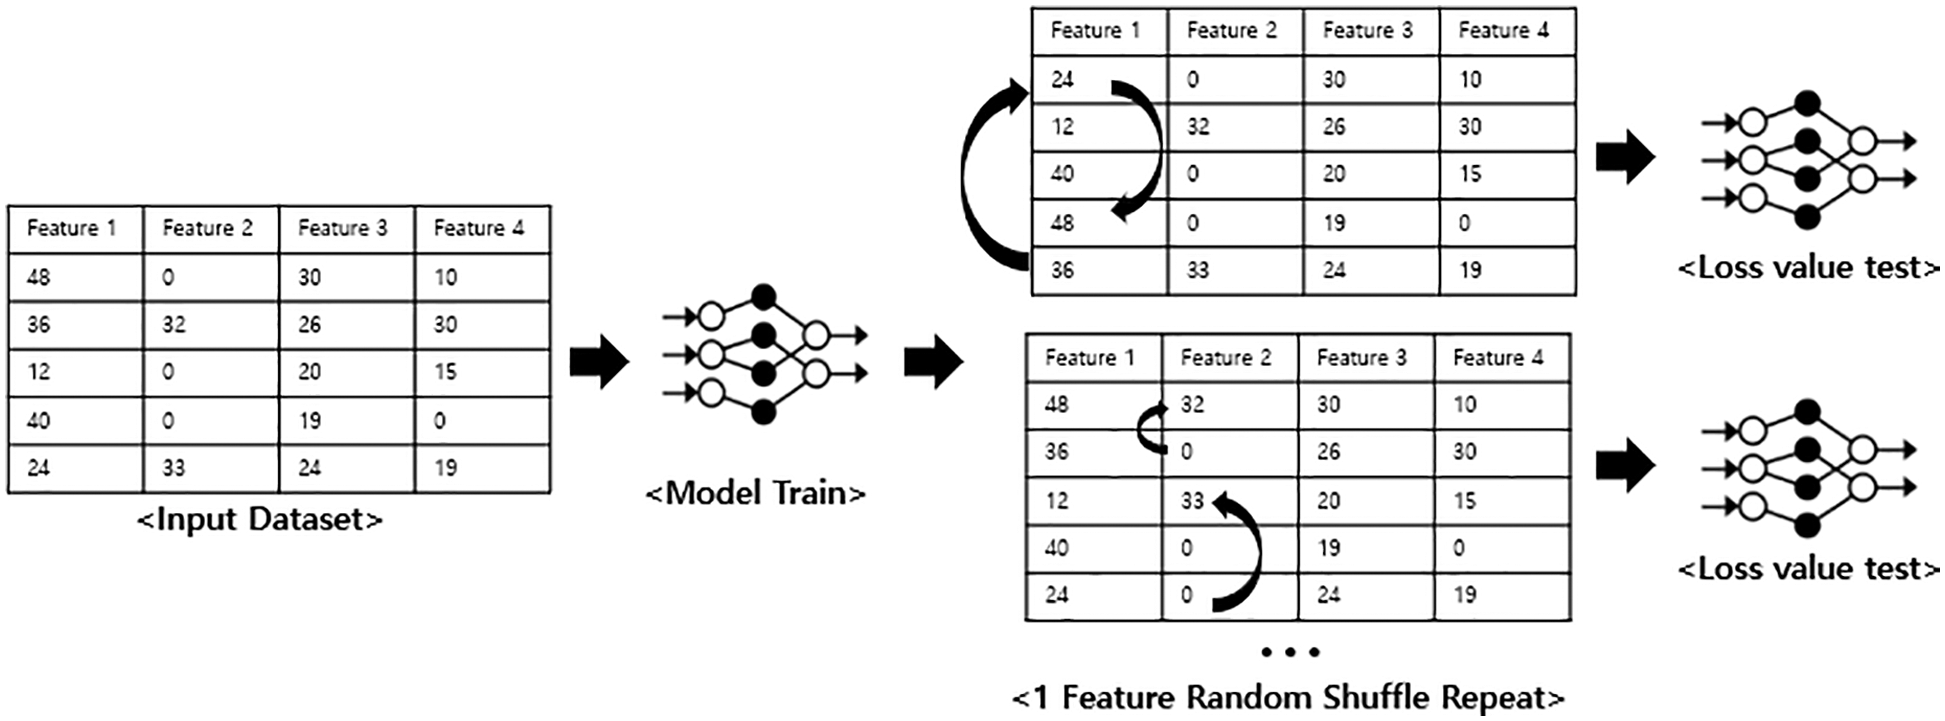
Figure 1: Permutation importance structure
The Perturbation method repeatedly examines and explains the learning model by applying various perturbations to the learning data. XAIs such as LIME (Local Interpretable Model-agnostic Explanations) and SHAP (Shapley Additive exPlanations) are included in the perturbation method. SHAP is used as a usual perturbation method in this paper. SHAP is a model that uses Shapley values based on the importance of features and uses SHAP values as the reason for the explanation.
In Eq. (2), F is the contribution of all feature sets, S represents all sets excluding feature j, and v(x) is the contribution of a subset of x. The contribution is measured according to the presence or absence of feature j. As the number of features increases, the measurement time increases, so SHAP uses an approximation of x through the Shapley value [19].
SHAP supports local analysis, which extracts critical features of each data item, and global analysis, which pulls critical features from all data. This paper uses the global analysis results to evaluate the importance of all features for each XAI [20].
The drop column method measures the importance of features by deleting features from train and test data and calculating the difference in accuracy. In this XAI measurement method, the more significant the difference in accuracy, the higher the contribution [21]. If only one feature of the train data set is deleted from the AI model, the prediction of the AI model fails because there is one less feature than the test data set. However, if you exclude one feature in both the train and test data sets, you can determine the actual feature’s importance. If your AI model has mandatory feature importance labels, use them as answer sheets. However, AI models with high Accuracies, such as deep learning, are mainly in the form of a black box, so it is not easy to know the exact label. Therefore, this paper uses the radical but fair drop column as a label in this paper and evaluates it. Of course, this takes a long time because the model has to be trained again for each feature. However, a drop column for fairer and more accurate labeling is appropriate despite the long processing time.
There are various viewpoints for evaluating XAI [22]. A mental model evaluates whether AI reduces uncertainty and shows efficient results based on human standards [23]. Another approach is to evaluate the end-user satisfaction and the explanation’s usefulness [24]. User satisfaction is evaluated by measuring questionnaires, interviews, or user response times [25,26]. Interviews and questionnaires can also evaluate users’ trust and reliability assessments [27,28]. However, the above methods can be viewed as qualitative evaluations from the point of view of AI model users rather than objective evaluations. Computational measures are needed to evaluate the accuracy and completeness of XAI, providing a convincing explanation with a simplified explanation rather than relying on human evaluation. Also, there are times when it is difficult for human users to judge the correct answer or label. An evaluation approach such as the following is required in an environment without such a label.
Reference [29] introduces a comparative evaluation method for SHAP, LIME, and DeepLIFT. First, a computational efficiency method compares the feature importance generated by the XAIs through the general AI model with feature importance modeled linearly. This method uses the logical result of a high-density sparse decision tree model that can be analyzed as a label. Second, each XAI is evaluated based on how much masking must be generated to change the label for the importance of the feature per the XAI. As shown in Fig. 2, Pixel, which played a critical role in determining the number 8 in the image data, is extracted by the XAI, and Masked is applied so that the label changes from 8 to 3. However, evaluating XAI as labeling by linear regression to explain AI is not a fair evaluation method. Also, utilizing Masked is not intuitive. Reference [29] is also based on the criterion that XAI should ultimately be consistent with human explanations.
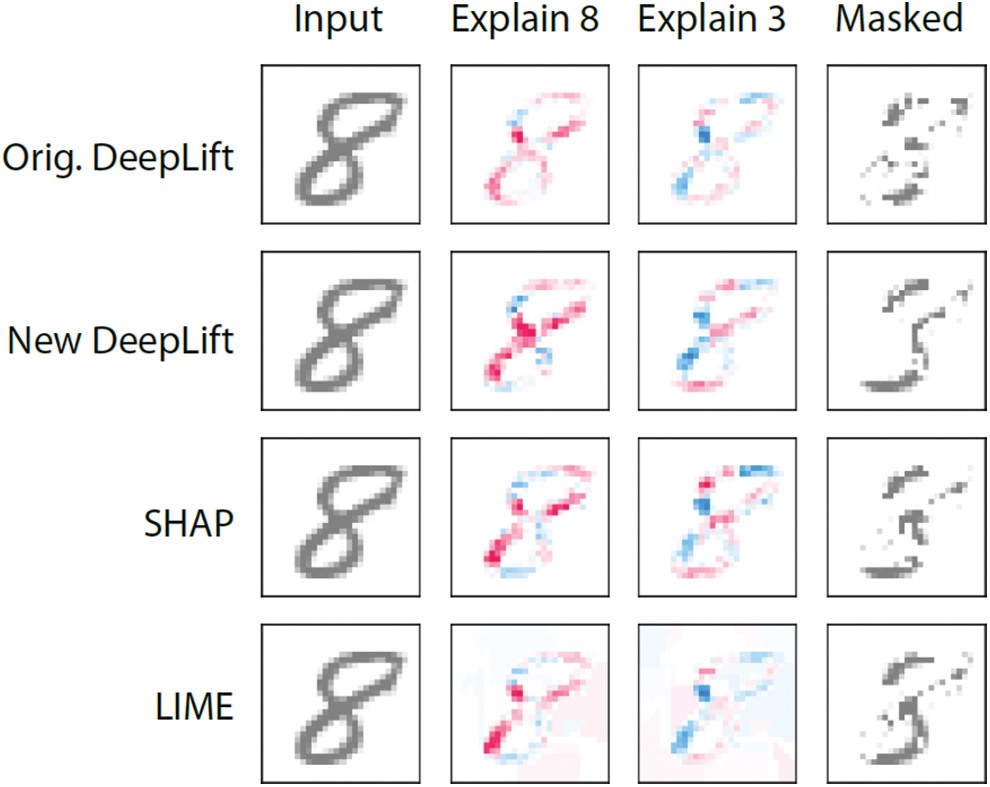
Figure 2: A masked image in which the label of pixel, which is a critical feature of LIME, SHAP, and DeepLift, has been changed from 8 to 3
Descriptive accuracy [30,31], an existing intuitive XAI evaluation method, is applied when a label does not exist. XAI scores according to feature importance. Depending on the score, the importance of each function is ranked. Descriptive accuracy measures the original accuracy and the accuracy when the feature value of the top-ranked feature extracted by XAI is replaced by 0. The feature has a binding effect if the difference between the original and feature-removed accuracy is significant. If N top-ranked features are accumulated and removed, and the accuracy is measured, possible to check the cumulative deterioration in accuracy. It is possible to compare the cumulative decline in accuracy to see if the top-ranked features for each XAI are essential.
The XAI could find critical features when the accuracy dropped significantly at higher ranks. For numerical comparison, AUC (area under the curve) is used to calculate and compare the accuracies dropped by the N top-ranked features. Fig. 3 shows the Descriptive accuracy result plots of XAIs on the four data sets. If the importance of the critical feature is high, the accuracy will drop significantly. Otherwise, the accuracy will not sink. Most of the data sets in Fig. 3 LRP, IG, and Gradient XAI accuracy fall faster than LIME, SHAP, and LEMNA.
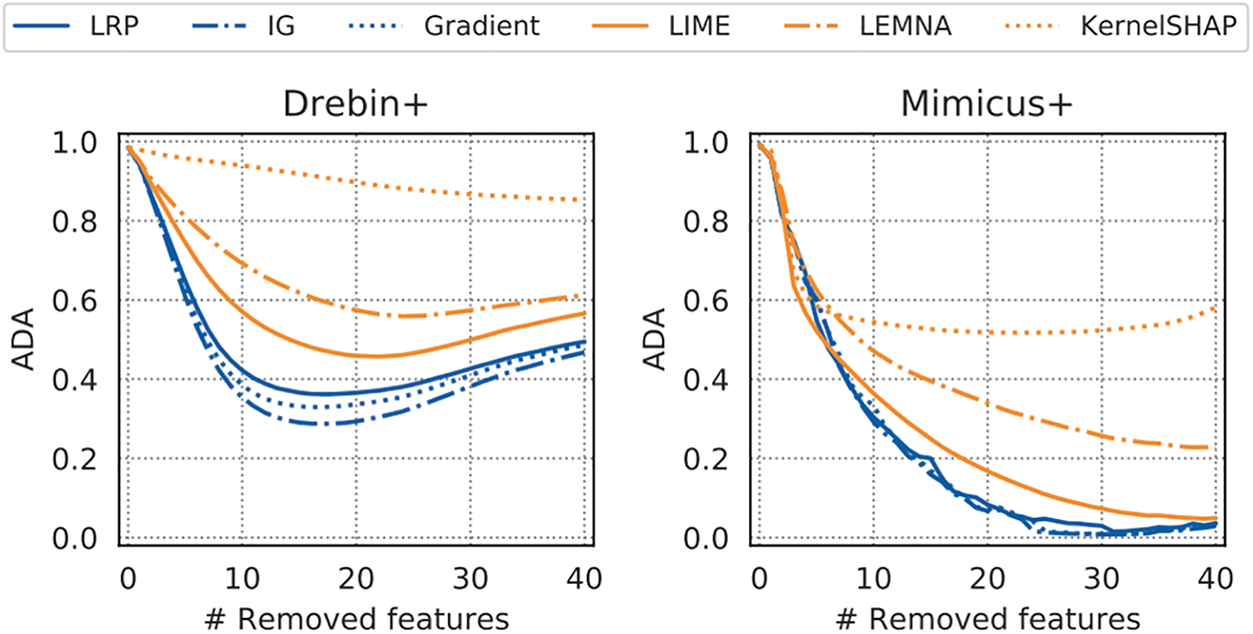
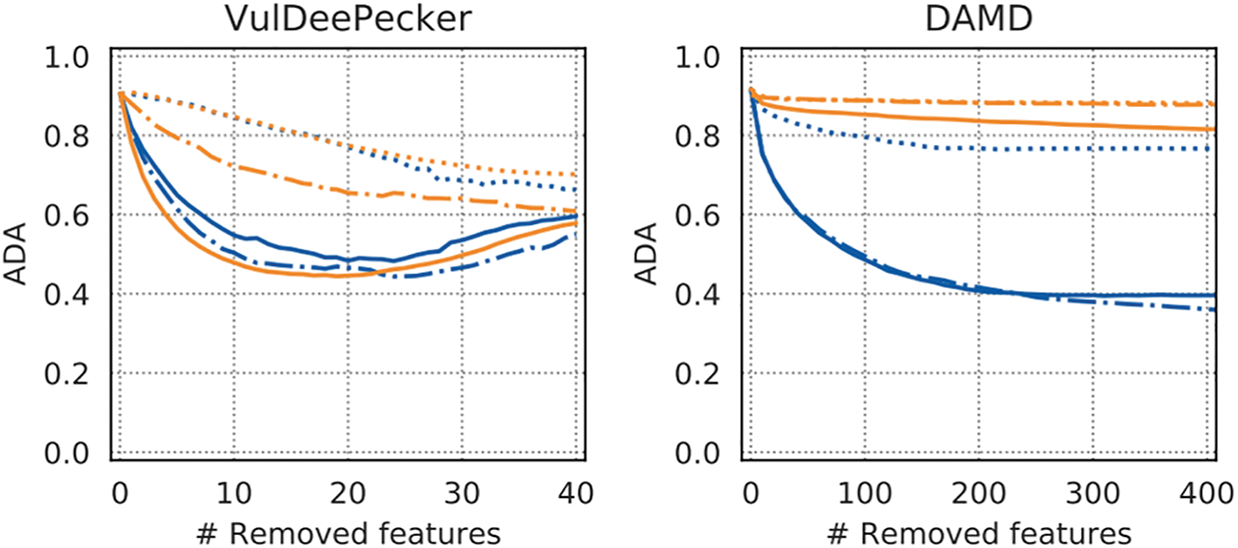
Figure 3: Average descriptive accuracy explanation methods
Among the above XAI methods, LRP, IG, and Gradient are white-box methods, so they give better results because they can access the internal information of the neural network. While LIME, SHAP, and LEMNA, black-box methods, show poor results, they are more widely applicable because they can be used even when only the learned model exists.
Descriptive accuracy is used in Eq. (3) to change the feature value to 0 or NaN when excluding features. As described above, if there are many 0’s in the original feature values, a problem because it does not affect the change in importance. The evaluation method used in this paper proceeds with fairer evaluation when removing features by deleting features that are not converted to 0.
3 Proposed Hybrid XAI Methodology
There are various methods of XAI used in the evaluation, as seen in related studies. Among these, the contribution measurement method removes the feature by changing the feature values equally. One problem, however, is the effect on the importance score when the value of the original feature is the same as the change value. The feature removal importance is calculated as the difference between the original and feature-removed accuracies. This is because the influence is difficult to gauge when the modified feature value is the same as the original value. After all, the accuracy does not significantly decrease. The research proposes Hybrid Feature Dropout (HFD), a hybrid XAI calculation method, to mitigate this problematic aspect of this radical feature removal method. To eliminate the effect of changing the feature value on the accuracy, we add a new feature with the presence or absence of 0. The new feature value is one of the original feature values 0 and is 0 if the original value is not 0. The new feature thus includes information on the original feature value.
As many new features are created, the total number of features, to not affect the AI model accuracy, data with values of features changed to 0 is created for each feature. The process iterates from the first to the last feature, generating and merging data to include all the number of cases where the feature value is removed to zero once. Data is generated in the same number of steps as the number of features, and all of this data is used for learning.
The algorithm for Hybrid Feature Dropout is shown in Fig. 4. The essence of the algorithm is to create new features and repeat as many times as the number of features, making a data set with features removed. When all these data are combined, the amount of data generated is the same as the number of features. Using the entire data set from which features have been removed one by one for learning, the original feature value does not affect the changed value when features are removed, and the number of all cases where features are removed is learned. As an example, if HFD is applied to a data set of 4 features with five malicious codes, new features are added to yield eight features in total: 5 data sets with feature A removed, 5 with feature B removed, 5 with feature C removed, and 5 with feature D removed. The sum of the data with each feature removed is 20 data sets. So eight features and 20 data sets are used to train the AI model, only adding new features, including the presence or absence of 0 in the test data. In the model thus generated, the feature importance is extracted by applying SHAP, the optimal feature importance extraction method.
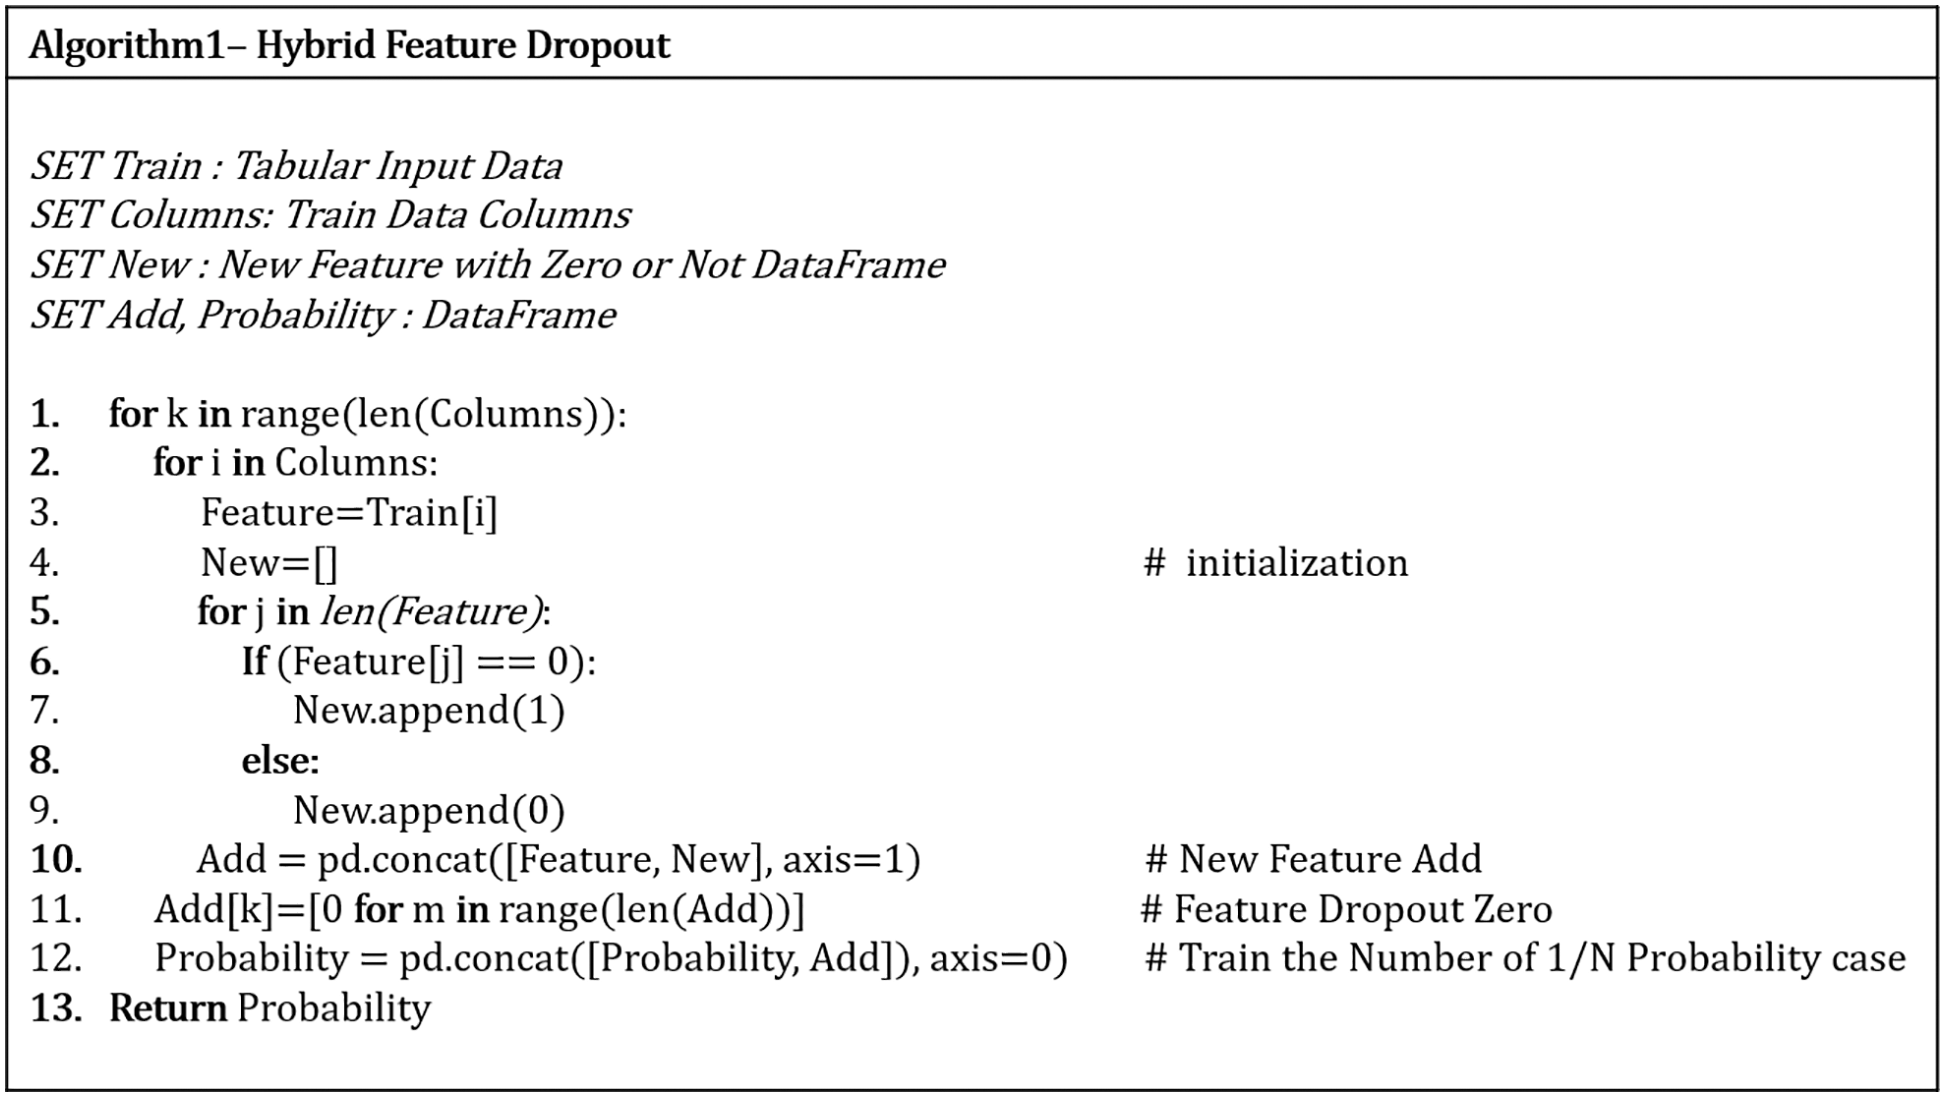
Figure 4: Hybrid feature dropout algorithm
The generated HFD-based feature importance represents a score unaffected by the change value. Therefore, finding a distinct critical feature is possible by giving a higher score to the actual critical feature. However, compared to XAIs that are already widely used, such as SHAP and Perturbation, it is necessary to find out the difference in critical features and importance scores. Studies related to the evaluation of XAI are still incomplete, and there are studies on the order of critical features but no evaluation of importance scores. The effectiveness of Hybrid Feature Dropout is verified by comparing the Hybrid Feature Dropout and XAIs proposed through the four evaluation methods in Chapter 4.
4 Proposed XAI Evaluation Methodology
AI has recently been used in many fields, and various application methods are being studied. However, it cannot be used for critical tasks that require human decision-making due to the lack of reliability of AI results. To this end, XAI plays a crucial role in improving AI reliability. When determining the label predicted by the AI, the ranking and contribution score of the critical features are provided to help the person ultimately in charge interpret the AI result, thereby increasing reliability. However, as shown in Fig. 5, all the current XAI technologies give different results, so consistent evaluation criteria are required. Only the LRP and Gradient XAI methods on Mimicus+ and Drebin+ data similarly extracted features with high contribution, while results show no correlation for other data sets and XAIs. Several XAI methods have few similarities on the top N features with high contribution, and the contribution score also has different ranges and values. Since XAI ranking and contribution score does not have a not association, a standard for evaluating XAIs is necessary. This paper proposes four evaluation methods, as shown in Fig. 6.
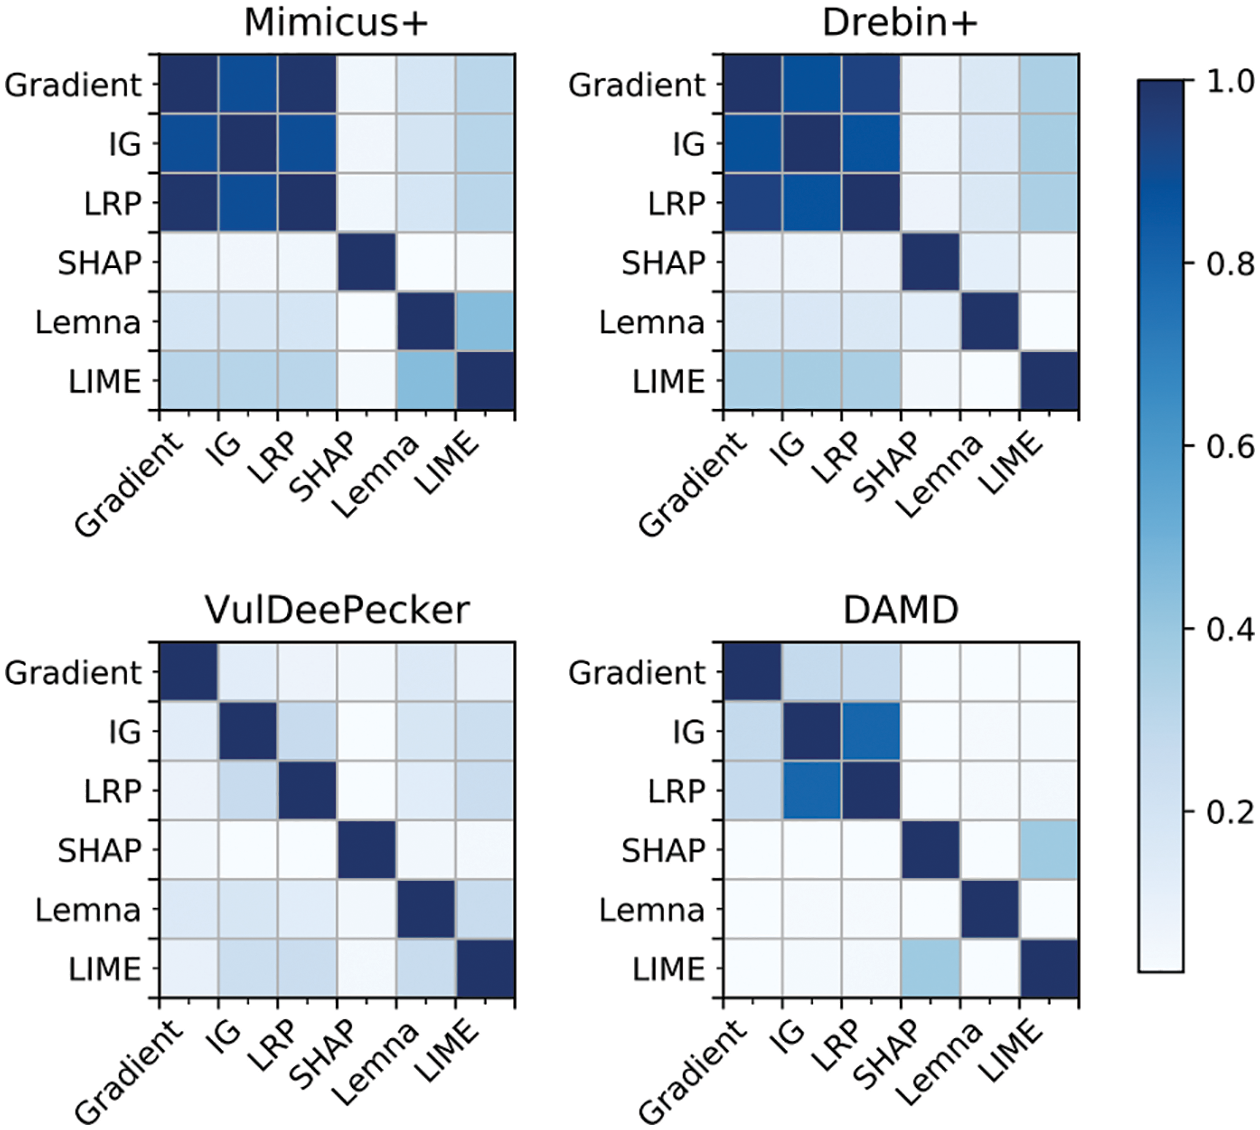
Figure 5: Comparison of TOP-10 feature similarity of four data sets and six XAI
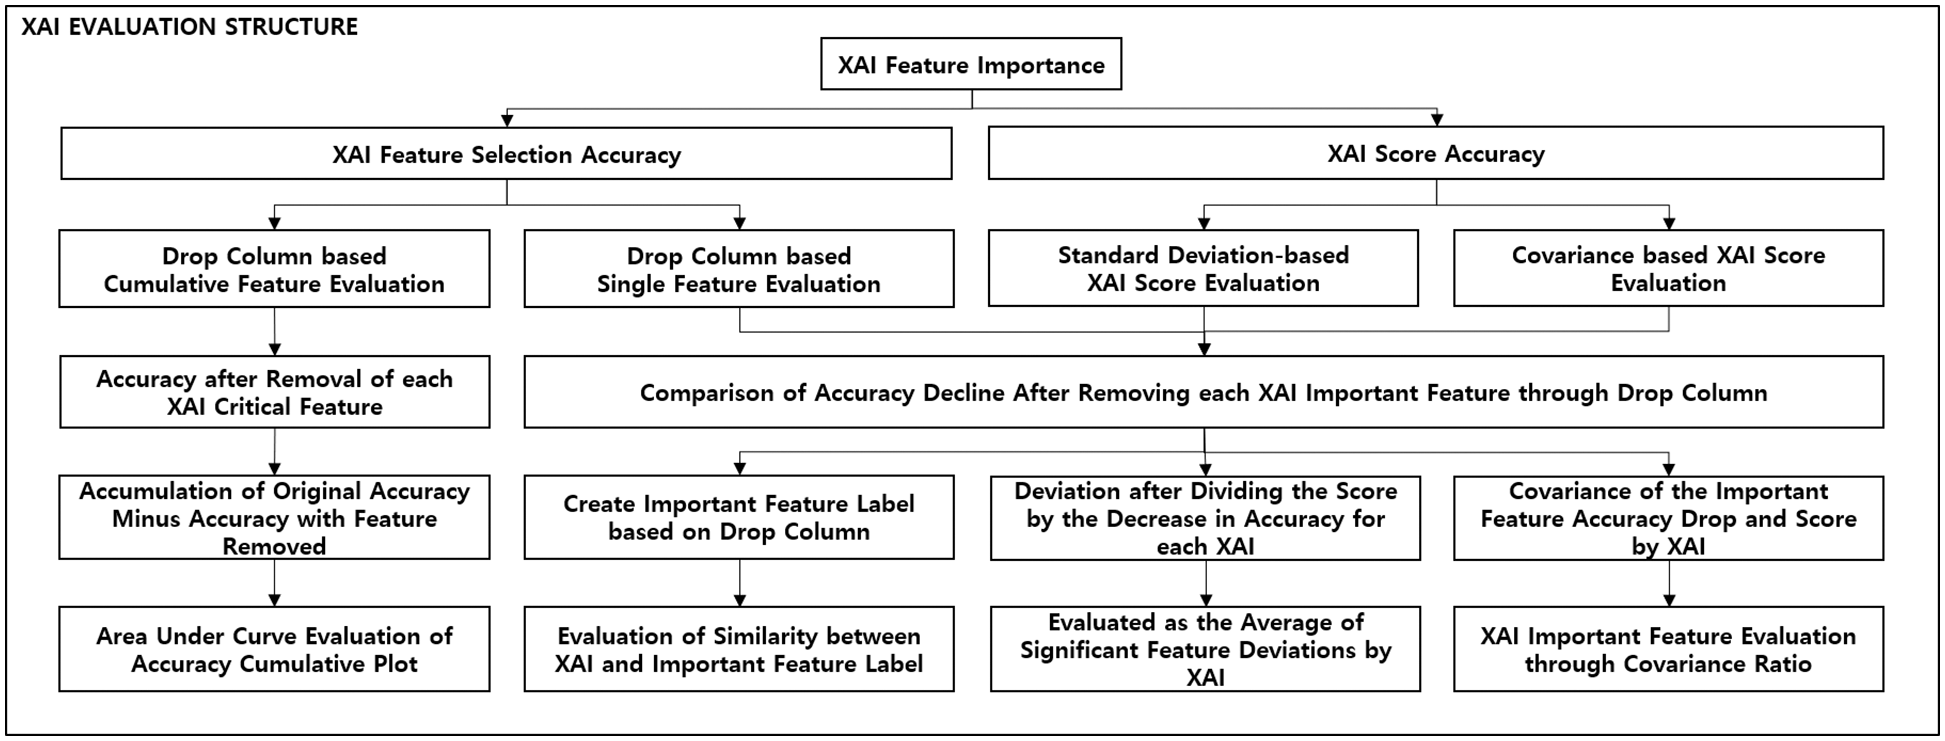
Figure 6: XAI evaluation method structure
4.1 Drop Column–Based Cumulative Feature Evaluation
An evaluation method based on accuracy drop value is presented as the first evaluation criterion. Existing descriptive accuracy methods calculate importance by reducing the accuracy by removing features to 0 and matching the number of features. However, if 0 exists in the original feature value, it does not affect the decrease in accuracy. This is a radical method in which 0 affects the extracted contribution of a feature. The research applied a fairer method of measuring the decrease in accuracy by deleting critical features from both the train and test data sets. Drop column-based Cumulative Feature Evaluation slows the learning process each time but allows for a fairer evaluation. The accuracy will gradually decrease when the top N features extracted from XAI are sequentially accumulated and removed. The research calculates the AUC based on the cumulative decrease in accuracy.
AUC is the value obtained by calculating the area between a and b of the f(x) function as in Eq. (4). Because critical features are deleted first, the accuracy slope drops sharply, so the smaller the AUC, the better the XAI is judged to extract the features with a higher actual contribution. Table 1 gives an example of the cumulative distribution of the decrease in accuracy of the top seven features with high contribution extracted by the XAIs LIME and SHAP. Fig. 7 plots the data in Table 1. By calculating the lower area in the above cumulative distribution graph, the XAI with the smaller AUC value is evaluated, with the result falling more rapidly among multiple XAIs.
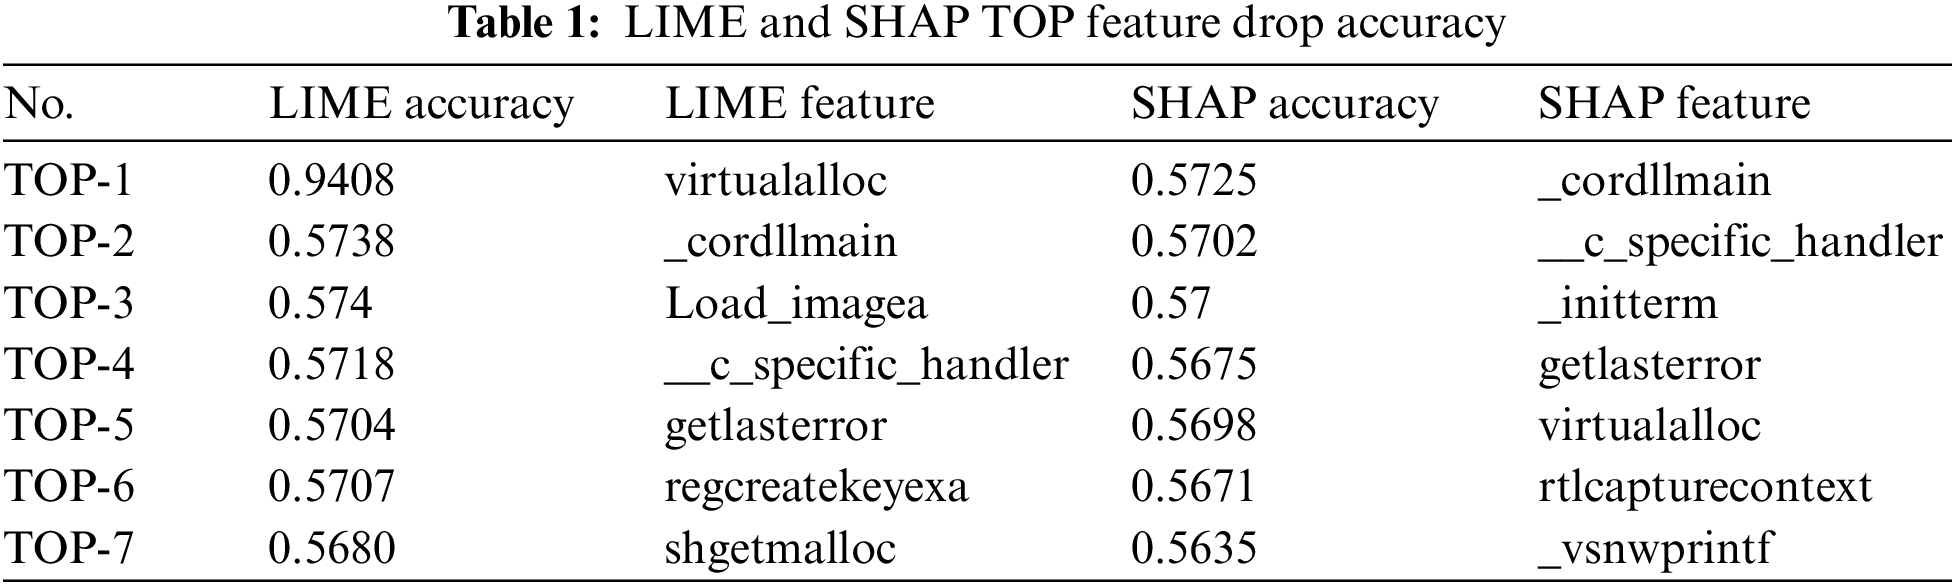
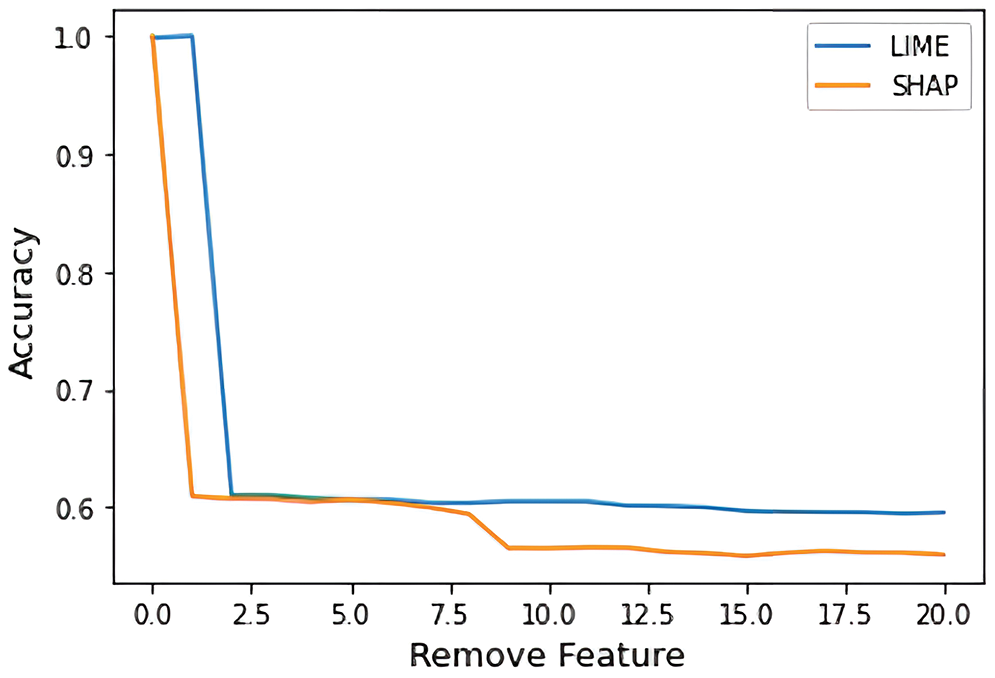
Figure 7: Accuracy drop cumulative distribution AUC evaluation
4.2 Drop Column–Based Single Feature Similarity Evaluation
A drop-column single-feature similarity evaluation method is proposed as the second evaluation criterion.
Drop column-based Cumulative Feature Evaluation measures accuracy drop, including the correlation of features. To evaluate the uncorrelated contributions between features, we use the Drop Column–based Single Feature Similarity Evaluation in 4.2. This paper evaluates the importance of a single feature by comparing the fair answer sheet with each XAI and the critical feature similarity. Each upper feature is evaluated for similarity according to the Spearman correlation coefficient. The Drop Column, extracted after removing critical features, is a slow but intuitive and fair method by repeating learning every time. Therefore, this paper uses Drop Column as the answer sheet. The more similar the correct answer and the top N features of XAI, the higher the extraction contribution of a single feature is judged. In Eq. (5), the similarity p is extracted using the averages of the ith data ranks of the variables x and y.
The Spearman correlation coefficient ranges from −1 to 1, with identical variables having a similarity of 1; the closer to 1, the higher the evaluated similarity. Fig. 8 is a color representation of the similarity evaluation results for pairwise variables from Intervene [32]. In our study, the similarity of other XAIs based on the drop column is evaluated through color and numerical value.
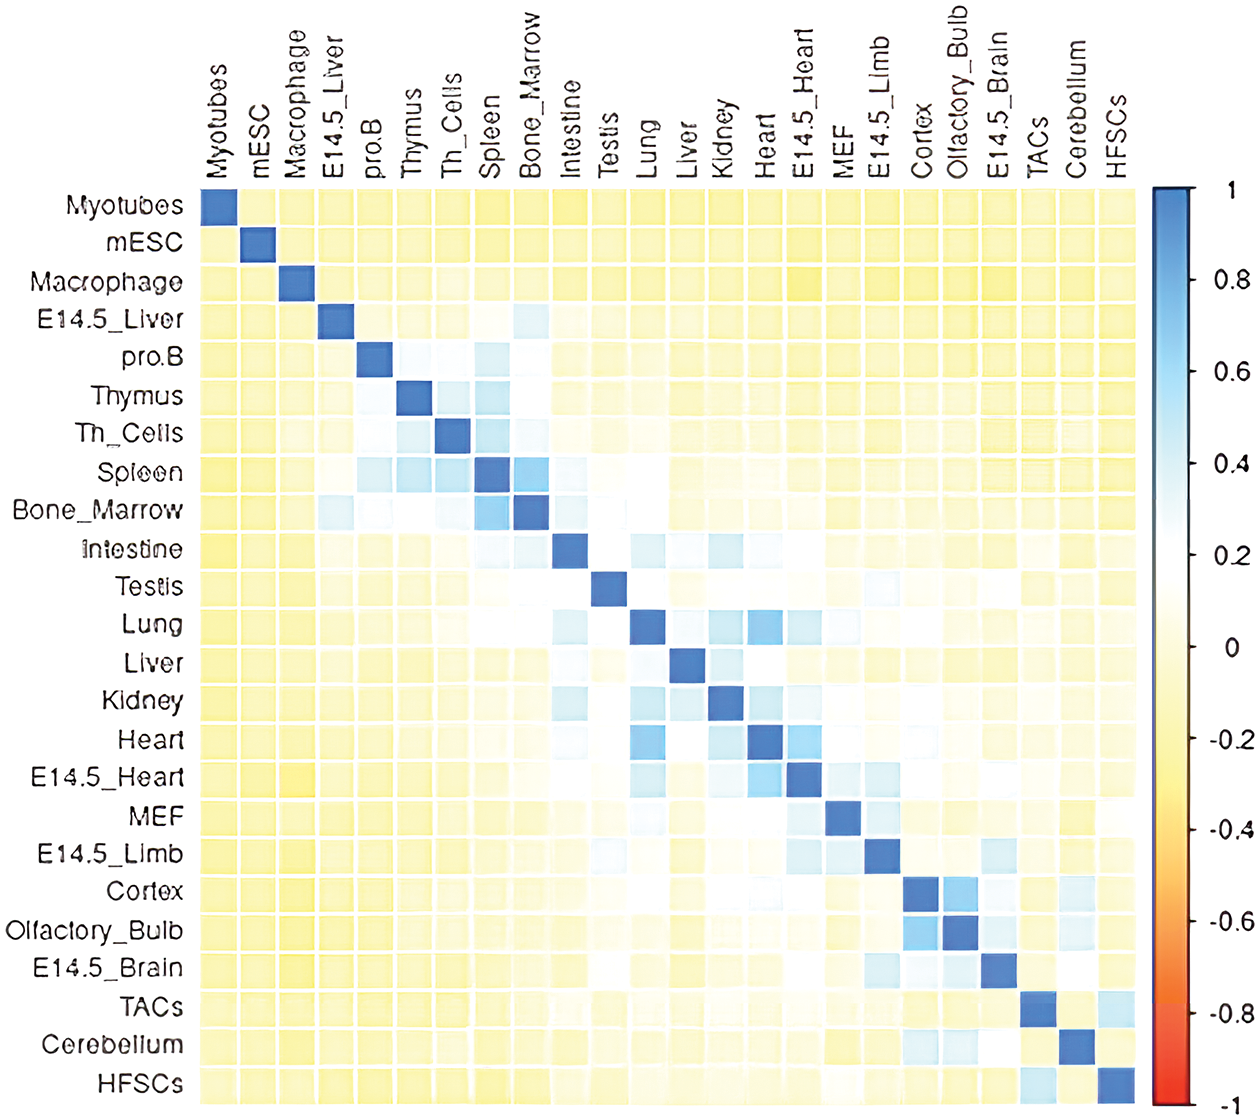
Figure 8: Example of color similarity for each variable
4.3 Standard Deviation–Based XAI Score Evaluation
As a third evaluation criterion, this paper proposes to evaluate the feature contribution score through the deviation between the XAI contribution score and the actual accuracy drop. If the above two evaluation methods evaluate the ranking and order of features, Standard Deviation-based XAI Score Evaluation is the range and value of the score evaluated. The reason for score evaluation is that regardless of the order in which each XAI is calculated, the score range and value appear different, so the score’s meaning is not given. Whether the contribution of critical features is properly extracted is evaluated through the standard deviation of the value obtained by dividing the accuracy drop value of the critical feature and the XAI contribution score.
If the contribution score of a feature is high, the decrease in accuracy should be significant when removed; if a feature’s contribution score is low, the decline in accuracy should accordingly be smaller. At this point, the value obtained by dividing the XAI contribution score by the decrease in accuracy is calculated uniformly, and results with slight standard deviations are extracted. When the standard deviation is slight, an appropriate contribution to the score of a feature is measured and meaningful. Conversely, when a feature’s contribution score is significant, its accuracy drop-off value is small, or its contribution score is small, and the accuracy drop-off value is substantial, the deviation is significant and inversely proportional. Inverse proportions indicate sizeable standard deviation values and poorly extracted XAI Feature Scores.
The standard deviation-based evaluation is performed by dividing the accuracy drop value by the contribution value of the critical features for each XAI. In Eq. (6), σ is the standard deviation divided by the decrease in accuracy of the feature and the XAI score, xi is the decrease in accuracy of the ith feature, yi is the score of the contribution of the ith most critical feature, and this is repeated as many times as the n features.
4.4 Covariance-Based XAI Score Evaluation
As a fourth evaluation criterion, this paper proposes a proportional evaluation of the XAI contribution score based on the covariance of the decrease in accuracy. As with the standard deviation, the proportional value is calculated through covariance based on the contribution of the upper features for each XAI and the actual accuracy drop. The proportional value is extracted as a positive number if both values are large or small. Conversely, if the contribution score of a feature is significant, but the accuracy drop value is small, it becomes damaging as an inverse proportion. If there is no relationship between the contribution score of the feature and the decrease in accuracy, the proportional value becomes 0. Research judged that the larger the proportional value, the more appropriately XAI extracted the contribution score of the feature.
In Eq. (7), Cov is the proportional value of the contribution score of the feature and the covariance of the decrease in accuracy, x is the original accuracy, xi is the accuracy with the ith feature removed, and yi is the XAI contribution score of the ith feature; the covariance is extracted by repeating for n features.
5.1 Equipment, Data Sets, and XAIs
For this study, training and testing were done on an Intel Xeon Gold 6226 2.7G server (128 GB of RAM) using the NVIDIA 16 GB Tesla T4 GPU. The development environment used the Python 3 programming language in Anaconda 3 Jupyter Notebook. The model and anomaly detection algorithm was implemented using Google TensorFlow and Keras frameworks. This paper used low-level APIs to facilitate fine-grained control of the network architecture. This paper used the 2019 Data Challenge malware data set in our experiments. For an accurate evaluation, 37 headers were extracted and used as features, and 29,130 training data sets and 9,031 test data sets were used. The AI model used the XGBoost classifier, which is typically used for malware classification [33,34]. The parameters are n_estimator = 100, learning_rate = 0.1, and max_depth = 6. After learning, 96.82% accuracy was extracted. The feature contribution was calculated for six XAIs: Drop Min, Drop Max, Drop Ave, Permutation, Perturbation (SHAP), and our proposed Hybrid Feature Dropout (HFD). The above four evaluation methods evaluated HFD.
5.2.1 Drop Column–Based Cumulative Feature Evaluation Result
This paper evaluated six XAIs to generate the top 10 critical features. The features were removed individually in order of importance, and the accuracy decline was accumulated. All six XAIs show a decrease in accuracy, but not identically. The plot in Fig. 9 is a distribution graph of the accumulated accuracy drop from the original accuracy when features are removed. The proposed HFD expresses the color more intensely. When the first feature, the most critical feature judged by XAI, was deleted, the accuracy dropped the most in Hybrid Feature Dropout, Permutation, and Perturbation. Continuing the process, up to 10 results were compared, but in some cases, the accuracy increased due to the correlation between features, making it difficult to make an accurate evaluation.
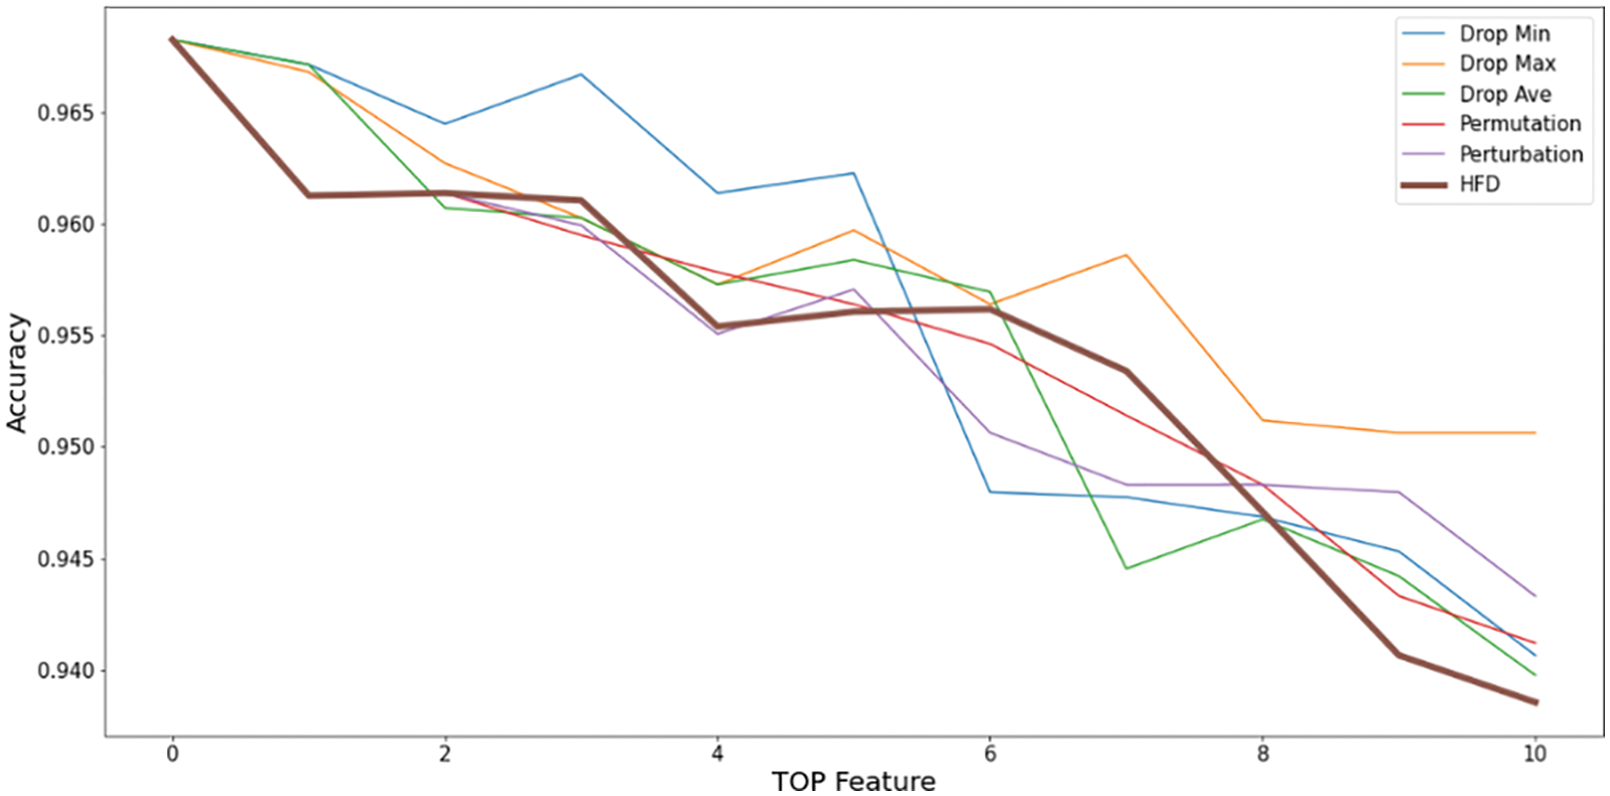
Figure 9: Drop column–based cumulative feature evaluation for six XAIs (cumulative deletion of high-importance features)
The AUC was calculated for each XAI to more accurately judge the six XAIs, as shown in the graph in Fig. 10. accuracy drops more rapidly as critical features are removed. The smaller the AUC, the better the feature with higher contribution is evaluated by XAI. Among the six XAIs, the proposed HFD showed the best results, while Drop Max showed the worst results. However, there is no significant difference in the overall cumulative distribution area; in this respect, the proposed HFD shows slightly better numerical results.
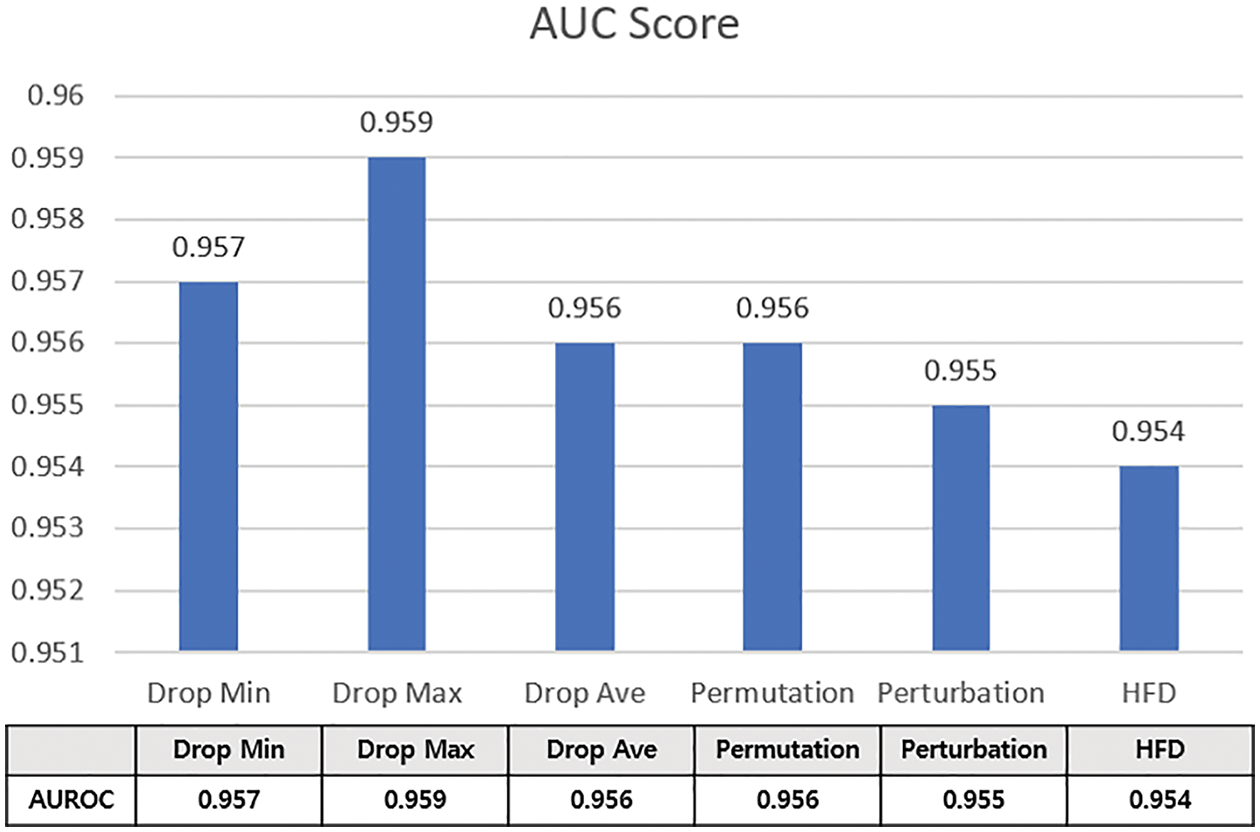
Figure 10: AUC-based cumulative feature importance evaluation results
5.2.2 Drop Column–Based Single Feature Similarity Evaluation Result
For the accuracy drop cumulative distribution AUC, features with a high contribution are accumulated while being deleted and continuously removed, representing the accuracy, including the correlation of the deleted features. To also evaluate the contribution of a single uncorrelated feature, research proceeds with a single feature similarity evaluation using the drop column as the correct answer. Fig. 12 plots the importance of the top 15 features with high contributions to the drop column and the XAI scores of the corresponding features. The top features are checked based on the drop column, which is the feature importance label. Since this is an importance obtained by removing only a single feature, it indicates the degree of accuracy degradation of the specific single feature. Drop Column top 15 features were compared with feature contribution scores by each XAI. Comparing all six XAIs shows similar results, given that the plot is complicated to analyze. Therefore, among Drop Min, Drop Max, and Drop Ave, Drop Ave is used as the representative XAI. The closer the XAI is to the drop column, the actual decrease in accuracy, and the better it represents the importance. The Perturbation and HFD XAI methods showed the most similar contribution scores to the answer sheet, while Drop Ave differed the most.
For a more accurate evaluation of a single feature, the similarity between the drop column answer sheet and the top feature of each XAI is evaluated. The Spearman correlation coefficient calculates the similarity between the answer sheet and XAI top features. The range is between −1 and 1, appearing close to 1 when the drop column and the top feature are most similar and close to −1 when opposite. Fig. 11 shows the degree of similarity by XAI in terms of color and number. When the feature and importance values are the same, dark blue is used; the lower the similarity, the closer the color to white. Fig. 13 graphs the Spearman similarity by XAI using the drop column for evaluation.
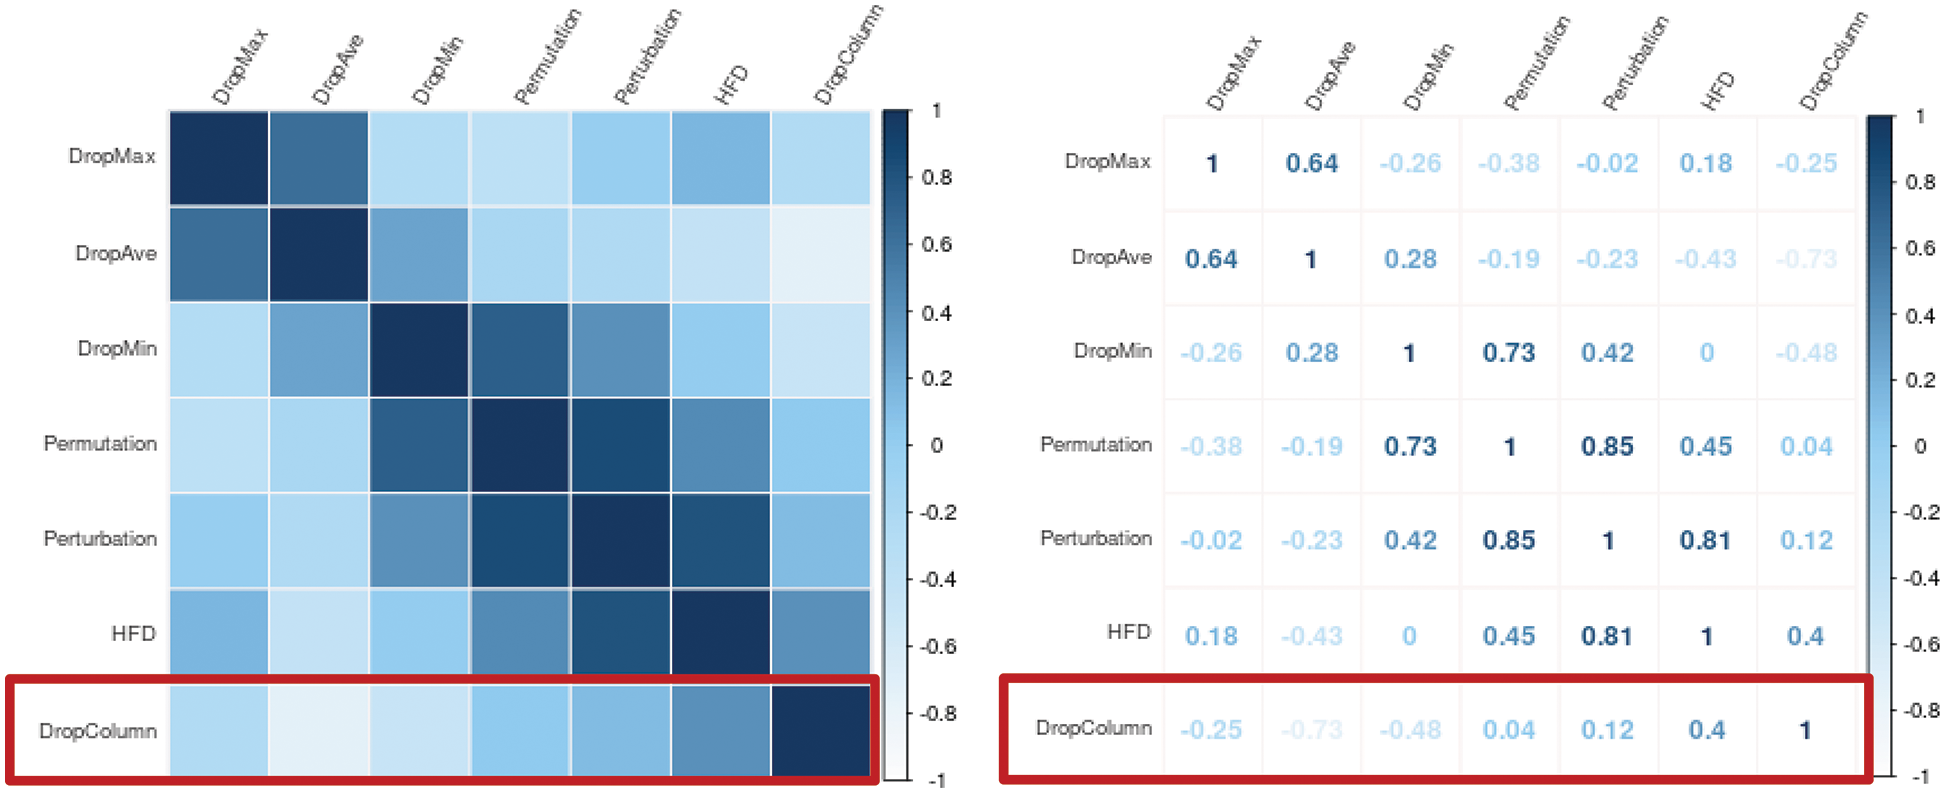
Figure 11: Similarity results by XAI through Intervene
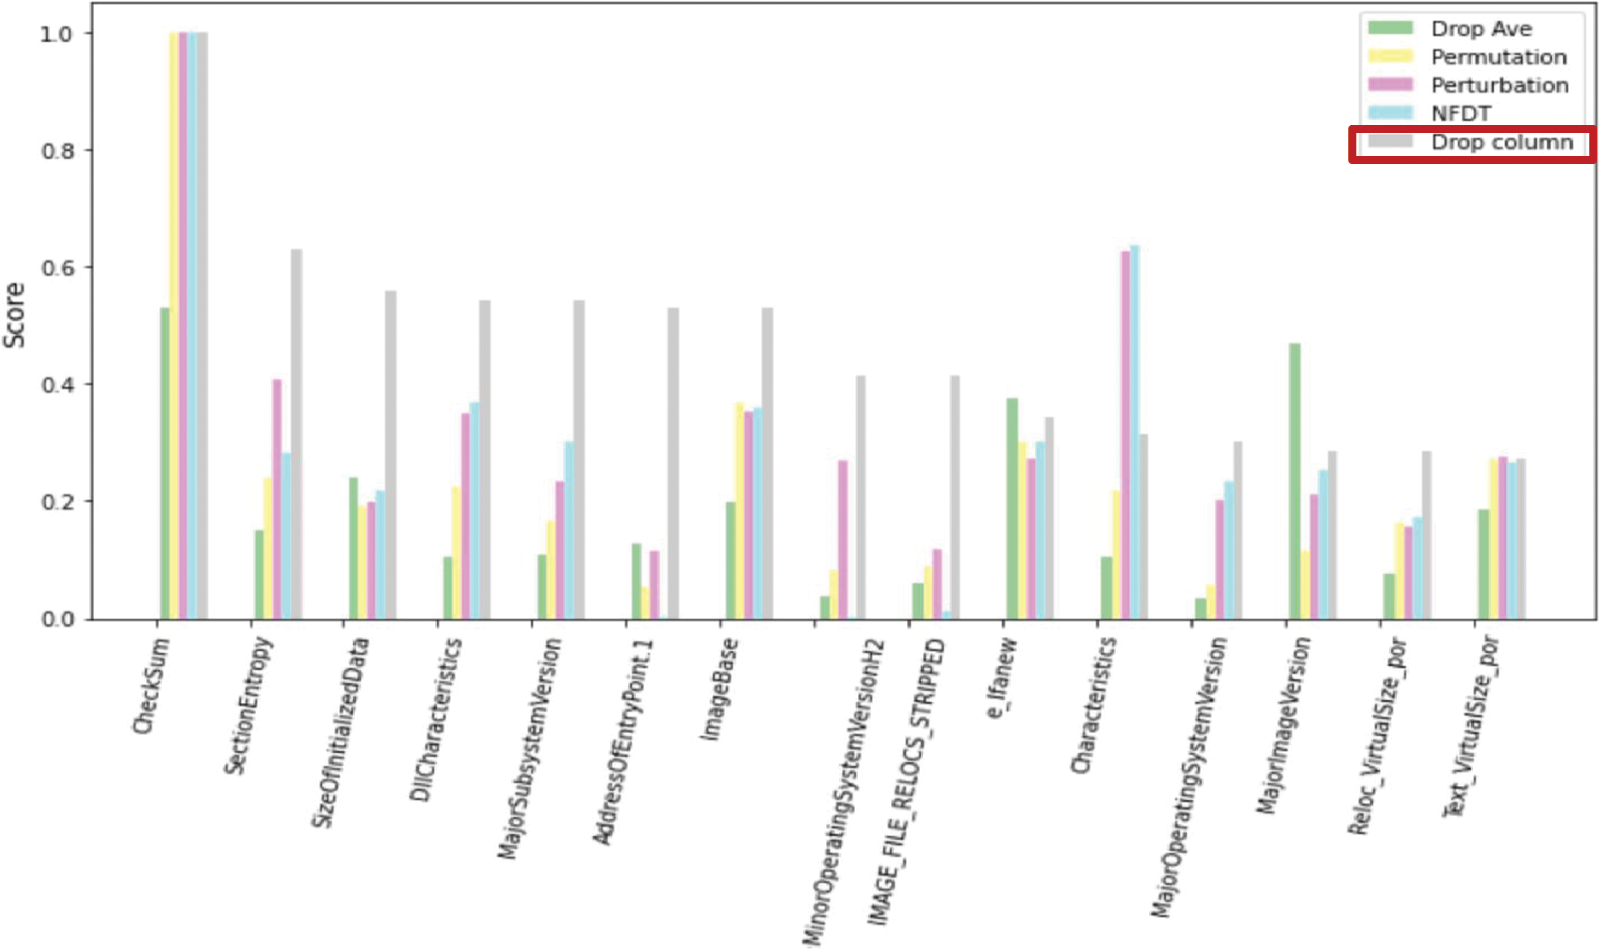
Figure 12: XAI score of TOP 15 features with high importance based on drop column
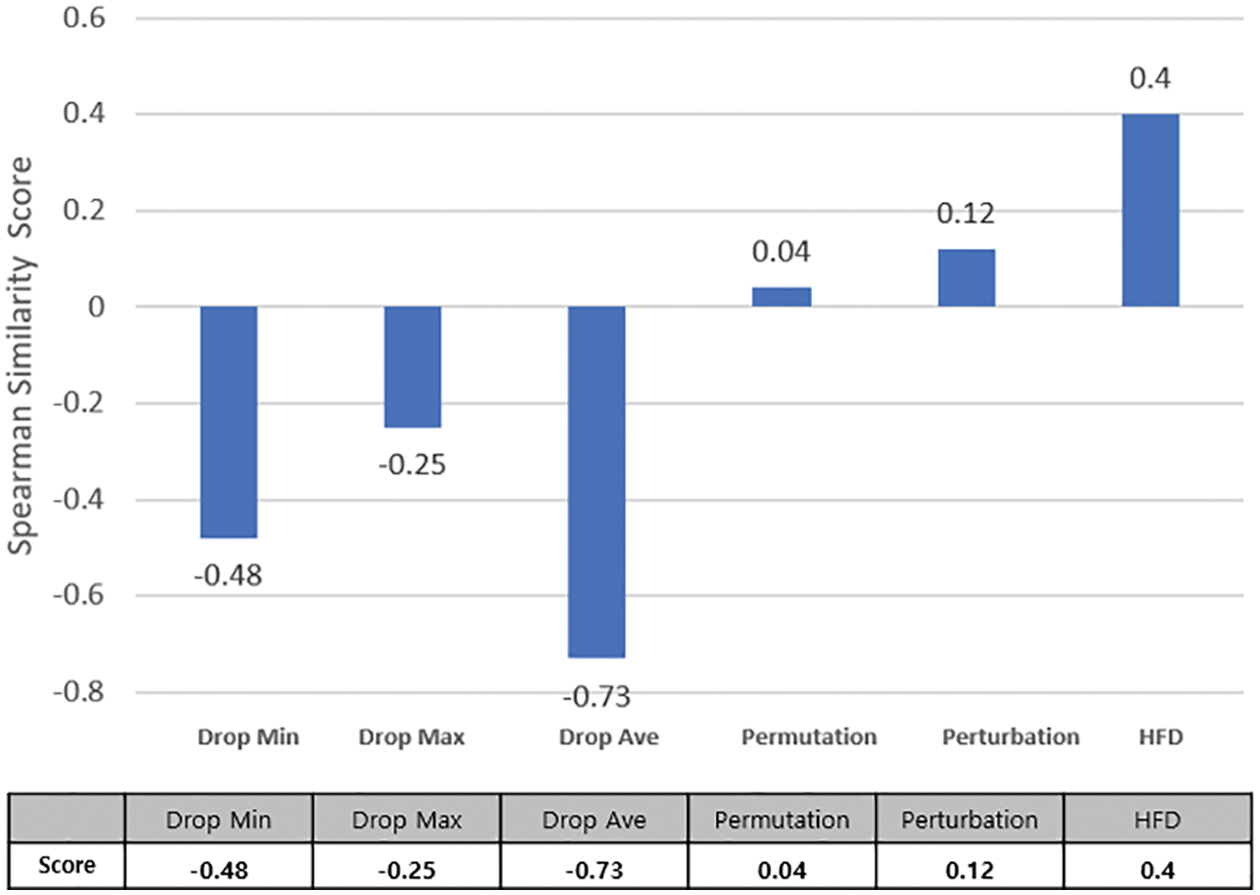
Figure 13: Drop column–based single feature similarity evaluation results
Regarding the similarity evaluation, the proposed HFD performed best, followed by Perturbation. The lowest score was obtained in the Drop Max method. It can be seen that there is no correlation between the features. Drop column–based cumulative and single feature evaluation results show similar performance for HFD and Perturbation, while Drop Max produces the worst consequences. In the evaluation results, the six XAIs did not show significant differences and appeared similar. However, a single feature evaluation result with no correlation between features shows a big difference.
5.2.3 Standard Deviation–Based XAI Score Evaluation Result
If the above two evaluations are evaluations for calculating critical feature rankings, the standard deviation–based XAI score evaluation judges the appropriateness of the XAI score range. The evaluation is conducted based on 15 features that played an important role in classifying malicious code data. If the ratio of the high-importance feature given by the XAI and the decrease in accuracy of the actual feature is close to 1 (i.e., they are similar), the range of the actual score is considered appropriate. The ratio was measured as the deviation scaled after dividing the contribution score of each XAI from the accuracy drop. Because the smaller the variation, the more similar the actual XAI accuracy drop and the importance. Each XAI representative result is calculated and evaluated through the standard deviation of the top 15 features. The smaller the standard deviation, the more significant the decrease in accuracy when important features are removed. The standard deviation results of 15 features for each XAI are shown in Fig. 14. The proposed HFD and Perturbation showed the best results, and these two XAIs show similar results when SHAP is applied. However, the proposed hybrid feature dropout method delivers slightly improved results than the perturbation method. The worst-performing method is Drop Min, which offers more than twice as significant a deviation as the HFD and Perturbation models. Unlike the evaluation results for calculating the ranking of critical features, the XAI score range evaluation results show substantial differences among XAI methods. The proposed HFD method represents the feature importance score range well.
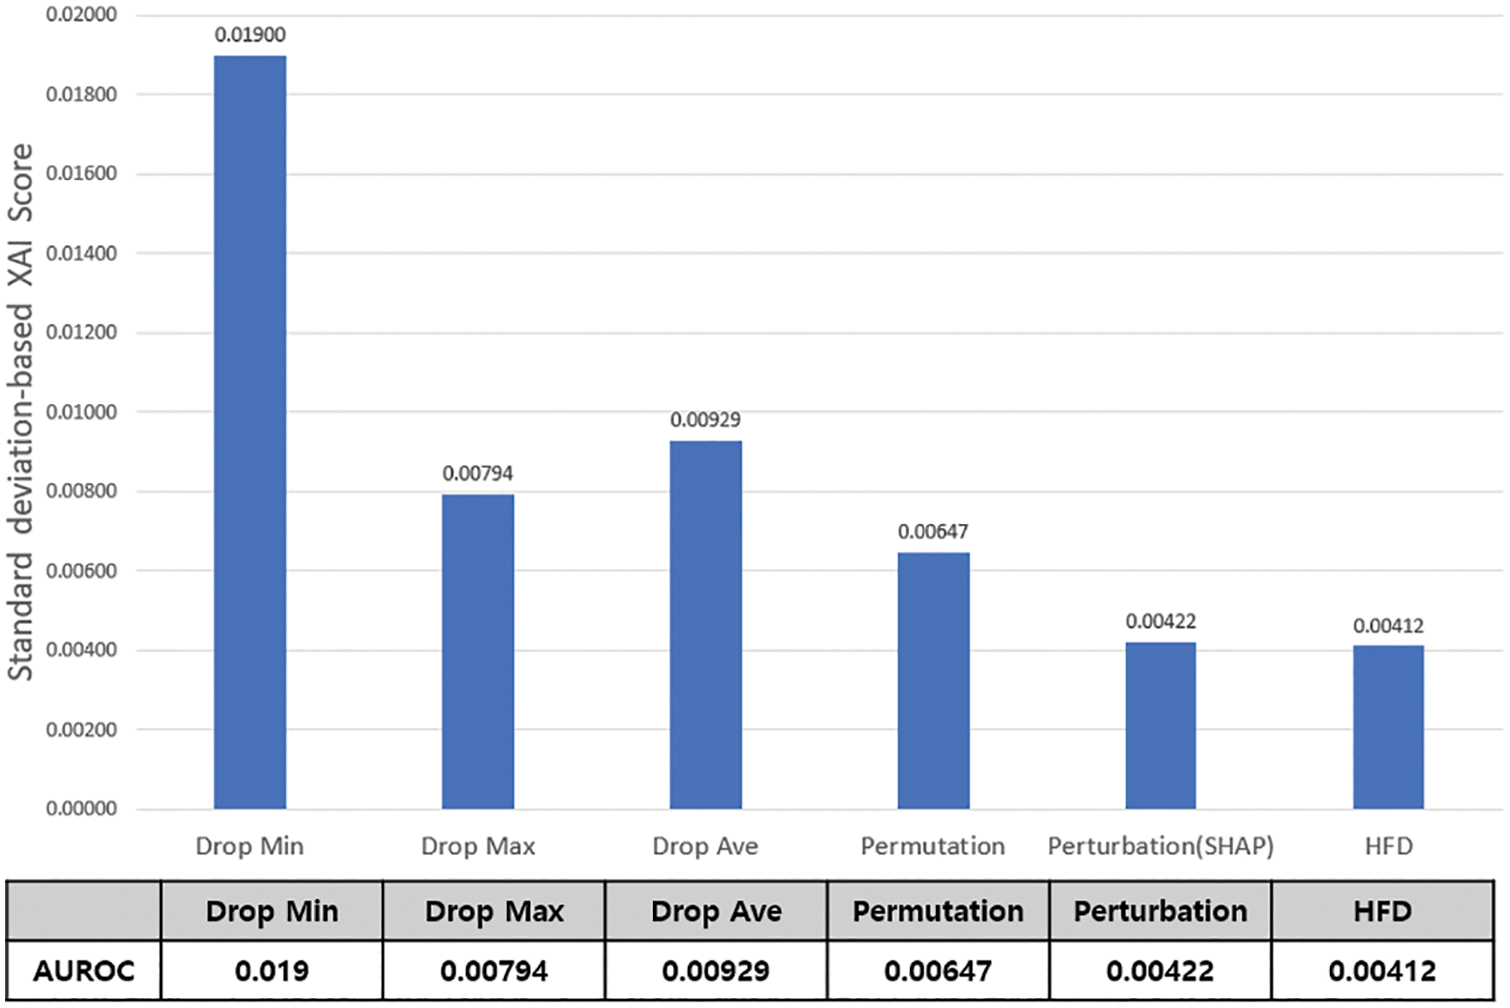
Figure 14: Standard deviation–based XAI score evaluation result
5.2.4 Covariance–Based XAI Score Evaluation Result
The covariance-based XAI score evaluation also evaluates the adequacy of the XAI score range, like the Standard Deviation-based Evaluation. This paper evaluated the top 15 characteristics of XAI importance of malicious code data. When the actual feature is removed, if the ratio of the accuracy drop and the score judged by each XAI is close to 1, the range of the actual score is appropriate. When the feature is removed, the decrease in accuracy and the proportional value of the covariance scores judged by each XAI are obtained to measure the ratio. Covariance proportions are proportional when positive and inversely proportional when negative.
Fig. 15 graphs the covariance-based XAI score evaluation results. Our proposed HFD showed the highest positive number. Results similar to those of the above-described standard deviation–based XAI score evaluation were obtained. Here also, HFD showed the best performance in the evaluation results, while the worst score was derived for the Drop Min method. One difference is that the rankings of the Permutation and Perturbation results are reversed. The perturbation method shows comparably good results to HFD in the other three evaluations but only average values in the covariance proportional evaluation. Except for this, the other XAIs showed similar results to the standard deviation–based XAI score evaluation results. As a result of the evaluation, it was found that the accuracy decrease of the actual characteristics and the XAI score were proportional through the covariance that appeared as a significant difference between positive and negative. Evaluation results again demonstrated that HFD represented the range of feature importance scores well.
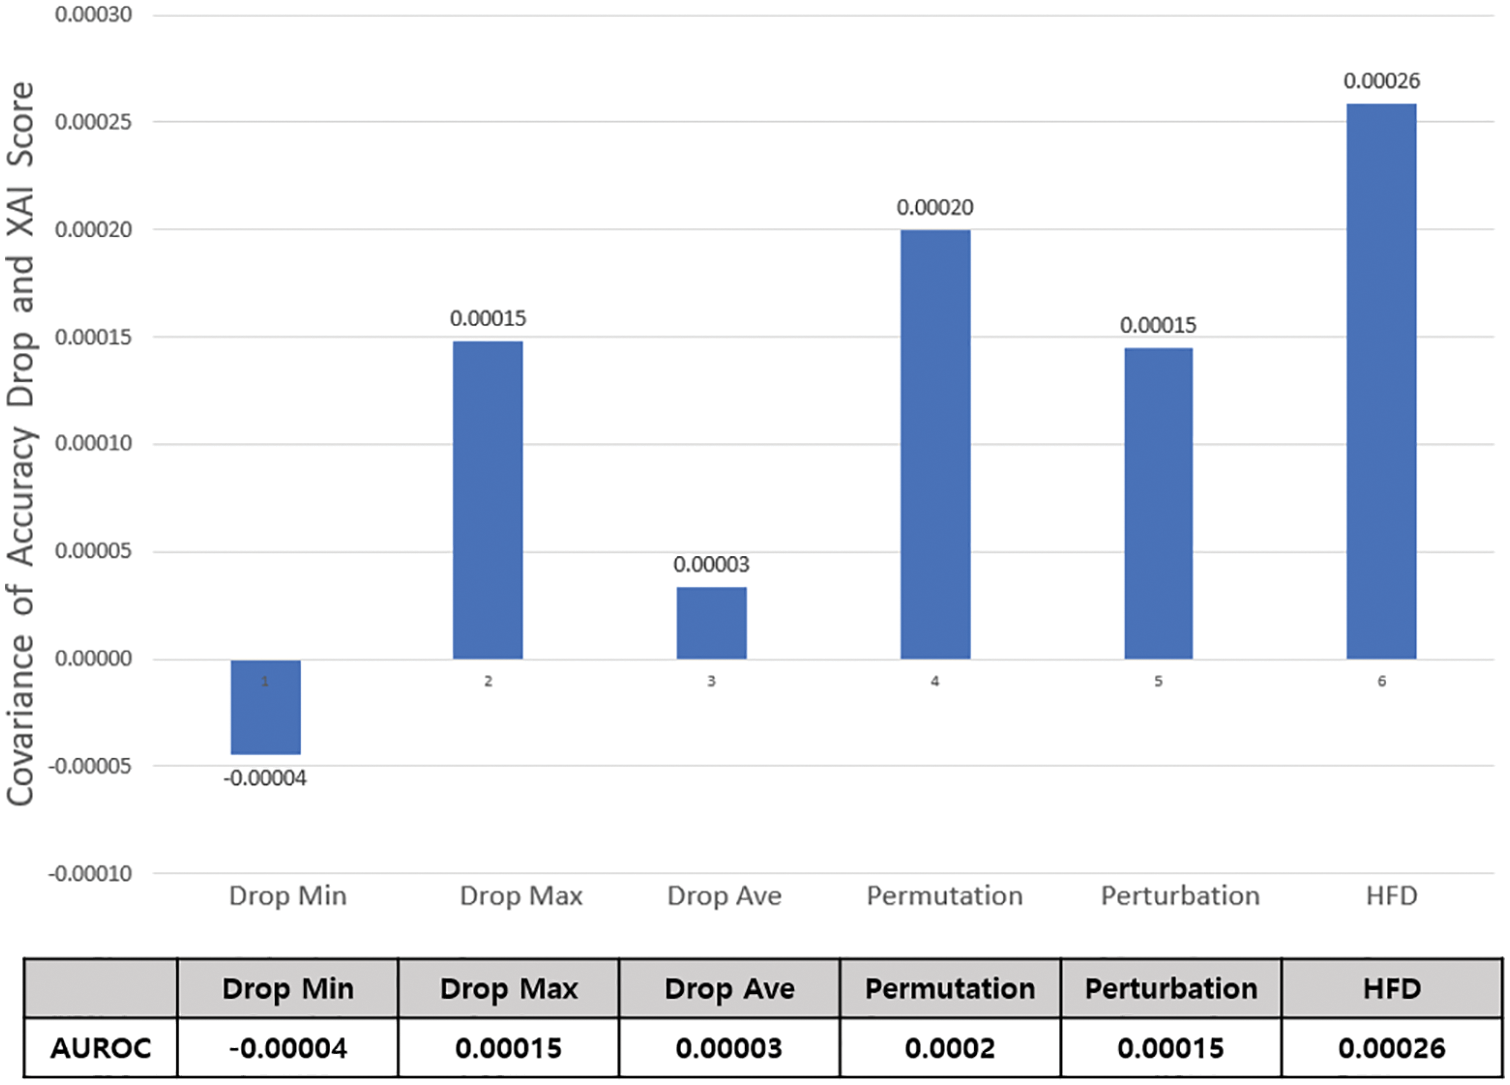
Figure 15: Covariance–based XAI score evaluation results
5.3 XAI Evaluation Synthesis Analysis
It has been demonstrated that the proposed Hybrid Feature Dropout method measures importance more accurately than other XAIs through four evaluation criteria. Table 2 shows the results of the six XAI evaluations, including HFD. The evaluation used four criteria, with HFD showing the best results in all evaluations. In the drop column–based cumulative feature evaluation and the standard deviation–based XAI score evaluation, the smaller the value, the more accurately and appropriately the XAI is judged to represent the critical feature in AI model classification. In the drop column–based single feature similarity evaluation and covariance-based XAI scores evaluation, the higher the value, the more accurately and appropriately the XAI is judged to represent critical features in AI model classification.
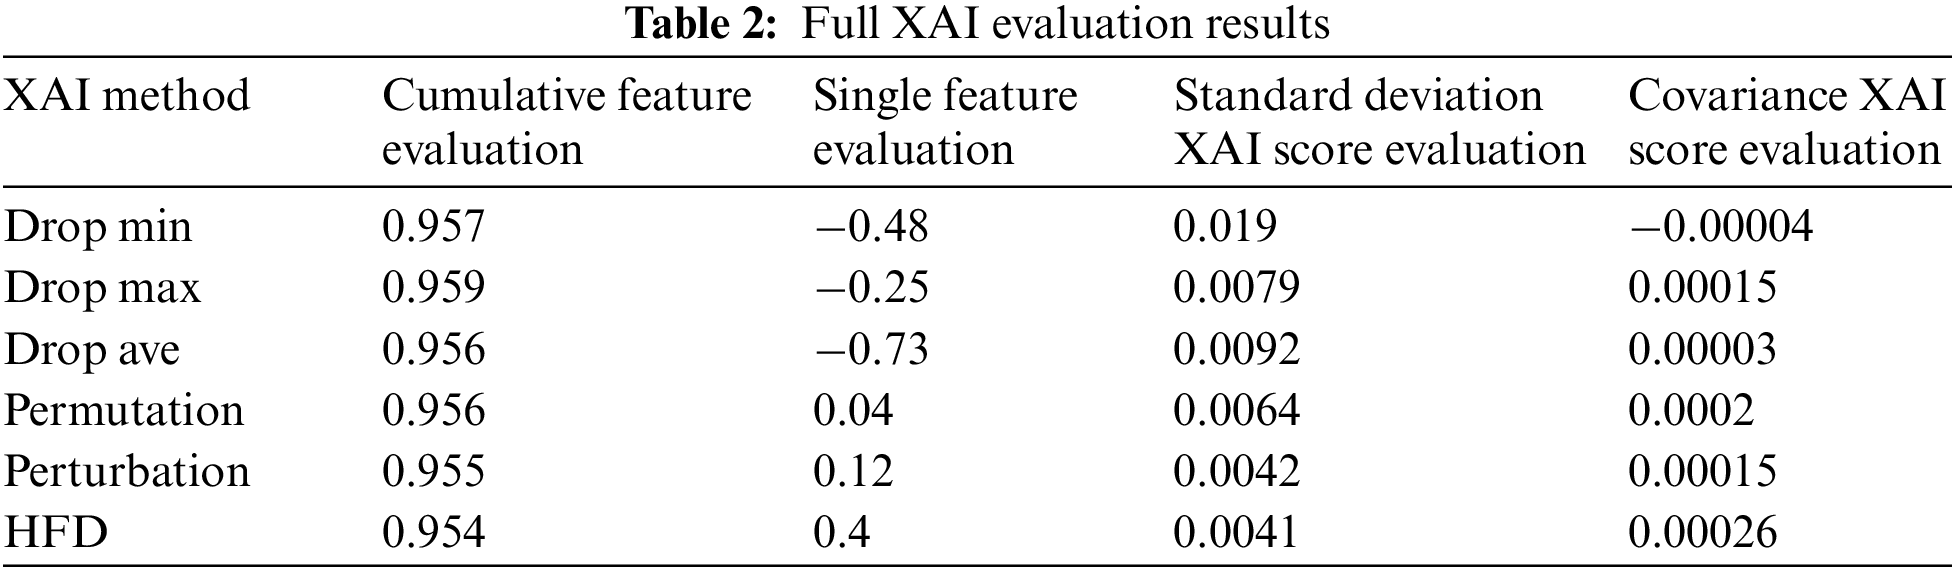
To summarize the evaluation, there are no significant differences in the values of the evaluations for calculating the ranking of critical features as a whole. However, evaluations of the appropriateness of the XAI score range do show significant differences among the XAIs. In addition, since evaluating critical feature ranking calculations has different meanings depending on whether it is the result of accumulating features or of a single feature, differences appear in the XAI rankings. However, the standard deviation– and covariance-based evaluations show similar results because the evaluation of the appropriateness of the XAI score range differs only in the method, being evaluated through the ratio of the actual accuracy decrease and the XAI score when the feature is removed.
XAI methods are lightweight models that do not require long processing times to change the test data in training and testing. However, the method of deleting features for evaluation had the disadvantage that measuring accuracy by deleting features in training and test data was heavy and time-consuming. Because the method depends on removing features, local analysis is also impossible, leaving only global analysis. However, since feature values were not affected by the change value in the importance extraction, they showed more accurate results and could be used for labeling.
This paper presents a hybrid feature dropout method that mitigates the problems of the feature removal XAI method for increasing the reliability of AI models. The XAI method, which measures accuracy after removing features by replacing them with 0 or the maximum value, is problematic. The higher the ratio of the original feature value to the changed feature value, the lower the importance of the feature, which has an effect. Therefore, the research added a new feature containing the original value’s information and used the data from all cases for learning so that the original feature value is not affected by the importance. The SHAP method, which has the best results among currently existing black-box-based XAI methods, is applied to extract features from the learned model. To verify the importance of the features calculated by the proposed Hybrid Feature Dropout method, Permutation, Perturbation, and Feature Drop methods were compared with four evaluation criteria. Since the current XAI evaluation method does not have a different standard, the feature importance ranking and the appropriateness of the XAI score range are evaluated according to the evaluation criteria described in Section 4. As seen in the results presented in Section 5, the feature importance results of XAIs appear to differ. In the experiment, a malware data AI classifier with a high accuracy of 96.82% is used as a criterion. Based on the XAI evaluation, the proposed HFD showed the best results across all four evaluation criteria. The original feature values more accurately calculate the features essential for AI classification when solving problems that affect contribution. In the future, it is expected that the importance of features will be expressed more fairly in a black-box model without labels. This will become a standard for the fair evaluation of the XAI method and support the efficiency of interpretation. We plan to add a feature importance method for backtracking ways such as LRP other than post-hoc XAI and apply evaluation criteria to point data sets and time-series data XAI models.
Funding Statement: This work was supported by an Institute of Information and Communications Technology Planning and Evaluation (IITP) grant funded by the Korean government (MSIT) (No. 2022-0-00089, Development of clustering and analysis technology to identify cyber-attack groups based on life-cycle) and the Institute of Civil Military Technology Cooperation funded by the Defense Acquisition Program Administration and Ministry of Trade, Industry and Energy of Korean government under grant No. 21-CM-EC-07.
Conflicts of Interest: The authors declare that they have no conflicts of interest to report regarding the present study.
References
1. A. Hamza, A. R. R. Javed, F. Iqbal, N. Kryvinska, A. S. Almadhor et al., “Deepfake audio detection via MFCC features using machine learning,” IEEE Access, vol. 10, pp. 134018–134028, 2022. [Google Scholar]
2. A. Tarhini, A. Harfouche and M. D. Marco, “Artificial intelligence-based digital transformation for sustainable societies: The prevailing effect of COVID-19 crises,” Pacific Asia Journal of the Association for Information Systems, vol. 14, no. 2, pp. 1–4, 2022. [Google Scholar]
3. C. Dhasarathan, M. K. Hasan, S. Islam, S. Abdullah, U. A. Mokhtar et al., “COVID-19 health data analysis and personal data preserving: A homomorphic privacy enforcement approach,” Computer Communications, vol. 199, no. 1, pp. 87–97, 2023. [Google Scholar] [PubMed]
4. S. Aslani and J. Jacob, “Utilisation of deep learning for COVID-19 diagnosis,” Clinical Radiology, vol. 78, no. 2, pp. 150–157, 2023. [Google Scholar] [PubMed]
5. F. Kamalov, K. Rajab, A. K. Cherukuri, A. Elnagar and M. Safaraliev, “Deep learning for Covid-19 forecasting: State-of-the-art review,” Neurocomputing, vol. 511, pp. 142–154, 2022. [Google Scholar] [PubMed]
6. J. D. Olden, M. K. Joy and R. G. Death, “An accurate comparison of methods for quantifying variable importance in artificial neural networks using simulated data,” Ecological Modelling, vol. 178, pp. 389–397, 2004. [Google Scholar]
7. J. D. Olden and D. A. Jackson, “Illuminating the “black box: A randomization approach for understanding variable contributions in artificial neural networks,” Ecological Modelling, vol. 154, pp. 135–150, 2002. [Google Scholar]
8. R. Y. M. Li, L. Song, B. Li, M. J. C. Carbbe and X. G. Yue, “Predicting car park prices indices in Hong Kong using autoML,” CMES-Computer Modeling in Engineering & Sciences, vol. 134, no. 3, pp. 2247–2282, 2022. [Google Scholar]
9. StackExchange Cross Validated, “neural networks–Variable importance in RNN or LSTM,” 2019 [Online]. Available: https://stats.stackexchange.com/questions/191855/variableimportance-in-rnn-or-lstm [Google Scholar]
10. C. Molnar, “Interpretable machine learning: A guide for making black box models explainable,” 2019 [Online]. Available: https://christophm.github.io/interpretable-ml-book/ [Google Scholar]
11. StackExchange Cross Validated, “Feature selection using deep learning?,” 2016 [Online]. Available: https://stats.stackexchange.com/questions/250381/featureselection-using-deep-learning [Google Scholar]
12. N. Srivastava, G. Hinton, A. Krizhevsky, I. Sutskever and R. Salakhutdinov, “Dropout: A simple way to prevent neural networks from overfitting,” Journal of Machine Learning Research, vol. 15, pp. 1929–1958, 2014. [Google Scholar]
13. C. H. Chang, L. Rampasek and A. Goldenberg, “Dropout feature ranking for deep learning models,” arXiv Computer Science Machine Learning, arXiv:1712.08645, 2017. [Google Scholar]
14. L. S. Shapley, “A value for n-person games,” Contributions to the Theory of Games, vol. 2, no. 28, pp. 307–317, 1953. [Google Scholar]
15. J. B. Awotunde, E. A. Adeniyi, S. A. Ajagbe, A. L. Imoize O. A. Oki et al., “Explainable artificial intelligence in medical decision support systems (MDSSApplicability, prospects, legal implications, and challenges,” in The Institution of Engineering and Technology, Croydon UK, pp. 45–90, 2022. [Online]. Available: https://digital-library.theiet.org/content/books/10.1049/pbhe050e_ch2 [Google Scholar]
16. A. Hartl, M. Bachl, J. Fabini and T. Zseby, “Explainability and adversarial robustness for RNNs,” in Proc. 2020 IEEE Sixth Int. Conf. on Big Data Computing Service and Applications, Oxford, UK, pp. 148–156, 2020. [Google Scholar]
17. A. Altmann, L. Tolosi, O. Sander and T. Lengauer, “Permutation importance: A corrected feature importance measure,” Bioinformatics, vol. 26, no. 10, pp. 1340–1347, 2010. [Google Scholar] [PubMed]
18. N. Huang, G. Lu and D. Xu, “A permutation importance–based selection method for short-term electricity load forecasting using random forest,” Energies, vol. 9, no. 10, pp. 767, 2016. [Google Scholar]
19. S. M. Lundberg and S. -I. Lee, “A unified approach to interpreting model predictions,” in Proc. NIPS’17: Proc. of the 31st Int. Conf. on Neural Information Processing Systems, New York, NY, USA, pp. 4765–4774, 2017. [Google Scholar]
20. H. Kim, Y. Lee, E. Lee and T. Lee, “Cost-effective valuable data detection based on the reliability of artificial intelligence,” IEEE Access, vol. 9, pp. 108959–108974, 2021. [Google Scholar]
21. T. Parr, K. Turgutlu, C. Csiszar and J. Howard, “Beware default random forest importance,” Explained.ai, 2018. [Online]. Available: https://explained.ai/rf-importance/ [Google Scholar]
22. S. Mohseni, N. Zarei and E. D. Ragan, “A multidisciplinary survey and framework for design and evaluation of explainable AI systems,” ACM Transactions on Interactive Intelligent Systems, vol. 11 (3–4no. 24, pp. 1–45, 2021. [Google Scholar]
23. E. Costanza, J. E. Fischer, J. A. Colley, T. Rodden, S. D. Ramchurn et al., “Doing the laundry with agents: A field trial of a future smart energy system in the home,” in Proc. CHI ‘14: Proc. of the SIGCHI Conf. on Human Factors in Computing Systems, Toronto Ontario Canada, pp. 813–822, 2014. [Google Scholar]
24. M. Bilgic and R. Mooney, “Explaining recommendations: Satisfaction vs. promotion,” in Proc. of Beyond Personalization Workshop, San Diego California, pp. 13–18, 2005. [Google Scholar]
25. F. Gedikli, D. Jannach and M. Ge, “How should I explain? A comparison of different explanation types for recommender systems,” International Journal of Human-Computer Studies, vol. 72, no. 4, pp. 367–382, 2014. [Google Scholar]
26. I. Lage, E. Chen, J. He, M. Narayanan, B. Kim et al., “Human evaluation of models built for interpretability,” Proceedings of the AAAI Conference on Human Computation and Crowdsourcing, vol. 7, no. 1, pp. 59–67, 2019. [Google Scholar] [PubMed]
27. B. Cahour and J. F. Forzy, “Does projection into use improve trust and exploration? an example with a cruise control system,” Safety Science, vol. 47, no. 9, pp. 1260–1270, 2009. [Google Scholar]
28. M. Nourani, S. Kabir, S. Mohseni and E. D. Ragan, “The effects of meaningful and meaningless explanations on trust and perceived system accuracy in intelligent systems,” Proceedings of the AAAI Conference on Human Computation and Crowdsourcing, vol. 7, pp. 97–105, 2019. [Google Scholar]
29. S. M. Lundberg and S. Lee, “A unified approach to interpreting model predictions,” in Proc. Advances in Neural Information Processing Systems, Red Hook, NY, USA, pp. 4765–4774, 2017. [Google Scholar]
30. A. Warnecke, D. Arp, C. Wressnegger and K. Rieck, “Evaluating explanation methods for deep learning in security,” in Proc. 2020 IEEE European Symp. on Security and Privacy (EuroS&P), Genoa, Italy, 2020. [Google Scholar]
31. J. Kim, C. Hwang and T. Lee, “A study on evaluation methods for interpreting AI results in malicious code analysis,” Journal of the Korea Institute of Information Security & Cryptology, vol. 31, no. 6, pp. 1193–1204, 2022. [Google Scholar]
32. A. Khan and A. Mathelier, “Intervene A tool for intersection and visualization of multiple gene or genomic region sets,” BMC Bioinformatics, vol. 18, no. 287, p. 1–8, 2017. [Google Scholar]
33. D. Kim, A. Jeong and T. Lee, “Analysis of malware group classification with eXplainable artificial intelligence,” Journal of the Korea Institute of Information Security & Cryptology, vol. 31, no. 4, pp. 559–571, Aug. 2021. [Google Scholar]
34. D. Gavrilut, M. Cimpoesu, D. Anton and L. Ciortuz, “Malware detection using machine learning,” in Proc. 2009 Int. Multiconference on Computer Science and Information Technology, Mragowo, Poland, pp. 735–741, 2009. [Google Scholar]
Cite This Article
 Copyright © 2023 The Author(s). Published by Tech Science Press.
This work is licensed under a Creative Commons Attribution 4.0 International License , which permits unrestricted use, distribution, and reproduction in any medium, provided the original work is properly cited.
 Downloads
 Citation Tools