
 Submit a Paper
 Propose a Special lssue
 Open Access
REVIEW
A Survey on Acute Leukemia Expression Data Classification Using Ensembles
1 Department of Information Systems, Faculty of Computer Science, Misr International University, Cairo, 11828, Egypt
2 Department of Information Technology, Faculty of Computers and Informatics, Zagazig University, Zagazig, 44516, Egypt
3 Department of Information Systems, Faculty of Computers and Informatics, Zagazig University, Zagazig, 44516, Egypt
* Corresponding Author: Mona Gamal. Email:
Computer Systems Science and Engineering 2023, 47(2), 1349-1364. https://doi.org/10.32604/csse.2023.033596
Received 21 June 2022; Accepted 23 November 2022; Issue published 28 July 2023
 View Full Text
 Download PDF
Abstract
Acute leukemia is an aggressive disease that has high mortality rates worldwide. The error rate can be as high as 40% when classifying acute leukemia into its subtypes. So, there is an urgent need to support hematologists during the classification process. More than two decades ago, researchers used microarray gene expression data to classify cancer and adopted acute leukemia as a test case. The high classification accuracy they achieved confirmed that it is possible to classify cancer subtypes using microarray gene expression data. Ensemble machine learning is an effective method that combines individual classifiers to classify new samples. Ensemble classifiers are recognized as powerful algorithms with numerous advantages over traditional classifiers. Over the past few decades, researchers have focused a great deal of attention on ensemble classifiers in a wide variety of fields, including but not limited to disease diagnosis, finance, bioinformatics, healthcare, manufacturing, and geography. This paper reviews the recent ensemble classifier approaches utilized for acute leukemia gene expression data classification. Moreover, a framework for classifying acute leukemia gene expression data is proposed. The pairwise correlation gene selection method and the Rotation Forest of Bayesian Networks are both used in this framework. Experimental outcomes show that the classification accuracy achieved by the acute leukemia ensemble classifiers constructed according to the suggested framework is good compared to the classification accuracy achieved in other studies.Keywords
Leukemia is a worldwide disease that looms up survives of thousands of people about the world. In 2020, there were an estimated 474,519 leukemia cases and 311,594 leukemia deaths worldwide [1]. Leukemia is the fifth-deadliest cancer in the world [2]. It is also the most frequent kind of cancer among kids under the age of 15 [3].
In the blood cancer known as leukemia, massive quantities of malignant white blood cells build up in the blood and bone marrow, squeezing out healthy ones. Because of a shortage of healthy red blood cells, the body may have a harder time transporting oxygen to tissues, fighting infections, and stopping bleeding. The type of leukemia depends on the kind of blood cell the cancer starts in (myeloid or lymphoblastic) and on the speed at which the illness gets worse (acute or chronic). Chronic myeloid leukemia (CML), Acute myeloid leukemia (AML), chronic lymphoblastic leukemia (CLL), and acute lymphoblastic leukemia (ALL) are the 4 most common forms of leukemia [4]. Chronic forms of leukemia grow slowly, while acute forms have explosive growth that may cause the patient to die quickly within months or even weeks if it is identified at later phases or if the treatment is hindered.
Different types of acute leukemia require different treatments. Although AML treatment is effective in reducing the symptoms of ALL and vice versa, it has a low cure rate and causes unnecessary side effects in certain patients [5]. Therefore, differentiating AML from ALL is critical for successful acute leukemia treatment. Currently, a tumor’s morphology, cytogenetics, immunophenotyping, and histochemistry are all interpreted by hematologists in their own specified laboratories. Though leukemia classification is typically precise, it remains defective, and mistakes do occur. Moreover, these advanced and precise tests are very expensive and may not be available in most hospitals in developing countries. Therefore, alternative methods have been proposed to overcome these drawbacks.
Many researchers, for example, used blood smear and bone marrow microscopic images to perform morphological classification of acute leukemia subtypes [4,6,7]. However, because cancer is a genetic disease caused by gene mutations [8], other researchers preferred to classify cancer at the genotype level, and several studies have already demonstrated the efficiency and effectiveness of using microarray gene expression data to classify acute leukemia. The classification methods used in these studies include Bayesian classifiers [9,10], Support Vector Machines (SVMs) [10–12], Artificial Neural Networks (ANNs) [13,14], Decision Trees (DTs) [15,16], K-Nearest Neighbor (K-NN) [10,17], Linear Discriminant Analysis (LDA) [18], and many others.
The difficulty in using microarray gene expression datasets is that they contain only a small number of samples compared to thousands of features (genes). This degrades the performance. So, performing gene selection to select only the prominent genes that can discriminate between the classes before the actual learning process is very important. So, the process of classifying microarray gene expression datasets is typically carried out in two main steps [19]: 1) gene selection and 2) classifier training.
Ensemble classifiers are so promising and have attracted very significant attention from researchers in a wide variety of disciplines, like illness analysis [20], finance [21], bioinformatics [22], healthcare [23], manufacturing [24], and geography [25]. This paper reviews the recent literature regarding the use of ensemble classifiers in the classification of acute leukemia gene expression data to understand the current trends and to suggest some potential future research directions. Furthermore, a framework is proposed to classify acute leukemia gene expression data by combining the pairwise correlation gene selection method with the Rotation Forest of Bayesian Networks (BNs).
The rest of this work is prearranged as follows: Section 2 offers the necessary background about the DNA microarray technology, the gene selection techniques, and ensemble machine learning. Previous studies are presented and compared in Section 3. Methods used in the proposed framework are provided in Section 4. The proposed framework is introduced in Section 5. The experimental outcomes are presented and analyzed in Section 6, and lastly, Section 7 summarizes our conclusions and outlines future work.
Except for viruses, all living things on the earth consist of cells. Deoxyribonucleic Acid (DNA) is found inside the nucleus of every cell. Non-coding and coding parts exist in DNA. Coding parts are called “genes”. Genes determine the structure of “proteins”, which are big molecules that carry out the essential work in each creature.
Different subsets of any living cell’s genes are expressed throughout various biological processes. The expression of genes at a given phase and their comparative abundance have a significant impact on a cell’s ability to function properly. Biological processes can only be grasped by a careful examination of the levels of gene expression across a wide range of species, evolutionary states, tissues, and disease states. This sort of knowledge is useful for a wide range of molecular biological purposes, including gene function description, therapy result prediction, and process elucidation.
DNA microarrays allow scientists to determine the expression levels of thousands of genes concurrently in just one test, giving a comprehensive understanding of the cell. Each DNA sample in the DNA microarray experiment is mounted to a glass microscope slide, every at a specific position in the array, referred to as a “gene chip”. mRNAs that have been isolated from various tissue samples or under various circumstances are marked with two diverse fluorochromes (typically the green Cy3 and the red Cy5) before being crossbred with the displayed DNA probes on the slide. The log proportion among the two dye intensities is calculated to determine the gene expression data (named G) by a fluorescence microscope and image examination,
The main objective of gene selection is to choose a set of genes from the input dataset that can successfully express the input dataset without losing information. Methods for selecting genes go into one of three broad categories: filter, wrapper, or embedded [8,19].
Independent of any learning algorithm, filter methods choose a subset of genes using the intrinsic features of the data. Signal-to-Noise Ratio (SNR) [27], Information Gain (IG) [28], Minimum Redundancy Maximum Relevance (MRMR) [29], and Fast Correlation-Based Filter (FCBF) [30] are examples of filter gene selection methods.
The performance of classifiers is used by the wrapper methods to assess the value of gene subsets. Artificial Bee Colony (ABC) [31], Ant Colony Optimization (ACO) [32], Particle Swarm Optimization (PSO) [33], and Genetic Algorithm (GA) [34] are among the wrapper methods found in the literature.
Embedded methods take gene selection as part of the model building. They train some machine learning algorithm and obtain the weight coefficients of each gene. Then, they select important genes according to the weight coefficients. Random Forest [35], regularized logistic regression [36], and Least Absolute Shrinkage and Selection Operator (LASSO) [37] are examples of embedded gene selection methods.
The recent trend has been to focus on combinations of gene selection methods known as “hybrid or ensemble methods” rather than using only typical gene selection methods [38–40]. Hybrid methods combine two or more different, conceptually derived gene selection techniques. The advantages of the filter and wrapper approaches are combined in the hybrid technique. The notion behindhand the hybrid method is that after removing the unnecessary genes from the original dataset using the filter approach, the best gene subset is found using the wrapper approach.
Ensemble machine learning is a method that combines a group of base classifiers and aggregates their outcomes to classify new instances. Ensemble systems are better than single classifiers due to several reasons [41]:
■ Ensemble systems reduce the possibility of bad selection.
■ Resampling methods are actual efficient.
■ Composite decision boundaries can be easily learned.
■ Ensemble systems are beneficial with heterogeneous data.
The learning procedure of ensemble algorithms includes the following two steps [42]:
1. Constructing base classifiers: This step includes the following:
1.1 The input training data is perturbed as part of the data processing phase in order to make it suitable for base classifier construction.
1.2 Build base classifiers for the perturbed data.
2. Voting: The next phase involves combining the base classifiers developed in the first phase in the final ensemble model. The two most common types of voting systems are:
2.1. Weighted voting: Every base classifier is given a different voting weight in weighted voting.
2.2. Unweighted voting: Every candidate base classifier is given the same voting weight in an unweighted method, and the one that receives the highest votes is declared the winner.
There are two fundamental requirements for the classifiers which make up an ensemble, since the effectiveness of the ensemble is largely dependent on the quality of its constituent parts [43]:
■ Diversity: Using the same classifiers to build the ensemble would not boost the accuracy because similar classifiers typically make the same errors. Diversification may be accomplished in a number of ways, such as training each individual member with different parameters, or combining completely different sets of classifiers [41].
■ Accuracy: Having a classifier that doesn’t do well will degrade the overall performance.
Many techniques have been devised for constructing ensembles. Some of these techniques include, as stated in the literature [43]:
A. Diverse classifier methods
Learning methods from different backgrounds, including decision trees, neural networks, etc., may be combined to great advantage. The same algorithm may also be used with some adjustments to the variables set by the user.
B. Diverse feature subsets
To build classifiers, we extract different feature subsets from the training dataset using either the deterministic or random methods. Instead of being dependent on prior knowledge about the input data, like the deterministic technique does, the random method employs a random subspace strategy to choose the various subsets of features. Every classifier here is selected on a random space, and a feature in the subset is picked using a probabilistic method.
C. Diverse training sets
To create an ensemble, several learners are developed using the same learning method, but on distinct random subsets of the dataset. Random subsets of the dataset may be generated using resampling or reweighting. Bagging is a method for creating new training datasets by resampling the original training set with substitution. Boosting and arcing utilize reweighing the training data. In order to improve accuracy, boosting reweights the training dataset based on the error rate of the former base learner. Arcing improves behavior based on the aggregation of all previous mistakes. When building a new base learner, arcing considers the mistakes of all prior base classifiers, whereas boosting just considers the preceding base classifier.
D. Diverse fusion schemes
The outputs of base classifiers are aggregated using different fusion schemes. There are 3 different kinds of base model outputs:
1. Output at an abstract level, where every classifier generates a distinct class label for every input instance.
2. Output at a rank level, Classifiers give a ranked list of class labels for every input instance.
3. Output at a measurement level, Classifiers provide a vector of continuous values that may be interpreted as estimates of posterior probability for classes or as confidence values for potential class hypothesis.
The following procedures may be used to merge class labels produced by several classifiers:
1. Every classifier in the ensemble gets an equal vote, and the ensemble chooses the most widely accepted categorization based on a simple majority vote. As a whole, there are three distinct forms of majority voting:
A.Classification system that is universally accepted (unanimous voting).
B.Classified by more than half the available predictors (simple majority).
C.One with the most votes, regardless if or not that amount is more than 50% (plurality voting or just majority voting).
2. Given the potential benefits of weighted majority voting, it may be advantageous to give greater weight to the votes of those experts who have been shown to be more knowledgeable in order to improve performance.
The continuous outcome of a classifier is taken to be the posterior probability for that class, indicating the level of confidence the classifier has in its classification. Algebraic combiners like the sum rule, the product rule, the maximum rule, and the median rule are used to merge the classifiers’ decisions in continuous outcome form.
Recently, researchers have focused more on ensemble classifiers as they are believed to overcome the individual deficiencies and weaknesses exhibited by individual classifiers. Among the leukemia diagnosis studies conducted over the years, many researchers focused on utilizing the ensemble classifiers for the morphological classification of leukemia subtypes using blood smear and bone marrow microscopic images [5,7,41]. On the other hand, some researchers have proven the effectiveness of ensemble machine learning algorithms for the classification of acute leukemia gene expression data, as shown in Table 1.
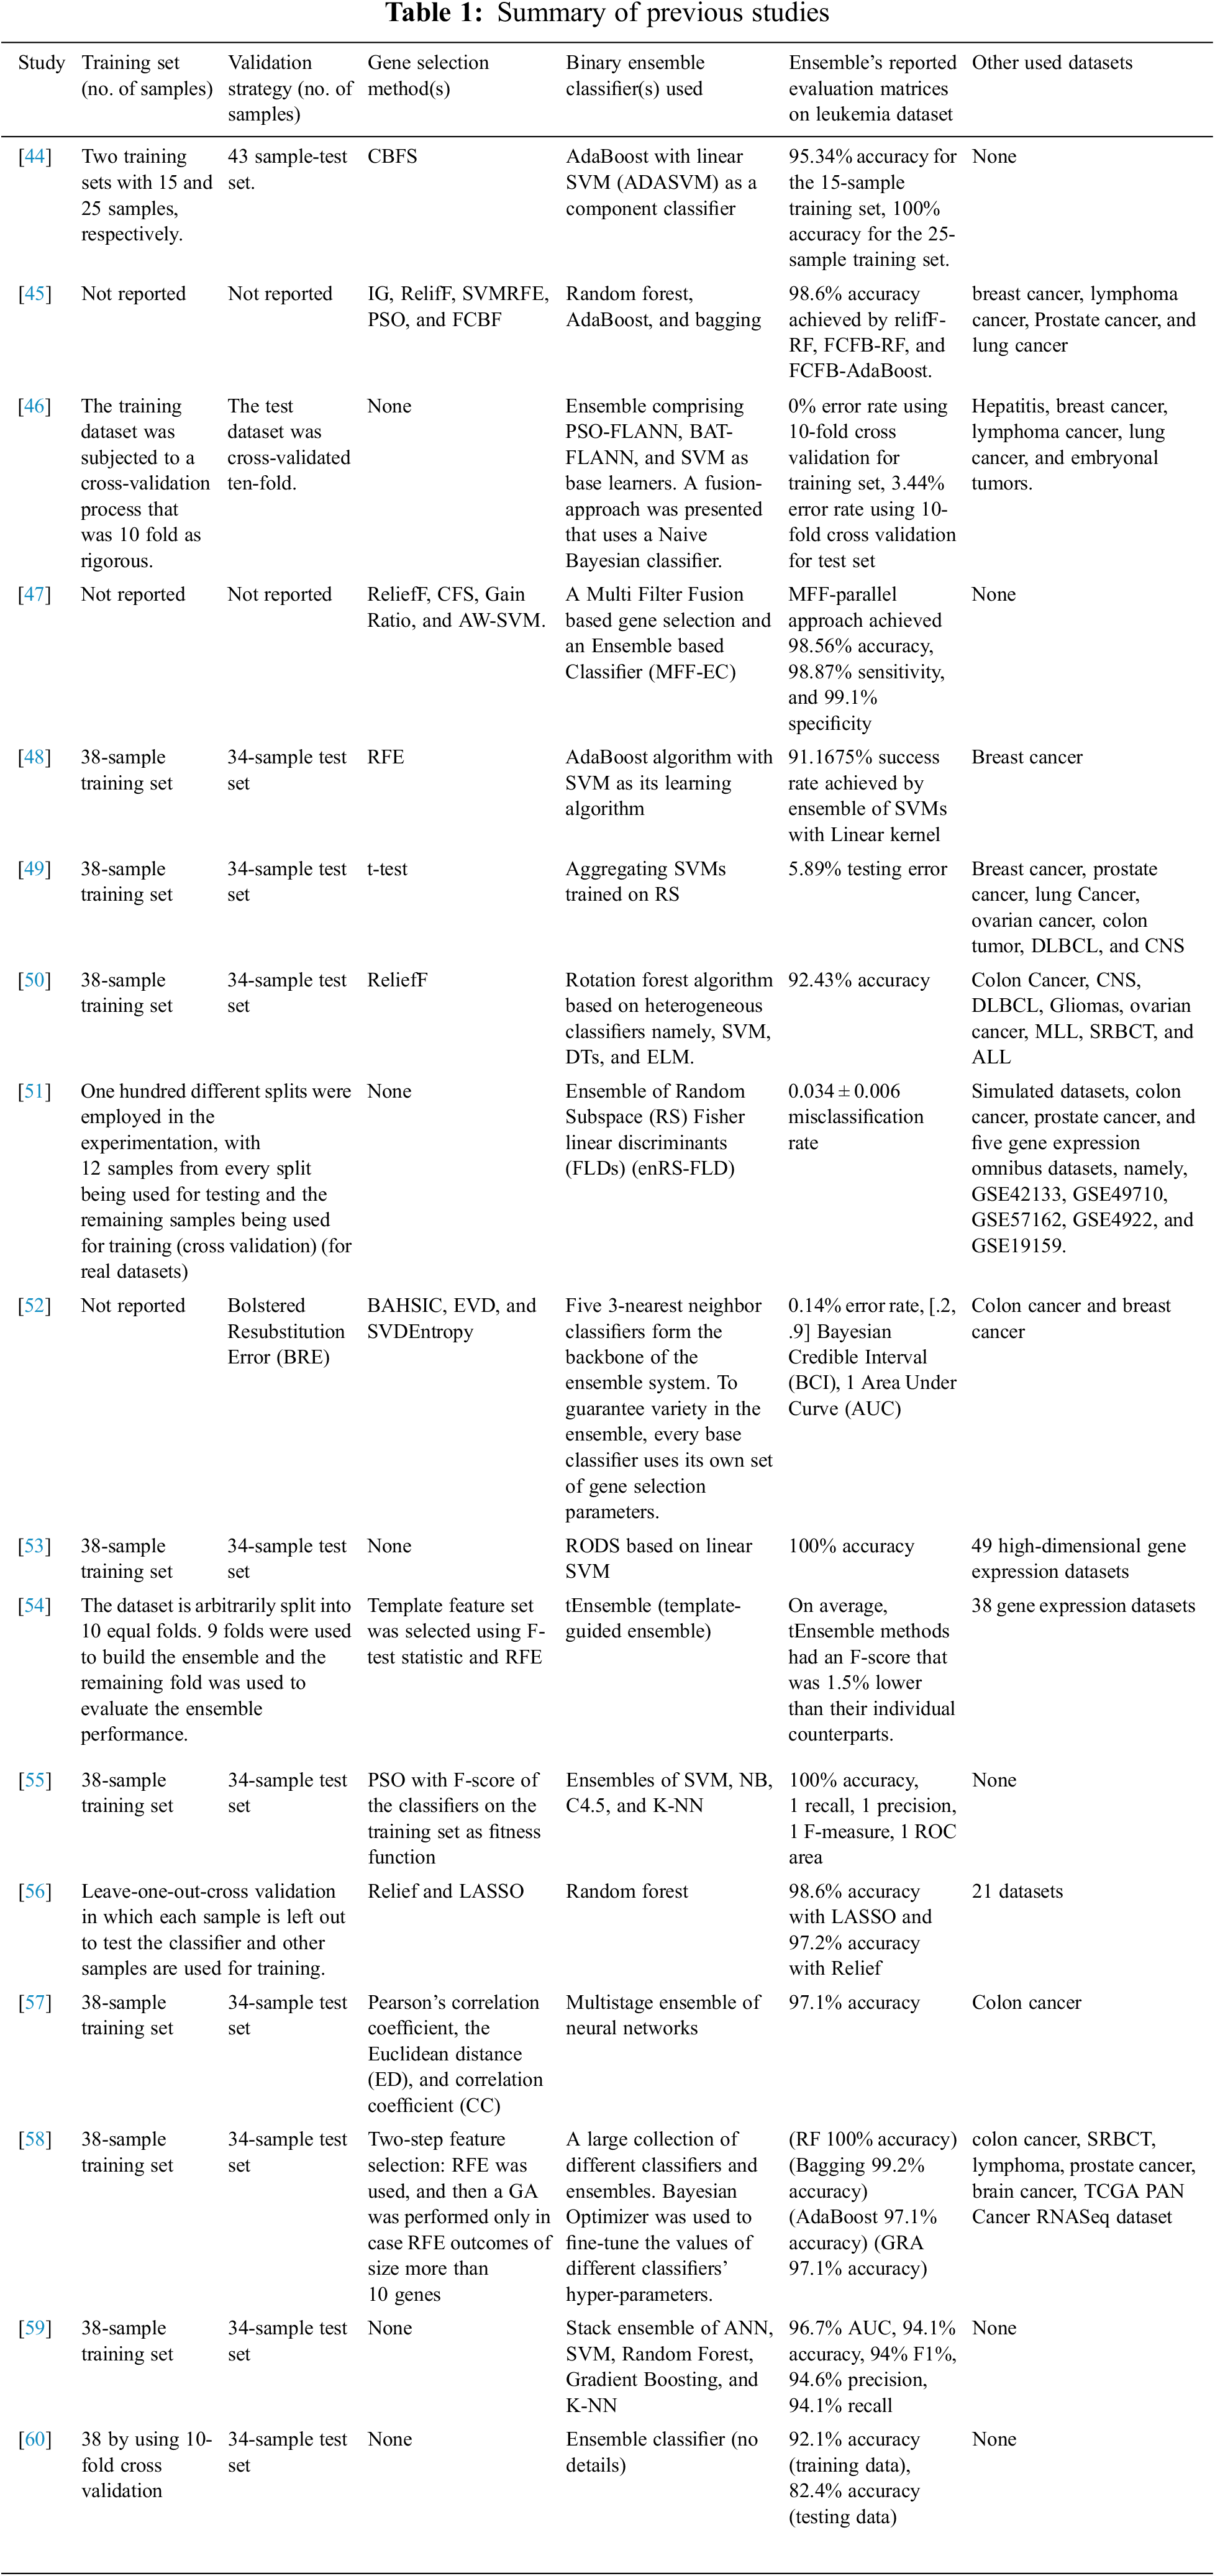
In [44], leukemia data were categorized using AdaBoost with linear SVM as a base classifier (ADASVM). The choice of biomarkers was made using the Consistency Based Feature Selection (CBFS) algorithm. According to the results on the leukemia dataset, ADASVM outperformed SVM and K-NN.
In [45], various cancer classification methods, namely, Naïve Bayesian, SVM, K-NN, adaBoost, bagging, and Random Forest, in conjunction with various gene selection methods, namely, IG, RelifF, Support Vector Machine Recursive Feature Elimination (SVMRFE), PSO, and FCBF were evaluated on leukemia, prostate cancer, breast cancer, lung cancer, and lymphoma datasets. For the leukemia dataset, ReliefF-RF, FCFB-RF, and FCFB-AdaBoost achieved the second best accuracy, precisely 98.6%.
In [46], the researchers proposed a new fusion procedure that uses a Naive Bayesian classifier. The Particle Swarm Optimization-Functional Link Neural Network (PSO-FLANN), Bat Inspired-Functional Link Artificial Neural Network (BAT-FLANN), and SVM have been used as component classifiers. The experiments have been carried out using six benchmark datasets, namely, leukemia, breast cancer, lung cancer, hepatitis, lymphoma, and embryonal tumors. For the leukemia dataset, the proposed ensemble achieved a 0% error rate using 10-fold cross validation for the training set and a 3.44% error rate using 10-fold cross validation for the test set.
In [47], a Multi-Filter Fusion based gene selection method and an Ensemble based Classifier (MFF-EC) was suggested. ReliefF, Correlation-based Feature Selection (CFS), Gain Ratio, and Absolute Weight–SVM (AW-SVM) were used as gene selection methods. Both parallel and sequential approaches have been used for gene selection and fusion. AdaBoost and Bagging have been used to construct the ensemble classifier with Naive Bayes and K-NN as base models. The accuracy, sensitivity, and specificity of the MFF-parallel method were satisfactory on the leukemia gene expression dataset, with average values of 98.56%, 98.87%, and 99.1%, respectively.
In [48], RFE was combined with the AdaBoost method, which employed the SVM as its learning algorithm. For the leukemia dataset, the ensemble of SVMs with a linear kernel achieved the highest success rate, specifically 91.175%.
In [49], gene expression data were classified by aggregating SVMs trained on Random Subspaces (RS). To evaluate the effectiveness of RS-SVM, experiments were performed using eight gene expression datasets, namely, breast cancer, lung cancer, prostate cancer, colon tumor, leukemia cancer, ovarian cancer, Central Nervous System (CNS), and Diffuse Large B Cell Lymphoma (DLBCL). For the leukemia dataset, RS-SVM achieved a 5.89% testing error.
In [50], a rotation forest algorithm based on heterogeneous classifiers, namely, SVM, DTs, and Extreme Learning Machine (ELM) was presented. ReliefF algorithm was used for gene selection. In order to assess the suggested approach, the researcher used nine gene expression datasets, namely, colon cancer, CNS, DLBCL, Gliomas, ovarian cancer, Mixed Lineage Leukemia (MLL), Small Round Blue Cell Tumor (SRBCT), leukemia, and Acute Lymphoblastic Leukemia (ALL). The proposed algorithm achieved 92.43% accuracy on the leukemia dataset.
In [51], the researchers utilized an ensemble of Random Subspace Fisher linear discriminants (enRS-FLD). The researchers studied the performance of non-correlation-based classifiers, namely, Diagonal Linear Discriminant Analysis classifiers using all genes (allDLDA), Diagonal Linear Discriminant Analysis classifiers using filtered genes (filterDLDA), and Prediction Analysis of Microarrays (PAM) and correlation-based classifiers, namely, enRS-FLD and SVM, using both simulated and real datasets. For the leukemia dataset, enRS-FLD achieved a 0.034 ± 0.006 misclassification rate.
In [52], an ensemble system with 5 base classifiers that uses the 3-Nearest Neighbor method was proposed. To achieve the ensemble diversity, every classifier used its own parameters for gene selection. The first three classifiers employed the Backward Elimination Hilbert-Schmidt Independence Criterion (BAHSIC) gene selection algorithm with different numbers of genes (50, 5, and 25, respectively). The fourth base classifier employed the Extreme Value Distribution (EVD) based gene selection algorithm with an automated algorithm for defining the number of genes to select, and the last base classifier employed the Singular Value Decomposition Entropy (SVDEntropy) gene selection algorithm. Their experiments were conducted using three gene expression datasets, namely, leukemia, colon, and breast cancer datasets. For the leukemia dataset, the proposed ensemble achieved a 0.14% error rate.
In [53], the Random ensemble Oblique Decision Stumps (RODS) based on linear SVM were investigated. The suggested algorithms, known as Bag-RODS and Boost-RODS, trained several RODS classifiers in the way of Bagging and Boosting to create a more accurate ensemble of classifiers than a single model. A total of 50 gene expression datasets were used to conduct experiments in this research. Both Bag-RODS and Boost-RODS obtained 100% accuracy for the leukemia dataset.
In [54], a simple approach referred to as tEnsemble that used a previously optimized template feature set was introduced. Experiments carried out on 39 gene expression datasets indicated that the proposed methodology had the potential to produce effective ensemble classifiers. For the leukemia dataset, when the performance of different configurations of tEnsemble was compared to single DTs, SVMs, and Logistic Regression (LR) models trained on the same template features, the tEnsemble model did not outperform the average performance of its corresponding single classifier in 4 out of 12 cases, and the average difference in F-score among tEnsemble models and the corresponding single models was −1.5%.
In [55], the researcher used an ensemble of 4 classifiers: SVM, K-NN, Naïve Bayesian, and C4.5 DT in conjunction with PSO gene selection method. The proposed ensemble achieved 100% accuracy on the leukemia dataset.
In [56], informative genes were picked using Relief and LASSO. After that, classification was performed with Random Forest, Multilayer Perceptron Networks (MLP), and SVM. 22 datasets were employed to conduct the experiments. For the leukemia dataset, random forest achieved 98.6% accuracy with LASSO and 97.2% accuracy with Relief.
In [57], a multistage ensemble of neural networks was proposed for classifying cancer gene expression data. First, the most relevant genes were extracted, and then the multistage ensemble was applied, where the classified copy of results of training samples from first-stage neural networks was used as input features for second-stage neural networks. The recognition accuracy of the proposed ensemble was checked for two datasets, namely, the leukemia and colon cancer datasets. For the leukemia dataset, the multistage ensemble gave 97.1% accuracy.
In [58], a framework consisting of a pipeline of approaches for data preprocessing, gene selection, and classification was proposed. The standard scaling and normalization were used for data preprocessing. Two steps were performed in the gene selection process. RFE was employed initially, and GA was only used when RFE produced a gene subset that was larger than a predetermined threshold. The next step involved using a meta-pool of various individual as well as ensemble classifiers, such as LR, bagging, AdaBoost, Random Forest, ANN, K-NN, SVM, Gradient Boosting, LR with cross-validation, Quadratic Discriminant Analysis (QDA), Nu-SVM, DT, Linear Discriminant Analysis, Gaussian Naïve Bayes, and Extra Trees Classifier (ETC). Using Bayesian optimization, the hyper-parameters of every meta-pool participant were optimized. The most accurate classifier from the meta-pool was chosen using an algorithm that took computation time and classification accuracy into account. The Gaussian NB was chosen as the best learner for the leukemia data.
In [59], the researchers used the SVM, ANN, and stack ensemble of ANN, SVM, Random Forest, Gradient Boosting, and K-NN to classify acute leukemia gene expression data. The ensemble technique performance exceeded 94% for the used evaluation metrics, namely, AUC, accuracy, F1, precision, and recall.
In [60], the researchers used K-NN, LDA, SVM, and ensemble classifier to classify acute leukemia gene expression data. LDA and SVM outperformed the ensemble classifier in most cases.
4.1 Pairwise Correlation Gene Selection Method
The CFS approach served as inspiration for the pairwise correlation filter gene selection approach. The pairwise correlation determines the value of a given gene
where
Probabilistic graphical language for representing and reasoning about knowledge, BNs have many applications. The joint probability distributions over a set of random variables can be efficiently and effectively described by BNs using a Directed Acyclic Graph (DAG). Each node in the graph corresponds to a discrete random variable in the domain. An edge Y → X denotes a parent-child relationship, where Y is the parent and X is the child, and the edge express conditional dependency. Variables that are conditionally independent of one another are represented by nodes that are not connected. The conditional probability table that corresponds to each node in the BN structure specifies the likelihood of each potential state of the node given every possible combination of states of its parents.
The BN’s qualitative part is the description of its DAG structure. The quantitative part is provided by specifying the conditional probability distribution at every node. In many cases, the local probability that a child node receives for every one of its conceivable states for a given collection of states of its parents is tabulated to indicate the conditional probability distribution for discrete random variables. It is possible to determine the joint distribution of many variables by using the local conditional probability tables.
The Rotation Forest is an ensemble methodology that generates several training subgroups with high variety by mapping the original training dataset to various new feature spaces; these subgroups are then subjected to Principal Component Analysis (PCA) to further improve their accuracy. Scientists have shown that rotation forest outperforms more traditional ensemble methods like boosting, random forest, and bagging when it comes to classification. This is mostly attributable to the improved accuracy and variety of base classifiers [50].
After the deep literature analysis, it is clear that although BNs have been successfully employed in a wide diversity of fields like healthcare, marketing, education, fraud detection, oil and gas prediction, and risk assessment, there is no ensemble method for acute leukemia gene expression data classification that uses BNs as the base classifier. This paper proposes a framework for acute leukemia gene expression data classification that uses the pairwise correlation gene selection method in conjunction with the Rotation Forest of BNs. The framework includes the following stages:
1) The pairwise correlation gene selection technique is used to rank genes of the acute leukemia training data.
2) The top-ranked genes are chosen and utilized to construct Rotation Forests with BNs as the base classifier.
3) The Rotation Forest of BNs is evaluated using the acute leukemia test dataset, as shown in Fig. 1.
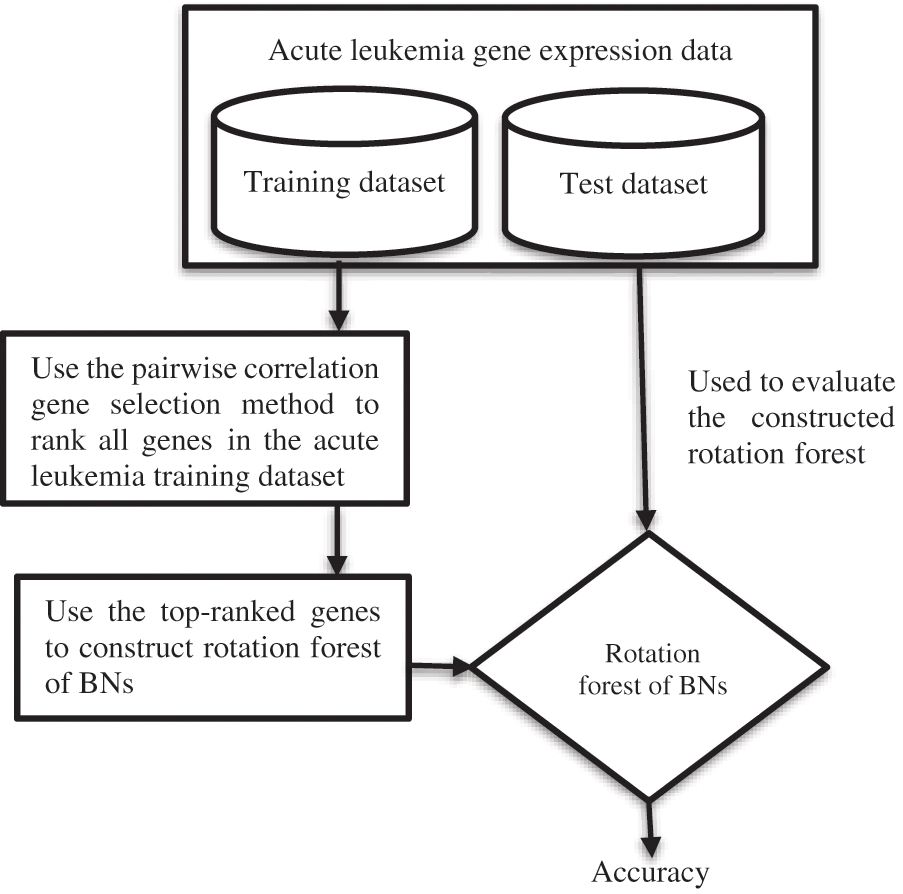
Figure 1: The suggested flowchart
To evaluate the proposed framework, the pairwise correlation gene selection technique is used to rank genes of the acute leukemia training data. Then, the top-ranked genes are designated and used to build the Rotation Forests of BNs, which are evaluated using the acute leukemia test dataset. There is no rule that specifies how many top-ranked genes should be selected by a filter gene selection method. So, the researchers used different numbers of top-ranked genes during their experiments. This paper uses the top 5, 10, 20, 30, 50, 70, and 90 ranked genes to construct Rotation Forests of BNs, as in [62].
This paper uses the accuracy, which is the proportion of test examples that are properly classified, as the performance measure:
where
This paper uses the publicly available acute leukemia benchmark dataset published in [5], which is available at the Kaggle website (https://www.kaggle.com/crawford/gene-expression). This data includes 72 examples that were collected from people with leukemia. 7129 genes were measured for each example. The first 38 examples are utilized for training, and the other 34 examples are utilized to evaluate performance. 11 AML examples and 27 ALL examples compose the training set. 20 ALL examples and 14 AML examples compose the test dataset.
The classification accuracy achieved by the constructed BNs’ Rotation Forests is shown in Table 2.
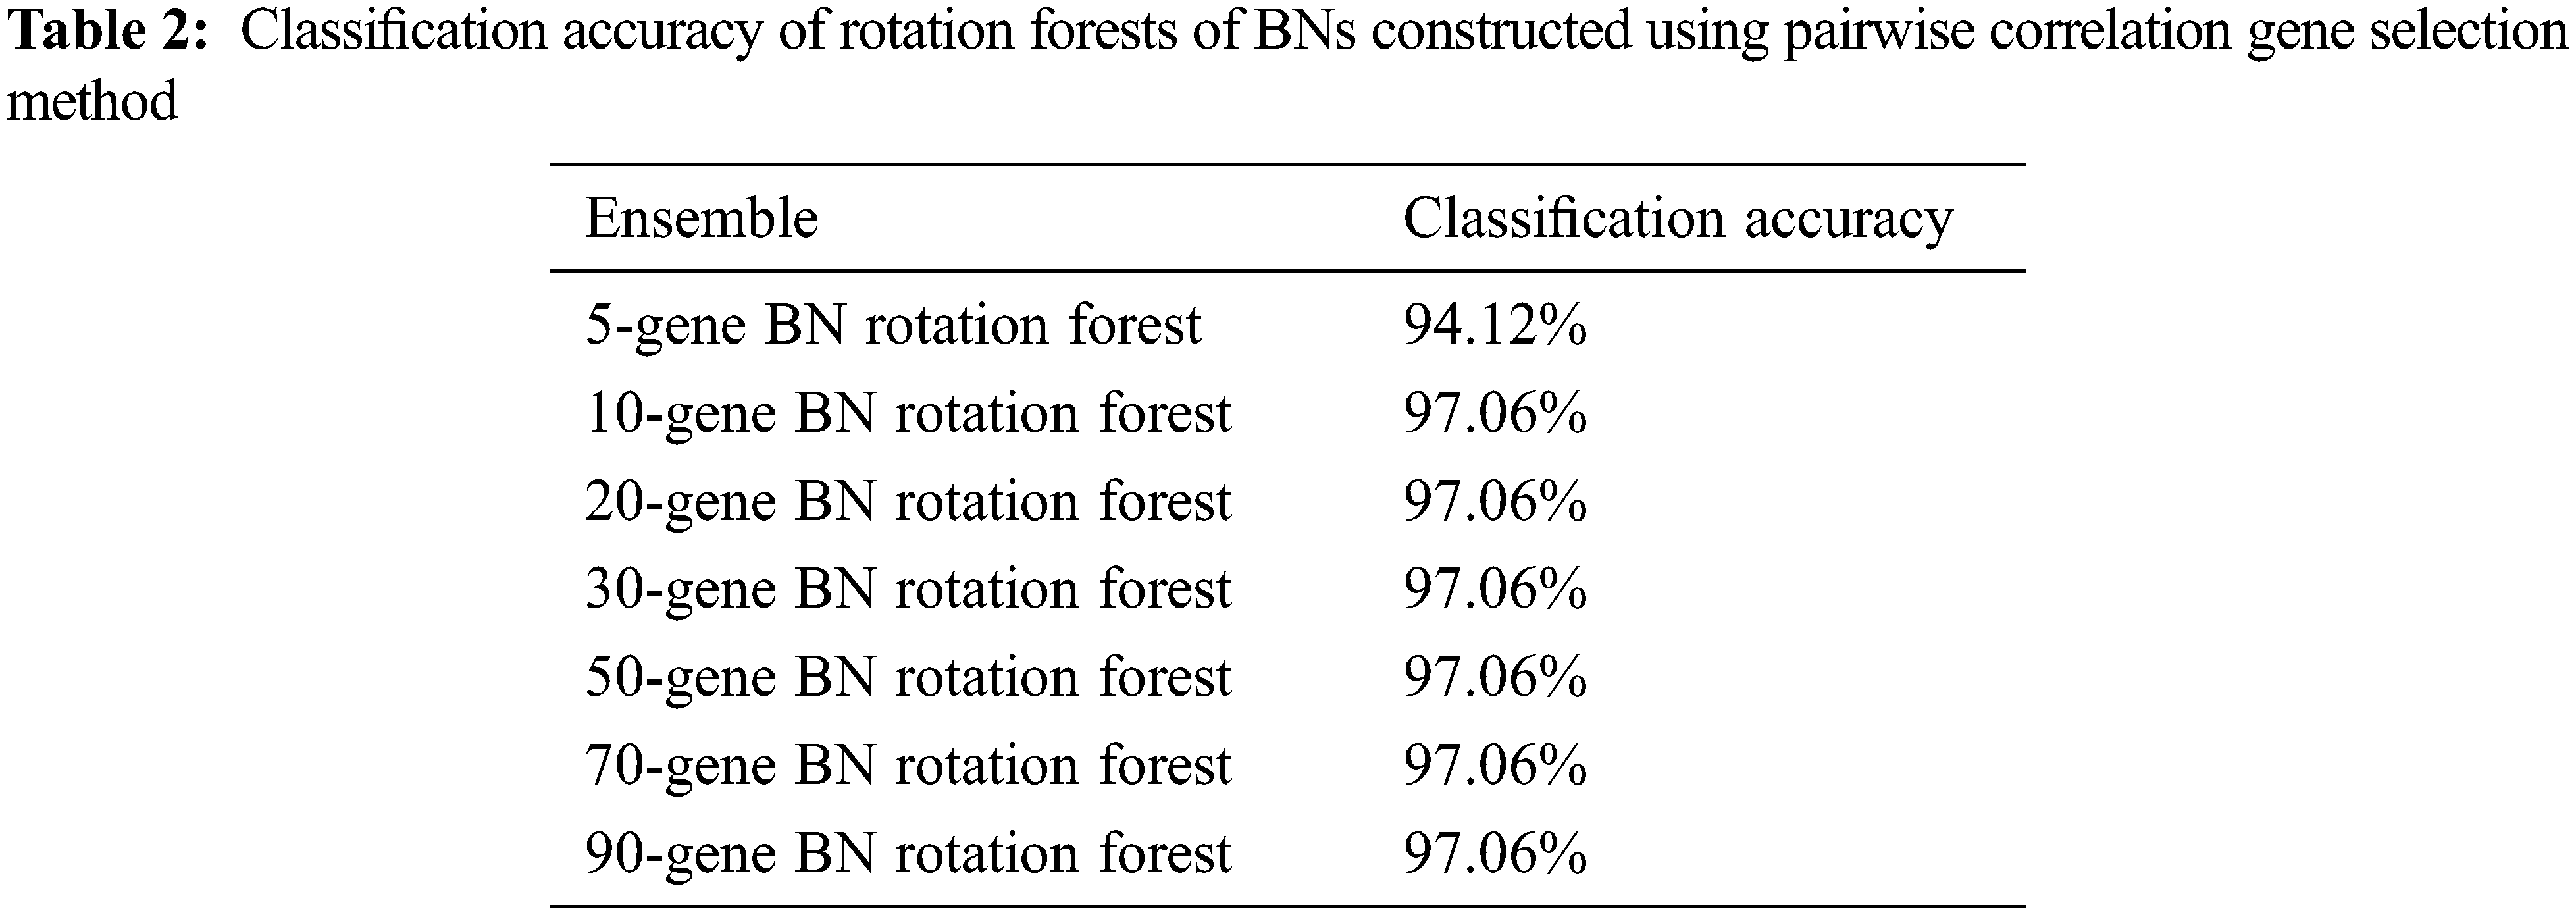
Using the pairwise correlation gene selection method, the 10-gene BNs’ Rotation Forest, the 20-gene BNs’ Rotation Forest, the 30-gene BNs’ Rotation Forest, the 50-gene BNs’ Rotation Forest, the 70-gene BNs’ Rotation Forest, and the 90-gene BNs’ Rotation Forest achieved the highest accuracy (97.06%). Only, the 5-gene BNs’ Rotation Forest achieved lower accuracy (94.12%), as shown in Fig. 2.
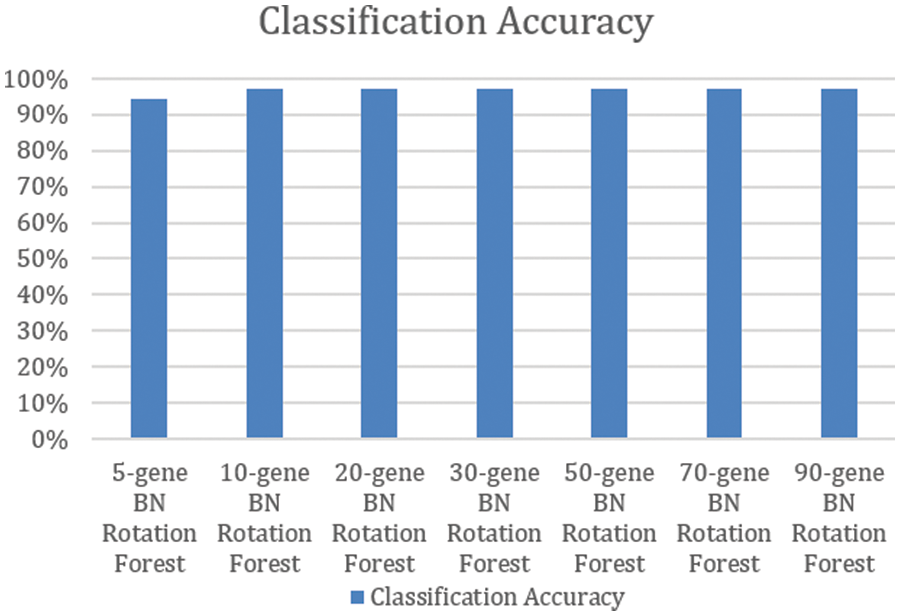
Figure 2: Classification accuracy of rotation forests of BNs constructed using pairwise correlation gene selection method
By comparing the results attained in this work with those of the previously mentioned studies (focusing only on studies that have used the same training/test dataset split approach and that have used the classification accuracy as their performance measure) [50,53,55,57–59], the authors find that the classification accuracies achieved in this study are comparable with those attained in the other studies.
In [62], two models for developing classifiers for acute leukemia utilizing the BNs and the SNR gene selection technique were suggested. The acute leukemia BN classifier in the first methodology was built using the top-ranked genes that were chosen after the acute leukemia training data’s genes were ranked by the SNR approach. In the second methodology, genes from the acute leukemia training dataset were clustered using k-means clustering, and then the top-ranked genes from every cluster were chosen and utilized to build the acute leukemia BN classifier. Seven acute leukemia classifiers have been constructed according to each model methodology using the top 5, 10, 20, 30, 50, 70, and 90 ranked genes. The acute leukemia BN classifiers constructed according to the first model achieved 85.29%, 88.24%, 82.35%, 91.18%, 85.29%, 88.24%, and 94.12% classification accuracy, respectively. The acute leukemia BN classifiers constructed according to the second model achieved 88.24%, 88.24%, 88.24%, 94.12%, 91.18%, 94.12%, and 94.12% classification accuracy, respectively. Since the proposed framework achieves considerably better accuracy than those two models, it is obvious that it is superior to them.
After the deep literature analysis, the authors concluded that studies focusing on classifying the acute leukemia microarray gene expression data using ensembles obtained lower performance compared to studies on conventional classifiers. Moreover, there is no ensemble method for acute leukemia gene expression data classification that uses BNs as the base classifier. This motivated the authors to propose a framework for classifying acute leukemia gene expression data using the pairwise correlation gene selection method combined with the Rotation Forest of BNs. The obtained results prove the efficiency and effectiveness of the suggested framework. Future research could examine meta-ensembles (ensembles of ensembles), multiclass cancer classification problems, or more gene selection categories in conjunction with BNs’ Rotation Forest.
Funding Statement: The authors received no specific funding for this study.
Conflicts of Interest: The authors declare that they have no conflicts of interest to report regarding the present study.
References
1. H. Sung, J. Ferlay, R. L. Siegel, M. Laversanne, I. Soerjomataram et al., “Global cancer statistics 2020: GLOBOCAN estimates of incidence and mortality worldwide for 36 cancers in 185 countries,” CA: A Cancer Journal for Clinicians, vol. 71, no. 3, pp. 209–249, 2021. [Google Scholar] [PubMed]
2. M. Ranjbar, M. Barouni, V. Moazed, H. Fallahzadeh and S. Sheikholeslami, “Survival rate of patients with acute leukemia: A case study in Iran,” Evidence Based Health Policy, Management & Economics, vol. 4, no. 4, pp. 234–241, 2020. [Google Scholar]
3. R. Sheikhpour, R. Fazli and S. Mehrabani, “Gene identification from microarray data for diagnosis of acute myeloid and lymphoblastic leukemia using a sparse gene selection method,” Iranian Journal of Pediatric Hematology and Oncology, vol. 11, no. 2, pp. 70–77, 2021. [Google Scholar]
4. S. H. Kassani, P. H. Kassani, M. J. Wesolowski, K. A. Schneider and R. Deters, “A hybrid deep learning architecture for leukemic B-lymphoblast classification,” in 2019 Int. Conf. on Information and Communication Technology Convergence (ICTC), Jeju Island, South Korea, 2019. [Google Scholar]
5. T. R. Golub, D. K. Slonim., P. Tamayo, C. Huard, M. Gaasenbeek et al., “Molecular classification of cancer: Class discovery and class prediction by gene expression monitoring,” Science, vol. 286, pp. 531–537, 1999. [Google Scholar] [PubMed]
6. N. Abdullah, M. Ibrahim and A. Haider, “Acute leukemia classification based on image processing and machine learning techniques,” International Journal of Innovative Science, Engineering & Technology (IJISET), vol. 6, no. 10, pp. 19–31, 2019. [Google Scholar]
7. S. Dasariraju, M. Huo and S. McCalla, “Detection and classification of immature leukocytes for diagnosis of acute myeloid leukemia using random forest algorithm,” Bioengineering, vol. 7, no. 4, pp. 1–12, 2020. [Google Scholar]
8. N. Almugren and H. Alshamlan, “A survey on hybrid feature selection methods in microarray gene expression data for cancer classification,” IEEE Access, vol. 7, pp. 78533–78548, 2019. [Google Scholar]
9. L. M. De Campos, A. Cano, J. G. Cano and S. Moral, “Bayesian networks classifiers for gene-expression data,” in 2011 11th Int. Conf. on Intelligent Systems Design and Applications, Córdoba, Spain, pp. 1200–1206, 2011. [Google Scholar]
10. A. K. Dwivedi, “Artificial neural network model for effective cancer classification using microarray gene expression data,” Neural Computing and Applications, vol. 29, pp. 1545–1554, 2018. [Google Scholar]
11. H. F. Bhat, “Evaluating SVM algorithms for bioinformatics gene expression analysis,” International Journal of Computer Science Engineering, vol. 6, no. 2, pp. 42–52, 2017. [Google Scholar]
12. M. Ramachandro and R. Bhramaramba, “Classification of gene expression data set using support vectors machine with RBF kernel,” International Journal of Recent Technology and Engineering (IJRTE), vol. 8, no. 2, pp. 2907–2913, 2019. [Google Scholar]
13. S. Agrawal and J. Agrawal, “Neural networks techniques for cancer prediction: A survey,” Procedia Computer Science, vol. 60, pp. 769–774, 2015. [Google Scholar]
14. R. Aziz, C. K. Verma and N. Srivastava, “Artificial neural network classification of high dimensional data with novel optimization approach of dimension reduction,” Annals of Data Science, vol. 5, no. 4, pp. 615–635, 2018. [Google Scholar]
15. M. B. Al Snousy, H. M. El-Deeb, K. Badran and I. A. Al Khlil, “Suite of decision tree-based classification algorithms on cancer gene expression data,” Egyptian Informatics Journal, vol. 12, no. 2, pp. 73–82, 2011. [Google Scholar]
16. S. A. Ludwig, S. Picek and D. Jakobovic, “Classification of cancer data: Analyzing gene expression data using a fuzzy decision tree algorithm,” Operations Research Applications in Health Care Management, vol. 262, pp. 327–347, 2018. [Google Scholar]
17. L. Zakaria, H. M. Ebeid, S. Dahshan and M. F. Tolba, “Analysis of classification methods for gene expression data,” in The Int. Conf. on Advanced Machine Learning Technologies and Applications (AMLTA2019), Cairo, Egypt, pp. 190–199, 2020. [Google Scholar]
18. S. Haddou-Bouazza, K. Auhmani, A. Zeroual and N. Hamdi, “Cancer classification using gene expression profiling: Application of the filter approach with the clustering algorithm,” in Proc. the Ninth Int. Conf. on Soft Computing and Pattern Recognition (SoCPaR 2017Advances in Intelligent Systems and Computing, Marrakech, Morocco, vol. 737, 2018. [Google Scholar]
19. J. Zahoor and K. Zafar, “Classification of microarray gene expression data using an infiltration tactics optimization (ITO) algorithm,” Genes, vol. 11, no. 7, pp. 819–847, 2020. [Google Scholar] [PubMed]
20. P. K. Srimani and M. S. Koti, “Medical diagnosis using ensemble classifiers-a novel machine-learning approach,” Journal of Advanced Computing, vol. 1, pp. 9–27, 2013. [Google Scholar]
21. S. Lahmiri, S. Bekiros, A. Giakoumelou and F. Bezzina, “Performance assessment of ensemble learning systems in financial data classification,” Intelligent Systems in Accounting, Finance & Management, vol. 27, no. 1, pp. 3–9, 2020. [Google Scholar]
22. P. Yang, Y. H. Yang, B. B. Zhou and A. Y. Zomaya, “A review of ensemble methods in bioinformatics: Including stability of feature selection and ensemble feature selection methods,” Current Bioinformatics, vol. 5, no. 4, pp. 296–308, 2010. [Google Scholar]
23. S. Sathurthi, R. Kamalakannan and T. Rameshkumar, “Study of ensemble classifier for prediction in health care data,” Asian Journal of Computer Science and Technology, vol. 8, no. S1, pp. 36–37, 2019. [Google Scholar]
24. C. A. Escobar, D. Macias and R. Morales-Menendez, “Process monitoring for quality-a multiple classifier system for highly unbalanced data,” Heliyon, vol. 7, no. 10, pp. 1–12, 2021. [Google Scholar]
25. Z. Huang, H. Qi, C. Kang, Y. Su and Y. Liu, “An ensemble learning approach for urban land use mapping based on remote sensing imagery and social sensing data,” Remote Sensing, vol. 12, no. 3254, pp. 3254–3271, 2020. [Google Scholar]
26. Z. Wang, V. Palade and Y. Xu, “Neuro-fuzzy ensemble approach for microarray cancer gene expression data analysis,” in 2006 Int. Symp. on Evolving Fuzzy Systems, Lake District, England, pp. 241–246, 2006. [Google Scholar]
27. D. Mishra and B. Sahu, “Feature selection for cancer classification: A signal-to-noise ratio approach,” International Journal of Scientific & Engineering Research, vol. 2, no. 4, pp. 1–7, 2011. [Google Scholar]
28. Z. M. Hira and D. F. Gillies, “A review of feature selection and feature extraction methods applied on microarray data,” Advances in Bioinformatics, vol. 2015, pp. 1–13, 2015. [Google Scholar]
29. C. Ding and H. Peng, “Minimum redundancy feature selection for microarray gene expression data,” Journal of Bioinformatics and Computational Biology, vol. 3, no. 2, pp. 185–205, 2005. [Google Scholar] [PubMed]
30. L. Y. Chuang, C. H. Yang, K. C. Wu and C. H. Yang, “A hybrid feature selection method for DNA microarray data,” Computers in Biology and Medicine, vol. 41, no. 4, pp. 228–237, 2011. [Google Scholar] [PubMed]
31. J. M. Moosa, R. Shakur, M. Kaykobad and M. S. Rahman, “Gene selection for cancer classification with the help of bees,” BMC Medical Genomics, vol. 9, no. 47, pp. 135–164, 2016. [Google Scholar]
32. H. Yu, G. Gu, H. Liu, J. Shen and J. Zhao, “A modified ant colony optimization algorithm for tumor marker gene selection,” Genomics Proteomics Bioinformatics, vol. 7, no. 4, pp. 200–208, 2009. [Google Scholar] [PubMed]
33. P. T. Garikapati, N. K. Penki and S. Gogineni, “Improvised gene selection using particle swarm optimization with decision tree as classifier,” International Journal of New Technology and Research (IJNTR), vol. 3, no. 9, pp. 80–86, 2017. [Google Scholar]
34. S. Li, X. Wu and X. Hu, “Gene selection using genetic algorithm and support vectors machines,” Soft Computing, vol. 12, no. 7, pp. 693–698, 2008. [Google Scholar]
35. K. U. Maheswari and A. Valarmathi, “A novel approach for gene selection based on random forest-variable importance,” International Journal of Applied Engineering Research, vol. 14, no. 15, pp. 105–112, 2019. [Google Scholar]
36. S. Wu, H. Jiang, H. Shen and Z. Yang, “Gene selection in cancer classification using sparse logistic regression with L1/2 regularization,” Applied Sciences, vol. 8, pp. 1569–1580, 2018. [Google Scholar]
37. S. Chretien, C. Guyeux, M. Boyer-Guittaut, R. Delage-Mouroux and F. Descotes, “Using the LASSO for gene selection in bladder cancer data,” in Proc. CIBB, Naples, Italy, 2015. [Google Scholar]
38. A. Bir-Jmel, S. M. Douiri and S. Elbernoussi, “Gene selection via a new hybrid ant colony optimization algorithm for cancer classification in high-dimensional data,” Computational and Mathematical Methods in Medicine,vol. 2019, pp. 1–20, 2019. [Google Scholar]
39. S. Sazzed, “ANOVA-SRC-BPSO: A hybrid filter and swarm optimization-based method for gene selection and cancer classification using gene expression profiles,” in Proc. the 34th Canadian Conf. on Artificial Intelligence, Vancouver, 2021. [Google Scholar]
40. A. Seetharaman and A. C. Sundersingh, “Gene selection and classification using correlation feature selection based binary bat algorithm with greedy crossover,” Concurrency and Computation Practice Experience, vol. 34, pp. 1–16, 2021. [Google Scholar]
41. S. Mohapatra, D. Patra and S. Satpathy, “An ensemble classifier system for early diagnosis of acute lymphoblastic leukemia in blood microscopic images,” Neural Computing and Applications, vol. 24, no. 7–8, pp. 1887–1904, 2014. [Google Scholar]
42. C. W. Wang, “New ensemble machine learning method for classification and prediction on gene expression data,” in IEEE EMBS Annual Int. Conf., Institute of Electrical and Electronics Engineers, Pisa, Italy, pp. 3478–3481, 2006. [Google Scholar]
43. S. Nagi and D. K. Bhattacharyya, “Classification of microarray cancer data using ensemble approach,” Network Modeling Analysis in Health Informatics and Bioinformatics, vol. 2, no. 3, pp. 159–173, 2013. [Google Scholar]
44. S. Begum, D. Chakraborty and R. Sarkar, “Cancer classification from gene expression based microarray data using SVM ensemble,” in 2015 Int. Conf. on Condition Assessment Techniques in Electrical Systems (CATCON), Bangalore, India, pp. 13–16, 2015. [Google Scholar]
45. A. Bhola and A. K. Tiwari, “Machine learning based approaches for cancer classification using gene expression data,” Machine Learning and Applications: An International Journal (MLAIJ), vol. 2, no. 3/4, pp. 1–12, 2015. [Google Scholar]
46. S. Mishra and D. Mishra, “Adaptive multi-classifier fusion approach for gene expression dataset based on probabilistic theory,” Journal of the Korean Statistical Society, vol. 44, no. 2, pp. 247–260, 2015. [Google Scholar]
47. C. L. Edirimanna, T. M. K. K. Jinasena and E. A. T. A. Edirisuriya, “Microarray based multi filter fusion gene selection and ensemble classification of leukemia sub types,” in 9th Int. Research Conf., Sri Lanka, pp. 31–36, 2016. [Google Scholar]
48. N. Song, K. Wang, M. Xu, X. Xie, G. Chen et al., “Design and analysis of ensemble classifier for gene expression data of cancer,” Advancements in Genetic Engineering, vol. 5, no. 1, pp. 1–7, 2016. [Google Scholar]
49. L. Yang, Z. Liu, X. Yuan, J. Wei and J. Zhang, “Random subspace aggregation for cancer prediction with gene expression profiles,” BioMed Research International, vol. 2016, pp. 1–10, 2016. [Google Scholar]
50. T. Chen, “An improved rotation forest algorithm based on heterogeneous classifiers ensemble for classifying gene expression profile,” Advances in Modeling and Analysis B, vol. 60, no. 1, pp. 1–24, 2017. [Google Scholar]
51. M. Pan and J. Zhang, “Correlation-based linear discriminant classification for gene expression data,” Genetics and Molecular Research, vol. 16, no. 1, pp. 1–9, 2017. [Google Scholar]
52. S. Tarek, R. Abd-Elwahab and M. Shoman, “Gene expression based cancer classification,” Egyptian Informatics Journal, vol. 18, no. 3, pp. 151–159, 2017. [Google Scholar]
53. P. H. Huynh, V. H. Nguyen and T. N. Do, “Random ensemble oblique decision stumps for classifying gene expression data,” in Proc. the 9th Int. Symp. on Information and Communication Technology (SOICT), Danang City, Viet Nam, pp. 137–144, 2018. [Google Scholar]
54. A. Espichan and E. Villanueva, “A novel ensemble method for high-dimensional genomic data classification,” in 2018 IEEE Int. Conf. on Bioinformatics and Biomedicine (BIBM), Madrid, pp. 2229–2236, 2018. [Google Scholar]
55. N. Alrefai, “Ensemble machine learning for leukemia cancer diagnosis based on microarray datasets,” International Journal of Applied Engineering Research, vol. 14, no. 21, pp. 4077–4084, 2019. [Google Scholar]
56. K. Güçkiran, I. Cantürk and L. Özyilmaz, “DNA microarray gene expression data classification using SVM, MLP, and RF with feature selection methods relief and LASSO,” Süleyman Demirel Üniversitesi Süleyman Demirel University Fen Bilimleri Enstitüsü Dergisi, vol. 23, no. 1, pp. 126–132, 2019. [Google Scholar]
57. V. P. Singh, D. J. Kalita and S. Tripathi, “Classifying gene expression data of cancer using multistage ensemble of neural networks,” in Proc. 2nd Int. Conf. on Advanced Computing and Software Engineering (ICACSE-2019), Sultanpur, India, 2019. [Google Scholar]
58. N. Koul and S. S. Manvi, “Framework for classification of cancer gene expression data using Bayesian hyper-parameter optimization,” Medical & Biological Engineering & Computing, vol. 59, pp. 2353–2371, 2021. [Google Scholar]
59. J. Silva, J. Costa, E. Coast, M. Holanda, L. Soares et al., “Leukemia diagnosis with machine learning ensemble from gene expression data,” International Journal of Development Research (IJDR), vol. 11, no. 9, pp. 50641–50646, 2021. [Google Scholar]
60. E. Simsek, H. Badem and I. T. Okumus, “Leukemia sub-type classification by using machine learning techniques on gene expression,” in Proc. the Sixth Int. Congress on Information and Communication Technology, Lecture Notes in Networks and Systems, London, vol. 217, pp. 629–637, 2022. [Google Scholar]
61. F. Jiménez, G. Sánchez, J. Palma, L. Millares and J. Botía, “Multivariate feature ranking of gene expression data,” arXiv, 2021. https://arxiv.org/abs/2111.02357 [Google Scholar]
62. A. H. Zaied, M. G. Hebishy and M. A. Saleh, “Acute leukemia classification using Bayesian networks,” Journal of Emerging Trends in Computing and Information Sciences, vol. 3, no. 10, pp. 1419–1426, 2012. [Google Scholar]
Cite This Article
 Copyright © 2023 The Author(s). Published by Tech Science Press.
This work is licensed under a Creative Commons Attribution 4.0 International License , which permits unrestricted use, distribution, and reproduction in any medium, provided the original work is properly cited.
 Downloads
 Citation Tools