
 Submit a Paper
 Propose a Special lssue
 Open Access
ARTICLE
Towards Intelligent Detection and Classification of Rice Plant Diseases Based on Leaf Image Dataset
1 Department of IT, The University of Haripur, Haripur, 22620, Pakistan
2 Department of Computer Science, University of Engineering and Technology, Taxila, 47080, Pakistan
3 Department of Computer Science, GANK(S) DC KTS Haripur, Haripur, 22620, Pakistan
4 College of Pharmacy, Gachon University Medical Campus, No. 191, Hambakmoero, Yeonsu-gu, Incheon, 21936, Korea
5 Software Engineering Department, College of Computer Science and Engineering, University of Jeddah, Jeddah, 23218, Saudi Arabia
6 College of Computer Sciences and Engineering, Department of Computer Science and Artificial Intelligence, University of Jeddah, Jeddah, Saudi Arabia
7 Department of Computer Engineering, Jeju National University, Jejusi, 63243, Korea
* Corresponding Author: Harun Jamil. Email:
Computer Systems Science and Engineering 2023, 47(2), 1385-1413. https://doi.org/10.32604/csse.2023.036144
Received 18 September 2022; Accepted 09 February 2023; Issue published 28 July 2023
 View Full Text
 Download PDF
Abstract
The detection of rice leaf disease is significant because, as an agricultural and rice exporter country, Pakistan needs to advance in production and lower the risk of diseases. In this rapid globalization era, information technology has increased. A sensing system is mandatory to detect rice diseases using Artificial Intelligence (AI). It is being adopted in all medical and plant sciences fields to access and measure the accuracy of results and detection while lowering the risk of diseases. Deep Neural Network (DNN) is a novel technique that will help detect disease present on a rice leave because DNN is also considered a state-of-the-art solution in image detection using sensing nodes. Further in this paper, the adoption of the mixed-method approach Deep Convolutional Neural Network (Deep CNN) has assisted the research in increasing the effectiveness of the proposed method. Deep CNN is used for image recognition and is a class of deep-learning neural networks. CNN is popular and mostly used in the field of image recognition. A dataset of images with three main leaf diseases is selected for training and testing the proposed model. After the image acquisition and preprocessing process, the Deep CNN model was trained to detect and classify three rice diseases (Brown spot, bacterial blight, and blast disease). The proposed model achieved 98.3% accuracy in comparison with similar state-of-the-art techniques.Keywords
Agriculture is the backbone of the economy of Pakistan. The growth of population is increasing rapidly. As a result, more food required. Most people of Pakistan like to eat Rice. Pakistan is a major country in rice production. It is also in the fourth position among all the large rice crop-producer countries worldwide [1]. Pakistan stands at number five in rice-exporting countries [2]. However, most farmers have less knowledge of caring for plants from various diseases such as leaf blasts, brown spots, bacterial blight, etc. Most farmers use an expert’s naked eye observation method to observe plant health conditions. But manual observation is less accurate, time-consuming, and costly when dealing with large farms [3]. The diseases mentioned above may affect rice plant growth at any production stage [4]. Early disease detection is essential at the early production stages to prevent severe damage. Accurate detection and classification of diseases in rice plants required time, knowledge, and continuous monitoring of plants [5]. However, an automatic system is required to classify and identify various diseases early and within less time. To address these issues, we proposed a DNN model that can detect whether the plant is healthy by using image processing technologies. Symptoms of any disease are on leaves, stems, or fruits [6]. The observation of leaves detects rice plant diseases by observing these symptoms with the help of DNN Classification. In the case of unhealthy leaves, the algorithm detects the rice plant’s disease. Our proposed model focuses on rice diseases: leaf blast, brown spot, and bacterial blight.
In Pakistan, the people living in rural areas depend on farming. Rice is one of the vital crops, and the disease destroys almost 10% to 15% of rice production in Asia and 25% in Pakistan [7]. Most farmers have less knowledge about disease symptoms and cannot identify the diseases, leading to the loss of crop production. The farmers mostly use the naked eye observation method (also called the manual detection process), meaning they use their experience to diagnose and classify the disease symptoms [8]. However, manually detecting and classifying is very time-consuming and imprecise. Processing infected images of plants using computer vision and image processing techniques to diagnose and classify the disease symptoms is the modern, technological and safest solution for farmers. Suppose the farmers deploy such automated systems with their farms. In that case, these systems will periodically capture and process images to identify the plant’s disease portions and inform farmers. This study uses rice plants’ image processing and computer vision-based deep CNN-based techniques.
Due to disease infections, crop quality and quantity are affected and production drops. The main reason for this section is to understand the readers about rice plant diseases. The growth of rice plants may be affected by several diseases. However, the detection of these diseases is significant for farmers. The following section explains the three diseases, brown spot, bacterial blight, and leaf blast.
Fig. 1 shows the brown spot disease of the rice plant. At the initial stage of this disease, small spots, circular or oval-shaped and light-colored spots, appears on leaves, and later size of these tiny spots increases to form a linear spot. The fungus Cochliobolus miyabeanus creates a spot-on brown leaf and finish the entire leaf [8]. This disease has small, pale green spots or streaks. After some time, these spots expand and destroy the leaf. The spot will extend and be large like a linear streak. The disease of bacterial blight commonly cause by Xanthomonas spp. Bacterial blight diseases show in the following Fig. 2. Blast diseases caused by the fungus magnaporthe Oryza. Diamond-shaped, boat-shaped, or eye-shaped white or grey lesions with brown and reddish borders. The lesions will enlarge, merge and kill the entire leaves. Fig. 3 shows the leaf blast disease.
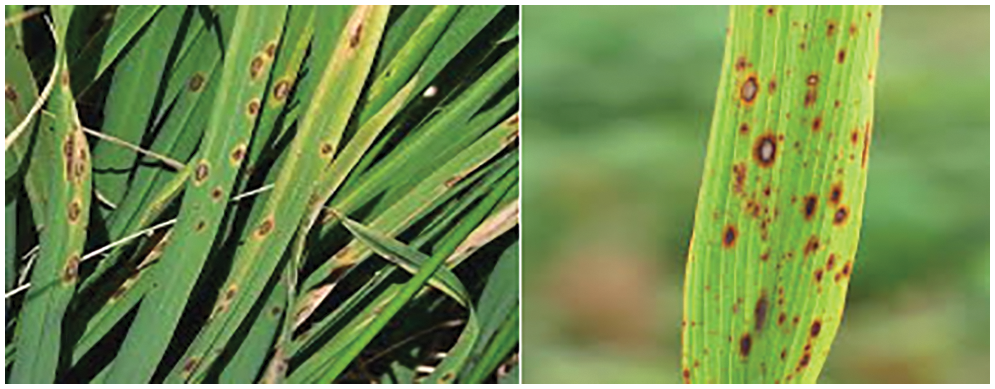
Figure 1: Brown spot leaf [9]

Figure 2: Bacterial blight [9]

Figure 3: Blast disease [9]
1.2 Convolution Neural Network (CNN) Structure
In deep learning, the Convolutional Neural Network (CNN) does learn and extracts the features at different levels due to its layers. CNN mostly used in the image recognition field. It consists of convolution, pooling, and fully connected layers. These layers help to achieve accurate output and accuracy. CNN accepts labeled datasets for training. In agriculture, the labeled dataset is hard to generate and challenge. CNN structure consists of neurons. The neurons contain biases and learnable weights. First, neurons receive input; second, they calculate and sum with weights; and third, they send it to the activation function. The CNN network has a loss function. The loss function will be reduced gradually with each iteration of the network [10]. In the neural network, the input is mostly in vector form, and CNN receives a multi-channel image (colored image) as input. After inputting the image into the CNN network, a convolution operation is performed. The filter size is less than the image size (mostly 5 × 5 or 3 × 3). Slide filter over the complete input image. The core concept of the CNN model shown in Fig. 4.

Figure 4: The architecture of convolutional neural network (CNN) [11]
Plant growth may be affected by these diseases at any stage. For healthy plants, farmers should detect any disease early or before serious damage. To achieve high output, timely detection and classification of diseases are essential for farmers. For accurate detection and classification, a large amount of time, knowledge, and continuous monitoring of plants is required. However, an automatic system is required to detect and classify various diseases at an early stage and within less time. So, a new system needs to detect whether the plant is healthy by using image processing technologies. Symptoms of any disease can be on leaves, stems, or fruits. So, we can detect any disease by observing these symptoms with the help of image processing technologies. In the case of unhealthy leaves, the system also detects plant disease. The main motivation of this research is, “How can we improve the accuracy of the model and an efficient and reliable diagnosis of rice plant diseases and reduce the number of deaths of rice plants.”
Our work builds a model for rice plant disease prediction. An image of the affected rice plant leaf sends to the proposed CNN model. The model analyses the image and shows whether the rice plant is healthy or defective. The recommendations made for plant disease detection. The research presents and recognizes the demand for developing and building a good, cost-effective proposed system. The proposed method enhances the agriculture facilities after developing proper disease identification. The project will develop a reliable system that detects three rice diseases in rice plants using deep learning algorithms. We built this model for farmers unable to travel long distances in crops to detect diseases in rice plants and their cures. Hence, by using this model, farmers, scientists, and botanists can detect rice diseases in rice plants. Model prediction results enable the farmers to use the proper spray to save rice plants from disease and produce rice. The main contributions of the proposed approach are illustrated in the below points.
• Multiple CNN architectures, such as MobileNetV2, InceptionV3, EfficientNetB0and InceptionResNetV2, diagnose rice plant disease detection based on healthy and unhealthy rice plant-leaf images.
• The standard or existing convolution replaced with depth-wise convolution, which reduces parameters to achieve the same accuracy level.
• The proposed Inception model uses a smaller number of parameters faster than In-ceptionResNetV2 and InceptionV3.
• In our proposed system, the overfitting is ignored by applying MobileNetV2 and Ef-ficientNetB0 models. The dropout values are used to convenience the system by protecting against the overfitting values.
• We apply the multiple features from the image’s overall CNN layers to effectively utilize the model with different techniques, simplifying the process.
• Extensive training and testing is performed to adjust the parameters for optimal results. Multiple learning rates are selected to perform the learning. The model is trained on different epochs.
• The untrained CNN model is selected to train over three major diseases of rice plants. Colors and Grayscale images are chosen to train and test the models.
• The results are compared with existing state-of-the-art machine-learning CNN models. The results show that the implemented model performs better than the existing models.
The rest of the process is arranged as follows: Section 2 presents a brief literature review of the recent techniques and supports the activities related to rice plant disease detection and classification with their short-comes and benefits. Section 3 presents the methodology, data collection process, and solutions for end-to-end novel plant disease classification. Section 4 presents the implementation of the developed framework based on the CNN techniques and we conclude this research in the conclusion section.
Identifying plant leaf symptoms and finding out the type of pest or disease and disease percentage and symptoms play a prominent role in successfully cultivating the crops. Currently, just a few city agriculture centers detect plant diseases manually. The farmers from the villages travel a long distance to detect diseases in the crops. Still, our system is an automatic system that can diagnose the diseases in rice plants by taking pictures of infected rice plants images as input and providing a report consisting of symptoms and recommendations for the cure of that disease.
Singh et al. [12] used approaches based on image processing for plant disease identification. Using MATLAB, different classification and segmentation techniques were used to predict the diseases of Sapota, lemon, banana, mango, beans, jackfruit, potato, and tomato. Segmentation was done using a genetic algorithm. To improve the recognition rate in the classification process Artificial Neural Networks, Bayes classifiers, Fuzzy Logic, and hybrid algorithms can also be used.
In [6], Khirade et al. discussed various feature extraction methods, segmentation, and classification for recognizing plant diseases through image processing. Segmentation algorithms include boundary and spot detection, k-mean clustering, and Otsu threshold. The feature extraction algorithm consists of the color co-occurrence method and leaf color extraction using H and B components. Likewise, classification algorithms include ANN, BPNN, modified SOM and Multiclass SVM. Using these methods, we can accurately identify and classify various plant diseases using these image processing techniques. Swathi et al. [13] conducted Vision-based Plant Leaf Disease Detection on The Color Segmentation through Firebird V Robot. Herein, the author used Firebird V Robot (At mega 2560) with a high-quality camera to capture the images of different plants. Further, neural networks with image processing techniques were configured to detect the affected part of the leaf with a high level of accuracy. There is another scope for developing an innovative, efficient, and fast interpreting system for recognizing plant diseases [14,15].
The author detected crop disease in [16] using image processing Techniques through a Systematic Review. They described different image preprocessing approaches, the technique of image segmentation, feature extraction approaches, and image classification techniques. Image preprocessing techniques include Noise filtering and contrast enhancement. Likewise, image segmentation techniques are K-means, region growing, thresholding, foreground-background, fuzzy c-mean, canny edge detection, morphological operators, color segmentation, and HM. Further, SVM, ANN, BPNN, KNN and RBF are classification techniques that the authors discussed. Additionally, researchers can use these methods in their work and get a high level of accuracy.
Khan et al. [17] described several classification and segmentation techniques for recognizing plant diseases. According to the authors, three main segmentation techniques are region-based segmentation, partition clustering, and edge detection. Region growing and region splitting and merging are types of region-based segmentation. Likewise, the authors also described neural network-based classification methods, including backpropagation analysis, PCA, and singular value decomposition. Baranwal et al. [18] reviewed different techniques of Machine Learning for diagnosing Plant Diseases. Scholars described and compared different basic classification techniques for detecting plant disease symptoms. The results showed that CNN gives good results in image classification problems. Nawaz, khan et al., 2020 studied Plant Disease Detection Using IoT. In this work, the author used IoT devices to identify the current condition of plants. The device DHT11 was used for humidity and temperature, and TCS32 was used to get color from the leaf. The extracted information was then sent to cloud storage and there was a mechanism for recognizing leaf was infected or normal.
Rath et al. described in [19] that the diseases of plants affect crops’ production and the country’s economy. So, the authors present that early and correct detection is needed to overcome this problem. They used image processing techniques to detect and classify two rice plant diseases (brown spot and rice blast). They implemented an image processing method that used a classifier RBFNN. RBFNN has an easy design, online learning ability, and good generalization [20]. Poornappriya et al. [21] present that RBF is very good and reliable compared to other neural network models in disease prediction problems. The author maintained their database by taking rice blast disease, rice spot disease, and healthy leaf images. Each class has almost 100 images for training and testing purposes [22].
In [23], authors proposed an approach for rice plant disease identification using FCM-KM and Faster R-CNN fusion algorithms. The authors described different problems related to disease detection for rice plants. The author used different filters and algorithms to minimize these problems. They used a two-dimensional mask with a weighted multi-level median filter to overcome the problem of noise from the image data. Authors overcome the complex background interference using the Otso threshold segmentation algorithm. For the classification problem, the R-CNN algorithm was applied to classify the diseases of rice plants. The authors mentioned that their work is more capable and faster in detecting such diseases. The author presents this method with the Internet of Things (IoT) and Mobile Devices for real-time detection of plant diseases.
Liang et al. in [24] used a deep CNN model to recognize rice blast disease. Authors use the dataset of infected and uninfected rice blast images in their work. They gathered 2906 samples of infected rice leaf images (rice blast disease infected images) and 2902 images of healthy rice plant images from the China Institute (Jiangsu Academy of Agricultural Sciences) of Plant Protection. The author showed that the CNN approach performs better and can be applied in practical applications. CNN extracts a feature of blast disease and then classifies the disease symptoms. The main contribution of this research is the establishment of the rice blast disease dataset. The author combines that dataset with other available datasets to make a large dataset. However, other authors use this dataset for their rice plant disease detection research. Moreover, the author describes that CNN with SoftMax and CNN with SVM are equal in performance [25–28].
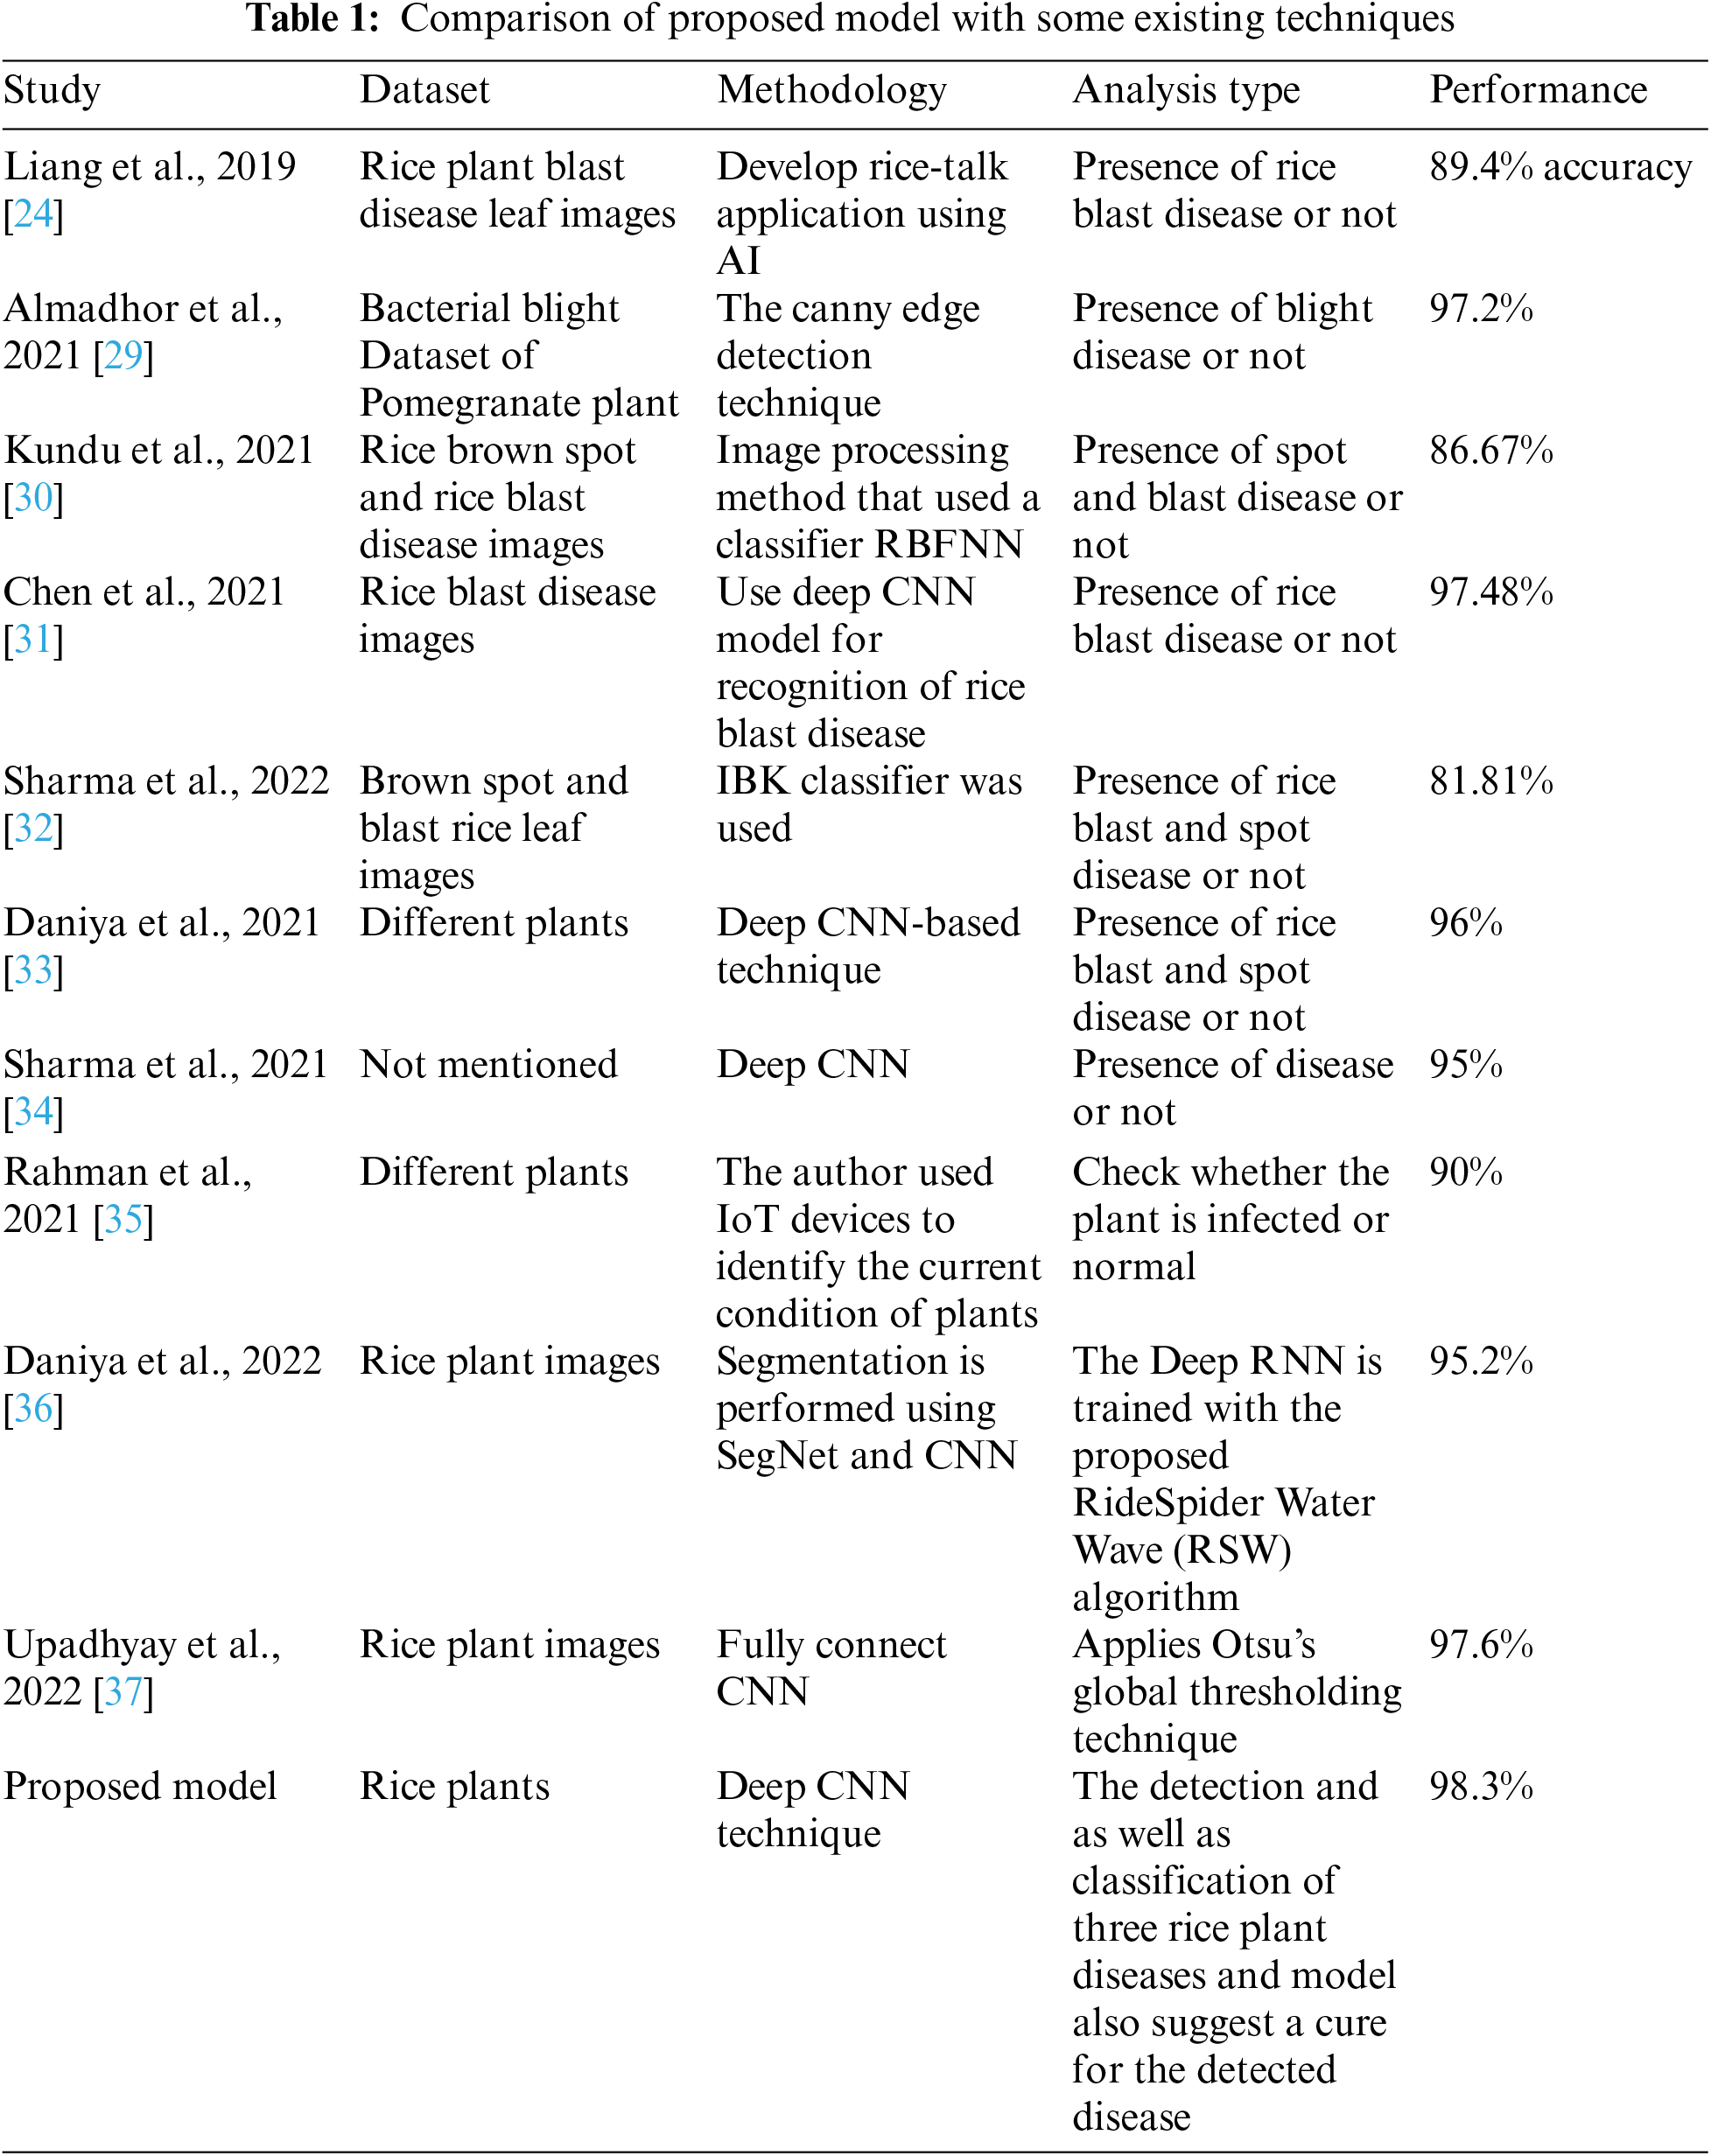
According to Table 1, plant disease detection techniques are proposed in the state-of-the-art literature. These techniques effectively detect and classify rice plant diseases on multiple different datasets. The features selected from such techniques are the authors, dataset used, methodology, and analysis and performance. According to the research from the literature presented in Table 1, detection accuracy from the proposed technique is 98.3% which is higher than every technique presented in the literature. The proposed approach performs well under rice plant data using the Deep CNN Technique for detecting and classifying three rice plant diseases.
The proposed model forms a CNN model for rice plant diseases. We adopted an untrained CNN model to detect and classify the rice plant diseases from the images dataset. The main features of the dataset are leaf blast, false smut, neck blast, sheath blight, bacterial stripe disease, and brown spot. Three diseases are targeted to detect using the proposed CNN model for detection. Based on the dataset’s features, the untrained model is best suitable because these are the different features unless the trained model is helpful. An image of the affected rice plant leaf is captured and input into the model for processing. The model analyses the image shows whether the plant is healthy or defective and recommends the required pesticide. The project presents and recognizes the demand for developing a rapid, cost-effective, and reliable system that facilitates advancement in agriculture. The project will develop a CNN-based system that detects rice plant diseases using deep learning algorithms. We built this model for farmers who do not want to travel long distances to detect diseases in plants and their cures. Hence, farmers, scientists, and botanists can use this model to detect three rice diseases in rice plants and get treatment like overcoming these diseases in less time. Fig. 5 shows the proposed CNN model with training and testing for rice disease detection.

Figure 5: Proposed model with training and testing for rice disease detection
Machine Learning is dependent on datasets. The significant features allow machine learning to operate effectively. The image samples used in this work were gathered from online repositories, including Kaggle and UCI. Some images were downloaded from the IEEE dataset repository by the name of disease and plant. Images in the dataset were grouped into three classes, i.e, brown spot, leaf blast, and bacterial blight. Dataset was also increased with the help of the data augmentation technique. We use 1030 rice spot disease images, 1130 samples of rice blast disease images, and 1536 samples of rice blight disease images. The size of the dataset affects the accuracy of the ML model. In the preprocessing operation, the characteristic of each leaf is detected and stored in the system for detection. The main features are leaf blast, false smut, neck blast, sheath blight, bacterial stripe disease, and brown spots. Suitable Deep CNN machine learning detection models are used to detect diseases.
In the literature, authors apply multiple image-processing techniques to detect plant diseases. In our proposed work, we use the CNN model for rice plant images to detect the three main diseases of rice. The overall procedure of our model for rice plant disease identification and recognition using the CNN technique is described in detail in Section 3.3. The complete process is mainly divided into two phases: training the CNN model to detect three main rice plant diseases and the second phase is the disease prediction phase. Fig. 6 shows a great idea about rice disease detection using the CNN technique. The proposed methodology consists of two phases, i.e., training and disease prediction, as shown in Fig. 6. In the training phase, CNN model training is performed using a predefined rice plant leaf image dataset. Fig. 7 shows the training phase of the CNN model. These images include brown spot disease images, bacterial leaf blight images, and leaf blast disease images.

Figure 6: Training phase

Figure 7: Image processing of input data
3.3.1 Collect Rice Leaf Images Dataset
Gathering rice leaf images is the initial process of our proposed system for implementing the proposed workflow. All the images for the dataset are taken from various online repositories. All the images in the dataset were separated into three classes, i.e., bacterial blight, leaf blast, and brown spot. Initially, the images are colored images. The main image colors are Blue, Green, and Red, known as RGB images and can be converted into any domain.
Once gathering images, the quality of the image is tested. Suppose the input image quality satisfies the requirements, then preprocessing is performed for noise reduction, and model quality is tested for the input matrix. If the image’s quality is not good enough to satisfy the model’s requirements, the model discards that image and shows the message. BRISQUE Method is adopted in CNN to check input image quality through the ‘Image-quality’ library. The BRISQUE method shows the score of the input image. CNN libraries detect the input image quality using a score assigned by the BRISQUE method. BRISQUE method use image pixels to compute features. The technique is exceptionally efficient for checking rice plant image quality using transformation to calculate features.
The image preprocessing process is performed to convert the images to good quality. The preprocessing method in CNN is used to clean the image from noises and objects. Non-balanced images are resized. In preprocessing, the median filter gives the best results in image improvements [4]. Image preprocessing includes image clipping, image smoothing, and image enhancement.
Image clipping means cropping the target image region. An image smoothing filter is used to increase the image quality. The Image enhancement technique is used to maximize the contrast of the image. We convert the RGB image into a grey scale by using color conversion using Eq. (1) to reduce the complexity.
Eq. (1) computes grayscale values from R for red, G for green, and B for blue. The quantity with R, and G and B values is determined based on color intensity. Preprocessing techniques are convenient for improving image quality. Before further processing the images, the image quality is improved to work with the CNN model in the proposed model for efficient disease predictions. It consists of many processes, including enhancement, resizing images, color space transformation, and filtering images [12].
There are two standard methods of image preprocessing. First is Noise filtering. Noise is steadily present in digital pictures during picture securing, coding, transmission, and processing. Before performing the first operation on an image, the filtering technique applies. Noise filtering removes any noise or distortion found in the image during the filtration process of the CNN model. Multiple noise filtering algorithms are used to remove noise from images in CNN. The second is Contrast enhancement. The contrast enhancement technology improves the contrast in the images. It is also called contrast stretching. The contrast stretching technique is used in many fields where the input data is the image. Contrast enhancement techniques apply to the image to enhance presence and good image quality in the proposed CNN model of the image improvement libraries. The refined image is well-sighted by humans and provides image perception and enhancement. Contrast is a significant factor in any subjective evaluation of image quality.
The CNN model is trained to predict the rice disease classes when image acquisition and preprocessing. CNN is popular and mostly used in the field of image recognition. It consists of connected layers. The CNN method used a labeled dataset for training, and image labeling is challenging in agriculture. CNN is used for image recognition and is a class of deep-learning neural networks. So, it is made up of neurons, and these neurons have biases and learnable weights. Neurons receive input, then neurons calculate and sum with weights and send it to the activation function. The CNN network has a loss function, which was reduced gradually with each iteration of the network. The CNN model was trained by using images of infected and uninfected leaves of rice plants. The model is trained on labeled data, including Rice brown spot disease images, bacterial leaf blight disease images, rice blast disease images, and healthy images. In the dataset of infected and noninfected images, 70% are used for training and 30% for testing. Some of the images are used only for testing purposes. The feature extraction and selection process are essential in plant disease detection and identification. It is the process of extracting the features for recognition and classification. There are many features in the leaf images and these features help identify the specific disease. Feature extraction relates to texture and color and morphology. Using the feature extraction method, the disease can be detected with high accuracy if there is any change in the image’s color, which means that the leaf infected with a specific disease. The proposed CNN model in Fig. 8 extracts the most valuable features from each disease class during the training phase and then uses those features in the prediction and classification phase to predict the disease class of the test image.

Figure 8: Rice plant disease detection and classification
In the next section, we proposed our Training Algorithm. The training algorithm selects input images and classification variables as a dataset and outputs as a Trained Model to predict the rice plant diseases. According to Algorithm 1, image preprocessing performed in step 2. Image preprocessing includes resizing the input image, convert to binary format, applying filters to enhance the image’s quality, and finally, the image converted into HSV. The important features of the input image extracted in steps 3 and 4. These extracted features are beneficial for predicting the rice disease class. Classification of rice diseases performed in step 6 of Algorithm 1. Finally, step 7 and step 8 showed the completion of the process of the training phase.

After the Image quality enhancement phase in the proposed methodology, the next CNN-based disease prediction phase shown in Fig. 9. The Disease Prediction phase in the CNN model diagnoses the three rice plant leaf diseases that devastate rice production. The input images are processed and then classified by using trained CNN. The steps in the disease prediction phase of rice plant disease discussed in the sections below.

Figure 9: Disease prediction phase
Image acquisition is the first and main step in the proposed CNN model to predict rice plant diseases. The model takes the input image and performs different operations to achieve the goal, i.e., disease prediction.
Image Preprocessing converts the image to enhance the quality. The process of image preprocessing performed on the target image. Preprocessing involves cleaning the image from noises and objects. It resizes the input images as required. The median filter gives the best results in image improvements [4].
Image preprocessing includes image clipping, image smoothing, and image enhancement. Image clipping means cropping the target image region. An image smoothing filter is used to increase the quality. The Image enhancement technique is used to maximize the contrast of the image. To reduce the complexity, we convert the RGB image into a grey scale using the color conversion Eq. (2). Eq. (1) computes grayscale values from R for red, G for green, and B for blue. The quantity with R, Gand B values are determined based on color intensity.
3.4.3 Image Segmentation and Feature Extraction
In this phase, images classified into different groups or clusters. The infected regions of the leaf image are identified using image segmentation and feature extraction. The infected area of the leaf is different from its original color. So, here we use color base segmentation in our proposed model. Moreover, the extra part is segmenting out from the image segmentation process. The area of interest is segmented and separated from the image for disease detection. The segmentation process quickly separates the disease-affected portion from the image [9]. Here for segmenting, the image is converted into HSV color space. HSV segmentation helps in finding the infected portion of the plant. As discussed, the infection part is different from its original color. So, our CNN algorithm works to find the portion of the leaf that changed due to any disease.
3.4.4 Detection and Classification
Disease classification is the proposed model’s primary phase in the plant disease recognition system. The classification process categorizes the leaf image based on the disease identified [10]. Plant disease recognition and identification involve the prediction of disease. After identifying the diseased part, the classification of the disease performed. After afterimage preprocessing, the model predicts if the leaf is healthy or infected. If the leaf is healthy, the model predicts the prediction accuracy and notifies a clear image with no disease. In the case of an infected leaf, the model was declared and labeled as an infected leaf on that image.
After the identification phase, the model suggests a specific cure. The cure suggested using expert knowledge from the agriculture domain. The test images send to the test part of the CNN algorithm. The CNN matches the vision with the trained datasets. The response noted against disease detection. The model will respond to the Diagnose and prescription module. Fig. 10 shows the infected area of the leaf along with the disease name and suggested cure. Algorithm 2 represents the disease prediction steps of the proposed model. The input is testing images with prediction variables to predict the disease spots. The output of the algorithm is disease-predicted results. The model size is 299,299 with the HSV technique. Step 1 takes the input image. Steps 2, 3 and 4 perform the image preprocessing techniques to improve the input image quality. Step 5 checks the validation of the image. If the input image is valid, a further process will performed. And in case of an invalid image, the other method will not be performed, and the model will show the error message. Step 6 takes that input image and passes it to the trained classification model. And in steps 7 and 8, the classification process will be performed.

Figure 10: Cure suggestion result

3.5 Computational Time Complexity of Proposed Algorithms
Computational Time complexity is the time to run the complete model based on the input parameters. We train our model over the dataset and test the model over the test part of the dataset by completing all the required testing epochs. The complexity measured as the relation between the input dataset size and the number of complete operations performed. We have N leaves inside the dataset, and every leaf is processed to get the actual value from the dataset. The computed Computational Time complexity of algorithm-1 is O(N). The next algorithm-2 is the disease prediction phase. This algorithm shows the disease prediction results based on the prediction algorithm. The prediction based on classification after prediction in algorithm 1. The computed Computational Time Complexity of algorithm-2 is O (n log n).
The image samples used in this work are from various online repositories, including Kaggle and UCI. a complete dataset formed with all images. Images in the dataset grouped into three classes, i.e., brown spot, leaf blast, and bacterial blight. Input images are RGB images and can be converted into any domain. Dataset was also increased using the data augmentation technique. We use 1030 rice spot disease images, 1130 samples of rice blast disease images, and 1536 samples of rice blight disease images.
4.1 Experimental Setup and Performance Analysis
Our proposed model uses the Deep CNN technique to detect and classify rice plant disease. Wo uses different image preprocessing techniques to improve image quality and resize input images before processing. The JetBrains PyCharm Community Edition 2019.2.3 implements the proposed Deep CNN model. The dataset partitioned into i.e., a training set of 70% images from the total and a testing set of 30% images from the total images. Training and testing datasets contain three rice disease classes: (i) brown spot disease, (ii) bacterial leaf blight disease, and (iii) rice blast disease. Experiments are performed on each disease class to evaluate the proposed CNN model performance. We performed all the experiments on intel (R) Core (TM) i3-3110M CPU @ 2.40 GHz with the operating system Windows 10 (64-bit). The proposed model tested using PyCharm and the model achieved sublime text 3. 98.3% accuracy after 30 training iterations.
The results presented in this section are related to training with a dataset containing images of healthy and unhealthy rice plants. However, we know that CNN can learn features when trained on large data sets. After training, our model achieves an accuracy of 98.6%. After properly fine-tuning the network parameters, 98.9% completed. Even after the 30th training iteration, accuracy results obtained with the most reduced losses, but after the 60th repetitions, the model showed a good result with the highest accuracy of 99.666%.
Fig. 11 shows that the proposed model predicts the disease class (blast disease) with 98% confidence. And our proposed model also shows the percentage of the infected portion of the leaf image, as shown in Fig. 11. In Fig. 12, the proposed model predicts that the leaf infected with blast disease. The blast confidence of 0.98136 demonstrated with the prediction class. Fig. 13 shows a blast confidence of 0.989948 and in Fig. 14, the blast image confidence shows 0.998689. The highest confidence shows more accuracy in rice plant disease prediction in the proposed CNN model.

Figure 11: Cure suggestion result

Figure 12: Blast disease detection
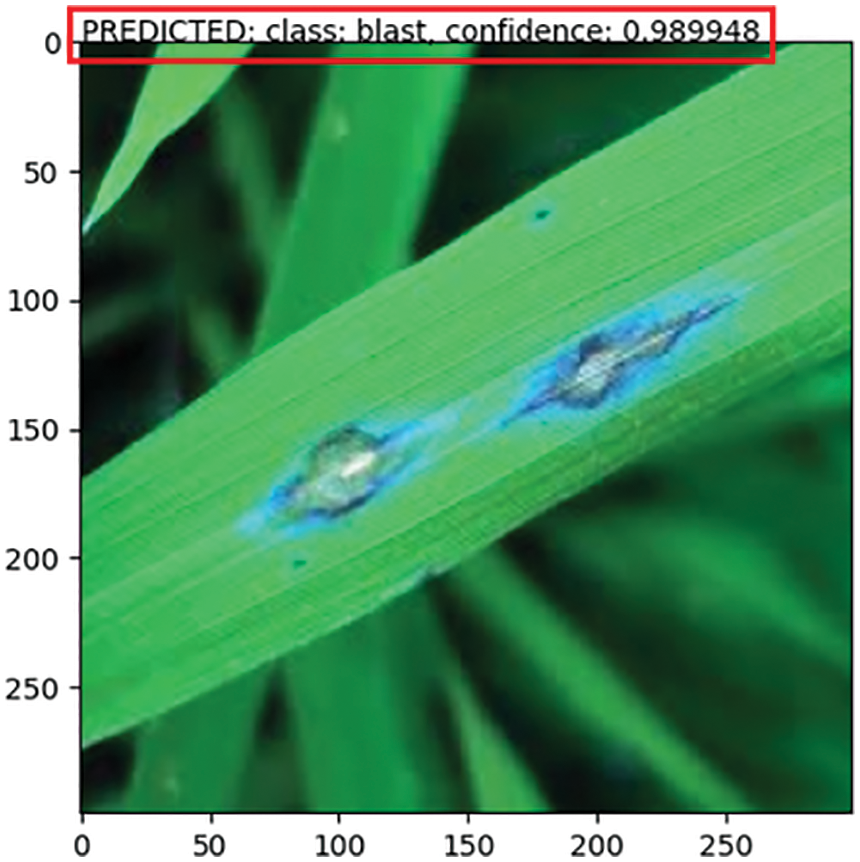
Figure 13: Blast disease detection

Figure 14: Blight disease detection
Fig. 15 shows the bacterial leaf blight disease detection with 0.997848 (99%) confidence. The results of bacterial leaf blight detection are given below in Figs. 16 and 17. Fig. 16 shows the bacterial leaf blight disease detection with 0.877884 confidence. Fig. 17 shows the bacterial leaf blight disease detection with 0.987621 confidence.

Figure 15: Blight disease detection

Figure 16: Leaf blight detection

Figure 17: Leaf blight detection
4.4 Brown Spot Disease Detection
Brown spot disease detection results shown in Figs. 18–20. In Fig. 18, the brown spots detected using the proposed CNN model with an accuracy of 0.996925. Fig. 18 shows the accuracy of 0.964091and Fig. 18 shows the prediction accuracy of 0.993949. Fig. 19 shows the result of brown spot disease detection with an accuracy of 96%. Fig. 20 also indicates brown spot disease detection results with a confidence of 99.33%.
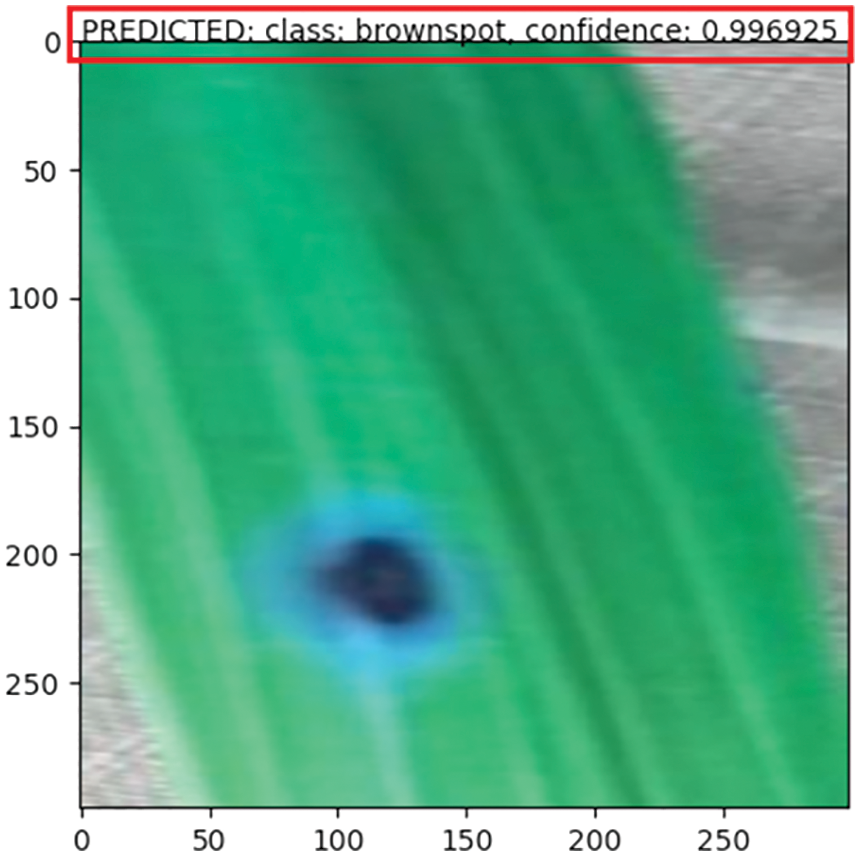
Figure 18: Brown spot detection

Figure 19: Brown spot detection

Figure 20: Brown spot detection
Fig. 21 shows the network’s repeated training success in the validation test. After 30th repetitions, a model loss reduced rapidly. The blue line on the graph should be lost during training. In repeated training, the loss was reduced rapidly, and the model accuracy increased quickly.

Figure 21: Model loss of the proposed model
Moreover, our proposed trained model was tested in each class to evaluate the model’s performance. Tests performed on all the images from the verification set. The results show images involved in disease prediction. The following figure shows the model accuracy during training and testing. Fig. 22 shows that the model’s accuracy increased rapidly during the number of iterations. Fig. 23 shows that the model’s accuracy increases rapidly, and the loss of the model decrease if we perform maximum iterations (Epoch) to train the model.

Figure 22: Model accuracy at 30 epochs

Figure 23: Model accuracy at 500 epochs
Fig. 24 shows the Confusion Matrix for model accuracy prediction. The confusion matrix in Fig. 24 shows the actual and predicted value combinations for plant disease detection and classification. Eqs. (3)–(9) show the confusion matrix’s detailed computations.

Figure 24: Confusion matrix for accuracy
Accuracy: After evaluating the model using the confusion matrix, the model’s accuracy computed in Eq. (3). The accuracy is the model’s performance across all the classes in the dataset. It describes the importance of the classes in the dataset on the CNN model.
Misclassification Rate of Model (Error Rate): the misclassification rate of the model computed in Eq. (4).
True Positive Rate (Sensitivity or Recall) computed using Eq. (5).
A false Positive Rate computed using Eq. (6).
The true Negative Rate computed using Eq. (7).
Precision: when the model predicts yes, and the actual result is also yes through Eq. (8).
Prevalence: How often “yes” occurs in our data sample is computed using Eq. (9).
The recall calculated using Eq. (10).
F-Score calculated using Eq. (11).
4.6 Model ROC curve (Receiver Operating Characteristic Curve) and AUC Curve
The ROC curve is a graph that shows the classification performance of our rice plant disease detection model. AUC (Area Under the Curve) demonstrates the classification model’s ability based on the proposed CNN model’s correct and incorrect classification accuracy. Fig. 25 shows the ROC Curve with the expected value as the outcome from the model. It shows the tradeoff between the specific and sensitive values of FPR and TPR. In Fig. 25, the ROC curve in yellow shows Logistic and its curviness towards the top left corner shows significantly better prediction values. The AUC defines the degree of probability. Fig. 25 also shows the AUC under the diagonal line. It supports the model to perform better in distinguishing between the classes. Fig. 25 shows a higher AUC, indicating that the model performs better for classifying classes.

Figure 25: ROC curve of the model
5 Conclusion and Future Directions
Accurate early disease detection can overcome the percentage of loss in crop yields. The proposed CNN model’s disease prediction dramatically enhances the overall productivity of rice crops. The prediction produces ends with the prediction of disease medicine or spray. Nowadays, there are too many modern image-processing approaches that help farmers and phytopathologists in plant disease prediction at early stages. These approaches lack an overall analysis of rice plant diseases. These also are not effective enough in predicting disease within time diagnosis, allowing the farmers to not only take precautions but also help cope with the diseases and nullify their further effects and damages. To pose a better solution, we analyzed the shortcomings of these approaches through literature and tried to understand the basics of these diseases in the subject crops. We proposed our approach. The proposed system uses CNN to detect the affected portion of the rice plant leaf. After this process, the disease portion analyzed to identify the type of disease. The percentage of defective parts in the leaf is determined by counting pixels of the infected part. The main findings are that the proposed methodology makes the farmer easily identify the three rice plant diseases with low costs and effort. We have currently tried to automate the manual diseases detection system to an automatic disease detection system through the deep CNN technique, which is very helpful for farmers and agriculturists for predicting the main three diseases in rice plants in less time, saving money and increasing the production of yield. In this research, we use the Deep CNN model, which performs better in detecting rice plant disease than the CNN model. In our proposed system, the overfitting is ignored by applying MobileNetV2 and Ef-ficientNetB0 models.
The dropout values are used to convenience the system by protecting against the overfitting values. Furthermore, this model can be embedded or supplemented by more features. The demands of users for more convenient and efficient interfaces are directly proportional to the sprouting developing and evolving technologies, so the model can also come up with changing and challenging standards. We have completed our research goals successfully. The classification model we developed is the hypothetical idea, which implemented in all possible ways the system meets the needs of the farmers. The work has significantly and economically impacted farmers worldwide, specifically in Pakistan. The proposed algorithm’s prediction accuracy effectively shows that promoted technique is adopted to find better results from current techniques.
Although the proposed methodology has achieved good results, this model will be used for other crop disease predictions by simply adding a crop disease image. This proposed model will also use other techniques to solve more image-related problems. Also, the proposed methodology will be enhanced over time by adding further knowledge, enabling the proposed method to work more efficiently and diversely.
In computers and agriculture, diagnosing and classifying diseases from the images of plants is one of the most interesting disease detection fields. Multiple image processing and machine learning techniques are used in agriculture to detect and classify diseases based on plant images. This study uses rice plants’ image processing and computer vision-based deep CNN techniques. This research mainly focuses on detecting three rice plant diseases using the deep CNN technique to maximize the quality and quantity of rice. This research aims to help farmers, analysts, and other people interested in farming rice plants by detecting and classifying rice plant diseases. In the proposed model, rice plant diseases detected at the early stages with a high level of accuracy. This proposed methodology consists of two phases, i.e., training and disease prediction phases. In the training phase, CNN training is performed using a predefined rice plant leaf image dataset. These images include brown spot disease images, bacterial leaf blight images and leaf blast disease images. The dis-ease prediction phase is responsible for diagnosing, classification and cure recommendation. The model predicts if the leaf is healthy or infected. If the leaf is healthy, no other processingare performed because there is no disease. And in the case of an infected leaf, the model performs operations on that image to classify the type of disease. After identification of the disease, the system suggests a specific cure. According to Eqs. (1)–(10), the results effectively show that the proposed model’s accuracy is 98.3%, the error rate is 0.01%, precision, recall, and F1 score is 99%. The knowledge of cure suggestions gathered from experts in the agriculture domain. This research will help perform the following tasks: (1) Detect whether rice leaf is healthy, (2) Classify the type of disease, and (3) Suggest a cure for the predicted disease. Our approach enhanced by adding more features, such as converting our model with real-time detection and classification of plant diseases. Our model is not a real-time detection model, so it’s a limitation of the classification model and this drawback can be overcome in the future.
Acknowledgement: The authors would like to acknowledge the support of the the University of Haripur, KP Pakistan for paying the Article Processing Charges (APC) of this publication. Special acknowledgment to University of Jeddah, Saudi Arabia Researchers Supporting Project number (PKURFL2324L33), Software Engineering Department, Collage of Computer Science and Engineering, University of Jeddah. Faisal Jamil was in part supported through an ERCIM Fellowship.
Funding Statement: This research was funded by the University of Haripur, KP Pakistan Researchers Supporting Project number (PKURFL2324L33), College of Computer Sciences and Engineering Department of Computer Science and Artificial Intelligence University of Jeddah, Saudi Arabia.
Availability of Data and Materials: The authors confirm that the data supporting the findings of this study are available within the article and supplementary material. Raw data supporting this study’s findings are available from the corresponding author upon reasonable request.
Conflicts of Interest: The authors declare that they have no conflicts of interest to report regarding the present study.
References
1. K. Bashir, M. Rehman and M. Bari, “Detection and classification of rice diseases: An automated approach using textural features,” Mehran University Research Journal of Engineering & Technology, vol. 38, no. 1, pp. 239–250, 2019. https://doi.org/10.22581/muet1982.1901.20 [Google Scholar] [CrossRef]
2. I. Javed and A. Ghafoor, “Determinants of rice export from Pakistan,” in Proc. of the Sixth Int. Conf. on Management Science and Engineering Management, Islamabad, Pakistan, Springer Nature, vol. 55, pp. 793–801, 2013. [Google Scholar]
3. V. Singh and A. K. Misra, “Detection of plant leaf diseases using image segmentation and soft computing techniques,” Information Processing in Agriculture, vol. 4, no. 1, pp. 41–49, 2017. https://doi.org/10.1016/j.inpa.2016.10.005 [Google Scholar] [CrossRef]
4. Z. Naureen, A. H. Price, F. Y. Hafeez and M. R. J. C. P. Roberts, “Identification of rice blast disease-suppressing bacterial strains from the rhizosphere of rice grown in Pakistan,” Elsevier, vol. 28, no. 12, pp. 1052–1060, 2009. https://doi.org/10.1016/j.cropro.2009.08.007 [Google Scholar] [CrossRef]
5. T. Gayathri Devi and P. J. C. C. Neelamegam, “Image processing based rice plant leaves diseases in Thanjavur, Tamilnadu,” Springer, vol. 22, no. 6, pp. 13415–13428, 2019. [Google Scholar]
6. S. D. Khirade and A. Patil, “Plant disease detection using image processing,” in 2015 Int. Conf. on Computing Communication Control and Automation, Pune, India, pp. 768–771, 2015. [Google Scholar]
7. Q. Yao, Z. Guan, Y. Zhou, J. Tang, Y. Hu et al., “Application of support vector machine for detecting rice diseases using shape and color texture features,” in Int. Conf. on Engineering Computation, Hong Kong, China, pp. 79–83, 2009. [Google Scholar]
8. S. K. Upadhyay and A. Kumar, “A novel approach for rice plant diseases classification with deep convolutional neural network,” International Journal of Information Technology, vol. 14, no. 1, pp. 185–199, 2022. https://doi.org/10.1007/s41870-021-00817-5 [Google Scholar] [CrossRef]
9. U. Shruthi, V. Nagaveni and B. Raghavendra, “A review on machine learning classification techniques for plant disease detection,” in 5th Int. Conf. on Advanced Computing & Communication Systems (ICACCS), Coimbatore, India, pp. 281–284, 2019. [Google Scholar]
10. G. K. Sandhu and R. Kaur, “Plant disease detection techniques: A review,” in Int. Conf. on Automation, Computational and Technology Management (ICACTM), London, UK, pp. 34–38, 2019. [Google Scholar]
11. V. K. Shrivastava, M. K. Pradhan, S. Minz and M. P. Thakur, “Rice plant disease classification using transfer learning of deep convolution neural network,” The International Archives of the Photogrammetry, Remote Sensing and Spatial Information Sciences, vol. 42, no. 3, pp. W6–635, 2019. https://doi.org/10.5194/isprs-archives-XLII-3-W6-631-2019 [Google Scholar] [CrossRef]
12. V. Singh and A. Misra, “Detection of unhealthy region of plant leaves using image processing and genetic algorithm,” in Int. Conf. on Advances in Computer Engineering and Applications, Ghaziabad, India, pp. 1028–1032, 2015. [Google Scholar]
13. R. Swathi, T. Mahalakshmi and A. Srinivas, “Vision based plant leaf disease detection on the color segmentation through fire bird V robot,” Global Research and Development Journal for Engineering (GRDJE), vol. 1, no. 4, pp. 75–79, 2016. [Google Scholar]
14. S. Zhang, Z. You and X. Wu, “Plant disease leaf image segmentation based on superpixel clustering and EM algorithm,” Neural Computing and Applications, vol. 31, no. 2, pp. 1225–1232, 2019. https://doi.org/10.1007/s00521-017-3067-8 [Google Scholar] [CrossRef]
15. D. Sharath, S. A. Kumar, M. Rohan and C. Prathap, “Image based plant disease detection in pomegranate plant for bacterial blight,” in Int. Conf. on Communication and Signal Processing (ICCSP), Chennai, India, pp. 0645–0649, 2019. [Google Scholar]
16. S. S. Kumar and B. Raghavendra, “Diseases detection of various plant leaf using image processing techniques: A review,” in 2019 5th Int. Conf. on Advanced Computing & Communication Systems (ICACCS), Coimbatore, India, pp. 313–316, 2019. [Google Scholar]
17. U. Khan and A. Oberoi, “Plant disease detection techniques: A review,” in Int. Conf. on Automation, Computational and Technology Management (ICACTM), London, UK, vol. 8, pp. 59–68, 2019. [Google Scholar]
18. S. Baranwal, S. Khandelwal and A. Arora, “Deep learning convolutional neural network for apple leaves disease detection,” in Proc. of Int. Conf. on Sustainable Computing in Science, Technology and Management (SUSCOM), Rajasthan, Jaipur, India, Amity University, 2019. [Google Scholar]
19. A. K. Rath and J. K. Meher, “Disease detection in infected plant leaf by computational method,” Archives of Phytopathology and Plant Protection, vol. 52, no. 19–20, pp. 1348–1358, 2019. https://doi.org/10.1080/03235408.2019.1708546 [Google Scholar] [CrossRef]
20. D. Mohapatra, J. Tripathy and T. K. Patra, “Rice disease detection and monitoring using CNN and Naive Bayes classification,” Soft Computing Techniques and Applications: Springer, vol. 46, no. 91–98, pp. 11–29, 2021. https://doi.org/10.1007/978-981-15-7394-1 [Google Scholar] [CrossRef]
21. T. Poornappriya and R. Gopinath, “Rice plant disease identification using artificial intelligence approaches,,” Journal of Soft Computing, vol. 11, no. 10, pp. 392–402, 2022. [Google Scholar]
22. P. K. Sethy, N. K. Barpanda, A. K. Rath and S. K. Behera, “Deep feature based rice leaf disease identification using support vector machine,” Computers and Electronics: Elsevier, vol. 175, no. 1, pp. 105527, 2020. https://doi.org/10.1016/j.compag.2020.105527 [Google Scholar] [CrossRef]
23. G. Zhou, W. Zhang, A. Chen, M. He and X. Ma, “"Rapid detection of rice disease based on FCM-KM and faster R-CNN fusion,” IEEE Access, vol. 7, pp. 143190–143206, 2019. [Google Scholar]
24. W. -J. Liang, H. Zhang, G. -F. Zhang and H. -X. Cao, “Rice blast disease recognition using a deep convolutional neural network,” Scientific Reports, vol. 9, no. 1, pp. 1–10, 2019. https://doi.org/10.1038/s41598-019-38966-0 [Google Scholar] [PubMed] [CrossRef]
25. W. -L. Chen, Y. -B. Lin, F. -L. Ng, C. -Y. Liu and Y. -W. Lin, “RiceTalk: Rice blast detection using Internet of Things and artificial intelligence technologies,” IEEE Internet of Things Journal, vol. 7, no. 2, pp. 1001–1010, 2019. https://doi.org/10.1109/JIOT.2019.2947624 [Google Scholar] [CrossRef]
26. S. Limkar, S. Kulkarni, P. D. Chinchmalatpure, M. Desai, S. Angadi et al., “Classification and prediction of rice crop diseases using CNN and PNN,” in Intelligent Data Engineering and Analytics. Springer, pp. 31–40, 2021. https://doi.org/10.1007/978-981-15-5679-1_4 [Google Scholar] [CrossRef]
27. O. O. Abayomi-Alli, R. Damaševičius, S. Damaševičius and R. Maskeliūnas, “Cassava disease recognition from low-quality images using enhanced data augmentation model and deep learning,” Wiley Online Library, vol. 38, no. 7, pp. e12746, 2021. https://doi.org/10.1111/exsy.12746 [Google Scholar] [CrossRef]
28. A. M. Mostafa, S. A. Kumar, T. Meraj, H. T. Rauf, A. A. Alnuaim et al., “Guava disease detection using deep convolutional neural networks: A case study of guava plants,” MDPI Applied Sciences, vol. 12, no. 1, pp. 239, 2021. https://doi.org/10.3390/app12010239 [Google Scholar] [CrossRef]
29. A. Almadhor, H. T. Rauf, M. I. U. Lali, R. Damaševičius, B. Alouffi et al., “Ai-driven framework for recognition of guava plant diseases through machine learning from DSLR camera sensor based high resolution imagery,” MDPI Sensors, vol. 21, no. 11, pp. 3830, 2021. https://doi.org/10.3390/s21113830 [Google Scholar] [PubMed] [CrossRef]
30. N. Kundu, G. Rani, V. S. Dhaka, K. Gupta, S. C. Nayak et al., “IoT and interpretable machine learning based framework for disease prediction in pearl millet,” MDPI Sensors, vol. 21, no. 16, pp. 5386, 2021. https://doi.org/10.3390/s21165386 [Google Scholar] [PubMed] [CrossRef]
31. J. Chen, D. Zhang, A. Zeb and Y. A. Nanehkaran, “Identification of rice plant diseases using lightweight attention networks,” Expert Systems with Applications, vol. 169, no. 4, pp. 114514, 2021. https://doi.org/10.1016/j.eswa.2020.114514 [Google Scholar] [CrossRef]
32. R. Sharma and A. Singh, “Big bang-big crunch-CNN: An optimized approach towards rice crop protection and disease detection,” Archives of Phytopathology and Plant Protection, vol. 55, no. 2, pp. 143–161, 2022. https://doi.org/10.1080/03235408.2021.2003054 [Google Scholar] [CrossRef]
33. T. Daniya and S. Vigneshwari, “Deep neural network for disease detection in rice plant using the texture and deep features,” The Computer Journal, vol. 65, no. 7, pp. 1812–1825, 2021. https://doi.org/10.1093/comjnl/bxab022 [Google Scholar] [CrossRef]
34. M. Sharma, C. J. Kumar and A. Deka, “Early diagnosis of rice plant disease using machine learning techniques,” Archives of Phytopathology and Plant Protection, vol. 55, no. 3, pp. 259–283, 2022. https://doi.org/10.1080/03235408.2021.2015866 [Google Scholar] [CrossRef]
35. A. Rahman, S. N. Shoumik, M. Rahman and H. Hena, “Rice disease detection based on image processing technique,” in Smart Trends in Computing and Communications: Proceedings of SmartCom 2020, Springer, pp. 135–145, 2021. https://doi.org/10.1007/978-981-15-5224-3_13 [Google Scholar] [CrossRef]
36. T. Daniya and S. Vigneshwari, “Deep neural network for disease detection in rice plant using the texture and deep features,” The Computer Journal, vol. 65, no. 7, pp. 1812–1825, 2022. https://doi.org/10.1093/comjnl/bxab022 [Google Scholar] [CrossRef]
37. S. K. Upadhyay and A. Kumar, “A novel approach for rice plant diseases classification with deep convolutional neural network,” International Journal of Information Technology, vol. 14, no. 1, pp. 185–199, 2022. https://doi.org/10.1007/s41870-021-00817-5 [Google Scholar] [CrossRef]
Cite This Article
 Copyright © 2023 The Author(s). Published by Tech Science Press.
This work is licensed under a Creative Commons Attribution 4.0 International License , which permits unrestricted use, distribution, and reproduction in any medium, provided the original work is properly cited.
 Downloads
 Citation Tools