
 Submit a Paper
 Propose a Special lssue
 Open Access
ARTICLE
Fine-Grained Soft Ear Biometrics for Augmenting Human Recognition
Department of Computer Science, Faculty of Computing and Information Technology, King Abdulaziz University, Jeddah, Saudi Arabia
* Corresponding Author: Ghoroub Talal Bostaji. Email:
Computer Systems Science and Engineering 2023, 47(2), 1571-1591. https://doi.org/10.32604/csse.2023.039701
Received 12 February 2023; Accepted 24 April 2023; Issue published 28 July 2023
 View Full Text
 Download PDF
Abstract
Human recognition technology based on biometrics has become a fundamental requirement in all aspects of life due to increased concerns about security and privacy issues. Therefore, biometric systems have emerged as a technology with the capability to identify or authenticate individuals based on their physiological and behavioral characteristics. Among different viable biometric modalities, the human ear structure can offer unique and valuable discriminative characteristics for human recognition systems. In recent years, most existing traditional ear recognition systems have been designed based on computer vision models and have achieved successful results. Nevertheless, such traditional models can be sensitive to several unconstrained environmental factors. As such, some traits may be difficult to extract automatically but can still be semantically perceived as soft biometrics. This research proposes a new group of semantic features to be used as soft ear biometrics, mainly inspired by conventional descriptive traits used naturally by humans when identifying or describing each other. Hence, the research study is focused on the fusion of the soft ear biometric traits with traditional (hard) ear biometric features to investigate their validity and efficacy in augmenting human identification performance. The proposed framework has two subsystems: first, a computer vision-based subsystem, extracting traditional (hard) ear biometric traits using principal component analysis (PCA) and local binary patterns (LBP), and second, a crowdsourcing-based subsystem, deriving semantic (soft) ear biometric traits. Several feature-level fusion experiments were conducted using the AMI database to evaluate the proposed algorithm’s performance. The obtained results for both identification and verification showed that the proposed soft ear biometric information significantly improved the recognition performance of traditional ear biometrics, reaching up to 12% for LBP and 5% for PCA descriptors; when fusing all three capacities PCA, LBP, and soft traits using k-nearest neighbors (KNN) classifier.Keywords
Human recognition is one of the most growing domains of today’s society, as it relates to numerous aspects of daily life, including forensics, surveillance and security systems, border crossing, law enforcement, access control to mobile devices, and so on. Due to the comprehensiveness and importance of the domain, the problem of accurately recognizing a person’s identity is becoming continuously a major necessity. Therefore, biometric systems have emerged as an effective technology that can identify or authenticate individuals based on their physiological (face, iris, ear, and fingerprints) and behavioral (gait, voice, and signature) characteristics [1]. Generally, these traditional (hard) biometrics must satisfy as much as possible some of the fundamental requirements, such as permanence, uniqueness, universality, collectability, and measurability, to provide more secure solutions [2].
Alphonse Bertillon (a French criminologist) was deemed as the first to use biometrics to identify convicted criminals in 1879 [3]. Recently and compared to other biometric modalities, ear biometrics has seen a somewhat steady rise in popularity and interest, where the ear as a biometric trait has beneficial characteristics in individual recognition [4], as shown in Fig. 1; this comprises: unique visible biological location for individuals [5]; invariant shape slowly increases in size with age [6,7]; not affected by makeup, various expressions, or sunglasses compared to face biometrics; enabling passive identification could be at a distance without involving the person of interest [8]; very difficult to be faked with plastic surgery; one can use any camera (as widespread cheap sensors) to capture ear images; and helpful as a non-intrusive contactless biometric form suited to avoid disease/virus spread.
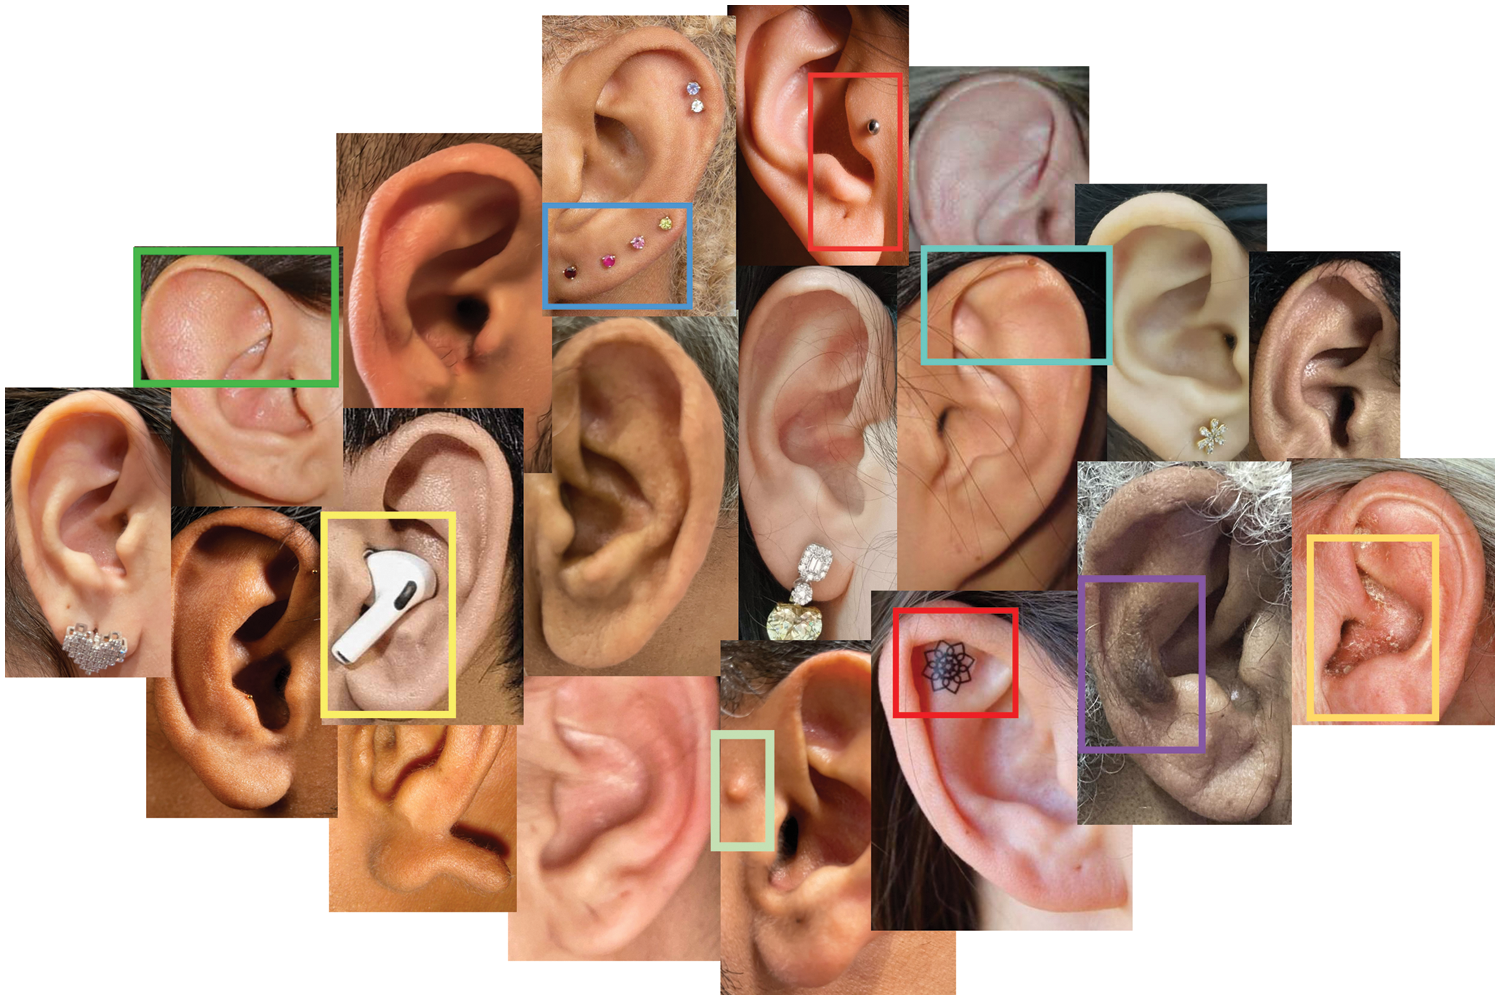
Figure 1: Different samples of ear images exhibit the observable differences between human ears, where each has unique and distinct characteristics in each part of the outer-ear structure
However, most traditional ear recognition systems are based on computer vision and deep learning models and have achieved good results [4]. Nevertheless, these models still suffer in unconstrained environments where performance results can be significantly affected by pose, illumination, variation of sensors, and occlusion [9–11]. Moreover, imposters can circumvent some of these systems using spoof attacks due to the high dependence on the complex geometrical shape of the ear, which often being obscured by hair, hoodies, tattoos, and similar [12]. Hence, they might sometimes fail to meet the high-security accuracy requirements. Given such situations, some traits can be difficult to extract automatically, while can still be perceived semantically using soft biometrics.
Thus, soft biometrics appeared later as a new form of biometric traits for identification, which concerns descriptive nameable attributes used naturally by humans to identify and describe each other. Also, such soft traits can offer supplementary information to augment the identity information provided by traditional/hard biometric traits [13]. Furthermore, one of the main advantages of soft biometric traits is their robustness against environmental variation (such as pose, illumination, background clutter, and so on), unlike hard biometrics [14]. Examples of soft biometrics that are extracted from a human body include height, weight, age, eye color, etc. Few studies have shown that when combining soft biometrics with traditional (hard) biometrics, these traits can have practical usage and significant importance in improving recognition performance [15–17].
As a matter of fact, the soft ear biometrics field has attracted little attention. To the best of our knowledge, very few studies have used or combined soft features with traditional ear features. Besides, an extended analysis to exploit the capabilities of detailed soft ear biometrics, as fine-grained high-level semantic features of the ear, to improve the performance of traditional computer vision-based ear biometrics is yet to be adopted and investigated. To this end, this paper investigates the viability of a novel set of proposed ear-based soft biometrics and fuses them with other traditional (hard) ear biometric features, thus bridging the semantic gap between humans and machines in the ear recognition task. This can pave the way for broader ear recognition enforcement in various unimodal/multimodal biometric applications for different purposes. Such proposed soft ear biometrics can be used in isolation or fusion with traditional ear biometrics. Our main contributions of this paper can be summarized as follows:
• Proposing a novel set of detailed semantic attributes of the human ear to be used as soft ear biometrics.
• Using these soft ear biometrics for augmenting and improving the performance of traditional vision-based models for ear recognition.
• Offering a suited fusion algorithm for efficiently integrating the proposed soft ear biometrics and traditional ear features for augmented human identification and verification.
• Analyzing the proposed semantic attributes and their performance using different statistical and analytical tests to investigate and select the most significant subset of soft ear biometrics achieving the highest performance.
The remainder of this paper is organized as follows. Section 2 shows a literature review of traditional ear recognition approaches, earlier studies on the feature-level fusion of different ear biometrics, and related work concerning the fusion of ear biometrics with other soft biometrics. The proposed system framework and research methodology are described in Section 3. While Section 4 provides results and discussion. Finally, Section 5 offers conclusions and potential future work.
This section gives a brief overview of state-of-the-art approaches in the context of ear recognition, either for identification or verification purposes, which reviews the most relevant studies to our work.
2.1 Traditional Ear Recognition Approaches
Recently, most current studies focused on deep learning methods and used pre-trained models to retrain and synthesize them with ear images because they were found to give better results, whereas others utilized local feature descriptors. Also, many other studies explored different ways to expand an existing dataset or invent a new one suitable for identifying the ears since deep learning requires a considerable number of images to achieve the desired efficacy of deep-based learning.
In deep learning, the transfer learning process is a pre-trained neural network that can be used as input to another deep learning model to extract discriminative features for a different task. Alshazly et al. [18] proposed various demonstration methods of the ear recognition task based on transfer learning. They analyzed different configurations of the Visual Geometry Group (VGG) network, then used the best models that highlight significant regions of the ear images to construct ensembles of models with varying weights to boost the accuracy. It has been observed that the fine-tuning models had demonstrated their effectiveness compared to other models. The experiments revealed excellent results, with 97.50% on the AMI dataset and an accuracy of 93.21% and 79.08% on the AMIC, and WPUT ear datasets, respectively. Another recent study also used the transfer learning technique [19], in which the authors used three pre-trained networks, including AlexNet, GoogleNet, and ResNet50, and applied two IAMI and IT Delhi datasets. PCA is used for feature reduction. The Ensemble classifiers achieved good results for the AMI database. Similarly, in [20], the researchers also studied the effect of domain adaptation by fine-tuning pre-trained deep CNNs models. Various datasets, such as AWE, AMI, WPUT, IITD, UERC train, and multi-PIE Ear, were used. Furthermore, they fused the two best-performing models and achieved a maximum of 67.53% test accuracy.
Due to the limited size of the ear dataset, the authors in [21] present a new dataset called USTB-HelloEar of ear images taken in an unconstrained environment. Then, they fine-tuned and modified five well-trained deep models: VGG, ResNet, VGG face, Google Net, and AlexNet, to deal with the arbitrary size of input data, where this was done by replacing the last pooling layer of the CNN with a spatial pyramid pooling layer (SPP), which can be utilized to obtain multi-scale information. The experimental results showed that the modified VGG-face model performed better than other CNN models. Recently, EarVN1.0 was presented in [22] as an unconstrained dataset for experimental study in the ear recognition field. They employed eight pre-trained CNN models. Then they applied a fine-tuned technique to each model using custom size inputs and reported that the ResNeXt101 model achieved the highest recognition accuracy of 93.45%. Moreover, to improve the performance result of the ResNeXt101 model, they applied the ensemble learning process, attaining a higher performance of 95.85% accuracy compared to their other examined techniques. However, they do not utilize other databases to validate how generalized their proposed method is, in contrast to the earlier comparable studies in the literature.
Hassaballah et al. [23] proposed a new variant descriptor of LBP, termed robust local oriented patterns (RLOP), for ear recognition. This method is utilized to derive local structure information using edge ear features. The extracted features are supposed to be robust against illumination and rotation. They evaluate the approach on AMI, AWE, and IITD-II databases. The descriptor works effectively and yields good results, but performance decreases in unconstrained environments.
2.2 Feature-Level Fusion of Different Ear Biometrics
Feature-level fusion has become an important research aspect and has been variously proven to improve recognition performance, as combining different collaborative features can provide complementary information. For instance, in [24], they proposed a framework combining handcrafted and CNN-based learned features using landmark detection to perform the ear recognition task and address related issues. The handcrafted-based features were extracted using various descriptors: histograms of oriented gradients (HOG), binarized statistical image features (BSIF), rotation invariant LPQs (RILPQ), local phase quantization features (LPQ), patterns of oriented edge magnitudes (POEM), dense scale-invariant feature transform (DSIFT), LBP and Gabor wavelets. Their experiment was conducted on five different datasets: IIT, WPUTE, AWE, UERC, and ITWE. They conducted multiple experiments using their approach with various combinations of feature fusion and proved that handcrafted and learned features complement each other for enhanced recognition. Moreover, CNN and HOG outperformed all compared techniques and achieved 75.6% as the best fusion to improve performance.
Different from CNN-based deep features, in [25–28], authors have focused on combining local descriptors features and studying the importance of the handcrafted features fusion to recognize ear images. The study in [25] used the Gabor-Zernike operator (GZO) to extract global features and the LPQ method to extract local features, combined using a genetic algorithm to find the optimal feature set. USTB, IIT Delhi-1, and IIT Delhi-2 databases were also tested using the nearest neighbor classifier with Canberra distance. Accuracies of 100%, 99.2%, and 97.13% were obtained, respectively. Also, another research study proposed a different approach for ear recognition problems based on local discriminative feature fusion [26]. Hence, they conducted their experiments on five popular ear datasets, AWE, IIT Delhi II, USTB I, and USTB II. The local features (geometric and appearance-based) have been extracted from aligned and non-aligned ear images using LPQ, HOG, LBP, POEM, BSIF, and Gabor. They described the ear with geometric and appearance-based features. They claimed that the geometric features suffer from variations in illumination, scaling, rotation, or occlusion. At the same time, the appearance-based features that extract the intensity, directional, and spatial-temporal information can be successful complementary information for other local features. Therefore, feature-level fusion can lead to recognition performance improvement. Their fusion was done using the discriminant correlation analysis (DCA) algorithm, while the support vector machine (SVM) was used for the classification step. Their experimental results showed that the fusion techniques achieved higher recognition rates on non-aligned images than on aligned images. Jiddah et al. [27] proposed dividing the human ear into four quarters, then examining each section individually to identify the most critical region in the ear image. They used an LBP descriptor to extract geometric-based features and the Laplacian filter for texture feature extraction. Finally, they fused the geometric and texture features to demonstrate the effectiveness of their feature combinations. The features fusion of the upper left quarter of the divided right ear image achieved the best recognition rate, yielding 80% accuracy. In recent research [28], authors developed a feature-level fusion scheme of PHOG and LDP local descriptors. PHOG represents the spatial shape information, and LDP encodes the local texture information of ear images. PCA is utilized for reducing the dimensions. The kernel discriminant analysis (KDA) method was used to extract nonlinear discriminant features based on the KNN classifier. The experimental results show that the performance of the proposed method achieved 97.34% accuracy and 2.47 ERR on the UND-E dataset.
2.3 Fusion of Ear Biometrics and Other Soft Biometrics
Significantly few research studies have utilized the capabilities of soft biometrics in the human ear identification field. Soft biometrics alone is not anticipated to be sufficient information for highly competitive performance, whereas they can play an essential role in complementing other traditional biometrics and augmenting recognition performance. In [29], they proposed an approach for newborn babies’ recognition using the fusion of ear biometric and body-based soft biometrics like gender, blood group, weight, and height. They collected a new dataset containing 2100 ear images of 210 children. The features were extracted from ear images using well-known algorithms: Fisher Linear Discriminant Analysis (FLDA), Independent Component Analysis (ICA), Geometrical Feature Extraction (GF), HAAR, and PCA. The HAAR algorithm obtained an identification accuracy of 90.72% after fusion with soft biometrics. Another study proposed a system using soft biometrics in the context of ear identification [30]. The proposed system consists of three modules: traditional ear recognition, soft biometrics, and feature fusion. Therefore, this study used local Gabor binary pattern (LGBP) and BSIF in the traditional feature extraction module. The soft biometrics module was inferred for skin color, hair color, and mole location. Eventually, the Bayesian framework carried out the fusion of traditional and soft biometrics. Their experimental results showed that the attained improvement of identification performance reached 54.20% by utilizing soft biometrics.
Although some researchers in the field of human ear recognition have been interested in studying the capabilities of deep learning and machine learning, and very few of them have been interested in other soft biometrics of the body, the exploitation of human vision capabilities in analyzing ear images and extracting detailed semantic features of the ear, as fine-grained soft ear biometrics, has not been investigated in it yet; this may help bridge the semantic gap and improve performance of traditional-based methods effectively.
Our proposed ear recognition system framework consists of four main modules: vision-based ear biometric features extraction, soft ear biometric features extraction, feature-level fusion, and person recognition (identification/verification), as depicted in Fig. 2. Initially, the mathematical analysis of images (AMI) ear dataset has been used as an ear image input, where images have been taken in an indoor environment, including pose, illumination, and occlusion as covariates. In the vision-based subsystem, and as a preprocessing step, all images are cropped for ear segmentation, then converted into grayscale representations. Afterward, the traditional (hard) ear feature vectors are extracted using LBP- and PCA-based methods and normalized using min-max normalization. On the other hand, the soft ear biometric subsystem takes all ear images into the crowdsourcing annotation platform to derive a corresponding semantic label dataset. Then, for all subjects in the dataset, it infers normalized average semantic label per trait for each subject to be used together as a feature vector of soft ear biometrics. In the fusion module, feature-level fusion is enforced via several combinations of traditional and soft biometrics to verify their capabilities and robustness in augmenting traditional computer-vison-based biometrics and outperforming by all means the recognition performance of using traditional ear traits alone. Finally, the KNN or SVM classifier recognizes the person’s identity and compares the algorithms’ performance in different ranks.
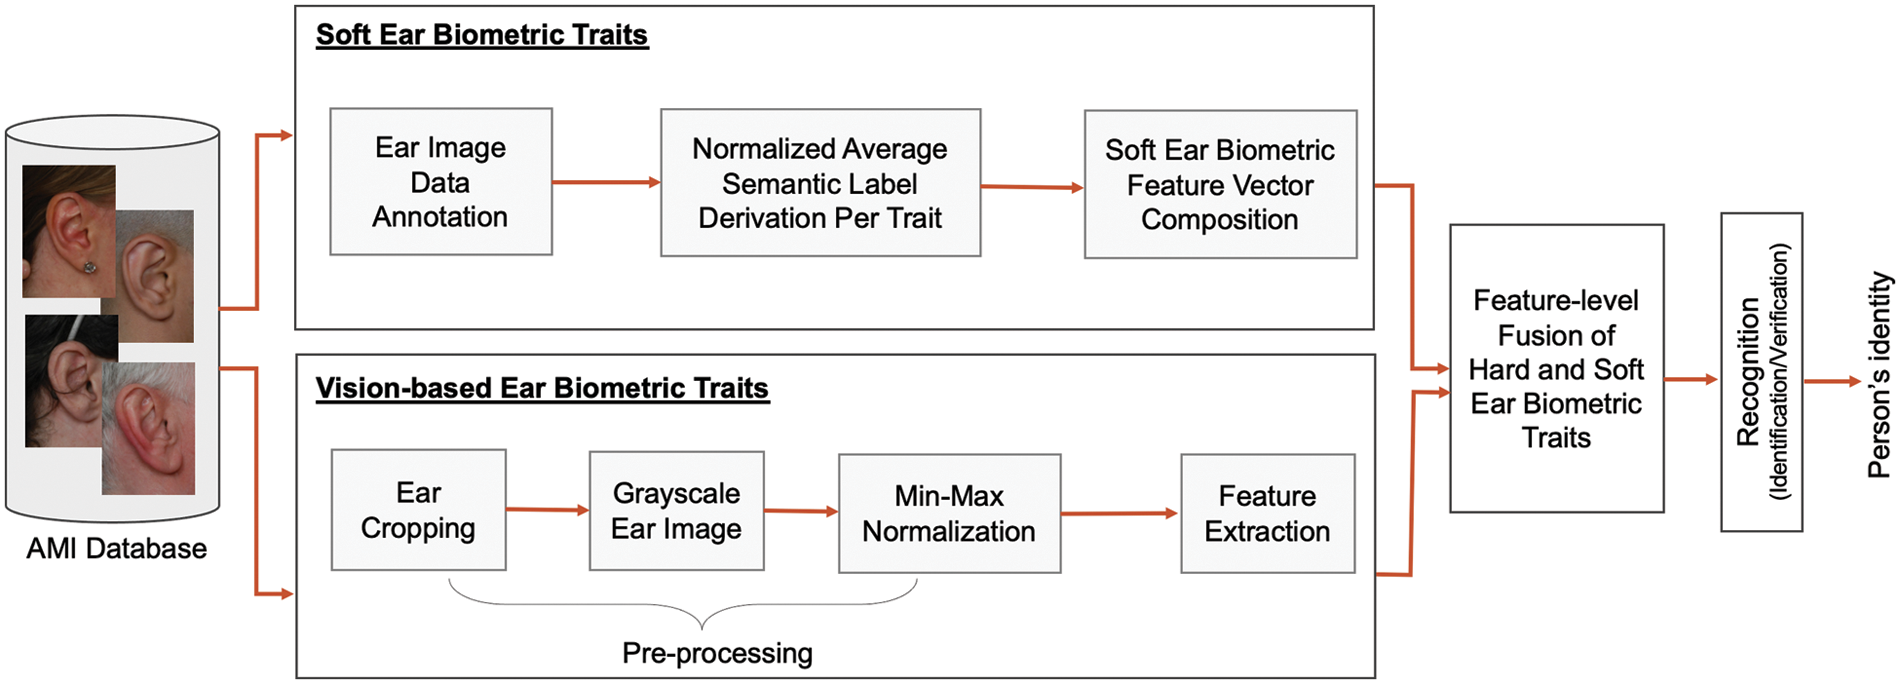
Figure 2: Overview of the proposed system framework
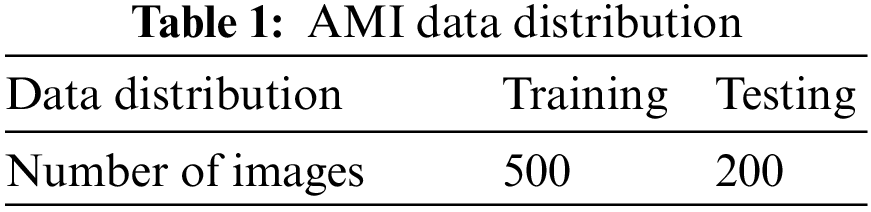
To evaluate the performance of the proposed ear recognition algorithms and test the validity and invariance properties of the proposed soft biometrics, we conduct our experiments on the mathematical analysis of images (AMI) benchmark ear dataset [31]. The database was compiled at the University of Las Palmas from 100 subjects (aged 19–65 years) comprising students, teachers, and other campus staff. Each subject has seven images, five of them for the right-side profile (right ear) with different head poses: face forward (FRONT), looking up, down, left, and right (UP, DOWN, LEFT, RIGHT). The sixth one is also of the right profile but has a different camera focal length (ZOOM). Last image of the left side profile (the left ear) with a forward pose (BACK), for a total of 700 images. All photos were taken indoors under the same lighting conditions, mild occlusion, and some accessories. Further, they have the same JPEG format and resolution of 492 × 702 pixels. A few sample images of the AMI dataset are shown in Fig. 3. In our experiments, we need to use the same samples for training and testing in both parts of the proposed system to extract different hard and soft features. For this purpose, we divided the dataset manually into two disjoint sets; based on a 70:30 proportion for training and testing, respectively. Specifically, for each subject, we assign five samples (BACK, DOWN, FRONT, LEFT, and UP) for training and two (ZOOM and RIGHT) for testing; Table 1 shows the distribution of the AMI dataset.
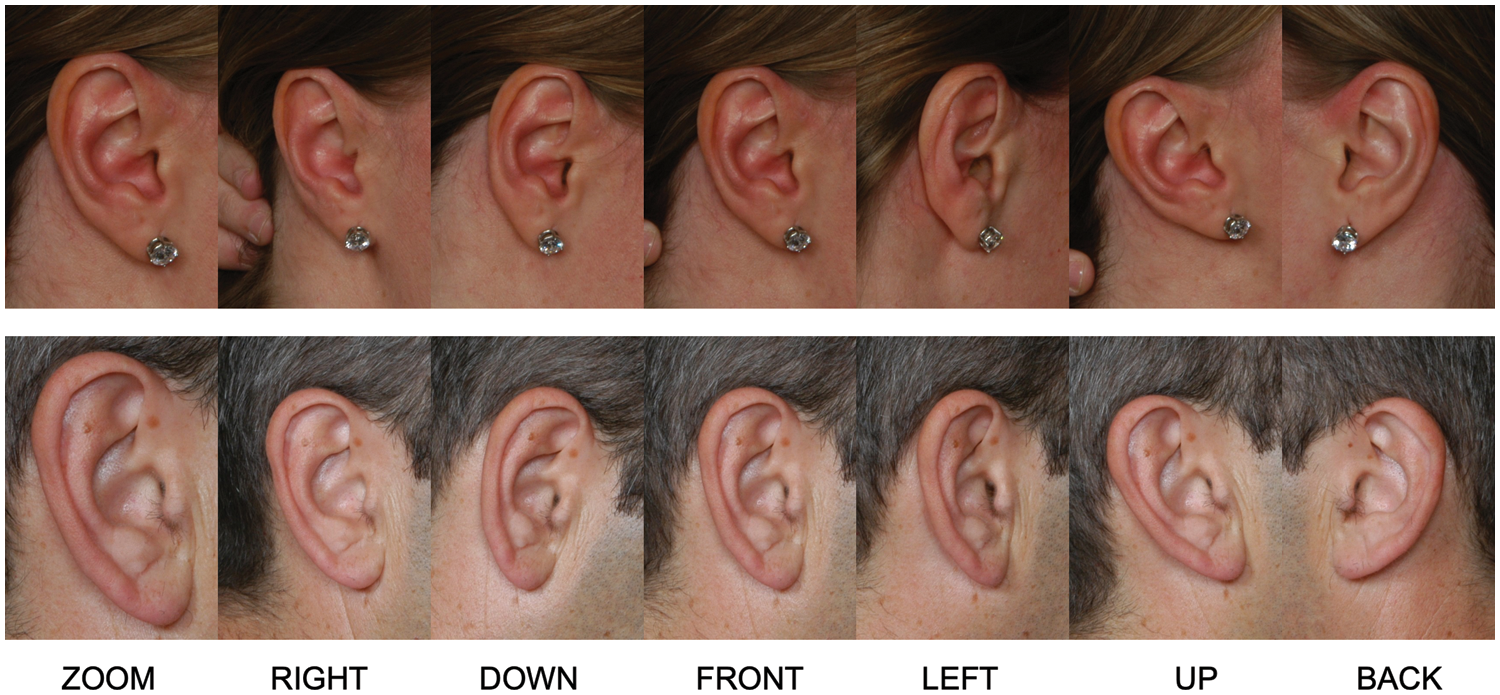
Figure 3: Sample images of the AMI ear dataset
3.2.1 Fine-Grained Soft Ear Attributes
This research proposes a novel group of 33 semantic attributes introduced in understandable, visible, and reliable ways compatible with human perception for ear recognition. All these traits are structural and comprehensive to the ear’s parts only, unlike other existing research studies that combined the features of the ear with some facial features, hair, or around the ear [32]. These attributes are divided into groups based on the ear zones and different ear characteristics, which are Scapha, Helix, Earlobe, Tragus, Ear Hair, Ear Skin, the ear shape in general, and if there are any accessories. Furthermore, an appropriate set of categorical or relative labels is given for each attribute to be semantically described. The categorical (absolute) labels may be binary or multi-class absolute (or nominal) descriptions, such as (Normal–Abnormal) or (Black–White–Gray–Blonde–Brown), respectively. In contrast, the relative labels are measurable (or ordinal) descriptions used to describe the degree of presence, such as (Small–Medium–Large). In addition, the label (can’t see) is included in case there is any occlusion or obscureness in the image to avoid any mental inferences. However, each categorical/relative label is represented by an integer value. The categorical labels are randomly assigned ordered integer values 1-N in consistent distribution. On the other hand, most of the relative bipolar label sets take values of a five-point scale (ranging from 1 to 5) to reflect the degree of strength, whereas the others are designed to take only a three-point scale (ranging from 1 to 3) to avoid uncertainty and overestimate such traits [33]. Table 2 shows the proposed list of soft ear biometrics with their semantic labels derived from a human ear, as shown in Fig. 4.
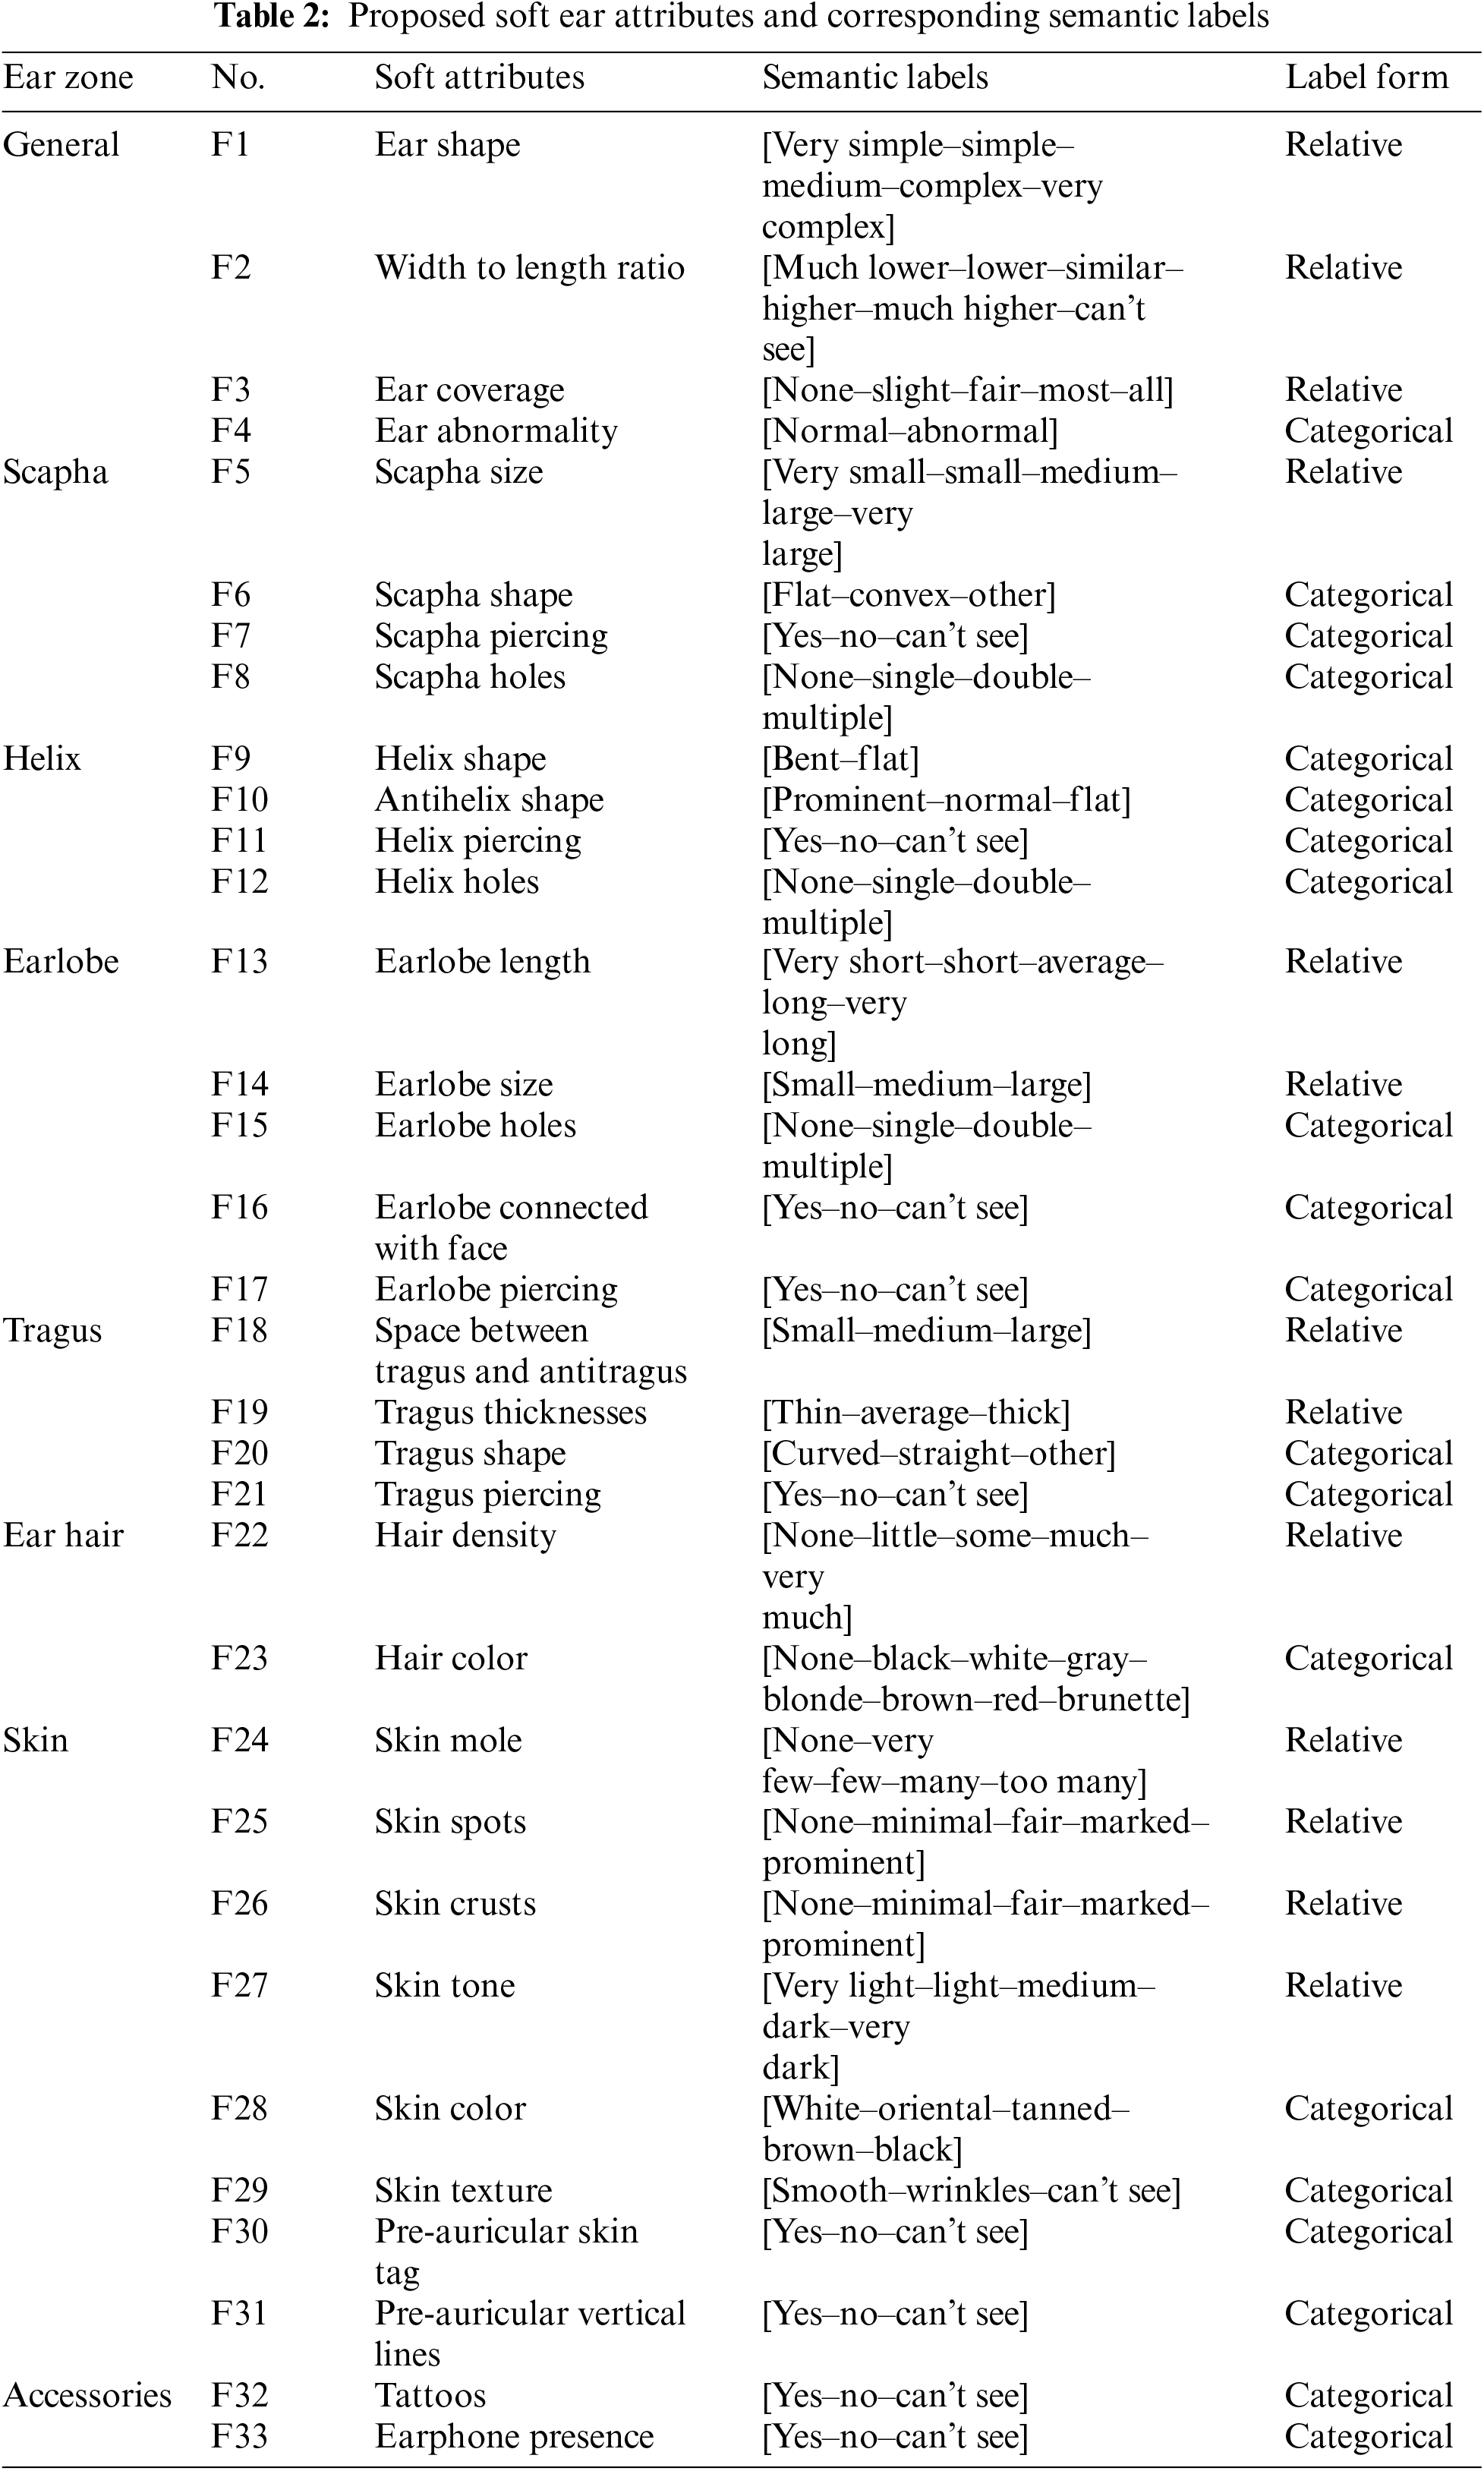
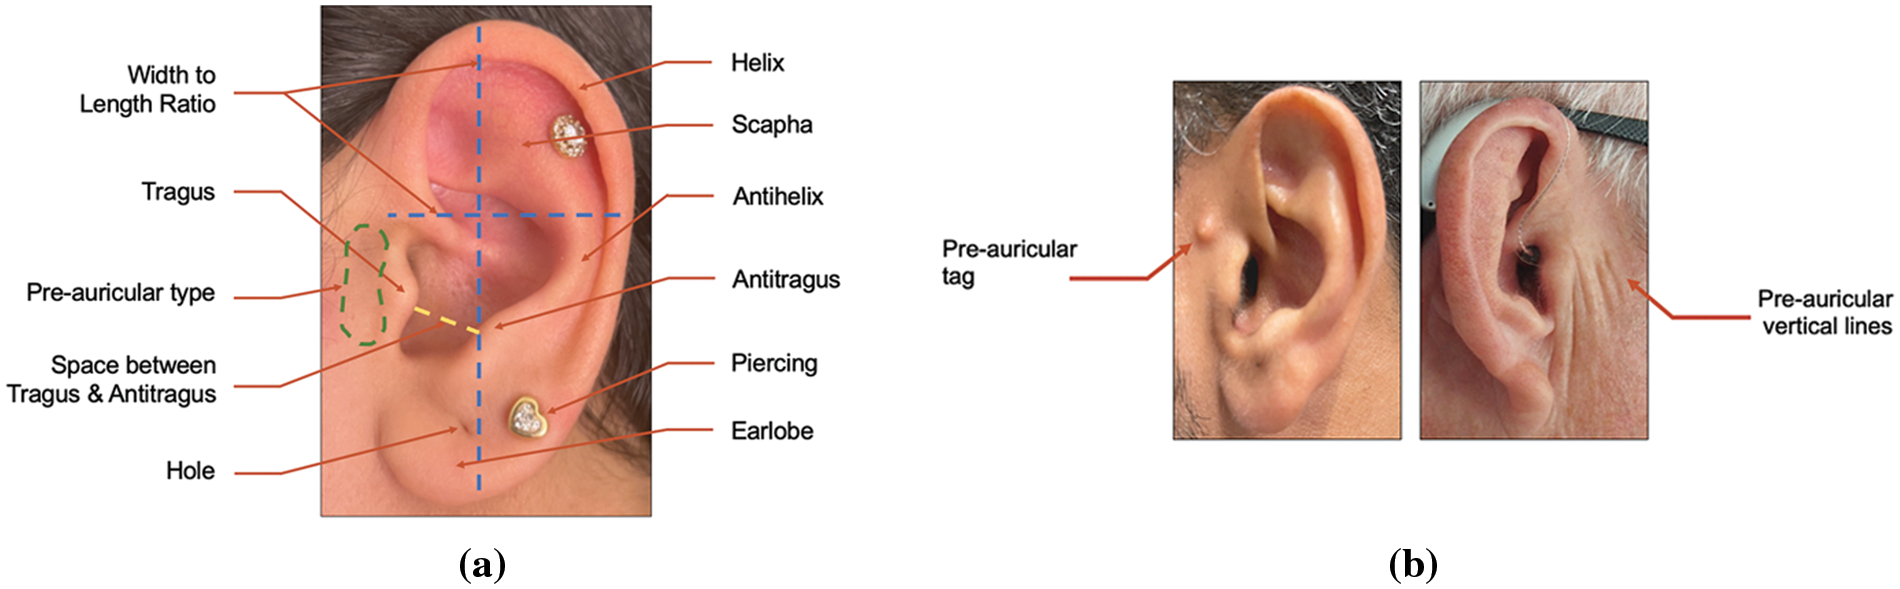
Figure 4: (a) Attributes extracted from the structure of the outer ear, (b) types of pre-auricular attribute
3.2.2 Ear Image Data Annotation and Soft Ear Biometrics Derivation
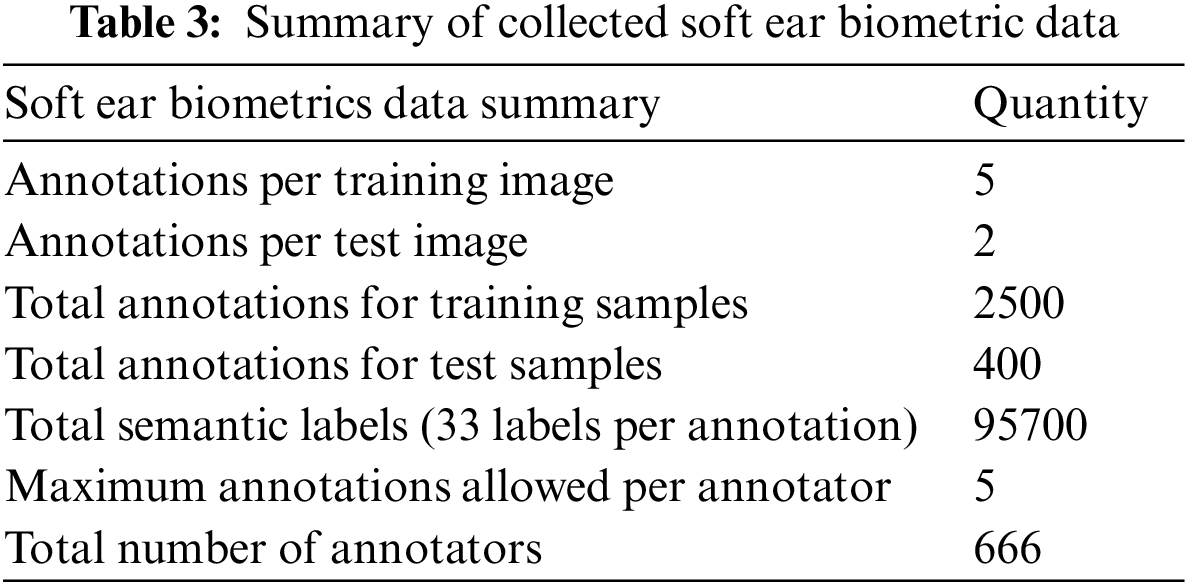
This research used the Appen crowdsourcing platform [34] for ear image data annotation for further soft ear biometric derivation of all subjects in the database. The Platform provides high-quality data assurance techniques to acquire trustworthy annotations resulting in informative and reliable soft biometric data. Thereby, we designed a web-based form enabling detailed attribute descriptions based on the main zones of the outer ear, shown in Fig. 5, and other features to simplify and organize the user annotation’s view, as shown in Fig. 6. Then, a group of experienced and highly accurate contributors was invited to annotate a maximum of five ear images of different subjects after they passed quality pre-test questions. The annotation task involves selecting the most appropriate semantic label for each of the 33 soft ear traits (attributes) listed in Table 2. As a result, the required annotated dataset was collected from 2900 trusted respondents, where five judgments were collected for each training sample from random annotators and two judgments for each test sample. Table 3 summarizes the crowdsourced soft label data for this study.
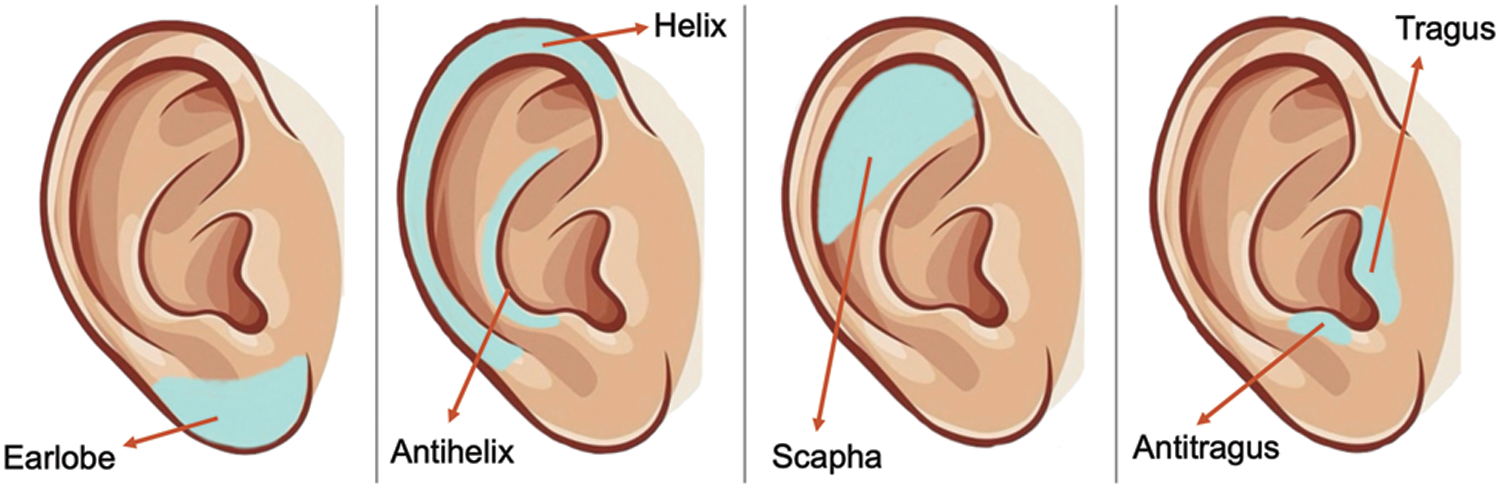
Figure 5: The main zones/parts of outer ear for soft attribute annotation
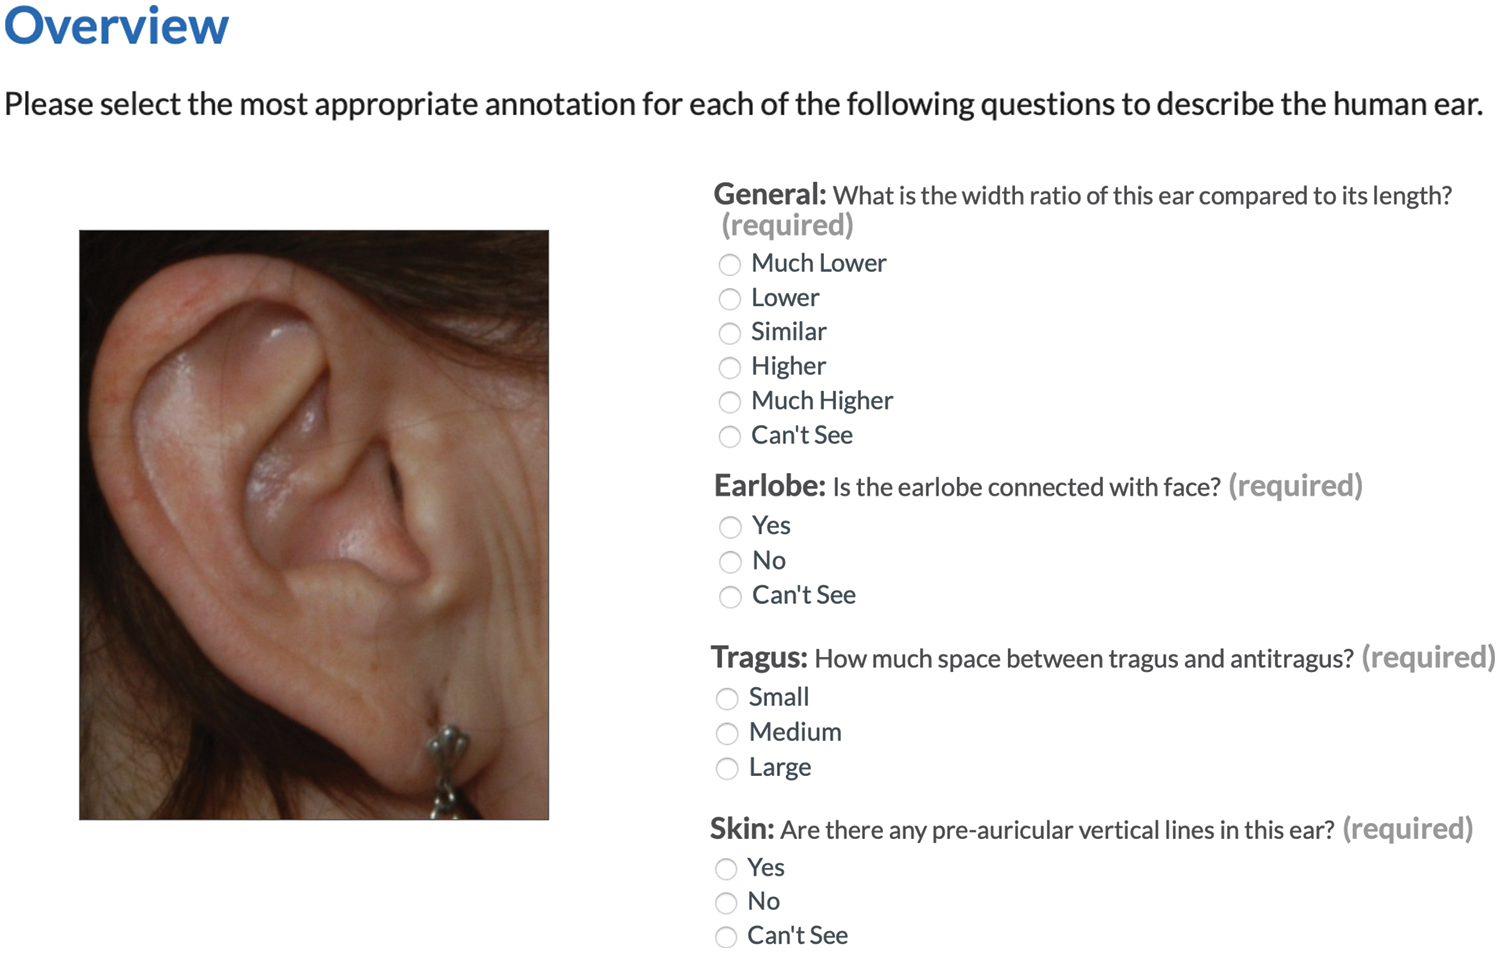
Figure 6: Designed annotation form for semantic labeling acquisition
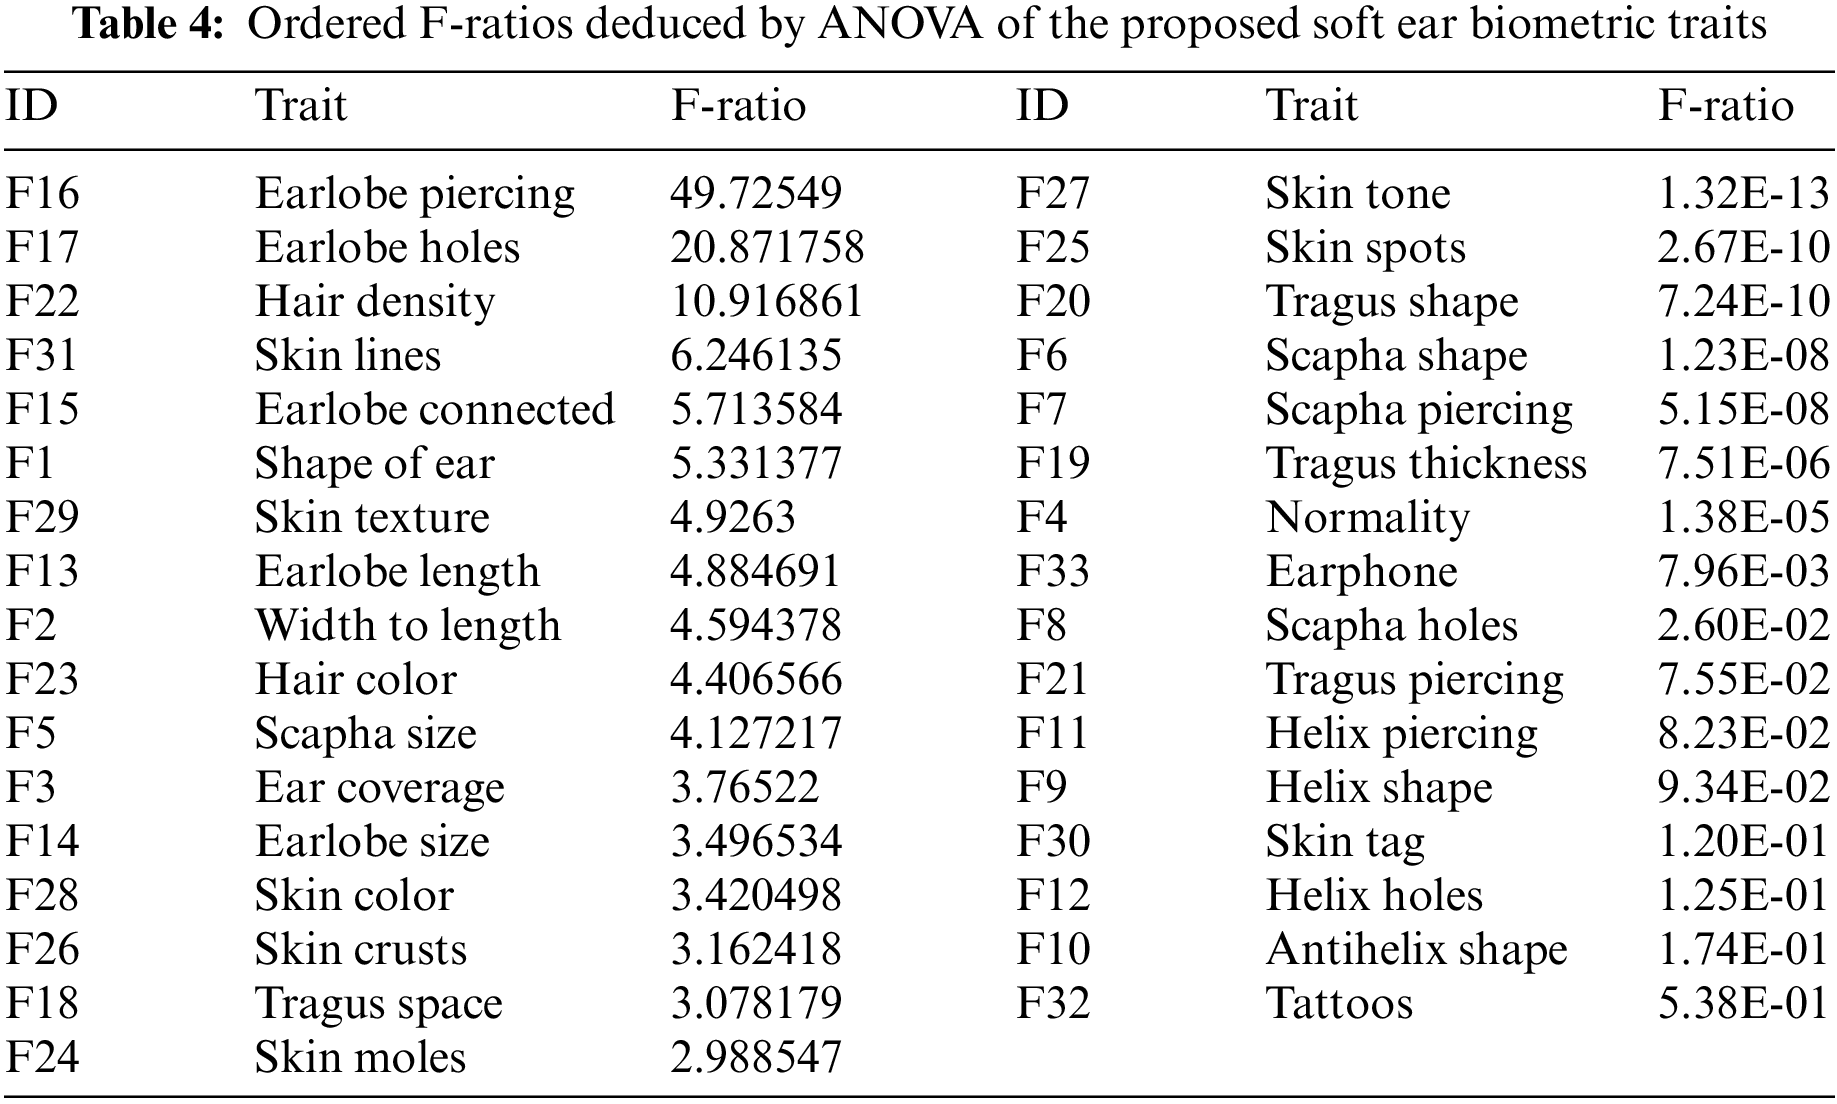
3.2.3 Significance Analysis of Soft Traits
Each proposed soft trait is aimed not only to describe the human ear meaningfully but also to provide discriminative information to better differentiate between subjects in the database. Therefore, one-way analysis of variance (ANOVA) is used as a statistical method for significance hypothesis tests to assess the acquired soft traits and determine which of them effectively influences recognition performance [35]. The best soft traits can be deduced and ordered by F-ratio as a significance score computed as follows:
where
3.3 Vision-Based Ear Biometric Traits
Since the original AMI images were captured in different head poses and contained the other head-side parts in the profile images, thus, we manually cropped all images to reduce the influence of these parts and focus only on the ear as the area of interest. This resulted in a new set of AMI datasets with the same number of images and subjects. After removing unwanted areas, produced images have different dimensions; as a result, all images were resized into the same resolutions of 64 × 64 pixels, where further reduction will lead to performance degradation. Lastly, the resulting cropped and resized color images were converted to grayscale normalization. These preprocessing steps, shown in Fig. 7, aim to extract the hard vision-based features of only the ear zone with fewer computational requirements.
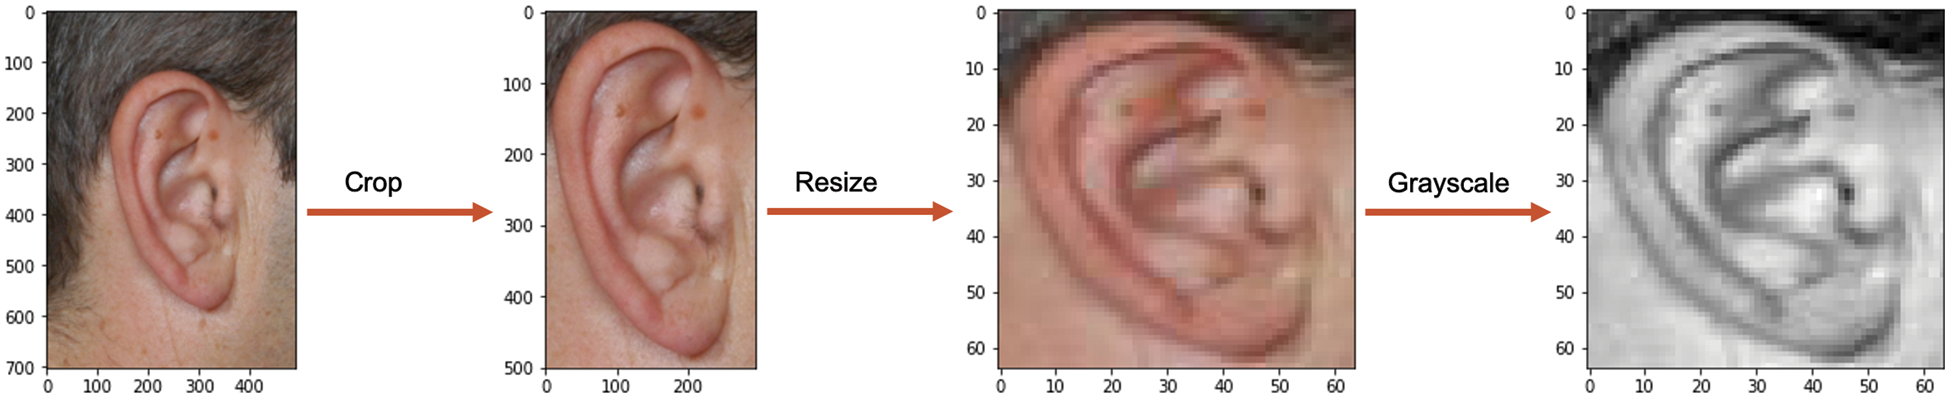
Figure 7: Preprocessing steps of AMI dataset
3.3.2 Extracting Vision-Based Hard Ear Features
In the literature, among a wide range of practical vision-based feature extractors for ear recognition purposes, LBP and PCA are well-established methods and have often been proven as powerful and highly discriminative features for a variety of pattern recognition applications. Accordingly, in this initial research study, as a proof of concept, LBP and PCA are used to extract hard ear feature vectors to be then fused and augmented by the newly proposed fine-grained soft ear biometrics with a view to analyzing, evaluating, and comparing capabilities and performance in isolation and in fusion.
• LBP Features
LBP operators are used here to describe each ear image’s texture and extract their features. The operator works on a grayscale image’s fixed-size (i.e., 3 × 3) local block. Next, it labels the center pixel for each local block by considering the correlation among its neighboring pixels [36]. The mathematical expression for computing the LBP descriptor is given by Eq. (2):
The gray level of the center pixel
• PCA Features
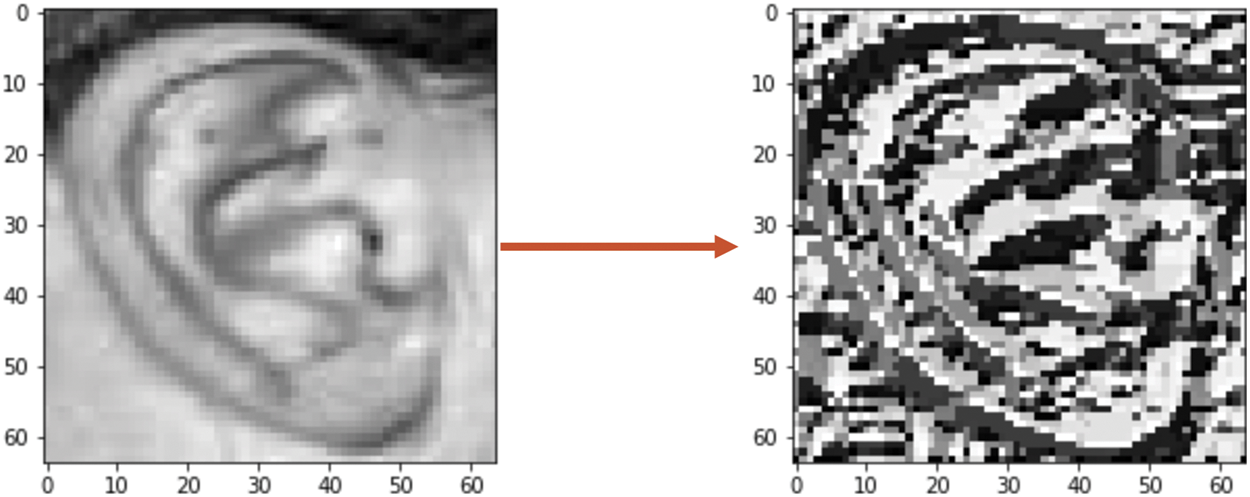
Figure 8: Normalized grayscale ear image (left), and its corresponding LBP image (right)
PCA is a widely used feature extraction method based on dimensionality reduction. It is a way to compact the input dataset and remove redundancy without losing the primary relevant information in computationally efficient and high-performing machine learning models. Each image in the dataset is represented in a lower dimension by projecting them into a common eigenspace (eigenvectors and eigenvalues). These eigenvectors are represented in interrelated variables by arranging them into linear combinations, ranked from most important to least with the greatest variation (principal components). The overall variation equals the sum of variances of all individual principal components [37]. Fig. 9, shows a 64 × 46 pixels image with 4096 (features/dimensions), where PCA projection is represented with different numbers of components, showing that even with only 10 principal components, ear details are identifiable.
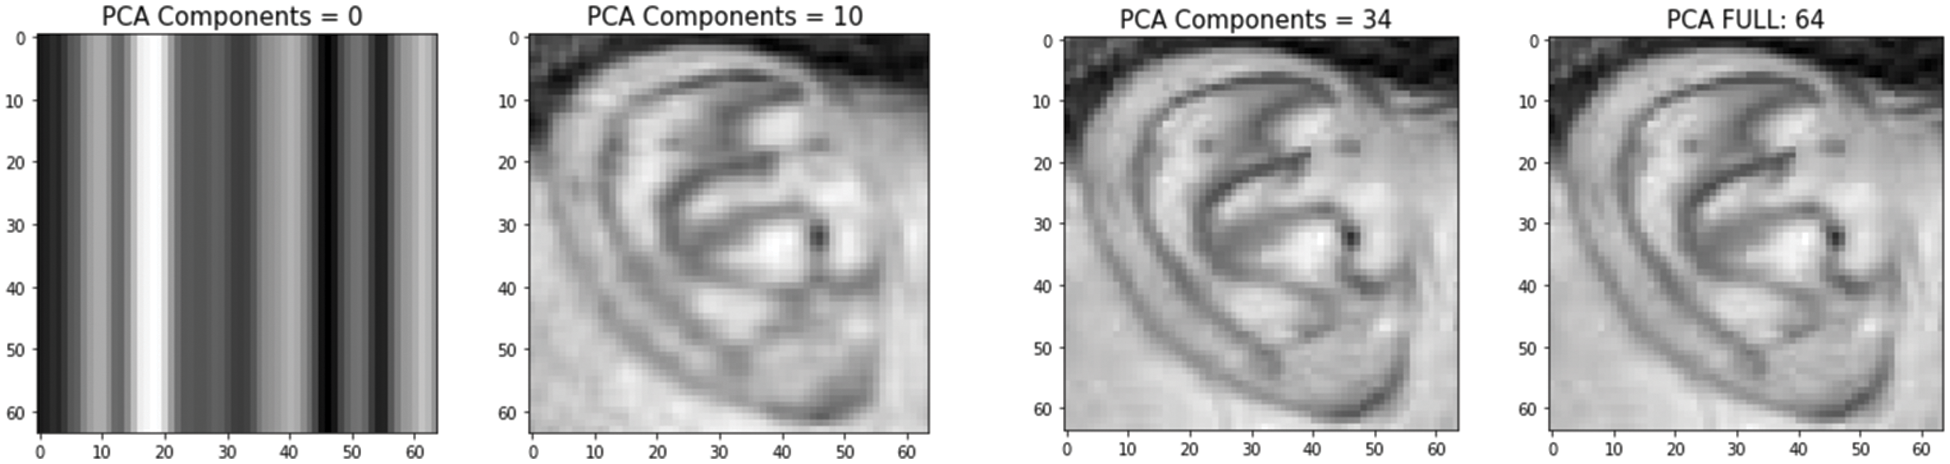
Figure 9: Sample ear image representation with different numbers of principal components
In the currently used AMI ear dataset, we can estimate the appropriate number of principal components by calculating the cumulative explained variance ratio function. We found that the first 20 components contain around 80% of the variance, while we need about 90 components to explain nearly all the variances.
3.3.3 Feature Vectors Normalization
Normalizations are may necessary in feature-level fusion, where the feature vectors extracted independently by LBP and PCA descriptors are incompatible in form, range, and distribution. As such, LBP produces a vector of 4096 features for each 64 × 64 ear image, whereas PCA composes a feature vector of 90 features for the same image. However, to overcome such variation problems, we use min-max normalization, which relatively rescales values of feature vectors to the range of (0–1) maintaining their relative magnitude within the feature vector. Suppose
Fusion of different features is an effective technique frequently utilized in biometrics systems and can be carried out at the feature level, score level, sensor level, or decision level [39]. Our proposed approach is based on the feature-level fusion technique, which concatenates hard and soft feature vectors of the same person to form a single fused feature vector of image information for person recognition. The primary advantage of feature-level fusion is that it occurs at the lowest level, allowing the analysis of the correlated feature values generated from different feature extractor algorithms to preserve the more discriminative and robust information of subject identity that improve recognition accuracy under various conditions [40]. Therefore, we can still exploit our proposed soft ear features to combine with traditional ones at this fusion level.
To investigate the validity and potency of the fusion of soft and hard ear biometrics, we use a KNN-based classifier to achieve the recognition task of the proposed framework. Moreover, a support vector machine (SVM) classifier was also used and compared with the KNN in performance results. Note that KNN is ideally suited for performance evaluation and comparison of identification and verification in the current research work context. The idea of KNN is based on assigning the test feature vector to the most frequent matching class from the k closest neighbors. This is done by comparing the distances between a test feature vector and the training vectors utilizing the Euclidean distance of the image histograms. In our experiments, k = 1 yielded the best results [41]. Suppose p and q are represented by feature vectors;
In this section, we thoroughly explain the evaluation metrics and analyze the experimental results to ascertain the soft ear features’ ability to improve the performance of the ear recognition system. All our experiments were conducted using Dual-Core Intel Core i5 CPU @ 2.3 GHz with an 8 GB RAM system. PYTHON was used to implement these feature extraction experiments.
Different benchmark quantitative evaluation metrics are used in this experimental work to assess the performance of augmented recognition by proposed soft ear traits and explore to what extent they can improve the standard (traditional) models in identification and verification tasks. For identification and verification performance evaluation, the confusion matrix is inferred over multiple thresholds between the genuine and importer distributions to determine per threshold the values of true positives (TP), false positives (FP), true negatives (TN), and false negatives (FN). Accordingly, further measurements can be calculated as follows:
• Accuracy: is the ratio of the total number correctly predicted samples.
• Precision: is the ratio of the correctly predicted samples to the total number of positive predictions.
• Receiver Operating Characteristic (ROC): is a verification measure (as one-to-one matching) based on the aggregate statistics of match scores corresponding to all biometric samples and can be expressed by the tradeoff between the false accept rate (FAR) and the false reject rate (FRR) [42] as follows:
• Equal Error Rate (EER): is the lowest error point on the ROC curve in which FAR equals FRR, where the lower value refers to better performance and can be defined as follows:
• Area Under Curve (AUC): is the area located under the ROC curve ranging between 0 and 1, where the greater AUC value indicates better performance.
• Cumulative Match Characteristic (CMC): is a measure that expresses the performance of biometric identification (as one-to-many matching) based on the relative ranking of match scores for each biometric sample to return a ranked list of enrolled candidates from the dataset.
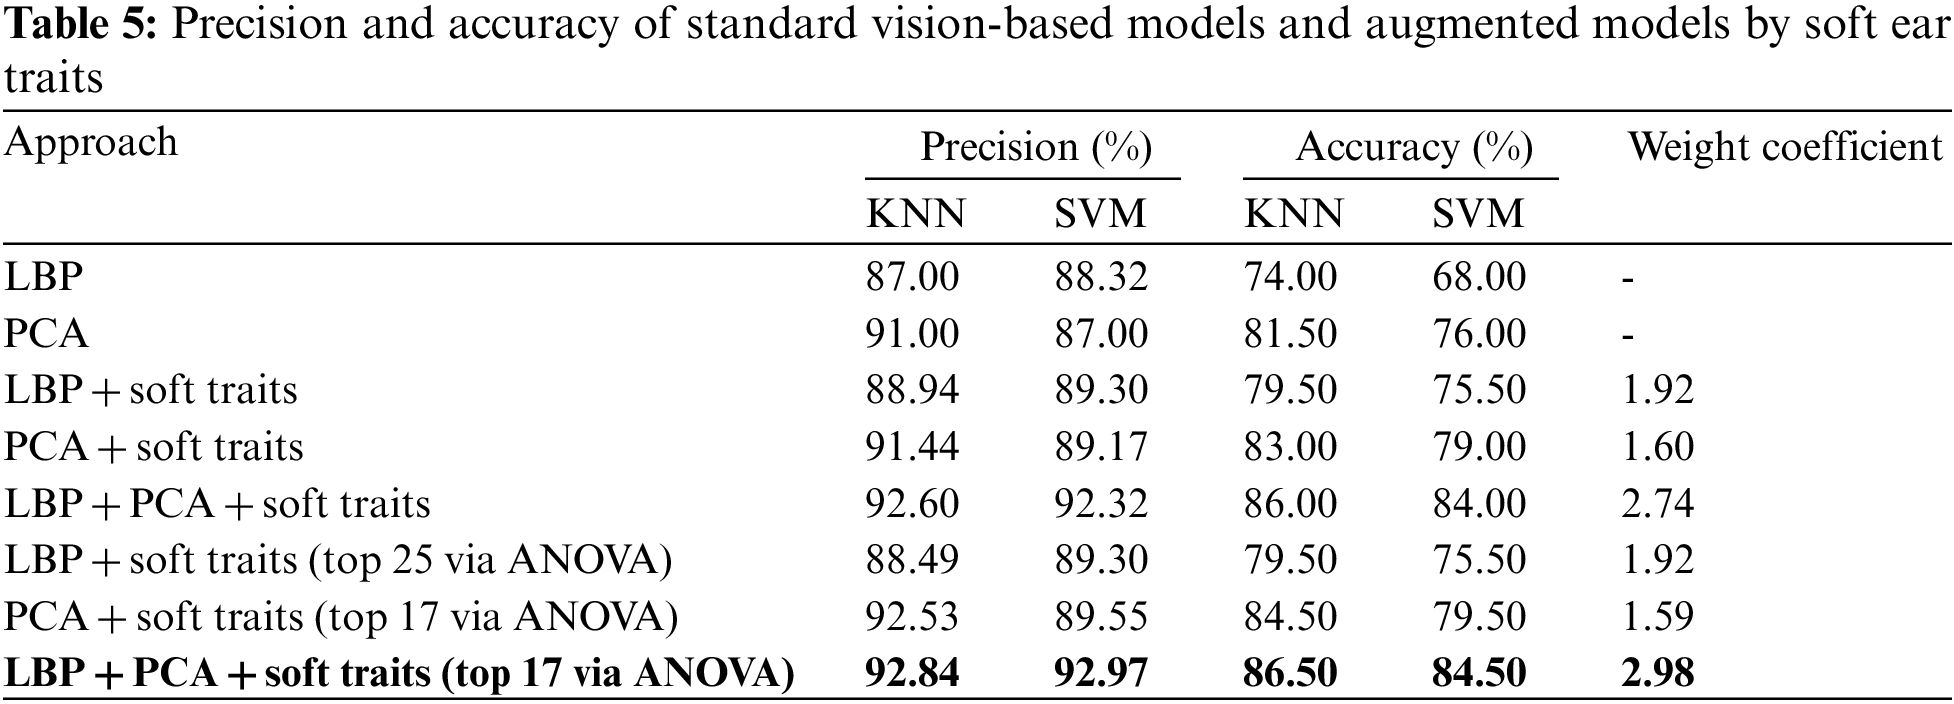
Our present work conducted all experiments on the AMI publicly available ear dataset [31], using the two feature extraction methods (PCA and LBP) with KNN and SVM classifiers. Initially, we tested the performance of the traditional LBP and PCA in isolation as a baseline, where the KNN achieved the highest accuracy results at about 74% and 81.50%, respectively. The accuracies obtained by the SVM classifier were 68% and 76% for LBP and PCA, respectively. Therefore, we relied on the KNN classifier to assess our experiments, while the SVM results were for comparison. Then, we contributed two scenarios of feature-level fusion to compare the fusion results with the primary outcome to reach the optimal pattern result of fusion.
A) First Fusion Scenario
We applied the augmented fusion based on the 33 soft ear feature vectors with each of the LBP and PCA feature vectors separately to validate the feasibility of the proposed soft ear traits in increasing discrimination and improving the recognition performance of standard descriptors alone. Since the number of extracted and used hard ear features per vector is much larger than soft ear features per vector, traditional biometrics may dominate the matching judgment and mitigate the valuable capabilities of the soft ear biometric information. Therefore, we empirically assigned effective weight coefficients for the soft traits. Note that the optimal coefficients of soft features achieving the best results were 1.92 and 1.6 when augmenting LBP and PCA, respectively. The obtained accuracy result was 79.50% and 83% for LBP and PCA, respectively, offering a remarkable improvement. Moreover, we investigated the fusion of all three capacities of LBP, PCA, and Soft biometric features and achieved more significant improvement with 86% accuracy.
B) Second Fusion Scenario
We repeated the experiments on the most influential characteristics based on feature significance deduced via ANOVA (illustrated in Section 3.2.3). Consequently, we found that the LBP features are best augmented by at least of the top effective 26 soft ear traits to maintain the highest result. At the same time, the PCA features are maximally augmented by only the top 17 soft ear traits to achieve the highest recognition result of 92.53% precision and 84.50% accuracy, increasing the standard PCA features precision and accuracy by 1.53% and 3%, respectively. Then we fused these 17 traits (as the most functional and discriminative traits) with both LBP and PCA features, and we attained the highest overall performance result of 86.50%. Accordingly, we supplemented the performance of the fused traditional LBP and PCA approaches and raised their accuracy by 12.5% and 5%, respectively.
These results show that the capabilities of the proposed soft ear biometrics can further be devoted to extended fusion and increased performance surpassing the performance of traditional traits in isolation. Table 5 provides all experimental results for different soft-based fusion vs. traditional features, presenting SVM results for comparison. Note that the SVM classifier also increased all recognition rates, where the accuracy of the LBP was 68% and 76% for PCA, then after fusing them with the soft ear features, the accuracy rose to 84.50%, confirming that fusion approaches can achieve promising ear recognition rates.
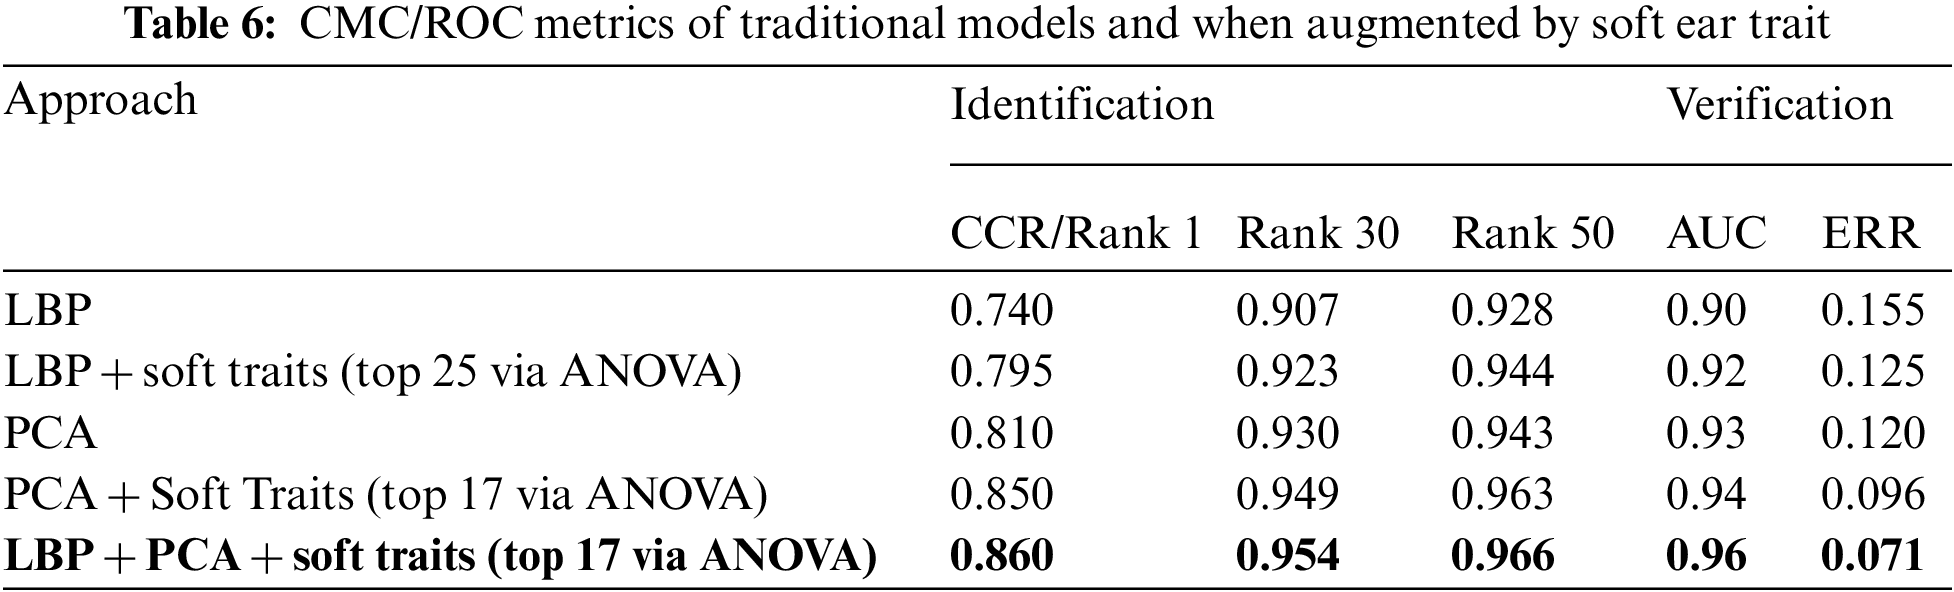
Therefore, upon closer inspection of Fig. 10, it becomes clear how soft ear biometrics show remarkable performance improvement in identification and verification based on ROC and CMC analyses, where LBP_PCA_Soft was superior, achieving 100% in Rank-110. For identification metrics, the CMC curve shows the Correct Classification Rate (CCR) as the top score (rank = 1) and the CMC average-sum scores of 30 and 50. While for verification metrics inferred by the ROC curve implied by FRR against FAR for various threshold values (expressed by AUC and ERR), Table 6 accordingly presents the corresponding identification/verification performance metric.
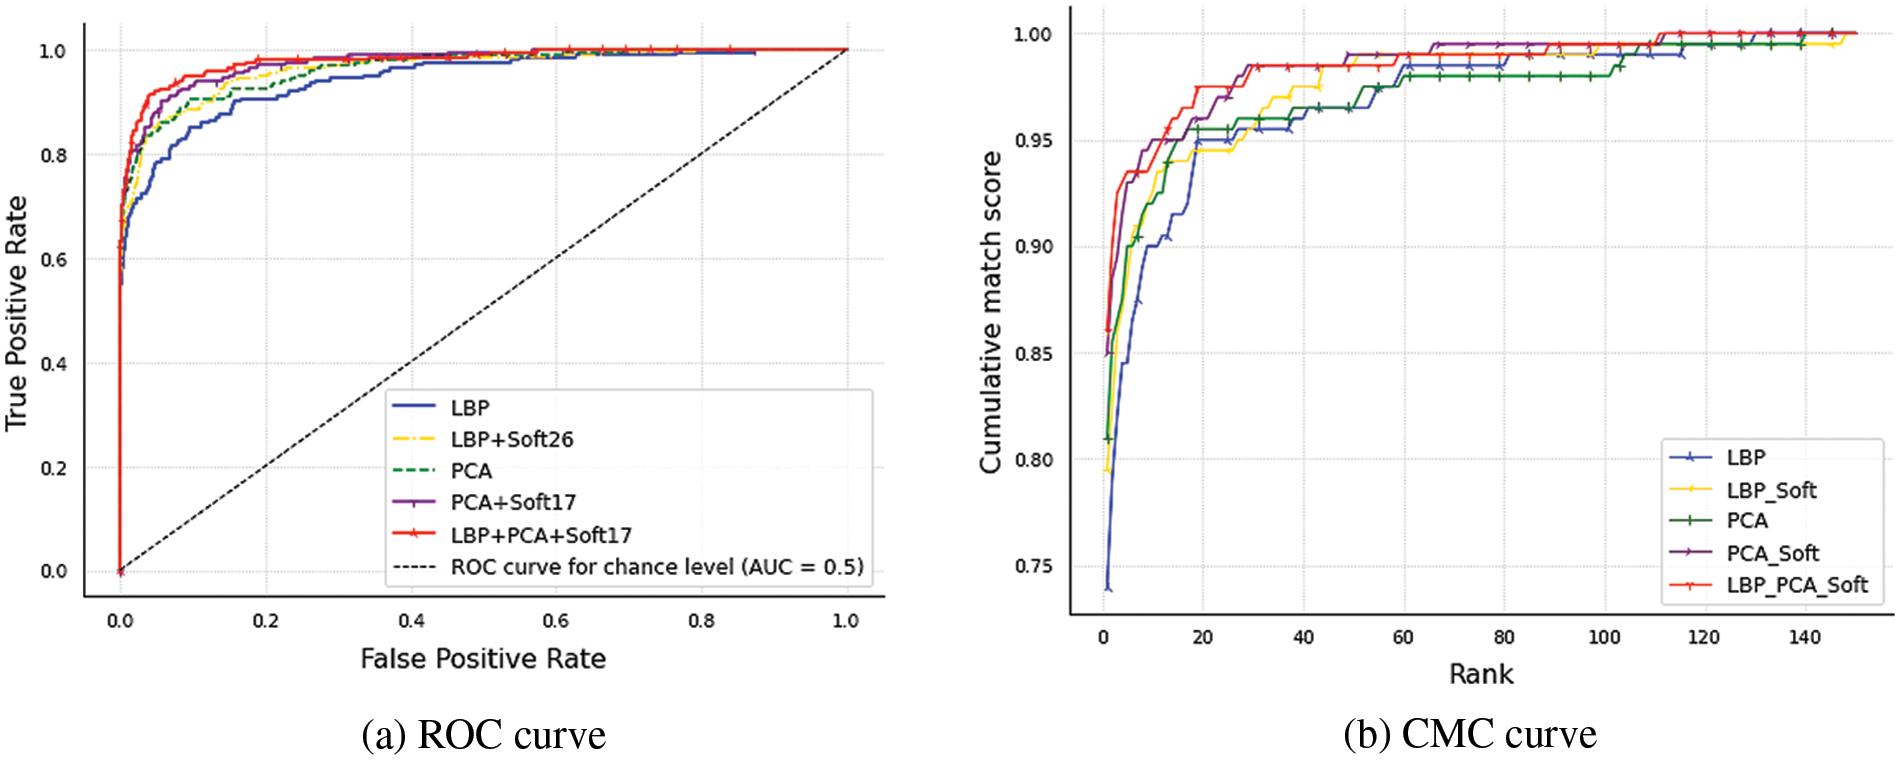
Figure 10: Performance evaluation and comparison of soft ear biometric identification and verification
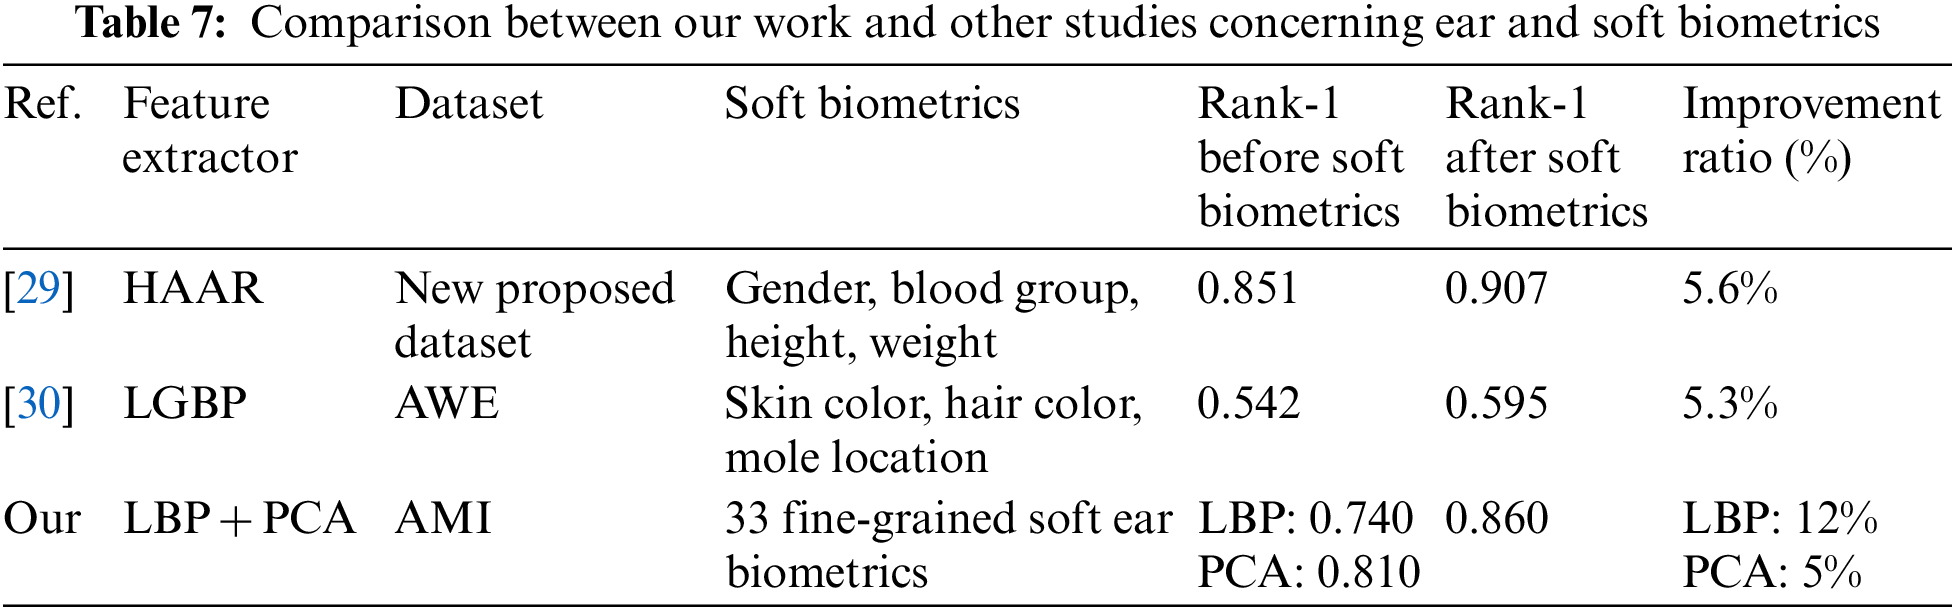
On the other hand, to prove the efficiency of augmented traditional ear recognition systems with the proposed soft biometrics, Table 7 presents and compares the identification accuracy (rank 1) of our fine-grained soft ear biometrics with two similar works from the literature (Section 2.3), where they used soft biometrics on improving the ear recognition rate. Note that several possible comparison aspects are not applicable here due to the differences in the experimental scenarios, databases, augmented hard traits, and the soft features used, as no study until now used such fine-grained soft ear features.
This paper proposes a group of fine-grained soft ear biometric traits describing different parts of the outer human ear. Then it investigates their feasibility in fusion for supplementing traditional (hard) ear biometric traits. All experiments were conducted on the AMI dataset, comprising 100 subjects with a total of 700 ear images. Human annotations were used to extract soft ear traits using the Appen crowdsourcing platform, while the LBP and PCA descriptors were used to extract the hard ear features. ANOVA was used to explore the most significant and influential soft ear traits in increasing the accuracy of the traditional ear features and improving the identification and verification performance. The traditional ear recognition approaches were used as a baseline for testing and comparisons, resulting in 74% and 81.50% accuracy for the LBP and PCA, respectively, using KNN. The augmented versions by soft biometrics increased these accuracies to 79.50% and 83% using feature-level fusion. Furthermore, we obtained 86.50% as the highest accuracy when fusing LBP and PCA with the top-17 soft features based on the ANOVA ordering. Different weight coefficients were assigned to the soft ear traits when combined with traditional features for more effective fusion and accurate recognition. We noted that the extent to which soft features aid traditional features varies depending on the dataset and the coefficients assigned to soft traits. Despite that, the performance results were raised by up to 12.5% for KNN, and the SVM also increased the accuracy of the traditional results to 16.5%. Therefore, our proposed model demonstrated that the fusion of soft and hard ear features outperforms by all means the hard features in isolation. Thus, we proved that the proposed soft ear biometric traits could be supplemental for the (hard) ear biometric information and help bridge the semantic gap between humans and machines to improve performance in the ear recognition domain. This study’s main limitation is the dependence on extracting soft ear biometric features by human-based annotation, which is desired to be replaced with reliable computer vision-based annotation emulating human capabilities as possible. Whereas to the best of our knowledge, this is the first study that extensively exploits the capabilities of fine-grained soft ear biometrics, and we are here most focused on the feasibility of these traits. Therefore, proceeding from this initial research as future work, developing algorithms that exploit the most influential proposed soft ear biometrics to be automatically annotated and used for human recognition with more challenging datasets can pave the way for new ear biometric applications. In addition, this study may establish other research tracks to be undertaken by researchers as multimodal recognition based on the ear and side of the human body, further enhancing the human recognition systems.
Acknowledgement: The authors would like to thank King Abdulaziz University Scientific Endowment for funding the research reported in this paper.
Funding Statement: This research was supported and funded by KAU Scientific Endowment, King Abdulaziz University, Jeddah, Saudi Arabia.
Conflicts of Interest: The authors declare that they have no conflicts of interest to report regarding the present study.
References
1. S. Dargan and M. Kumar, “A comprehensive survey on the biometric recognition systems based on physiological and behavioral modalities,” Expert Systems with Applications, vol. 143, pp. 1–27, 2020. [Google Scholar]
2. A. K. Jain, R. Bolle and S. Pankanti, Biometrics: Personal Identification in Networked Society. New York, NY: Springer Science & Business Media, 1999. [Online]. Available: https://doi.org/10.1007/b117227 [Google Scholar] [CrossRef]
3. A. Bertillon, La Photographie Judiciaire, Avec Un Appendice Sur La Classification Et L’Identification Anthropometriques. Paris: Gauthier-Villars, 1890. [Online]. Available: https://hdl.handle.net/21.15107/rcub_jakov_934 [Google Scholar]
4. A. Kamboj, R. Rani and A. Nigam, “A comprehensive survey and deep learning-based approach for human recognition using ear biometric,” The Visual Computer, vol. 38, no. 7, pp. 2383–2416, 2022. [Google Scholar] [PubMed]
5. H. Zhang and Z. Mu, “Ear recognition method based on fusion features of global and local features,” in Proc. 2008 Int. Conf. on Wavelet Analysis and Pattern Recognition, Hong Kong, China, pp. 347–351, 2008. [Google Scholar]
6. R. Purkait and P. Singh, “Anthropometry of the normal human auricle: A study of adult Indian men,” Aesthetic Plastic Surgery, vol. 31, pp. 372–379, 2007. [Google Scholar] [PubMed]
7. C. Sforza, G. Grandi, M. Binelli, D. G. Tommasi, R. Rosati et al., “Age-and sex-related changes in the normal human ear,” Forensic Science International, vol. 187, no. 1–3, pp. 110-e1, 2009. [Google Scholar] [PubMed]
8. M. Burge and W. Burger, “Ear biometrics,” Biometrics: Personal Identification in Networked Society. Boston, MA: Springer, pp. 273–285, 1996. [Online]. Available: https://doi.org/10.1007/0-306-47044-6_13 [Google Scholar] [CrossRef]
9. Ž. Emeršič, V. Štruc and P. Peer, “Ear recognition: More than a survey,” Neurocomputing, vol. 255, pp. 26–39, 2017. [Google Scholar]
10. H. Alshazly, C. Linse, E. Barth, S. A. Idris and T. Martinetz, “Towards explainable ear recognition systems using deep residual networks,” IEEE Access, vol. 9, pp. 122254–122273, 2021. [Google Scholar]
11. M. Hassaballah, H. A. Alshazly and A. A. Ali, “Ear recognition using local binary patterns: A comparative experimental study,” Expert Systems with Applications, vol. 118, pp. 182–200, 2019. [Google Scholar]
12. J. Nourmohammadi-Khiarak and A. Pacut, “An ear anti-spoofing database with various attacks,” in Proc. IEEE: 2018 Int. Carnahan Conf. on Security Technology (ICCST), Montreal, QC, Canada, pp. 1–5, 2018. [Google Scholar]
13. A. K. Jain, S. C. Dass and K. Nandakumar, “Can soft biometric traits assist user recognition?” in Biometric Technology for Human Identification, Orlando, Florida, United States, Spie, vol. 5404, pp. 561–572, 2004. [Google Scholar]
14. S. Ezichi, I. J. F. Ezika and O. N. Iloanusi, “A comparative study of soft biometric traits and fusion systems for face-based person recognition,” Internat J Image Graph Signal Process (IJIGSP), vol. 13, no. 6, pp. 45–53, 2021. [Google Scholar]
15. R. S. Kuzu, E. Maiorana and P. Campisi, “Gender-specific characteristics for hand-vein biometric recognition: Analysis and exploitation,” IEEE Access, vol. 11, pp. 11700–11710, 2023. [Google Scholar]
16. F. Becerra-Riera, A. Morales-González and H. Méndez-Vázquez, “A survey on facial soft biometrics for video surveillance and forensic applications,” Artificial Intelligence Review, vol. 52, no. 2, pp. 1155–1187, 2019. [Google Scholar]
17. R. S. Howyan and E. S. Jaha, “Semantic human face analysis for multi-level age estimation,” Intelligent Automation and Soft Computing, vol. 31, no. 1, pp. 555–580, 2022. [Google Scholar]
18. H. Alshazly, C. Linse and T. Martinetz, “Ensembles of deep learning models and transfer learning for ear recognition,” Sensors, vol. 19, no. 19, pp. 4139, 2019. [Google Scholar] [PubMed]
19. M. Sharkas, “Ear recognition with ensemble classifiers; A deep learning approach,” Multimedia Tools and Applications, vol. 81, pp. 1–27, 2022. [Google Scholar]
20. F. I. Eyiokur, D. Yaman and H. K. Ekenel, “Domain adaptation for ear recognition using deep convolutional neural networks,” IET Biometrics, vol. 7, no. 3, pp. 199–206, 2018. [Google Scholar]
21. Y. Zhang, Z. Mu, L. Yuan and C. Yu, “Ear verification under uncontrolled conditions with convolutional neural networks,” IET Biometrics, vol. 7, no. 3, pp. 185–198, 2018. [Google Scholar]
22. H. Alshazly, C. Linse, E. Barth and T. Martinetz, “Deep convolutional neural networks for unconstrained ear recognition,” IEEE Access, vol. 8, pp. 170295–170310, 2020. [Google Scholar]
23. M. Hassaballah, H. A. Alshazly and A. A. Ali, “Robust local oriented patterns for ear recognition,” Multimedia Tools and Applications, vol. 79, pp. 31183–31204, 2020. [Google Scholar]
24. E. E. Hansley, M. P. Segundo and S. Sarkar, “Employing fusion of learned and handcrafted features for unconstrained ear recognition,” IET Biometrics, vol. 7, no. 3, pp. 215–223, 2018. [Google Scholar]
25. S. Sajadi and A. Fathi, “Genetic algorithm based local and global spectral features extraction for ear recognition,” Expert Systems with Applications, vol. 159, pp. 113639, 2020. [Google Scholar]
26. I. Omara, X. Li, G. Xiao, K. Adil and W. Zuo, “Discriminative local feature fusion for ear recognition problem,” in Proc. ICBBB: 2018 8th Int. Conf. on Bioscience, Biochemistry and Bioinformatics, Tokyo, Japan, 2018. [Google Scholar]
27. S. M. Jiddah and K. Yurtkan, “Fusion of geometric and texture features for ear recognition,” in Proc. 2018 IEEE 2nd Int. Symp. on Multidisciplinary Studies and Innovative Technologies (ISMSIT), Ankara, Turky, pp. 1–5, 2018. [Google Scholar]
28. P. P. Sarangi, B. S. P. Mishra and S. Dehuri, “Fusion of PHOG and LDP local descriptors for kernel-based ear biometric recognition,” Multimedia Tools and Applications, vol. 78, pp. 9595–9623, 2019. [Google Scholar]
29. S. Tiwari, A. Singh and S. K. Singh, “Fusion of ear and soft-biometrics for recognition of newborn,” Signal and Image Processing: An International Journal, vol. 3, no. 3, pp. 103–116, 2012. [Google Scholar]
30. U. Saeed and M. M. Khan, “Combining ear-based traditional and soft biometrics for unconstrained ear recognition,” Journal of Electronic Imaging, vol. 27, no. 5, pp. 051220, 2018. [Google Scholar]
31. E. Gonzalez, L. Alvarez and L. Mazorra, “Ami Ear Database,” 2008. Available: http://ctim.ulpgc.es/research_works/ami_ear_database/ [Google Scholar]
32. B. Hassan, E. Izquierdo and T. Piatrik, “Soft biometrics: A survey,” Multimedia Tools and Applications, pp. 1–44, 2021. https://doi.org/10.1007/s11042-021-10622-8 [Google Scholar] [CrossRef]
33. I. Batyrshin, F. Monroy-Tenorio, A. Gelbukh, L. A. Villa-Vargas, V. Solovyev et al., “Bipolar rating scales: A survey and novel correlation measures based on nonlinear bipolar scoring functions,” Acta Polytechnica Hungarica, vol. 14, no. 3, pp. 33–57, 2017. [Google Scholar]
34. Appen, 2023. [Online]. Available: https://appen.com [Google Scholar]
35. J. Kaufmann and A. G. Schering, “Analysis of Variance ANOVA,” Hoboken, NJ, USA: Wiley StatsRef: Statistics Reference Online, 2014. [Online]. Available: https://doi.org/10.1002/9781118445112.stat06938 [Google Scholar] [CrossRef]
36. N. J. Sairamya, L. Susmitha, S. T. George and M. S. P. Subathra, “Hybrid approach for classification of electroencephalographic signals using time–frequency images with wavelets and texture features,” in Intelligent Data Analysis for Biomedical Applications. Cambridge, MA, USA: Academic Press, pp. 253–273, 2019. [Online]. Available: https://doi.org/10.1016/B978-0-12-815553-0.00013-6 [Google Scholar] [CrossRef]
37. S. Barde, A. S. Zadgaonkar and G. R. Sinha, “PCA based multimodal biometrics using ear and face modalities,” International Journal of Information Technology and Computer Science, vol. 6, no. 5, pp. 43–49, 2014. [Google Scholar]
38. M. F. Nadheen and S. Poornima, “Feature level fusion in multimodal biometric authentication system,” International Journal of Computer Applications, vol. 69, no. 18, pp. 36–40, 2013. [Google Scholar]
39. A. Ross and A. K. Jain, “Fusion techniques in multibiometric systems,” in Face Biometrics for Personal Identification. Berlin, Heidelberg: Springer, pp. 185–212, 2007. [Online]. Available: https://doi.org/10.1007/978-3-540-49346-4_12 [Google Scholar] [CrossRef]
40. R. A. Rasool, “Feature-level vs. score-level fusion in the human identification system,” Applied Computational Intelligence and Soft Computing, vol. 2021, pp. 1–10, 2021. [Google Scholar]
41. D. Dhriti and M. Kaur, “K-nearest neighbor classification approach for face and fingerprint at feature level fusion,” International Journal of Computer Applications, vol. 60, no. 14, pp. 13–17, 2012. [Google Scholar]
42. B. DeCann and A. Ross, “Relating roc and cmc curves via the biometric menagerie,” in Proc. 2013 IEEE Sixth Int. Conf. on Biometrics: Theory, Applications and Systems (BTAS), Arlington, VA, USA, pp. 1–8, 2013. [Google Scholar]
Cite This Article
 Copyright © 2023 The Author(s). Published by Tech Science Press.
This work is licensed under a Creative Commons Attribution 4.0 International License , which permits unrestricted use, distribution, and reproduction in any medium, provided the original work is properly cited.
 Downloads
 Citation Tools