
 Submit a Paper
 Propose a Special lssue
 Open Access
ARTICLE
An Optimized Feature Selection and Hyperparameter Tuning Framework for Automated Heart Disease Diagnosis
Applied College, Computer Science, and Information Department, Taibah University, Medinah, 41461, Saudi Arabia
* Corresponding Author: Saleh Ateeq Almutairi. Email:
Computer Systems Science and Engineering 2023, 47(2), 2599-2624. https://doi.org/10.32604/csse.2023.041609
Received 29 April 2023; Accepted 12 June 2023; Issue published 28 July 2023
 View Full Text
 Download PDF
Abstract
Heart disease is a primary cause of death worldwide and is notoriously difficult to cure without a proper diagnosis. Hence, machine learning (ML) can reduce and better understand symptoms associated with heart disease. This study aims to develop a framework for the automatic and accurate classification of heart disease utilizing machine learning algorithms, grid search (GS), and the Aquila optimization algorithm. In the proposed approach, feature selection is used to identify characteristics of heart disease by using a method for dimensionality reduction. First, feature selection is accomplished with the help of the Aquila algorithm. Then, the optimal combination of the hyperparameters is selected using grid search. The experiments were conducted with three datasets from Kaggle: The Heart Failure Prediction Dataset, Heart Disease Binary Classification, and Heart Disease Dataset. Two classes can be distinguished: diseased and healthy (i.e., uninfected). The Histogram Gradient Boosting (HGB) classifier produced the highest Weighted Sum Metric (WSM) scores of 98.65% concerning the Heart Failure Prediction Dataset. In contrast, the Decision Tree (DT) machine learning classifier had the highest WSM scores of 87.64% concerning the Heart Disease Health Indicators Dataset. Measures of accuracy, specificity, sensitivity, and other metrics are used to evaluate the proposed approach. The presented method demonstrates superior performance compared to different state-of-the-art algorithms.Keywords
The heart is the vital organ that regulates blood circulation and supplements oxygen and nutrients throughout the body. A person’s life can be lost if the heart does not function properly due to heart disease or cardiologist disease [1]. Diseases of the heart and blood vessels, known as cardiovascular diseases (CVDs), now account for more deaths annually than cancer. The World Health Organization (WHO) stated that 32% of worldwide deaths are due to CVDs [2]. It was observed that more than two million people lost their lives over the last two decades due to heart disease [3]. The death rate is anticipated to rise in the coming years and may reach more than 23.6 M people by 2030 [4]. The leading causes of death in CVDs are heart attacks and strokes. Today, heart attack and stroke represent 85% of mortality rates in low- and medium-income nations. Besides, someone has a stroke every 40 s in the USA and dies every 3.5 min [5]. The middle east and North Africa regions have a higher percentage, accounting for 39.2% of deaths [6].
In the medical field, heart failure prediction is a complex task that involves disparate features, types, causes, and symptoms of heart disease that complicate diagnosis. There are no symptoms in the early stages of CAD, and predicting cardiac patients is one of the most fundamental and difficult health problems worldwide. The high molarity rate of these life-threatening diseases can be controlled via rapid and accurate detection of abnormalities in heart conditions, thus providing proactive care. Therefore, CVDs prevention and accurate early prediction enable the management of counseling and medications, consequently saving many lives. However, CVD identification is a complex task requiring conducting laboratory tests, equipment, wearable sensor data, and Physicians’ experience [7], which are insufficient. Besides, the medical staff diagnoses a huge amount of data, which is sometimes difficult to analyze [8]. Therefore, patients should access appropriate technology and medication to support continuous observations for managing heart attacks.
Artificial intelligence (AI) is a promising tool for building decision-making systems that use computers to learn and discover hidden insights without manual programming. Artificial intelligence is becoming increasingly popular in the healthcare industry because of its importance in diagnosing serious diseases, including heart disease, diabetes, and cancer. It can improve precision medicine at every stage of a patient’s journey through the clinical pathway, from diagnosis, treatment, guidance, and surveillance, with further research and development. For example, using various data modalities as input, new artificial intelligence-based diagnostic algorithms improve heart disease detection rates with more generated data than expert cardiologists [9]. Mathematical models are used in artificial intelligence, known as machine learning (ML), to help computers learn new things independently. In machine learning, algorithms are employed to analyze data for patterns. These regularities are then used to create a data model for foreseeing potential outcomes. As a result, machine learning can provide intelligent decisions for predicting the occurrence, progression, treatments, and determinants of individual chronic diseases in various contexts and based on multiple data [10]. Because of its potential to increase accuracy, efficiency, and early identification of cardiovascular problems, automated heart disease diagnosis using ML has received substantial interest in recent years. Machine learning algorithms can examine vast information, discover patterns, and construct prediction models to help diagnose cardiac disease.
However, several difficulties with automating the detection of cardiac disease must be carefully resolved. One of the key issues is the identification and interpretation of relevant features. The accuracy of the predictions made by machine learning models depends on the input attributes. Effective diagnosis depends on selecting the most relevant features from a wide range of possible ones, such as age, blood pressure, cholesterol levels, and medical history. Further, the quality and availability of data provide another difficulty. ML algorithms need large, diversified, and well-annotated datasets to discover patterns and generate precise predictions. However, gathering high-quality data that includes complete clinical information might be difficult. Missing values, consistency issues, and biases in data gathering can affect the accuracy and dependability of machine learning models. Another crucial factor is ensuring the robustness and generalizability of the generated models. Machine learning algorithms trained on a particular dataset may have trouble coping with new populations different from the training set. To ensure the models work in actual clinical settings, it is essential to test and verify them on various populations. Ethical issues and model interpretability are additional problems. The ML algorithms frequently operate as black boxes, making it impossible to understand the logic behind their predictions fully. To establish confidence and assure responsibility in crucial healthcare applications (e.g., the detection of heart disease), accessible and understandable models are essential. Understanding how ML models generate decisions might help healthcare professionals and patients make more informed decisions, potentially improving patient outcomes. Despite these difficulties, automated heart disease detection utilizing ML algorithms has huge potential advantages. Making timely and precise predictions can help healthcare practitioners by facilitating early identification, risk stratification, and individualized treatment strategies. Additionally, decreasing delays in the detection and treatment of cardiac disease can potentially optimize healthcare resource allocation and enhance patient outcomes.
Doctors can provide on-time patient treatment by using this vast amount of data to gain and extract critical information optimally and valuable insights [11]. However, feature extraction for cardiovascular disease prediction is challenging. Therefore, many heart disease diagnosis systems employ feature selection strategies for selecting the most important features from a large set of candidates. Feature selection aims to solve problems such as overfitting and high computational cost and improve classification accuracy. These selected features are then fed into classification methods in the second stage [12]. The primary motivations of this study are as follows: (1) Diagnosing CVD is critical in clinical practice. Unfortunately, it is a highly complicated task requiring many tests that take time, effort, and money. (2) The huge number of heart disease features tremendously affects classification accuracy and system processing complexity. (3) Reduce the burden of CVDs detection via an AI-based automated heart diagnosis framework that provides accurate prediction with minimal time and effort. (4) Introducing a reliable health system requires significant investment to manage CVDs effectively.
The following are some key contributions from the present study:
• Using machine learning algorithms, grid search (GS), and an Aquila optimizer (AO) to automatically and accurately classify heart disease based on numerical records. The AO algorithm offers several benefits across various areas, including early convergence and achieving optimized fitness values compared to alternative algorithms. Additionally, it demonstrates competitive and promising outcomes.
• In comparison to natural-inspired algorithms, Aquila outperformed. A binary version of AO is deployed to determine the optimal attribute set for better classification accuracy.
• Grid search is used to choose the best combinations of hyperparameters. The framework is adaptable; hyperparameters are not assigned manually.
• The new methodology exceeds most related studies regarding the accuracy and other measures.
The rest of the paper is organized as follows: The Related work is reviewed in Section 2. Then, Section 3 describes the proposed heart disease framework and algorithms. Then, the experiments are presented in Section 4, and the results are analyzed. Finally, in Section 5, the paper is concluded.
Long et al. [12] studied the problem of a high-dimensional dataset, uncertainty, and high computational cost of heart disease diagnostic systems. As a result, a two-stage diagnosis system was proposed using a hybrid learning process for feature selection (FS) and classification. At the FS level, data is normalized before the chaos firefly technique is used for parameter adjustment via attribute reduction based on rough sets (CFARS-AR). Then, type-2 fuzzy logic operates using the remaining attributes as inputs. Using the heart disease dataset (13 attributes) and SPECTF dataset (44 attributes), the CFARS-AR attained an accuracy of 88.3%, a Sensitivity of 94.2%, and a Specificity of 93.3%. However, the proposed system needs further improvement to manage many attributes. An automated system for diagnosing heart disease was developed by Shah et al. [1], which would take a patient’s test results, lifestyle choices, and other data as input. In addition, the use of probabilistic principal component analysis for feature extraction was carried out. Finally, the Support Vector Machine (SVM) classifier was used to classify and diagnose cardiac disease. For the Cleveland, Hungarian, and Swiss datasets, the suggested method had accuracies of 82.18%, 85.82%, and 91.30%, respectively.
An ensemble learning platform for heart disease classification using MATLAB environment and WEKA was introduced [13]. Different machine learning algorithms and classifications were performed using ten-fold cross-validation. The Hungarian heart disease dataset used contains 294 samples (14 attributes). The J48 and Subspace Discriminant methods outperformed other methods with classification accuracy at 67.7%. However, the classification results are not high. Using the Rapid Miner tool, Bashir et al. [14] provided a method for selecting features. In the first stage, pre-processing was performed for data cleaning, transformation, and reduction. Feature selection and classification are then performed using different algorithms. The approach achieved an accuracy of 84.85% using Logistic Regression SVM as a feature selection technique. However, the proposed system needs training on a larger dataset for better results.
Alotaibi [7] investigated improving heart failure prediction accuracy using the UCI heart disease dataset. After performing data pre-processing to clean the data, five different models were used to predict heart disease. The Five-fold cross-validation method was applied to enhance precision and reduce the duplicate entries’ likelihood. As a result, there was a 93.19% improvement in accuracy using the Decision Tree method. However, the main limitation of this study is using a small dataset size. A DCNN model for heart disease prediction was introduced [14] using a Talos optimizer. The proposed model involves DATA Acquisition and cleaning, Feature extraction, and classification using various learning algorithms, training, testing, and model deployment. The best classification accuracy was achieved via hyperparameter optimization using Talos with an accuracy of 90.78%.
Yazdani et al. [4] developed a model to aid in predicting cardiovascular disease using weighted associative rule mining (WARM). Five steps comprise the model: cleansing the data, narrowing down the features to use, calculating the weights for those features, implementing WARM, and finally, assessing the model’s performance. Selecting significant features and their relationships used seven classification models. Experiments on the UCI dataset indicated a 98% confidence score in diagnosing cardiac disease. The major drawback was in the feature selection phase, which employed only a few machine learning methods. Sharma et al. [15] investigated and assessed various cardiac prognostic approaches and machine-learning classification techniques. Classifications of severity were made using eight strategies and the Cleveland dataset (14 features). The accuracy of the Hybrid Random Forest with a Linear Model method was reported in the testing to be 88.7%.
Different machine learning algorithms for heart disease prediction were deployed in [8,16]. The steps for the prediction process are as follows: first, data Extraction from two different datasets was used. Then, data pre-processing via normalization. Finally, training and testing of different classifiers. The experiments showed that the SVM, Logistic Regression (LR), and Artificial Neural Network (ANN) achieved the same accuracy of 93%. Authors in [17] analyzed how well machine-learning techniques can identify heart disease classifications. Three models were implemented: Random Forest (RF), LR, and SVM algorithms using eleven features from five heart disease datasets. A Grid Search with 10-fold repeated cross-validation was carried out for hyperparameter optimization. The RF model outperformed other models with an accuracy of 92.9%. Using a variety of machine-learning methods, Chang et al. [11] developed machine-learning-based software to forecast heart disease. The main phases were data collection, performing logistic regression, and evaluating the dataset’s attributes. As a result, RF and K-neighbor classifiers achieved 87% and 83% accuracy using a dataset comprising 14 characteristics for 100 persons.
Zhuang et al. [18] developed a machine learning framework using regularized regression and random survival forest (RSF) method. Four distinct models were used to select features and build the models. Thirty-eight different variables were picked from the ARIC dataset. The model performance was evaluated via discrimination, accuracy, interpretability, and five-fold cross-validation. Hassan et al. [19] proposed a three-class DL approach for classifying cardiovascular autonomic neuropathy. Pairwise multi-class ROC feature selection, deep convolutional neural network (DCNN) feature augmentation and generation, multimodal feature fusion approaches, and classification were all incorporated into the suggested method to produce a multistage fusion model. Using only a subset of features generated by this LDA-based method, a decision tree classifier attained an accuracy of 88.959%.
Sanni et al. [20] compared the accuracy of various machine-learning approaches in predicting cardiac disease based on the UCI dataset. Estimating the likelihood of heart failure using machine learning algorithms was introduced in [10]. The process starts with pre-processing and continues with feature selection, elimination, training, and testing. For the maximum accuracy of 85.33%, the Decision Tree algorithm was the best choice. Several machine-learning algorithms were applied and analyzed to predict heart disease [21] for diagnostic purposes. They used Weka for data mining and Python for data analysis and visualization. The importance score was used for feature ranking. Three classification algorithms were used KNN, DT, and RF. The RF algorithm achieved 100% utilizing a dataset from Kaggle with 14 features. A DCNN system was proposed for feature rearrangement to predict heart failure mortality [22]. The system handled the data imbalance problem and achieved better feature representation. The proposed approach was evaluated on a dataset of 10,198 patients and proved that CVD and lung complications are the leading cause of heart failure mortality.
Li et al. [23] proposed an automated DCNN-Recurrent neural network (RNN) model for automatically staging heart failure diseases. For better classification performance, they first performed segmentation and augmentation. Then, feature extraction based on CNN is combined with the clinical features. Finally, CNN is combined with RNN for classification. A chest pain dataset collected from 573 patients was used. The results of the experiments demonstrated that the proposed model was accurate to 97.6%.
Numerous architectures have been proposed concerning cardiac patients’ automatic monitoring and detection of heart failure; however, they involve several issues and challenges. First, heart diseases are hampered by a large amount of cardiac patient data. Due to the lack of a sophisticated framework that can use many data sources, these systems cannot manage high-dimensional datasets. Furthermore, most proposed systems use conventional techniques to select features that cause performance degradation and are time-consuming. Finally, extracting relevant and meaningful features is tedious for cardiac disease prediction. In this vein, to detect unnoticed heart problems and foresee a heart attack or other cardiac emergency, a smart system is needed to automatically fuse the gathered information from various sources and analyze the acquired data.
This study offers an approach that, with machine learning algorithms, grid search (GS), and an Aquila optimizer (AO), can automatically and accurately classify heart disease based on numerical records. In short, the AO selects the most promising features that lead to the best performance metrics. Also, the GS is used to choose the best combinations of hyperparameters. Fig. 1 depicts the suggested framework. The proposed framework consists of multiple stages, where the numerical data is acquired in the first stage. After that, the data is pre-processed, and the initial population is generated. The pre-processed data and machine learning model evaluate each solution’s fitness function. Finally, the population is updated, and the last two stages are repeated for several iterations. Algorithm 1 summarizes the overall stages in short. As presented in it, the last two steps repeatedly run for several iterations

Figure 1: The suggested heart disease framework

The datasets are accessible via many means, including digital libraries. The datasets are retrieved from Kaggle for this particular investigation. The tests are conducted on three datasets: Heart Failure Prediction Dataset, Heart Disease Binary Classification, and Heart Disease Dataset. They are partitioned into Diseased and Healthy (i.e., non-diseased).
3.1.1 Dataset 1: Heart Failure Prediction Dataset
Eleven different clinical characteristics related to heart disease are included in the dataset. This dataset was produced by integrating various datasets that were previously accessible separately but had never been integrated. This dataset was created by combining five heart datasets using eleven common characteristics. The five datasets utilized for its curation are Cleveland: 303 observations, Hungarian: 294 observations, Switzerland: 123 observations, Long Beach, VA: 200 observations, and Stalog (Heart) Data Set: 270 observations. Although there were 1190 observations in total, 272 were duplicates, making the final dataset contain only 918 observations. The dataset can be retrieved from Kaggle [24]. Table 1 describes the dataset columns and their meaning. It is important to note that other possible risk factors for heart disease, such as lifestyle factors (e.g., smoking or alcohol intake) or genetic predispositions, were not considered in this dataset and that it only considers a small number of demographic and clinical characteristics.

3.1.2 Dataset 2: Heart Disease Health Indicators Dataset
The dataset comprises 21 clinical features from the cleaned Behavioral Risk Factor Surveillance System (BRFS) 2015. This dataset includes 253,680 observations largely utilized for the binary categorization of heart disease. It is important to note that there is a significant racial disparity in this dataset, with 229,787 respondents not having or never having experienced heart disease compared to 23,893 who had. The dataset can be retrieved from Kaggle [25]. Table 2 describes the dataset columns and their meaning.

3.1.3 Dataset 3: Heart Disease Dataset
The dataset consists of 13 clinical features from 1988. It consists of 1,025 observations. The dataset can be retrieved from Kaggle [26]. Table 3 describes the dataset columns and their meaning.

3.1.4 Interpretability of the Selected Features
The interpretability and relevance of selected features in heart disease diagnosis can vary depending on the specific features chosen. Age is a crucial factor in diagnosing heart disease, as the likelihood of developing cardiovascular issues increases with age. Heart attacks, coronary artery disease, and heart failure are more common in older individuals. Gender also plays a role in understanding heart disease risk factors. For example, compared to women, men often have a higher chance of developing heart disease at an earlier age, although women’s risk catches up after menopause. High blood pressure (hypertension) significantly contributes to heart disease, as it strains the heart and can lead to coronary artery disease, heart failure, and strokes. High levels of low-density lipoprotein (LDL) cholesterol are associated with an increased risk of heart disease. Diabetes poses a higher risk of heart disease due to various factors, including the effects of high blood sugar on blood vessels, increased inflammation, and the presence of other cardiovascular risk factors. Smoking is a well-known risk factor that damages blood vessels, promotes plaque formation, and reduces oxygen flow to the heart. Obesity is also linked to an increased risk of heart disease, including conditions like coronary artery disease, type 2 diabetes, and hypertension. These are just a few examples of the features commonly considered in heart disease diagnosis. It’s important to note that the significance and interpretability of these features may vary depending on the specific dataset, statistical models used, and the context in which the analysis is conducted.
3.2 Stage 2: Data Pre-Processing
The second phase involves pre-processing the datasets through four procedures. Cleansing, labeling, scaling, and separating the data into test and training sets are all employed.
Data Cleaning: The dataset cleaning means neglecting the null and empty rows. Also, the duplicated rows are removed. Label Encoding: The numerical values in the categorized columns have been encoded. The “Heart Failure Prediction Dataset” dataset is used in this analysis. For example, the “ChestPainType” column converted from [TA, ATA, NAP, ASY] to [0,1,2,3]. Data Scaling: Five scaling techniques are used in this study. They are (1) normalization, (2) standardization, (3) min-max scaling, (4) max-abs scaling, and (5) robust scaling. The equations behind them are shown in Eqs. (1) to (5), respectively.
where
3.3 Stage 3: Formation of the First Population
During the feature selection process, the population is created at random once. At most
The entire population is denoted by
3.4 Stage 4: Fitness Function Evaluation
After pre-processing the datasets, the fitness function evaluation stage comes in. This stage utilizes the AO, cross-validation, and grid search to select the most promising features and hyperparameters. Three machine learning classifiers are used in the current study. They are Adaptive Boosting (AdaBoost), Hist-gradient Boosting (HGB), and Decision Tree (DT). They are selected concerning their speed compared to other algorithms. For each classifier, the whole stages are run. To select or ignore the features, the solution should be encoded in binary (i.e., true and false). How are the solutions encoded? Each solution in the population is sized
The j-th cell of the i-th solution is denoted by

Variance thresholding is also used in the classification pipeline to remove all low-variance features below a specific threshold. The variance threshold technique is also included in the grid search process with different thresholds. They are [0, 0.001, 0.005, 0.01]. The classifier is evaluated on the whole entered dataset to validate its generalization. Various performance metrics are assessed to judge the model performance. They are Accuracy (Eq. (8)), Balanced Accuracy (Eq. (9)), Precision or Positive Predictive Value (PPV) (Eq. (10)), Specificity or True Negative Rate (TNR) (Eq. (11)), Recall, Sensitivity, True Positive Rate (TPR), or Hit Rate (Eq. (12)), F1-score, Dice, or Overlap Index (Eq. (13)), Negative Predictive Value (NPV) (Eq. (14)), Fallout or False Positive Rate (FPR) (Eq. (15)), False Negative Rate (FNR) (Eq. (16)), Intersection over Union (IoU) or Jaccard Index (Eq. (17)), Error Rate (Eq. (18)), and False Discovery Rate (FDR) (Eq. (18)). Further, Eq. (20) is used to derive a weighted sum measure from the 16 metrics mentioned earlier [27–29].
3.5 Stage 5: Population Updating
Concerning the fitness function evaluating score, the population is sorted from top to bottom so that the best option is at the top and the worst option is at the bottom. This is crucial for determining
where
This section explores the experimental studies conducted to prove the validity of the proposed framework. A summary of the common setups used in all of the experiments used in this study is depicted in Table 5.

4.1 The “Heart Failure Prediction Dataset” Experiments
The framework steps are carried out on the “Heart Failure Prediction Dataset.” Each algorithm reported multiple encoded solutions that led to the same WSM value. Table 6 reports the best-encoded solutions for each classifier. It shows that each classifier produced a top-1 encoded solution. The mark “✓” indicates that the feature is used, while the mark “✗” means the feature is neglected. It shows that selecting all features gives state-of-the-art WSM value.
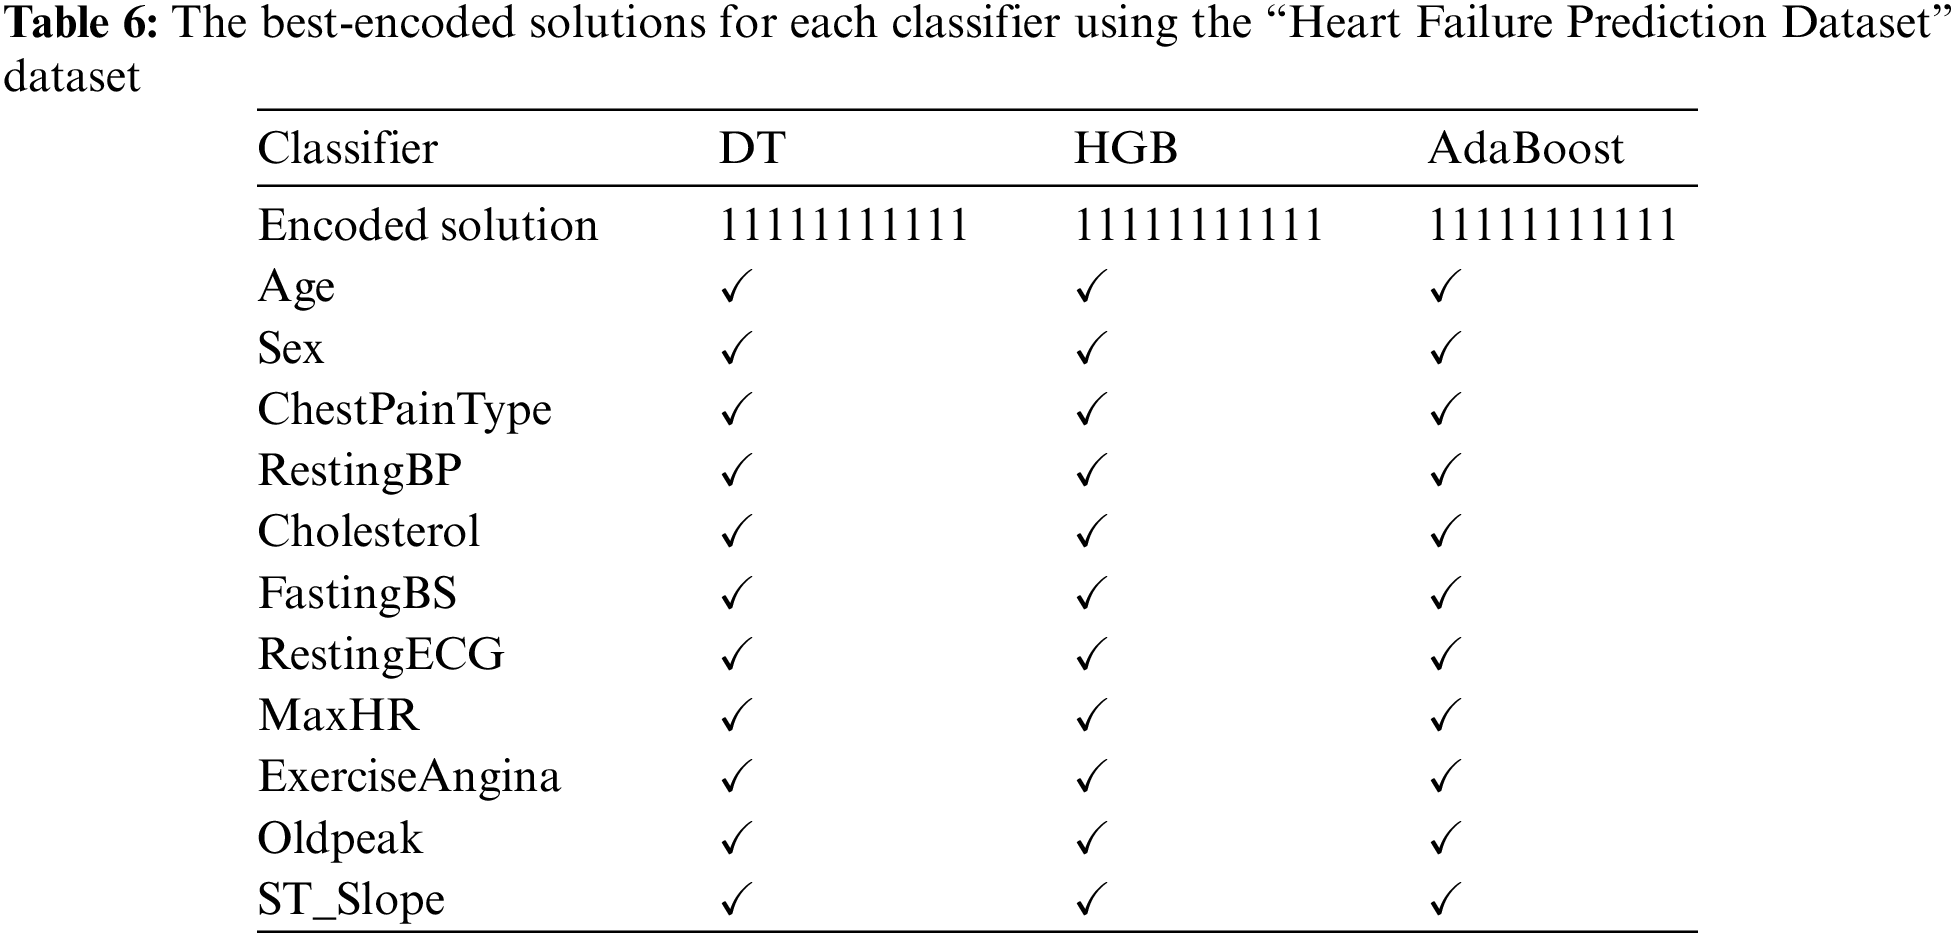
The performance metrics are presented in Table 7. In addition, Table 8 reports the corresponding hyperparameters produced by the encoded solutions using the “Heart Failure Prediction Dataset” dataset. They show that the best WSM value is 98.65%; the HGB machine learning classifier produces that with a variance threshold value of 0 and the standardization scaling technique.

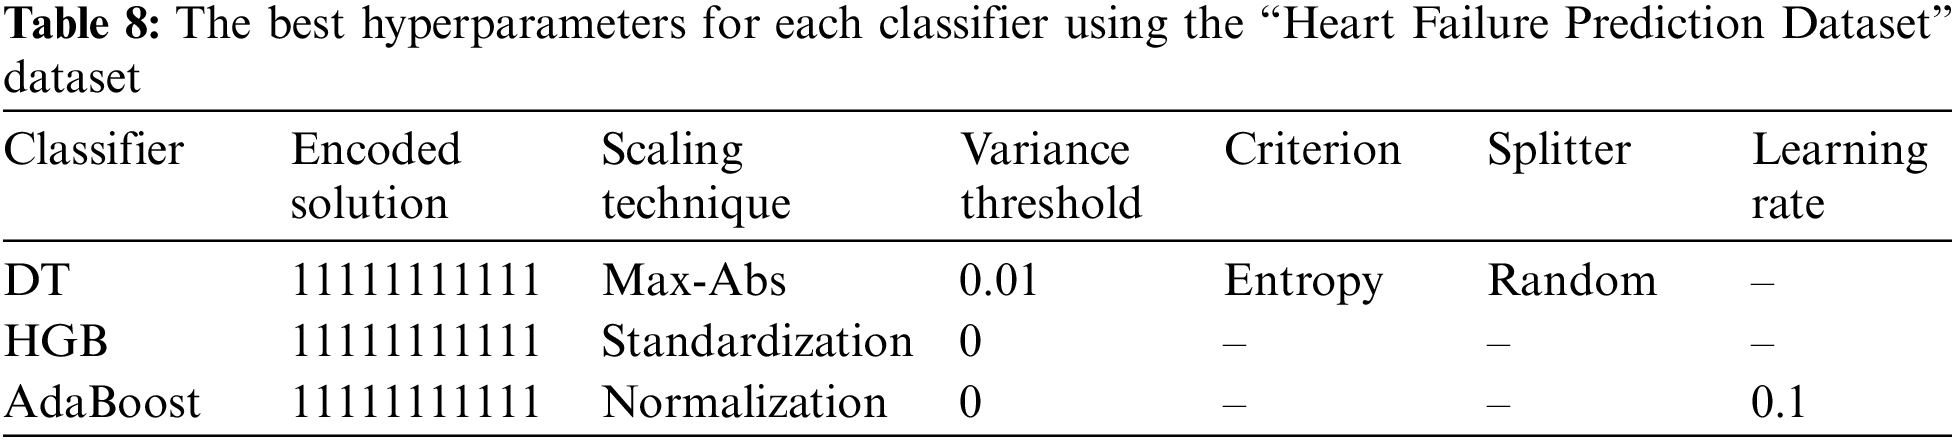
Fig. 2 summarizes the performance metrics graphically. The x-axis shows the metrics, while the y-axis shows the scores. It indicates that the AdaBoost classifier produced the lowest scores while the HGB classifier produced the highest scores.

Figure 2: Graphical summary of the “Heart Failure Prediction Dataset” performance metrics
4.2 The “Heart Disease Health Indicators Dataset” Experiments
The framework steps are executed on the “Heart Disease Health Indicators Dataset.” Each algorithm reported multiple encoded solutions that led to the same WSM value. Table 9 reports the best-encoded solutions for each classifier. It shows that each classifier produced a top-1 encoded solution. The mark “✓” indicates that the feature is used, while the mark “✗” means the feature is neglected.
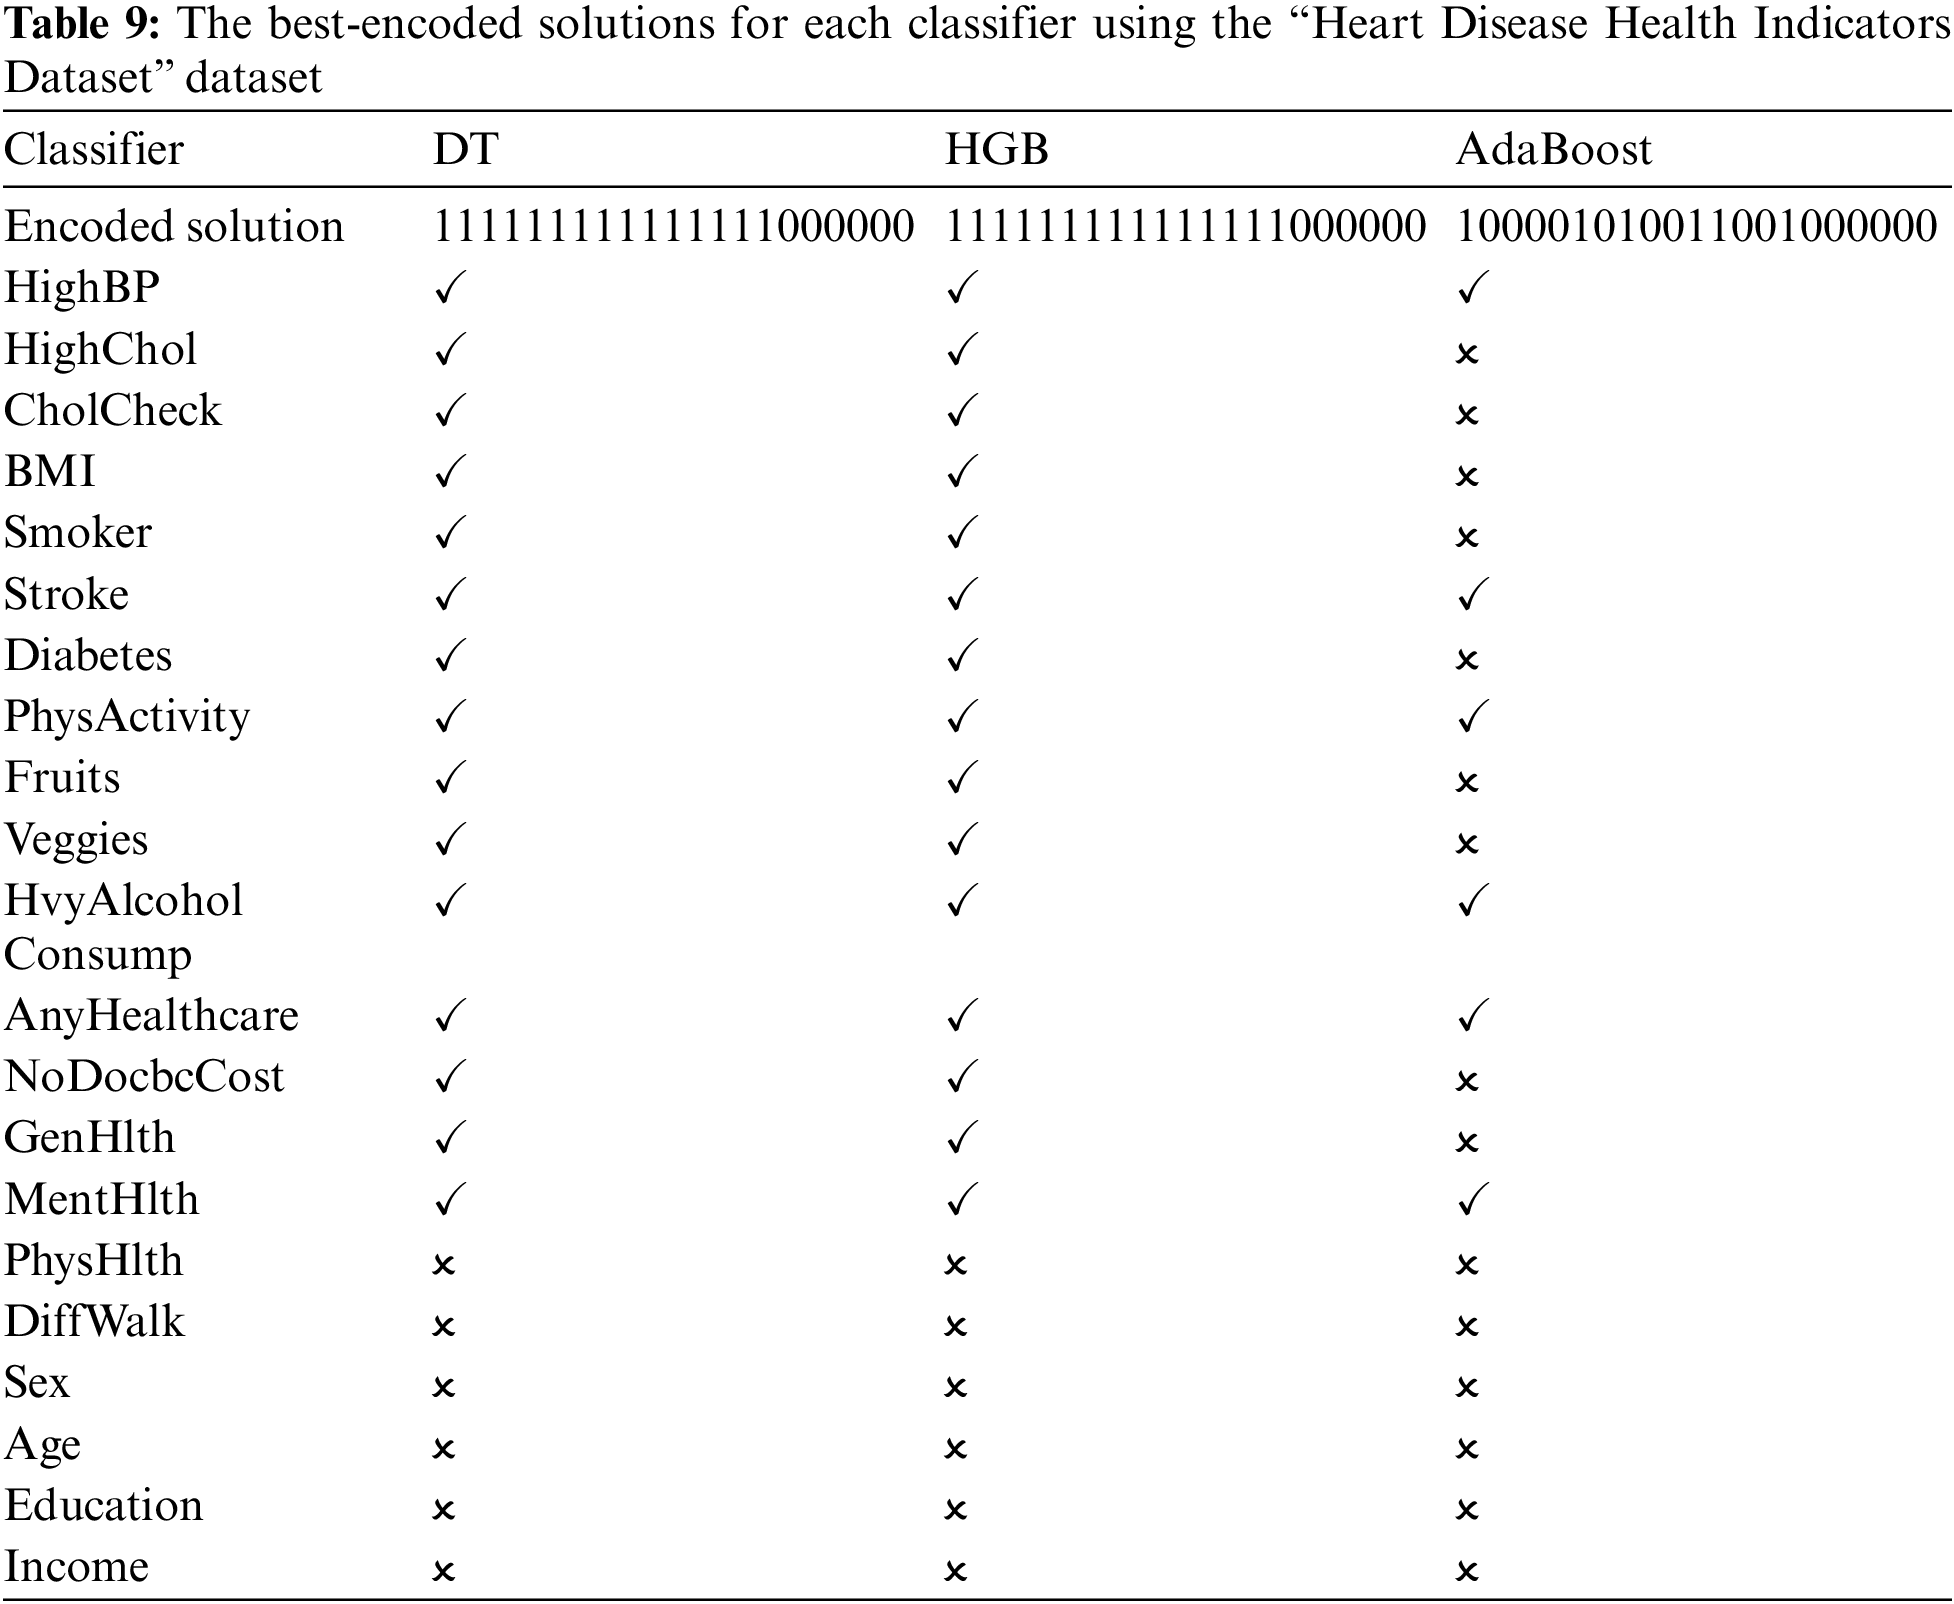
Table 10 reports the performance metrics, and Table 11 reports the corresponding hyperparameters produced by the encoded solutions using the “Heart Disease Health Indicators Dataset” dataset. They show that the best WSM value is 87.64%, produced by the DT machine learning classifier with a variance threshold value of 0.01 and the max-abs scaling technique. The best DT hyperparameters are the entropy criterion and random splitter.


4.3 The “Heart Disease Dataset” Experiments
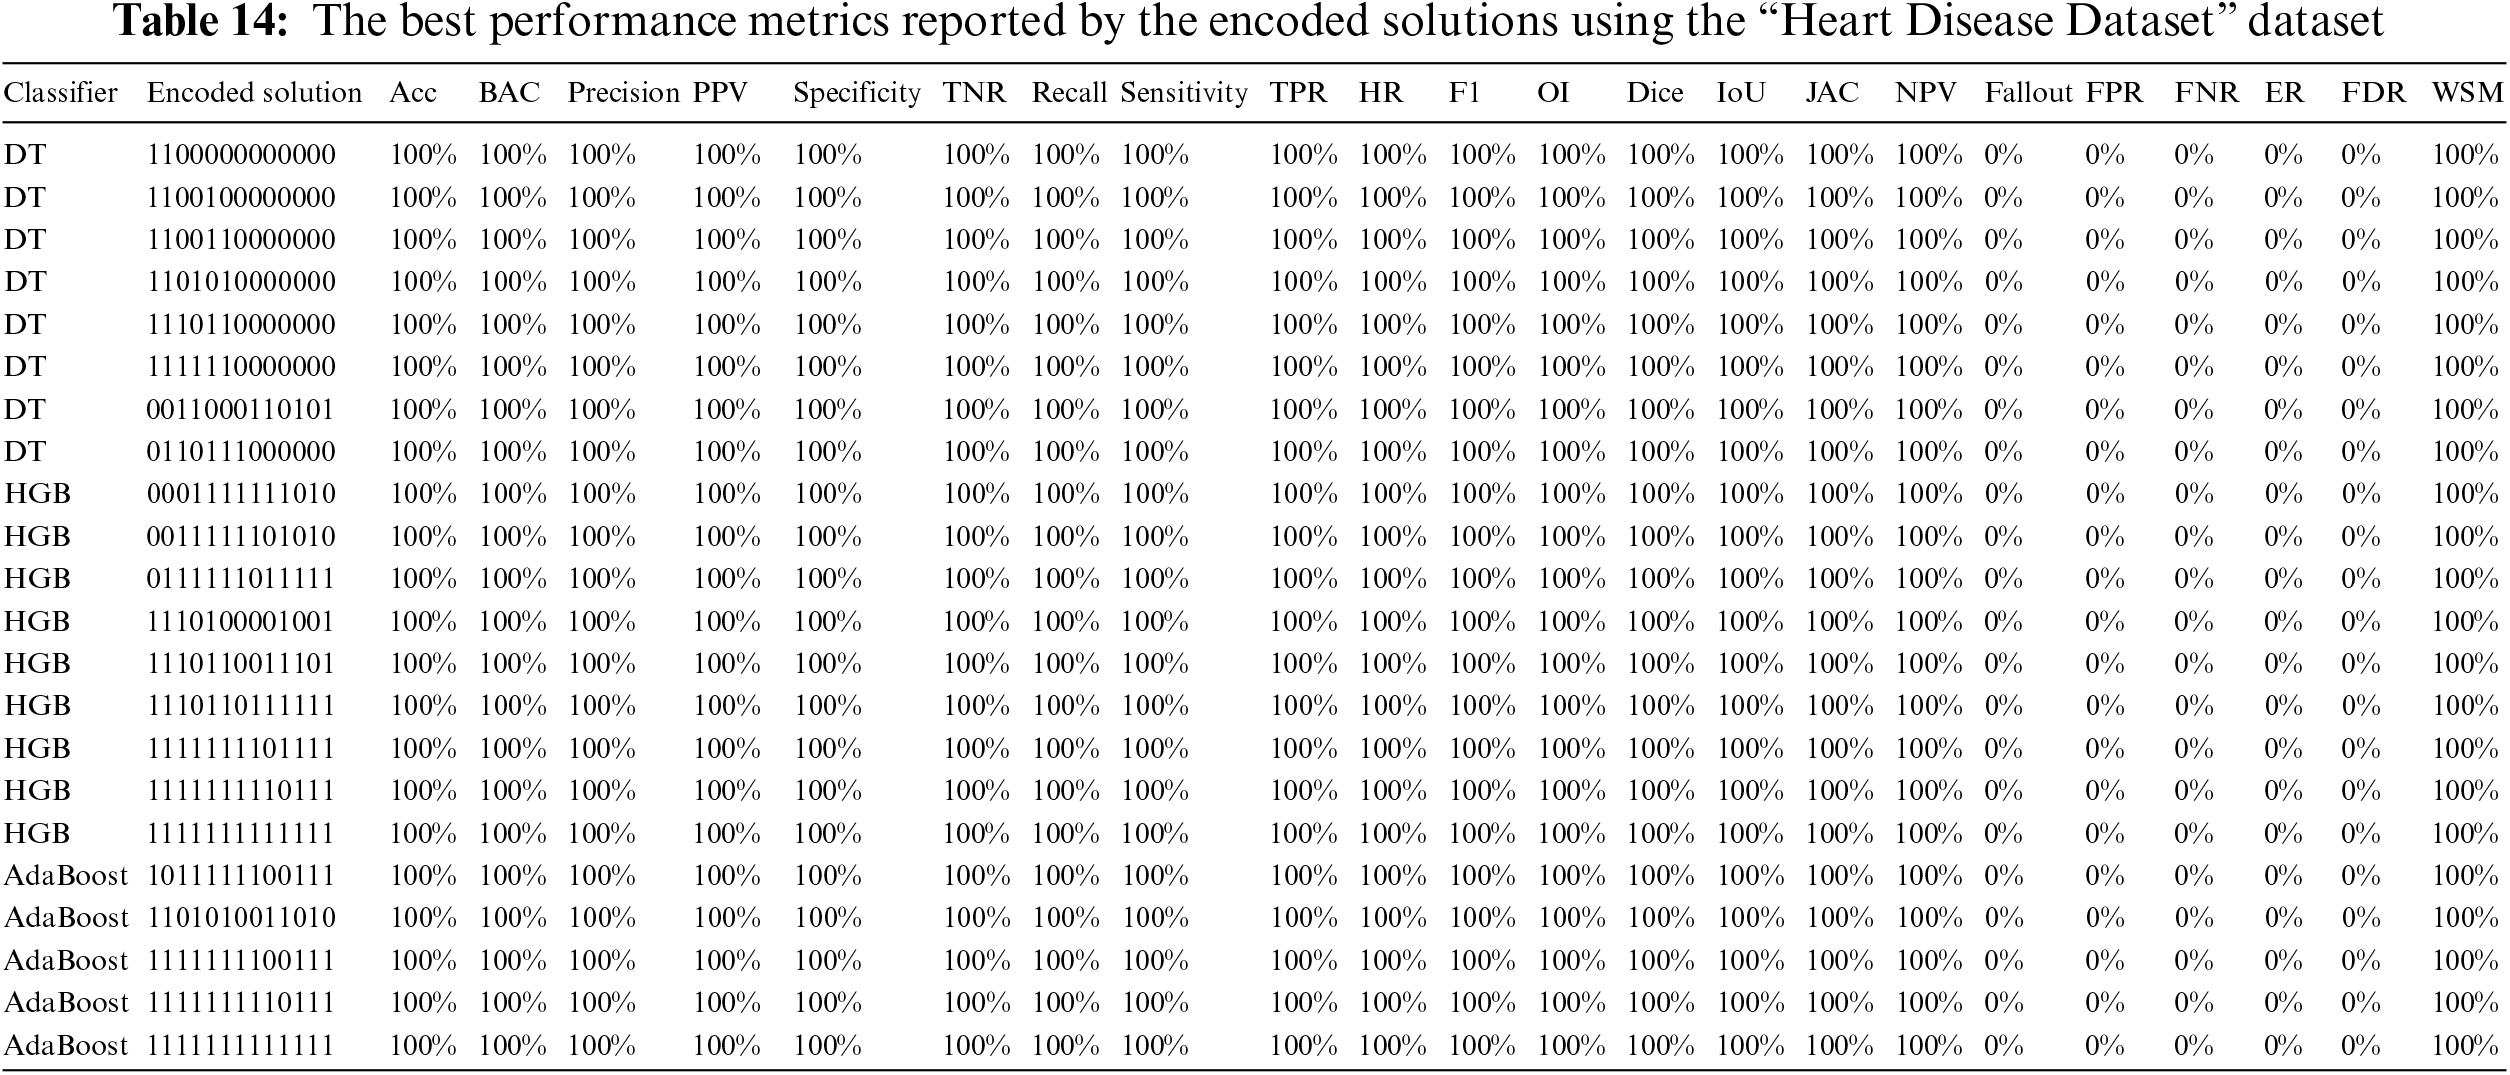
The framework stages are run on the “Heart Disease Dataset” dataset, and each algorithm reported multiple encoded solutions that lead to the same WSM value. Table 12 reports the best-encoded solutions for each classifier. For example, it shows that the DT classifier produced eight solutions, the HGB classifier produced nine solutions, and the AdaBoost classifier produced five solutions. The mark “✓” indicates that the feature is used, while the mark “✗” means the feature is neglected.

Table 12 shows that the HGB and AdaBoost classifiers matched with two encoded solutions (i.e., “1111111110111” and “1111111111111”). The encoded solutions “1100000000000” and “1100100000000” do not seem to be reasonable as they depend on age, gender, and resting blood pressure only. The repeating percentages of each column in the different encoded solutions are represented in Table 13. The last column shows the final solution. The column is considered if the percentage is above or equal to 50%; otherwise, it is neglected. It shows that the encoded solution “1111111100111” is the most reasonable one.
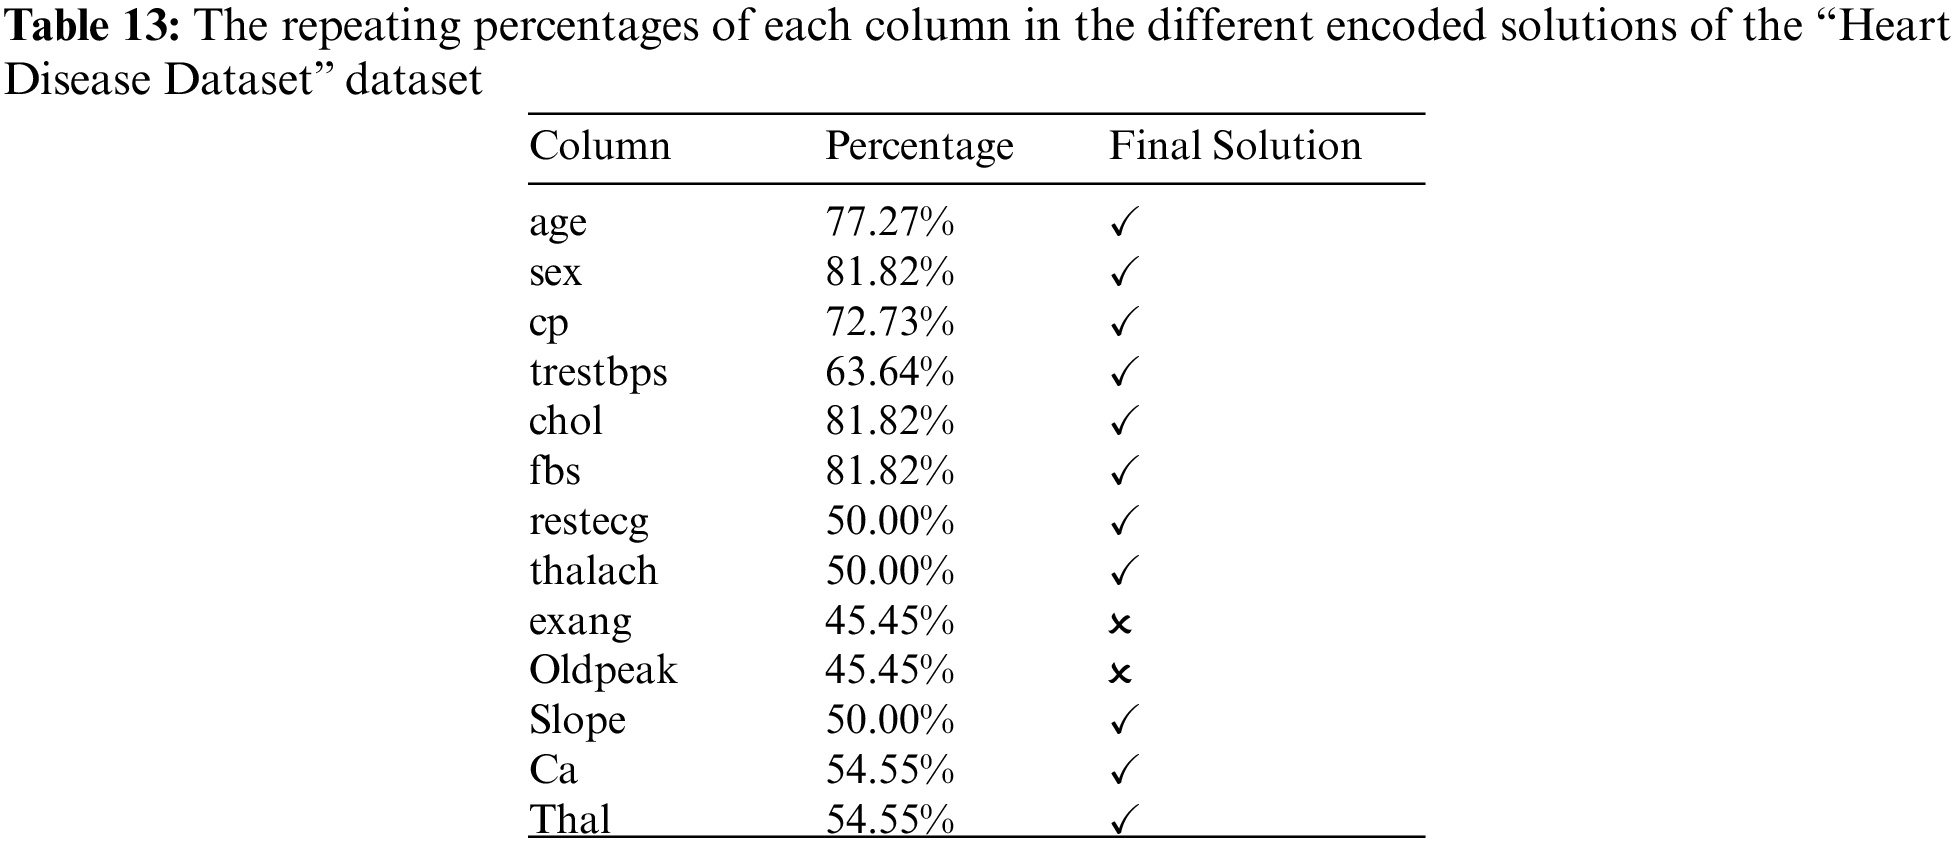
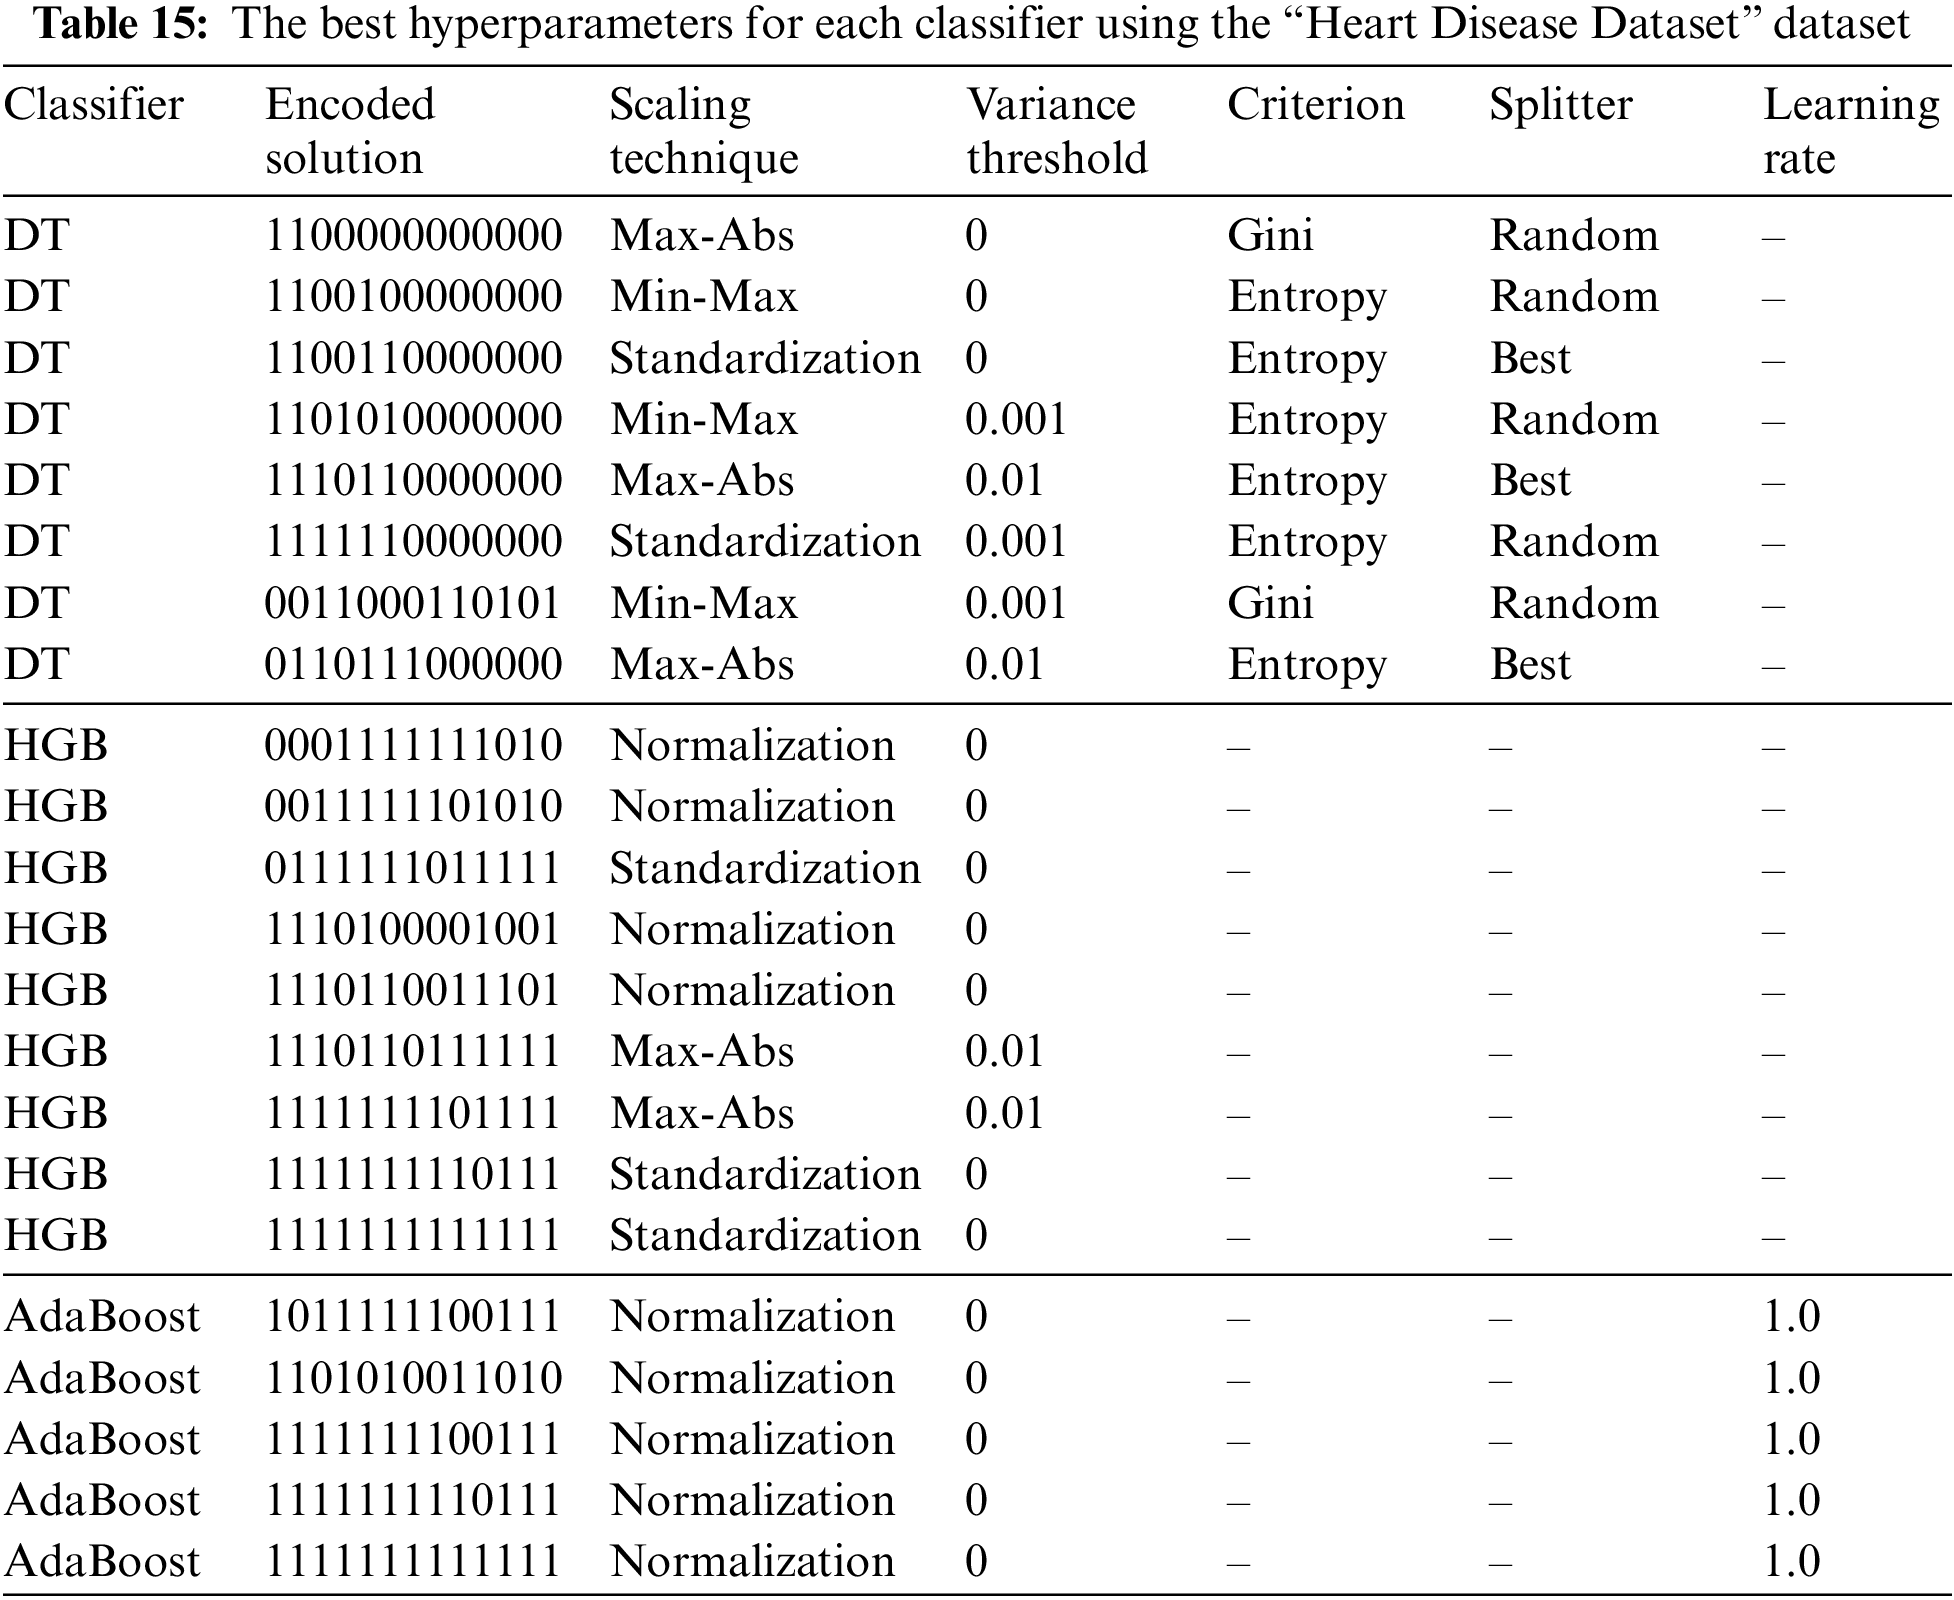
Table 14 reports the performance metrics, and Table 15 reports the corresponding hyperparameters produced by the encoded solutions using the “Heart Disease Dataset” dataset. A comparison of the suggested methodology and the relevant studies can be seen in Table 16. The current research is superior to most other studies in this field.

Heart disease is a significant health problem and a leading cause of death worldwide. Therefore, early and accurate diagnosis is essential for proper treatment and prevention of the disease. In this study, we proposed a quantitative framework for automatic and precise classification of heart disease based on numerical data records, using Aquila optimization and machine learning algorithms. Three datasets from Kaggle were used for the experiments, and the results show that our method outperforms other state-of-the-art algorithms in accuracy. The proposed framework is a significant step towards automating the diagnosis of heart disease, which can lead to earlier detection and improved patient outcomes. However, several limitations need to be addressed in future work. For instance, the framework could be improved by incorporating additional data sources such as medical images and patient history. Furthermore, more extensive datasets with more diverse patients must be used to validate the framework’s effectiveness in real-world settings. Future directions include exploring other optimization techniques and machine learning algorithms to improve the framework’s performance. Furthermore, integrating the proposed framework into clinical decision-making systems could be investigated to aid physicians in making more accurate diagnoses and providing better care for heart disease patients. Future research in the field of heart disease classification can focus on several key areas. These include incorporating additional data sources such as medical images and patient history, validating the proposed framework on larger and diverse datasets, exploring alternative optimization techniques and machine learning algorithms, and integrating the framework into clinical decision-making systems.
Funding Statement: The authors received no specific funding for this study.
Conflicts of Interest: The authors declare that they have no conflicts of interest to report regarding the present study.
References
1. S. M. Shah, S. Batool, I. Khan, M. U. Ashraf, S. H. Abbas et al., “Feature extraction through parallel probabilistic principal component analysis for heart disease diagnosis,” Physica A: Statistical Mechanics and its Applications, vol. 482, no. 1, pp. 796–807, 2017. [Google Scholar]
2. World Health Organization, “cardiovascular diseases (CVD),” 2021. Available: https://www.who.int/en/news-room/fact-sheets/detail/cardiovascular-diseases-(cvds) (Accessed: 20-01-2023). [Google Scholar]
3. World Health Organization, “Global health estimates: Leading causes of death,” 2019. Available: https://www.who.int/data/gho/data/themes/mortality-and-global-health-estimates/ghe-leading-causes-of-death (Accessed: 22-01-2023). [Google Scholar]
4. A. Yazdani, K. D. Varathan, Y. K. Chiam, A. W. Malik and W. A. Ahmad, “A novel approach for heart disease prediction using strength scores with significant predictors,” BMC Medical Informatics and Decision Making, vol. 21, no. 1, pp. 194, 2021. [Google Scholar] [PubMed]
5. C. W. Tsao, A. W. Aday, Z. I. Almarzooq, A. Alonso, A. Z. Beaton et al., “Heart disease and stroke statistics—2022 update: A report from the American Heart Association,” Circulation, vol. 145, no. 8, pp. e153–e639, 2022. [Google Scholar] [PubMed]
6. S. L. James, D. Abate, K. H. Abate, S. M. Abay, C. Abbafati et al., “A systematic analysis for the global burden of disease study 2017,” The Lancet, vol. 392, no. 10159, pp. 1789–1858, 2018. [Google Scholar]
7. F. S. Alotaibi, “Implementation of machine learning model to predict heart failure disease,” International Journal of Advanced Computer Science and Applications, vol. 10, no. 6, pp. 261–268, 2019. [Google Scholar]
8. R. Katarya and S. K. Meena, “Machine learning techniques for heart disease prediction: A comparative study and analysis,” Health and Technology, vol. 11, no. 1, pp. 87–97, 2021. [Google Scholar]
9. H. Bleijendaal, P. M. Croon, M. D. Pool, A. Malekzadeh, S. Aufiero et al., “Clinical applicability of artificial intelligence for patients with an inherited heart disease: A scoping review,” Trends in Cardiovascular Medicine, vol. 498, pp. 255, 2022. https://doi.org/10.1016/j.tcm.2022.01.011 [Google Scholar] [PubMed] [CrossRef]
10. F. M. Delpino, Â.K. Costa, S. R. Farias, A. D. Filho, R. A. Arcêncio et al., “Machine learning for predicting chronic diseases: A systematic review,” Public Health, vol. 205, no. 1, pp. 14–25, 2022. [Google Scholar] [PubMed]
11. V. Chang, V. R. Bhavani, A. Q. Xu and M. A. Hossain, “An artificial intelligence model for heart disease detection using machine learning algorithms,” Healthcare Analytics, vol. 2, no. 1, pp. 100016, 2022. [Google Scholar]
12. N. C. Long, P. Meesad and H. Unger, “A highly accurate firefly-based algorithm for heart disease prediction,” Expert Systems with Applications, vol. 42, no. 21, pp. 8221–8231, 2015. [Google Scholar]
13. S. Ekız and P. Erdogmus, “Comparative study of heart disease classification,” in 2017 Electric Electronics, Computer Science, Biomedical Engineerings’ Meeting (EBBT), Istanbul, Turkey, IEEE, pp. 1–4, 2017. [Google Scholar]
14. S. Bashir, Z. S. Khan, F. H. Khan, A. Anjum and K. Bashir, “Improving heart disease prediction using feature selection approaches,” in 2019 16th Int. Bhurban Conf. on Applied Sciences and Technology (IBCAST), Islamabad, Pakistan, IEEE, pp. 619–623, 2017. [Google Scholar]
15. S. Sharma and M. Parmar, “Heart diseases prediction using deep learning neural network model,” International Journal of Innovative Technology and Exploring Engineering (IJITEE), vol. 9, no. 3, pp. 2244–2248, 2020. [Google Scholar]
16. R. Katarya and S. K. Meena, “A comparative study on machine learning based heart disease prediction,” Health and Technology, vol. 11, no. 11, pp. 87–97, 2021. [Google Scholar]
17. R. Yilmaz and F. H. Yagin, “Early detection of coronary heart disease based on machine learning methods,” Medical Records, vol. 4, no. 1, pp. 1–6, 2022. [Google Scholar]
18. X. D. Zhuang, T. Tian, L. Z. Liao, Y. H. Dong, H. J. Zhou et al., “Deep phenotyping and prediction of long-term cardiovascular disease: Optimized by machine learning,” Canadian Journal of Cardiology, vol. 38, no. 6, pp. 774–782, 2022. [Google Scholar] [PubMed]
19. M. R. Hassan, S. Huda, M. M. Hassan, J. Abawajy, A. Alsanad et al., “Early detection of cardiovascular autonomic neuropathy: A multi-class classification model based on feature selection and deep learning feature fusion,” Information Fusion, vol. 77, no. 4, pp. 70–80, 2022. [Google Scholar]
20. R. R. Sanni and H. Guruprasad, “Analysis of performance metrics of heart failure patients using Python and machine learning algorithms,” Global Transitions Proceedings, vol. 2, no. 2, pp. 233–237, 2021. [Google Scholar]
21. M. M. Ali, B. K. Paul, K. Ahmed, F. M. Bui, J. M. Quinn et al., “Heart disease prediction using supervised machine learning algorithms: Performance analysis and comparison,” Computers in Biology and Medicine, vol. 136, no. 191, pp. 104672, 2021. [Google Scholar] [PubMed]
22. Z. Wang, Y. Zhu, D. Li, Y. Yin and J. Zhang, “Feature rearrangement based deep learning system for predicting heart failure mortality,” Computer Methods and Programs in Biomedicine, vol. 191, no. 1, pp. 105383, 2020. [Google Scholar] [PubMed]
23. D. Li, X. Li, J. Zhao and X. Bai, “Automatic staging model of heart failure based on deep learning,” Biomedical Signal Processing and Control, vol. 52, no. 1, pp. 77–83, 2019. [Google Scholar]
24. Fedesoriano, “Heart failure prediction dataset,” 2021. Available: https://www.kaggle.com/fedesoriano/heart-failure-prediction (Accessed on 20-1- 2023). [Google Scholar]
25. A. Teboul, “Heart disease health indicators dataset,” 2022. Available: https://www.kaggle.com/datasets/alexteboul/heart-disease-health-indicators-dataset (Accessed on 25-1- 2023). [Google Scholar]
26. D. Lapp, “heart disease dataset,” 2019. Available: https://www.kaggle.com/datasets/johnsmith88/heart-disease-dataset (Accessed on 20-1-2023). [Google Scholar]
27. N. Talpur, S. J. Abdulkadir, M. H. Hasan, H. Alhussian and A. Alwadain, “Novel wrapper-based optimization algorithm for the feature selection and classification,” Computers, Materials & Continua, vol. 74, no. 3, pp. 5799–5820, 2023. [Google Scholar]
28. N. Talpur, S. J. Abdulkadir, E. A. Akhir, M. H. Hasan, H. Alhussian et al., “A novel bitwise arithmetic optimization algorithm for the rule base optimization of deep neuro-fuzzy system,” Journal of King Saud University-Computer and Information Sciences, vol. 35, no. 2, pp. 821–842, 2023. [Google Scholar]
29. J. Li, K. Cheng, S. Wang, F. Morstatter, R. P. Trevino et al., “Feature selection: A data perspective,” ACM Computing Surveys, vol. 50, no. 6, pp. 1–45, 2017. [Google Scholar]
30. B. Xue, M. Zhang, W. N. Browne and X. Yao, “A survey on evolutionary computation approaches to feature selection,” IEEE Transactions on Evolutionary Computation, vol. 20, no. 4, pp. 606–626, 2015. [Google Scholar]
31. T. Dokeroglu, A. Deniz and H. E. Kiziloz, “A comprehensive survey on recent metaheuristics for feature selection,” Neurocomputing, vol. 494, no. 1, pp. 269–296, 2022. [Google Scholar]
32. H. G. Enad and M. A. Mohammed, “A review on artificial intelligence and quantum machine learning for heart disease diagnosis: Current techniques, challenges and issues,” Fusion: Practice and Applications (FPA), vol. 11, no. 1, pp. 08–25, 2023. [Google Scholar]
33. R. R. Sarra, A. M. Dinar and M. A. Mohammed, “Enhanced accuracy for heart disease prediction using artificial neural network,” Indonesian Journal of Electrical Engineering and Computer Science, vol. 29, no. 1, pp. 375–383, 2023. [Google Scholar]
34. R. R. Sarra, A. M. Dinar, M. A. Mohammed, M. K. AbdGhani and M. A. Albahar, “A robust framework for data generative and heart disease prediction based on efficient deep learning models,” Diagnostics, vol. 12, no. 12, pp. 2899, 2023. [Google Scholar]
35. R. R. Sarra, A. M. Dinar, M. A. Mohammed and K. H. Abdulkareem, “Enhanced heart disease prediction based on machine learning and χ2 statistical optimal feature selection model,” Designs, vol. 6, no. 5, pp. 87, 2022. [Google Scholar]
36. M. Elhoseny, M. A. Mohammed, S. A. Mostafa, K. H. Abdulkareem, M. S. Maashi et al., “A new multi-agent feature wrapper machine learning approach for heart disease diagnosis,” Computers, Materials & Continua, vol. 57, no. 1, pp. 51–71, 2021. [Google Scholar]
Cite This Article
 Copyright © 2023 The Author(s). Published by Tech Science Press.
This work is licensed under a Creative Commons Attribution 4.0 International License , which permits unrestricted use, distribution, and reproduction in any medium, provided the original work is properly cited.
 Downloads
 Citation Tools