
 Submit a Paper
 Propose a Special lssue
 Open Access
ARTICLE
Letter Recognition Reinvented: A Dual Approach with MLP Neural Network and Anomaly Detection
Faculty of Computing and Information Technology in Rabigh, King Abdulaziz University, Jeddah, 21589, Saudi Arabia
* Corresponding Author: Nesreen M. Alharbi. Email:
Computer Systems Science and Engineering 2024, 48(1), 175-198. https://doi.org/10.32604/csse.2023.041044
Received 09 April 2023; Accepted 30 June 2023; Issue published 26 January 2024
 View Full Text
 Download PDF
Abstract
Recent years have witnessed significant advancements in the field of character recognition, thanks to the revolutionary introduction of machine learning techniques. Among various types of character recognition, offline Handwritten Character Recognition (HCR) is comparatively more challenging as it lacks temporal information, such as stroke count and direction, ink pressure, and unexpected handwriting variability. These issues contribute to a poor level of precision, which calls for the adoption of anomaly detection techniques to enhance Optical Character Recognition (OCR) schemes. Previous studies have not researched unsupervised anomaly detection using MLP for handwriting recognition. Therefore, this study proposes a novel approach for enhanced English letter identification based on a Multi-Layer Perceptron (MLP) neural network and an anomaly detection method. The MLP neural network is trained on a massive dataset of letters, enabling it to achieve high accuracy in recognizing letters from different font styles. Additionally, to further enhance the performance of the system, an anomaly detection method is employed to identify and eliminate any outliers or anomalies in the recognition process. The combination of these two techniques results in a highly accurate and robust letter recognition system that can be applied to a wide range of practical applications. The hybrid approach aims to increase the accuracy of English letter identification while minimizing misclassification, i.e., classification issues associated with recognizing English letters in images. To identify handwritten letters based on their underlying patterns, discriminant samples with extracted attributes were fed into a neural network, which was then used to categorize the data. This paper achieved significant improvements in English letter identification by coupling the anomaly detection algorithm and the multilayer perceptron neural network. When tested on the UCI-English letters dataset, this hybrid technique boosted the accuracy from 84.11% using the multiple neural networks to an impressive 92.84% with the proposed method. Moreover, the experimental results of the study have demonstrated that the hybrid method outperforms modern classification techniques for handwriting letter recognition. Overall, the proposed approach has tremendous potential to advance the field of character recognition, especially for offline handwritten character recognition, and can pave the way for developing more accurate and efficient OCR systems in the future.Keywords
The ability to recognize and process written characters is a crucial aspect of modern technology and plays a significant role in fields such as document analysis, handwriting recognition, and Optical Character Recognition (OCR). With the growing demand for digitization and automation of various tasks, the need for accurate and reliable letter recognition systems has become increasingly apparent. Traditionally, letter recognition has been approached through various methods such as template matching and feature extraction. However, these methods are limited in their ability to recognize letters from different font styles and can often produce incorrect results in real-world scenarios.
Handwriting recognition is a category of OCR, and it is the technology that can convert handwritten characters to speech [1,2] or Braille [3] and evaluate answers on an answer sheet [4]. It is a challenge to recognize a handwritten script because of the different possible ways of shaping the character by different individuals [5]. Hand-written character recognition is categorized into online and offline character recognition. Online character recognition involves recognizing character data in real-time [6]. In contrast, offline character recognition is a mechanism for parsing an image into words, where the image has handwritten text (e.g., [7,8]). This process is difficult due to the variation of handwriting styles and the presence of noise; thus, achieving a 100% recognition rate is almost impossible [9]. Additionally, the process of handwriting recognition is very complex and includes different stages, namely, image source acquisition, preprocessing operations, segmentation, feature extraction, and classification. There are several numbers of difficulties in handwriting recognition:
• There is a great deal of variety and ambiguity in handwritten strokes from person to person.
• The handwriting style of a particular individual occasionally changes and is also inconsistent.
• The exposure time and degradation of the source document or image may result in deterioration.
• Text may be aligned in a straight line when printing. However, people do not need to align text on white paper in a straight line when writing by hand.
• It is difficult to distinguish and recognize cursive letters in handwritten text because text written in cursive may have varied rotations to the right. In contrast, all text is straight when printed.
• Compared to synthetic data, collecting a properly labeled dataset to learn from is expensive.
In the image source acquisition stage, written text is captured by a digital input source, such as a scanner or digital camera. The preprocessing stage often improves the quality of written characters and thus increases recognition accuracy. A sequence of techniques is applied in this stage. First, noise is eliminated from the image by reducing some signals from the image. This process is called “noise removal”, and it can be completed by certain algorithms such as the min-max, Gaussian, and median filtering methods. Second, color or grayscale images are converted to binary images that consist of 1’s and 0’s. This conversion process is called “binarization”. The third step is the “morphological operation”, which either dilates some pixels in image holes or boundaries [10] or erodes some pixels in image holes, which increases the hole size, or boundaries. Thus, dilation is sometimes used to join disjointed pixels, and erosion is used to remove noise from the image [11]. The segmentation stage implicitly or explicitly recognizes the individual character in the image. That is, the word can be recognized without a segmentation process or predicted by extracting its individual characters. The feature-extraction stage extracts the features of each character, as each character has its unique features. The classification stage tests the input data to group characters to certain labels according to the extracted features.
In contrast, various classification techniques (e.g., decision trees and neural networks) have been used to classify and recognize handwritten characters. The idea behind neural networks, for instance, is to imitate the learning processes of the human brain in its learning process. Neural networks consist of nodes that are mapped by neurons and grouped into at least three main layers: input, hidden, and output layers. The input layer receives inputs from original data or other neurons and sends the data to the hidden layers. In the hidden layers, training occurs by applying computational models. Accordingly, the output layer predicts the most probable outcomes.
There are different learning approaches in neural networks two of them are: supervised and unsupervised learning. While supervised learning methods utilize labeling assistance from humans to classify outcomes, unsupervised learning methods can discover common features of input data and cluster the outcomes accordingly, without human intervention. Unsupervised learning is characterized by its ability to learn from large unlabeled data. Neural networks have simple elements that operate in parallel [12].
A neural network architecture called Multi-Layer Perceptron (MLP) is capable of distinguishing complex patterns. This capability makes MLP a popular architecture for research in character recognition. For example, see [13–15]. However, neural networks are affected by anomalies [16]. An anomaly refers to something significantly different from the normal situation [17]. Employing the anomaly detection process in machine learning improves classification performance [18]. Nevertheless, unsupervised anomaly detection has not been used with MLP for handwriting recognition. In this paper, a new contribution to character recognition of handwriting based on the combination of MLP and unsupervised multivariate anomaly detection is presented.
In recent years, machine learning techniques, specifically artificial neural networks, have shown great promise in solving complex recognition problems. This article proposes an enhanced letter recognition approach based on an MLP neural network and an anomaly detection method. This research hypothesizes that the use of a neural network allows for a high level of accuracy in recognizing letters from different font styles, while the anomaly detection method helps to identify and eliminate any outliers or anomalies in the recognition process, resulting in a highly accurate and robust system. This research not only highlights the potential of combining MLP neural networks with anomaly detection techniques for improved letter recognition performance but also provides a valuable contribution to the field of character recognition and its various applications. The proposed approach leverages the ability of MLP neural networks to learn complex relationships between inputs and outputs to accurately recognize letters. The training process involves feeding the neural network with a large dataset of letters, allowing it to learn and generalize the patterns and relationships between the input and output. Once trained, the neural network can accurately recognize letters from different font styles, improving its practicality and versatility. To further enhance the performance of the system, an anomaly detection method is employed. This method identifies any outliers or anomalies in the recognition process, ensuring that the results are consistent and reliable. By eliminating these anomalies, the system can produce accurate results even in the presence of challenging scenarios such as distorted letters or varying font styles. This research can serve as a valuable resource for researchers and practitioners in the field of character recognition and its various applications, paving the way for further advancements in this area.
Handwritten Character Recognition (HCR) is a critical problem in the field of pattern recognition and computer vision. It has been an active area of research for several decades, and it has numerous applications such as digitizing handwritten documents and recognizing bank checks and postal codes. HCR has received significant attention from researchers, and Machine Learning (ML) methods have shown remarkable progress in recent years.
Handwriting recognition has been one of the most challenging research areas in pattern recognition in recent years [12,19]. However, it is very useful in many real-world problems, such as verifying signatures or mailing addresses, processing bank checks, and analyzing documents. Many studies have focused on identifying handwritten strokes, characters, digits, or words [12]. Generally, handwriting recognition is classified by either online or offline methods. The online method has better recognition of handwritten characters, but offline methods have been successfully used to achieve high recognition accuracy [19]. Anonymous algorithms can be supervised, unsupervised, or semi-supervised learning methods. Supervised methods have limitations regarding computational performance. Unsupervised methods can be categorized as distance-based, density based, or linear. Linear methods are used to convert higher-dimensional data into lower-dimensional data and compute outlier scores. The anomaly detection algorithm is very efficient in processing and calculating the best value [20]. Anomaly algorithms can be applied to detect the anomaly in videos to identify any abnormality in a video stream automatically. Several approaches were introduced to find anomalies on the frame level by applying deep neural networks to measure the degree of the anomaly of the frames of the input video by generating an anomaly score for each frame [21]. For example, the study [22] sufficiently discriminated anomaly in video snippets by developing a weakly supervised temporal discriminative paradigm. Also, the study [21] achieved high accuracy in detecting anomalies in images by considering the uncertainty and diversity of anomalies.
The k-means algorithm grouped k clusters and was then used in Predictive Analysis Library (PAL) for anomaly detection [17]. Points far away from the centroid were identified as anomalies. Another study [18] focused on reading digits from house number signs in street-level images with unsupervised learning, which is a difficult computer vision problem. This research included two stages: a detection stage and a recognition stage. However, digit recognition is much easier than letter recognition. In [23], researchers identified characters in scenic images, which is another challenging recognition problem, by applying machine learning methods. Christlein et al. [20] used deep Convolutional Neural Networks (CNNs) in an unsupervised manner. Pal et al. [24] focused on handwritten English character recognition.
With the advancement of deep learning techniques, HCR has achieved significant progress in recent years [25]. ML algorithms have shown promising results in HCR. Support Vector Machines (SVMs) have been used to recognize handwritten characters with high accuracy [26–28]. SVMs are supervised learning algorithms that separate different classes by constructing a hyperplane in a high-dimensional space. They are highly effective in HCR applications and are widely used in the field. Another popular approach is Deep Learning, which has shown state-of-the-art results in many computer vision applications, including HCR. CNNs have been extensively used in HCR due to their ability to automatically learn hierarchical representations of the input images. CNN-based models have achieved outstanding performance on benchmark datasets such as the MNIST dataset [29]. Additionally, CNNs have also been used in HCR for sequence labeling tasks, where the output is a sequence of characters. The method that used the Long Short-Term Memory (LSTM) networks was shown to be highly effective in recognizing cursive handwriting [30]. One of the challenges in HCR is dealing with variations in handwriting styles, writing speeds, and quality of the input images. To address these challenges, researchers have used data augmentation techniques to increase the size of the training data and reduce overfitting. Data augmentation techniques include rotation, scaling, and translation of the input images.
There are several variations in peoples’ handwriting. However, the results showed high recognition accuracy and minimal training time. Based on the aforementioned studies, there is a trend toward less invasive data mining technologies that can achieve better accuracy rates with the combination of supervised and unsupervised techniques. The present research offers a hybrid Multi-Layer Perceptron Neural Network (MLPNN) anomaly detection approach as one of the image recognition solutions. The objective of this research is to categorize and forecast the handwriting of people to properly recognize the presence of English handwritten letters. Recognition is the process of determining the distinction between types of letters from A to Z. Once a letter is recognized, it is vital to classify the predicted shape of the letter. More notably, this study examines the anomaly detection methodology as an unsupervised learning method and an efficient artificial neural network model. The distinction between the MLPNN anomaly detection method and other classification approaches is that the hybrid approach incorporates a clustering result as an input feature, which may enhance the letter recognition prediction rate. Other classification models utilize features from the original dataset as input. Additionally, the anomaly detection algorithm may automatically group the handwritten letter dataset to find related samples and attributes. As a result, the correlation between input characteristics may be boosted, which assists the classifier in retrieving correct results.
Moreover, it is significant to identify any unusual behavior without the need for human intervention [31]. Anomaly detection methods can be discussed according to two approaches: (1) conventional or traditional feature-based approaches, and (2) deep feature-based ones [31]. The traditional feature-based methods were applied in the past in three main stages: Feature extraction, feature learning, and outlier detection. In contrast, deep feature-based methods were applied successfully on nonlinear high-dimensional data such as video summarization [32]. The model in [32] was applied to four different datasets to detect anomalies by running in three different steps: shot segmentation, feature extraction, and sequence learning and anomaly classification. The final results showed overall accuracy improvement and false alarm rate reduction. These studies demonstrate the effectiveness of various machine learning methods in improving the accuracy and efficiency of handwritten character recognition. These methods can be further developed to enhance the performance of HCR systems and to extend the applications of handwriting recognition in areas such as document analysis, OCR, and computer vision.
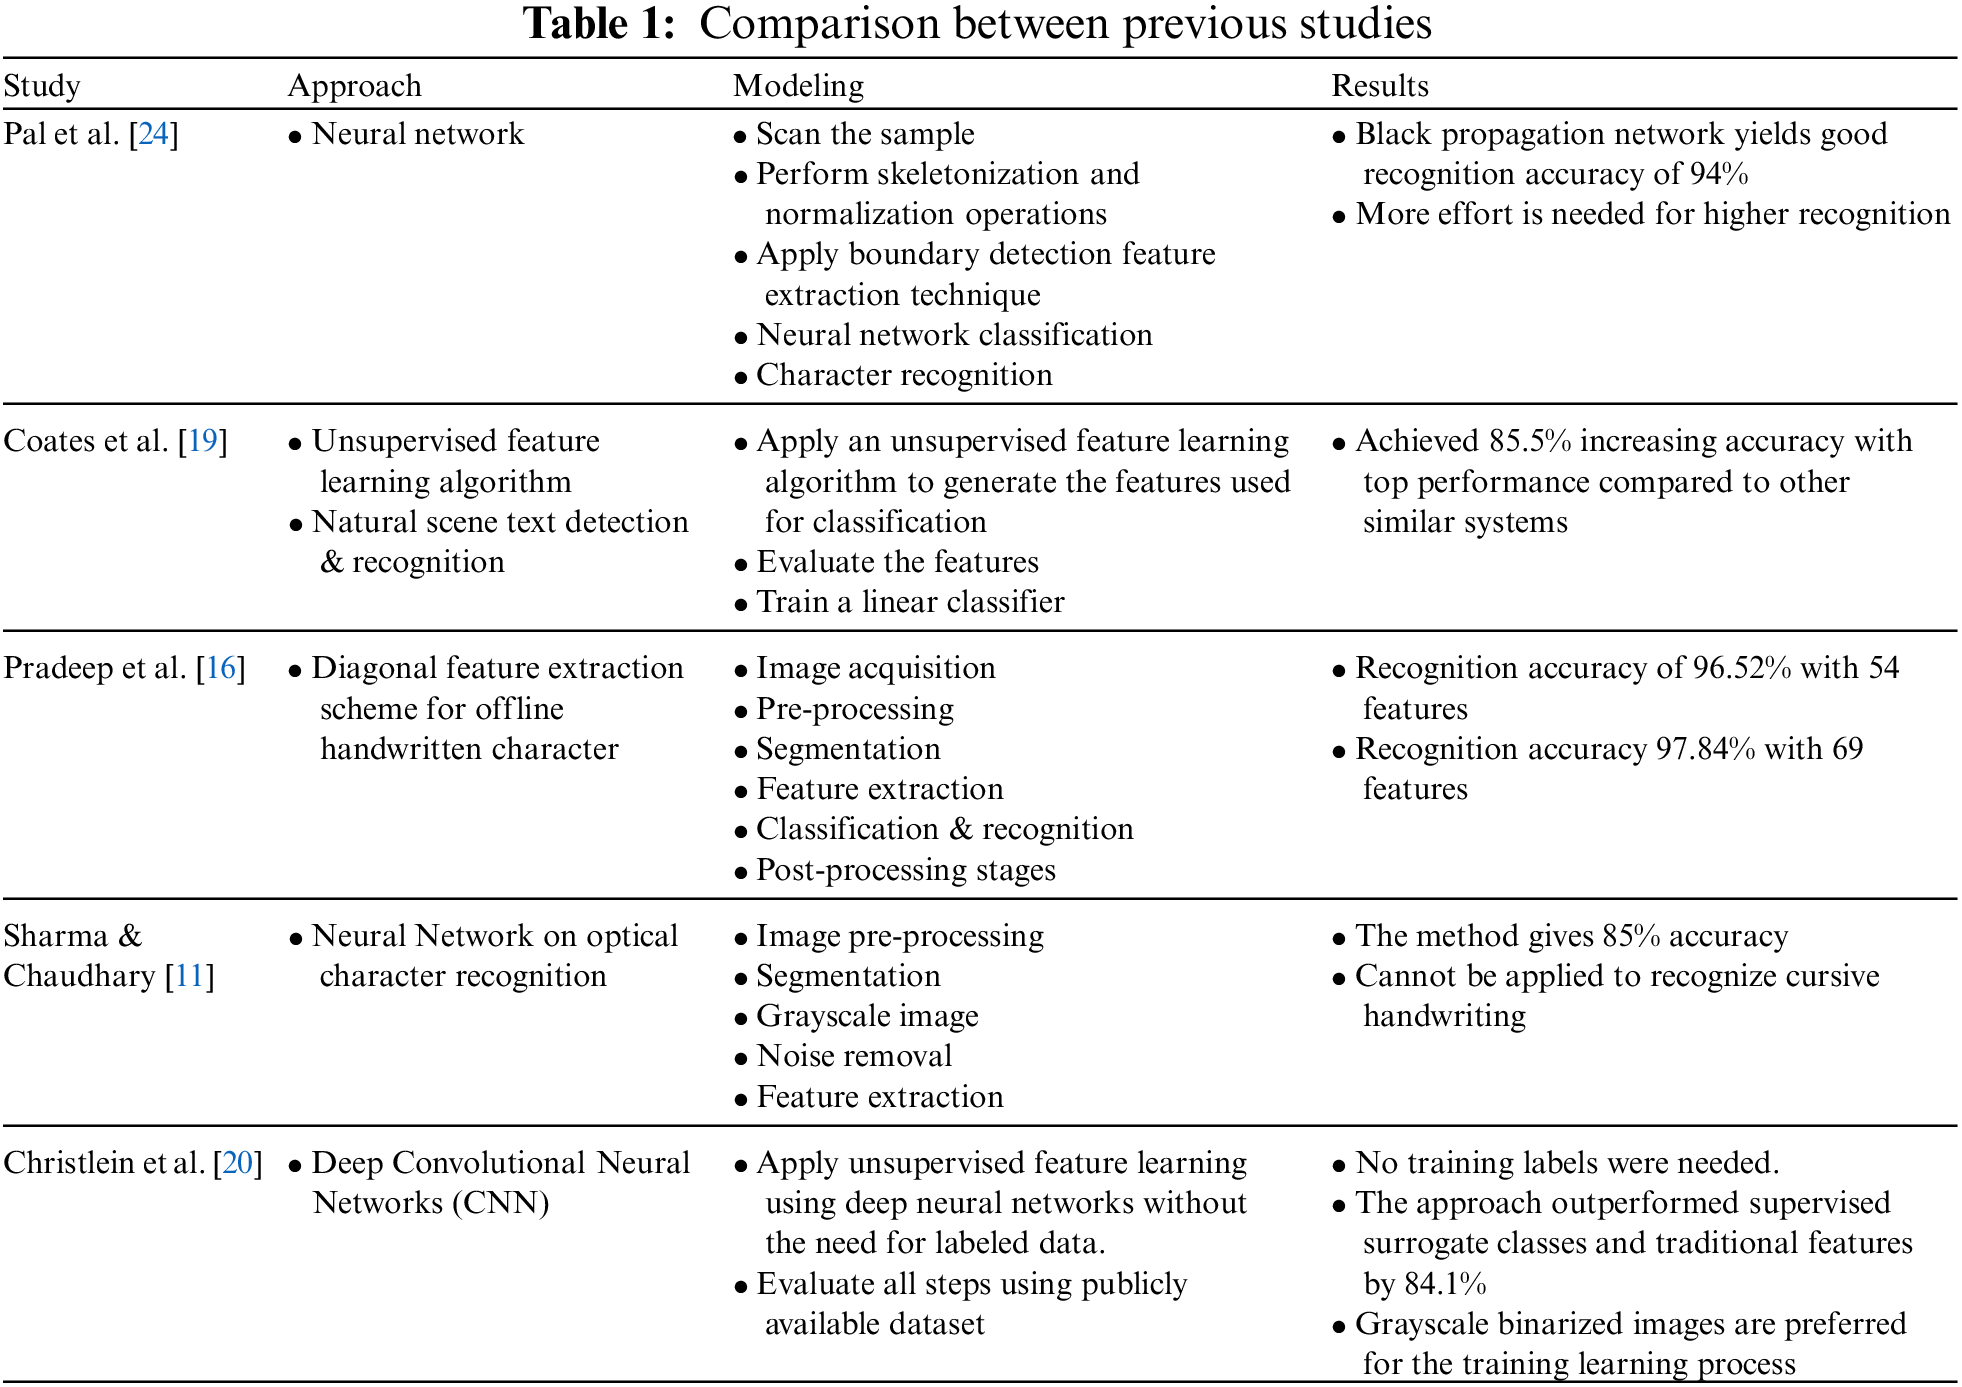
Previous research has focused on increasing recognition accuracy and reducing processing time [19]. The model in [24] first scans the sample then performs skeletonization and normalization operations and applies boundary detection techniques to extract input features. After that, the neural network classification is applied to recognize the characters. The results of [24] showed that black propagation networks yield a good recognition accuracy of 94%. However, more effort is needed for higher recognition. The study [19] applied an unsupervised feature learning algorithm to natural scene text detection and recognition. This approach achieved 85.5% increasing accuracy with top performance compared to other similar systems. The study [16] introduced a diagonal feature extraction scheme for an offline handwritten character model. The results of this model showed a recognition accuracy of 96.52% with 54 features and a recognition accuracy of 97.84% with 69 features. Further, the study [11] presented their neural network on an optical character recognition model. The process of this model includes image: pre-processing, segmentation, gray scaling, noise removal, and feature extraction. The method gives 85% accuracy, but it cannot be applied to recognize cursive handwriting. Finally, the study [20] introduced a deep CNN model. This model applies unsupervised feature learning using deep neural networks without the need for labeled data. No training labels were needed by the model. This approach outperformed supervised surrogate classes and traditional features by 84.1%. Also, grayscale binarized images are preferred for the training learning process. Table 1 shows the approach, presented model and results of the previous studies.
The present study focuses on the unsupervised anonymous detection algorithm for the English language. The English language is written from left to right and consists of 26 characters (21 constants and 5 vowels). The output target is the nonbinary classification consisting of 26 capital letters. The goal of this article is to use a hybrid technique by combining an anomaly detection algorithm and a multilayer perceptron network (MLP) to increase accuracy recognition.
This model is built using an anomaly detection algorithm on top of MLP. The first step in the model is to apply the anomaly detection algorithm on an unlabeled dataset to detect outliers in the data by studying its internal structure. The assumption in this paper is that using the anomaly detection algorithm to cluster the data and feed the output data coming from the anomaly algorithm to the MLP will enhance the system’s accuracy while recognizing the data [18].
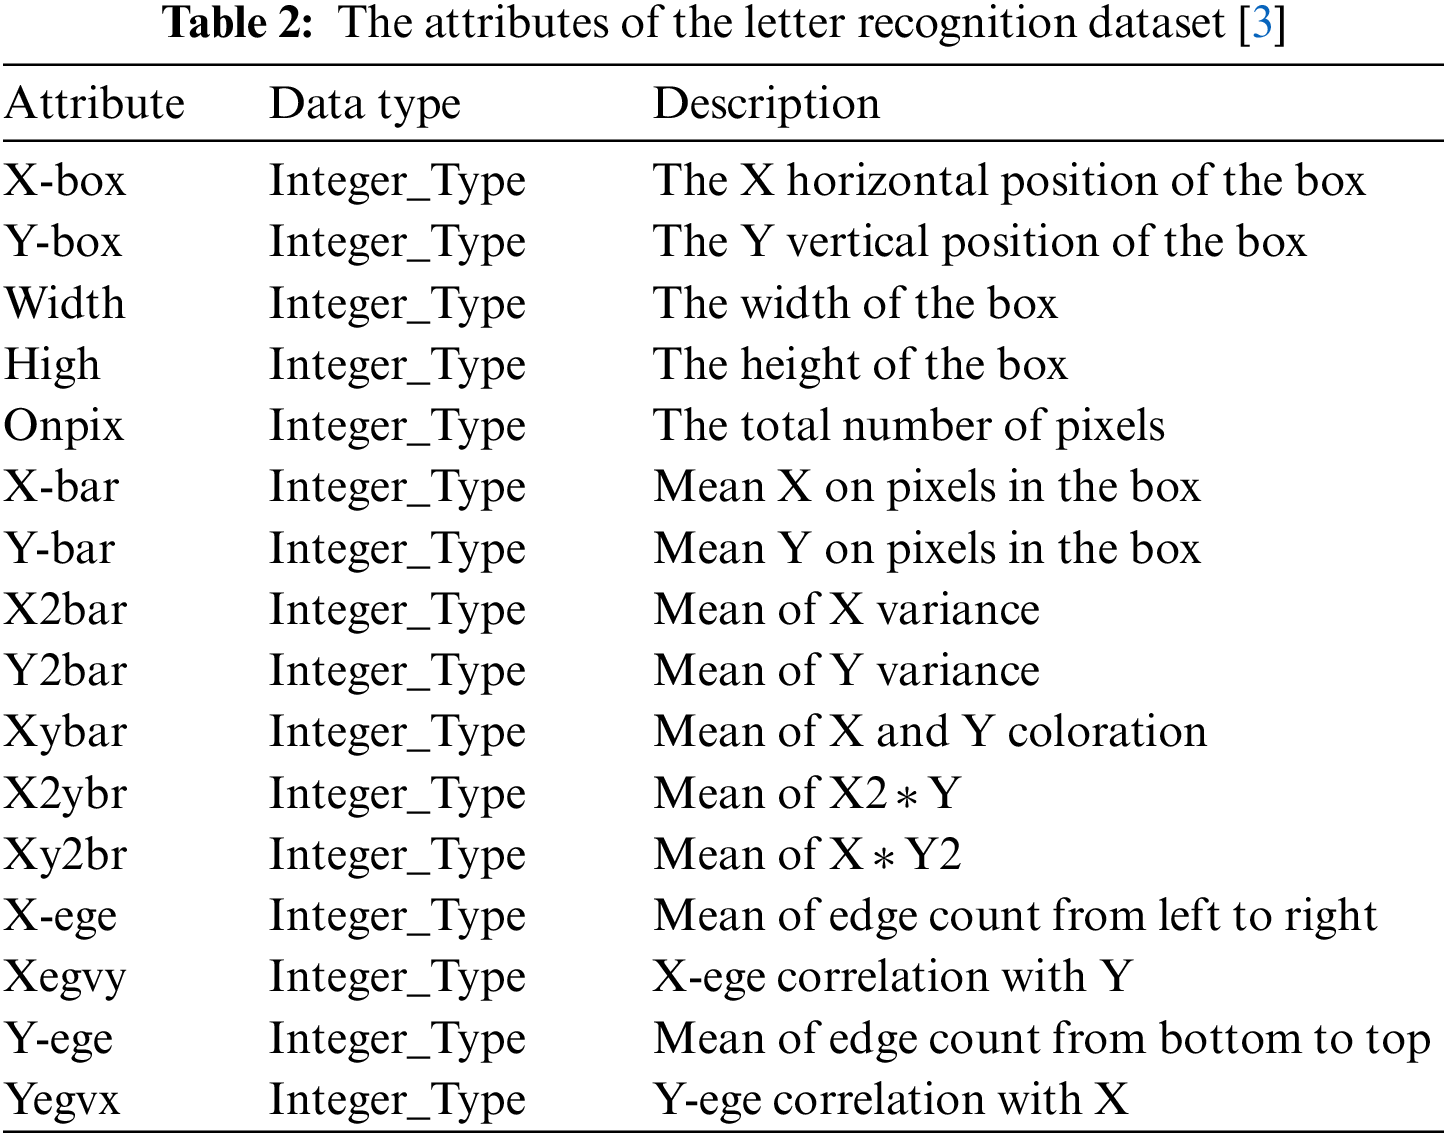
The dataset of this model is preprocessed data that were donated by [23]. The dataset consists of 20.000 records that represent the twenty-six capital English letters from (A–Z) from twenty different font styles. The letters were randomly distorted to generate 20000 records in the dataset file with sixteen different features for each record. The features of letters from A–Z were represented in the dataset as numeric attributes, as shown in Table 2. The dataset has no missing values and was built to be associated with classification [23].
3.2 Anomaly Detection Algorithm
Anomaly detection simply finds outliers in the data, which do not fit the expected patterns within the data. The anomaly algorithm generally detects any information that can be used in comparison to recognize anomalies. Anomaly detection can be applied to achieve supervised, unsupervised, or semi-supervised learning. In this model, the dataset that is fed to the algorithm is unsupervised. To maximize the prediction accuracy of the model, the input dataset was first analyzed to cluster the inputs according to their anomalies. The anomaly algorithm divides the data into groups by learning the behavior of the input dataset and identifying the outliers of the incoming input. To accomplish this, the algorithm runs three stages in the following order: modeling, scoring, and reasoning [28]. This technique searches for outliers in cluster groupings. Before inferential data analysis, outliers are quickly detected for data verification purposes. This method is designed for general anomaly detection, meaning that the definition of an anomaly is not industry-specific, such as detecting strange payment patterns in health care or money laundering in finance. The algorithm consists of three main steps (see Fig. 1).
• Modeling. Each case is assigned to a cluster based on how closely it matches a set of input variable values. The cluster model is used to determine the cluster group of a case and the data required to compute the cluster group norms are retained.
• Scoring. Each instance is input into the model to identify its cluster group, and indices are created for each instance to quantify its uniqueness considering its cluster group, as described above. All instances are classified based on the values of their anomaly indices. “Anomalies” are displayed in the upper right corner of the case list.
• Reasoning. For each anomalous occurrence, the variables are ranked in descending order according to their corresponding variable deviation indices. The top variables, their values, and the associated normal values for each of the top variables are provided as justification for classifying a case as an anomaly.
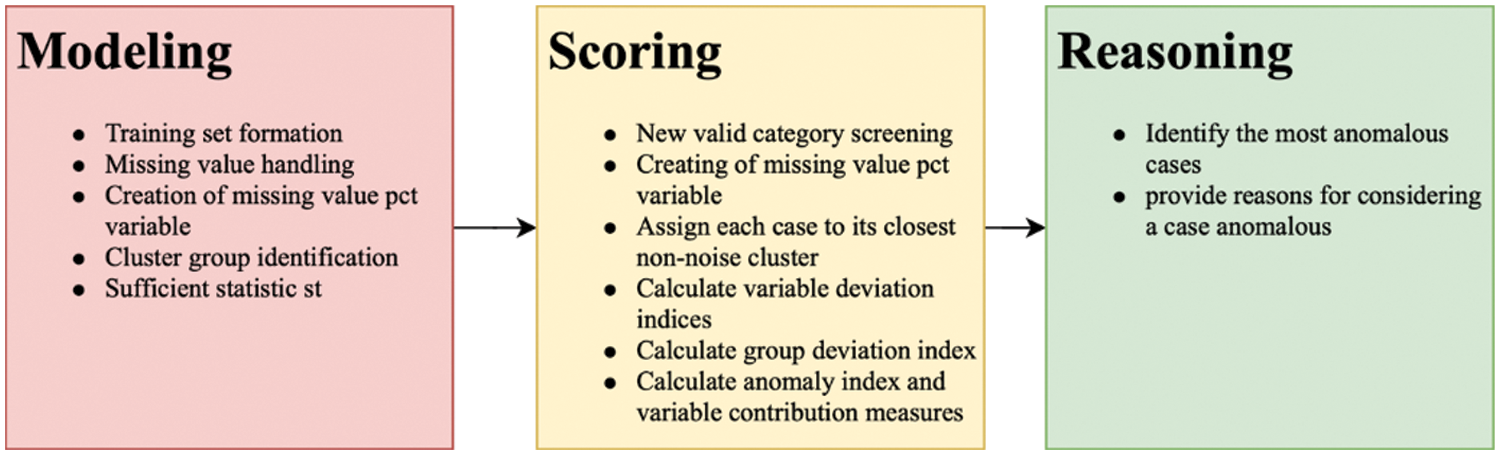
Figure 1: Anomaly detection process
Fig. 1 highlights the different functions for the three main steps in the process of the anomaly detection algorithm.
Another straightforward, obvious, and often successful way to detect anomalies is to use clustering algorithms to address the density estimation problem. Then, every occurrence located in areas with a lower density level may be classified as an anomaly; defining a density threshold is required.
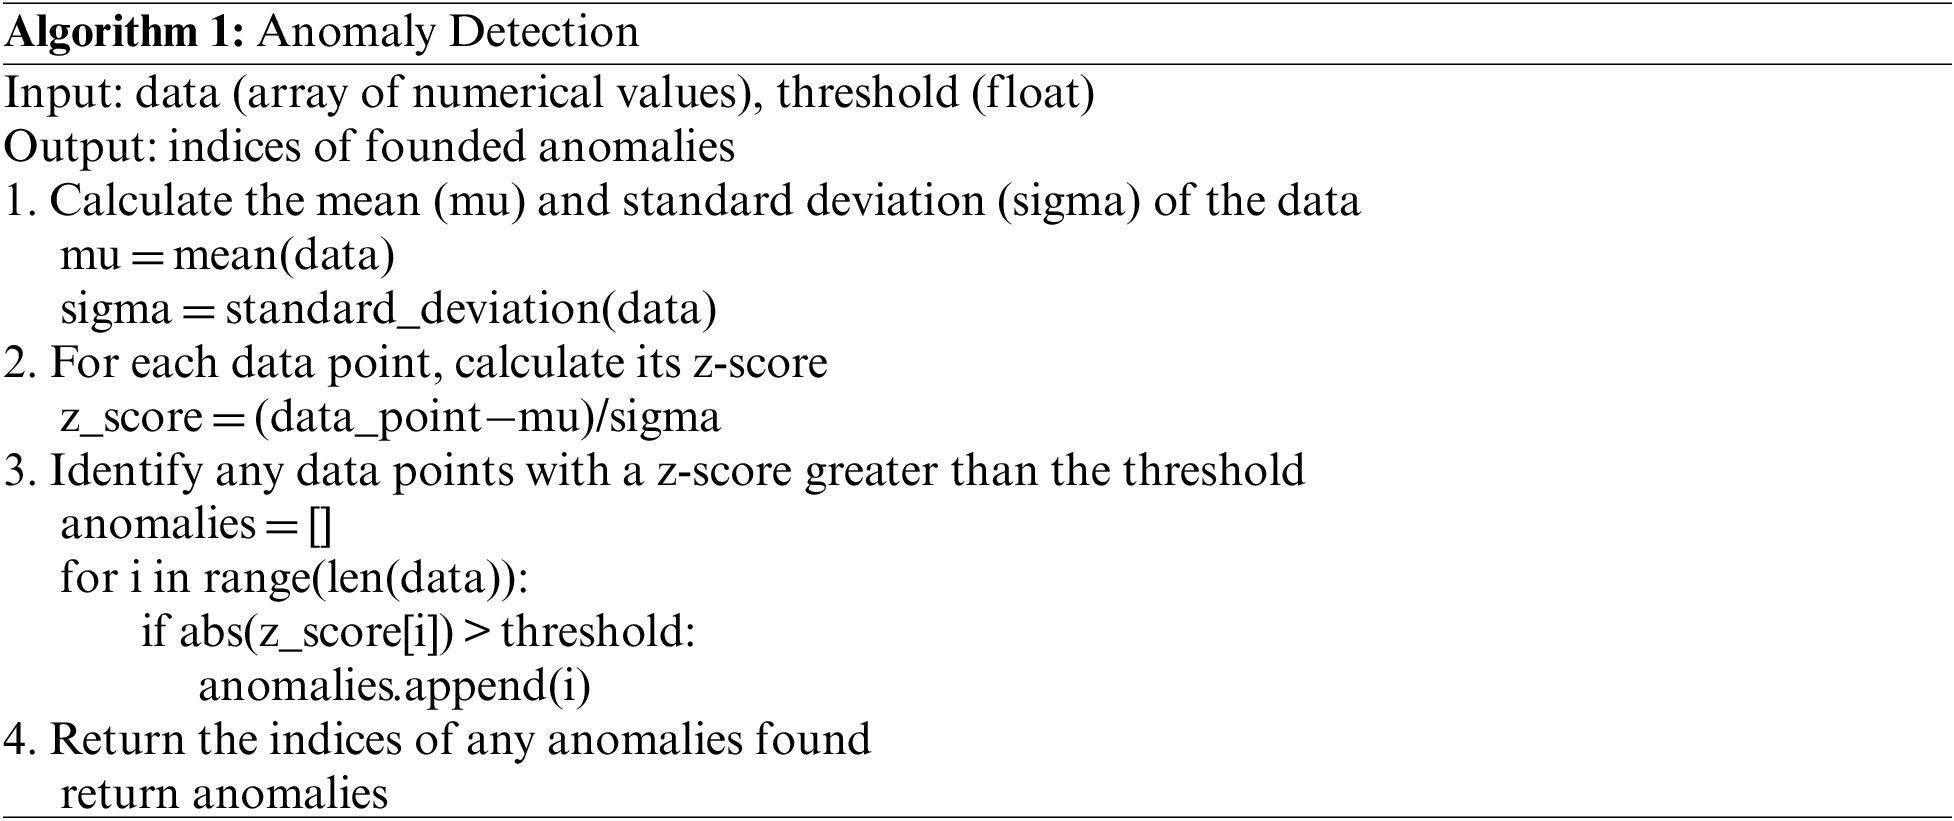
Anomaly detection is a technique used to identify outliers or anomalies in a dataset. These anomalies can represent errors or rare events that deviate from the normal behavior of the system being analyzed. The goal of anomaly detection is to detect these anomalies in real-time, allowing organizations to take appropriate actions to address them. There are various algorithms and techniques used for anomaly detection, including statistical-based methods and machine learning-based methods. Statistical-based methods, such as the Z-score and the Mahalanobis distance, are based on the assumption that the data follows a normal distribution. These methods calculate the mean and standard deviation of the data and use these statistics to identify outliers that deviate significantly from the mean. On the other hand, machine learning-based methods are more flexible and can handle non-normal distributions. These methods can be further divided into supervised and unsupervised methods. Supervised methods train a model on a labeled dataset and use it to classify new data points as normal or anomalous. Unsupervised methods, such as clustering and density-based methods, do not require labeled data and instead identify anomalies based on the distribution and density of the data points. One of the most popular machine learning-based methods for anomaly detection is the Isolation Forest algorithm. This algorithm is an unsupervised method that uses decision trees to isolate anomalies in the data. The Isolation Forest algorithm works by randomly selecting a feature and a split value and isolating a data point with each split. Points that are isolated in fewer splits are considered anomalies. Another widely used machine learning-based method for anomaly detection is the One-Class Support Vector Machine (SVM). This method is a supervised method that trains a model on normal data and uses it to identify anomalies. The One-Class SVM algorithm works by finding the hyperplane that separates the normal data points from the origin, with the largest margin possible. Points that are far from the hyperplane are considered anomalies.
In the modeling stage, the algorithm runs several tasks in sequence. The first task is to format the training set by removing all cases with values greater than 1.0E + 150 and to remove any missing value cases if the algorithm that handles missing values is not working effectively. The resulting dataset will be the inputs that will be used to construct the anomaly model. The second task in the modeling stage is to handle the missing values by calculating two means for the input variable Xk: the grand and the grand standard deviation, where k = (1, 2, 3, …, K) and the Xk value is continuous. The handler algorithm replaces all the missing values found in Xk by its grand mean and then categorizes all the missing values found in a group of missing values. The new category will be considered a valid category in the model. The third task in the modeling stage is to create the pct variable for the missing values by computing the scoring data for any new variable created in the modeling stage. During the anomaly detection process, the “pct” variable related to missing values signifies the ratio or percentage of unavailable data within a provided dataset. When examining data, it is typical to come across missing values, which denote entries or observations that lack recorded values for specific variables. Then, the algorithm identifies the cluster group based on the input variables Xk, where k = 1, …, k + 1 using a two-step clustering algorithm that considers turning on the noise handling process. The final task in the modeling stage is to store the cluster model and all of the above-computed statistics to be used during the scoring stage [28].
In this stage, the training and testing data are scored. The scoring stage is performed by running several tasks to finally score the data. The first task in the scoring stage is to define all new valid categories. To score the data, the algorithm accepts input variables Xk, where k = 1, …, k from the training dataset. The format of the scoring data variables must be similar to the format of the training data in the modeling stage. Any case in the scoring data that included a valid categorical variable is eliminated if the same variable does not belong to the training dataset. The second and third tasks of the scoring stage are optional: to handle the missing values and create the pct variable for the missing values. The process of these two tasks is explained in the modeling stage section above [28]. Then, the scoring states run the fourth task by defining the cases based on the closest non-noise cluster. During the modeling stage, each variable in the scoring data file is processed, and a cluster ID is created for every case of the data. All the cases that belong to the noise cluster will be recategorized to the nearest corresponding non-noise set [28]. Then, the fourth task of the modeling stage is to compute the deviation indices for every variable. For example, suppose there is a case c and the closest cluster found to it. Computing the deviation index of Xk is determined according to the contribution dk (s, c) of Xk and the Xk log-likelihood distance d (s, c). If the Xk value is continuous, the norm value of Xk donates the mean of the cluster sample of Xk. Otherwise, Xk is the categorized norm value of Xk that represents the cluster mode of Xk. The last two tasks of the modeling stage are to compute the deviation index for every group and the anomaly index. The deviation index of the group for every case is the sum of deviation indices for the variables. In contrast, the anomaly index is calculated based on the ratio of the group deviation index of the cases to the average of the group deviation index of the corresponding cluster. At the end of the scoring stage, all the cases will be assigned with group deviation and anomaly indices along with a variable deviation index set and contribution measures to be used during the reasoning stage. In the reasoning stage, the cases will be ranked to determine the anomalous cases based on this ranking. Marking the anomalous case is achieved by sorting the cases according to their anomaly values from smallest to largest. The percentage of the topmost anomaly case or the highest number of anomaly cases will give the list of anomalies. Only cases that are greater than a prespecified value that determines the cut-off point of an anomaly will be marked as anomalous cases. After defining the anomalous cases, the algorithm begins analyzing the anomalies of the cases by first sorting the variables in descending order according to their deviation index. After that, the following values will be marked as reasoning values: the names of the top k anomalies, the associated original variable, and the normal values. In conclusion, the anomaly algorithm is applied in this model to detect the anomaly of the dataset. According to the similarities of the incoming data, the algorithm clusters the dataset into thirteen different anomaly groups. These groups are then fed to the multilayer neural network for further analysis [28].
The neural network (NN) architecture was inspired by parallelism features of the human brain in analysis and recognition. The basic unit in NN is the perceptron or the node that accepts an input and an associated wait with that input [29]. The NN algorithm that was applied in this mode is MLP. An MLP is a feed-forward method that solves nonlinear problems where the solution can be a set of possible outputs (e.g., the set of twenty-six letters from A to Z). The MLP network contains the following layers: the input layer, at least two hidden layers, and an output layer. Each layer is built out of multiple nodes that accept the output coming from the previous layer.
Artificial Neural Networks (ANNs) are computational models inspired by the structure and functioning of the human brain. These models have been extensively used for various applications, including image recognition, speech recognition, and natural language processing. One of the most popular forms of ANNs is the Multi-Layer Neural Network (MLNN). MLNNs, also known as Deep Neural Networks (DNNs), are neural networks that consist of multiple hidden layers between the input and output layers. The hidden layers are used to extract high-level features from the input data and allow the network to model complex relationships between the input and output variables. The basic building block of an MLNN is the artificial neuron, also known as a perceptron. A perceptron takes in a set of inputs and produces a single output based on a set of weights and a bias term. The outputs of multiple perceptrons are then combined to produce the final output of the network. The training of an MLNN involves adjusting the weights and biases of the neurons so that the network can accurately predict the output for a given set of inputs. This is done using a supervised learning algorithm, such as gradient descent, which iteratively adjusts the weights and biases to minimize the error between the predicted and actual outputs.
The MLPs are highly effective for modeling intricate non-linear connections between inputs and outputs. They possess the capability to approximate any continuous function with high precision, as well as exhibit resilience towards noise and outliers, flexibility, and parallelization capabilities. As such, they can be applied to diverse fields as a versatile tool. One of the key advantages of MLNNs is their ability to model complex relationships between the inputs and outputs. This is achieved through the use of multiple hidden layers, each of which can extract different features from the input data. This ability to model complex relationships has made MLNNs particularly useful for tasks such as image and speech recognition, where the relationship between the inputs and outputs is highly non-linear. Another advantage of MLNNs is their ability to perform well on large datasets, thanks to their ability to learn hierarchical representations of the data. This is particularly useful for applications where the input data is high-dimensional and complex, as it allows the network to learn high-level abstractions from the data that can be used for predictions. However, MLNNs also have some limitations. One of the main limitations is the difficulty in training the network, especially for large datasets. This is due to the complex structure of the network, which can result in overfitting and slow convergence of the learning algorithms. Fig. 2 shows the structure of the MLP for recognizing English letters with several hidden layers [28–30].
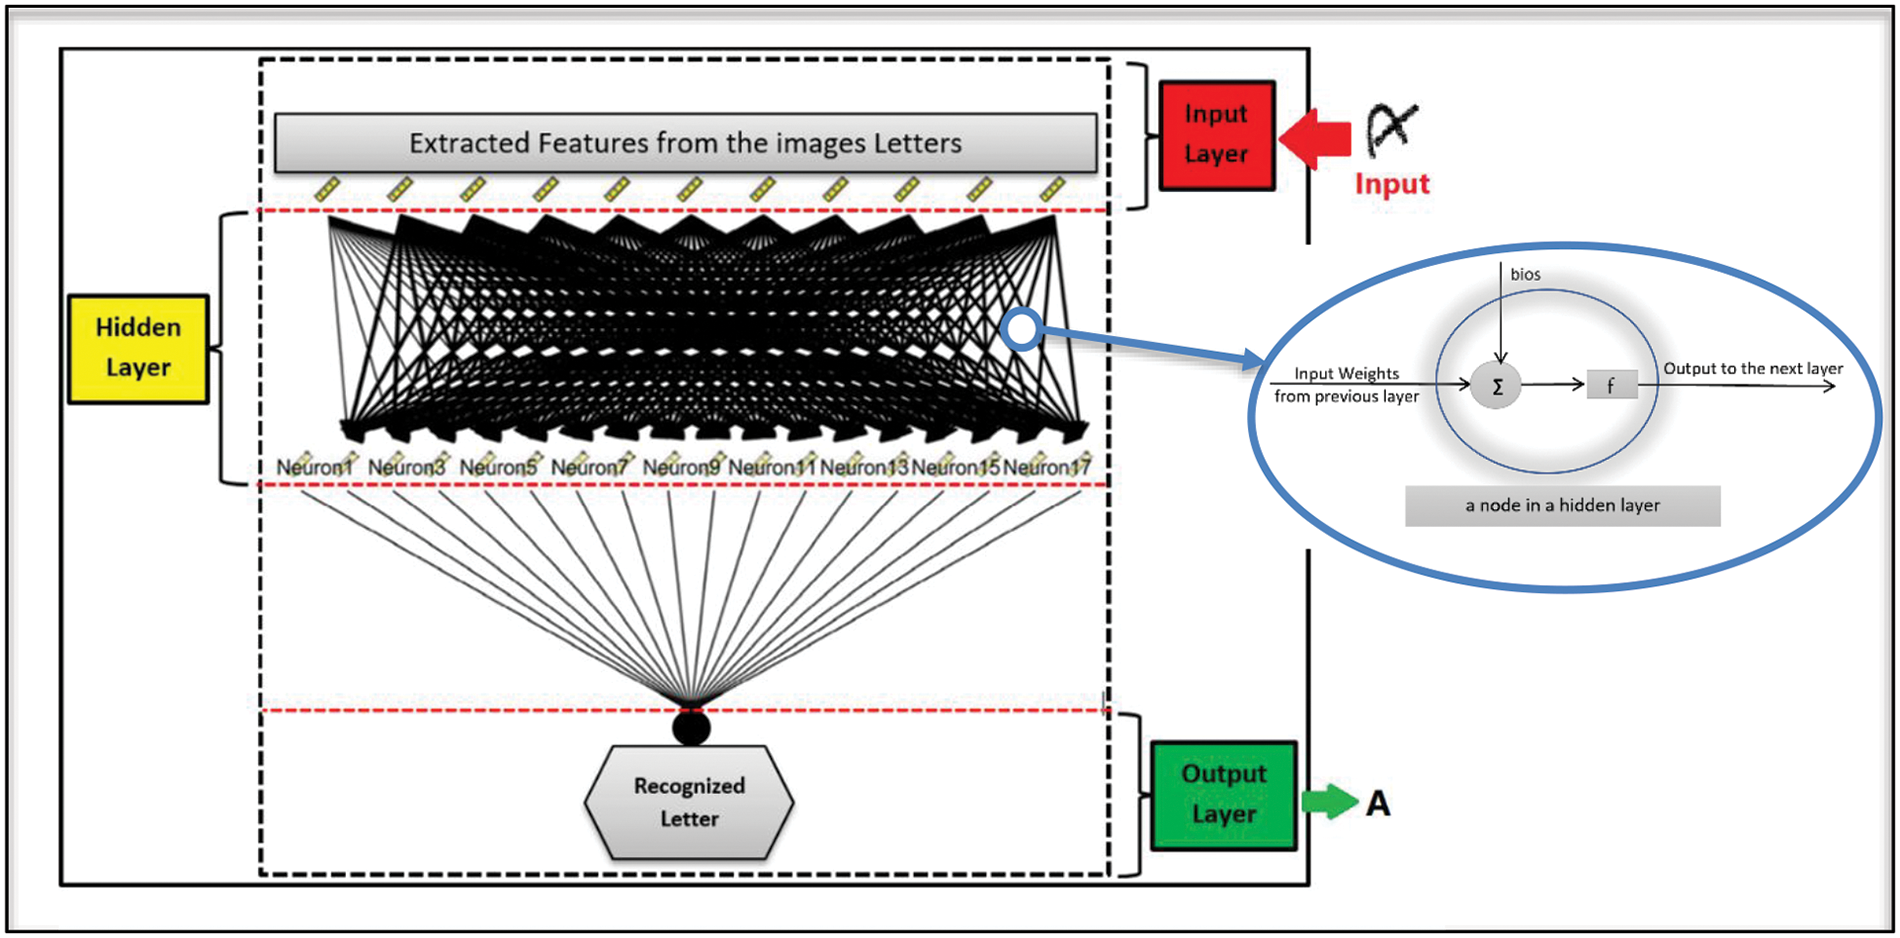
Figure 2: Multi-layer perceptron neural network
In the beginning, each node in the input layer accepts the incoming features of the letters from A to Z along with the thirteen different features extracted by the anomaly algorithm. Each layer in the network consists of multiple nodes where the computation is applied to generate the correct output. Every node accepts the data inputs coming from the previous layer. The incoming inputs are associated with corresponding weights that either increase or decrease the probability of activating the node. Activating the node means that the algorithm predicts that the incoming input has the feature that the current node represents. Based on the activated nodes of the first layer, the next layer will function. Therefore, it is significant for the algorithm to set up the correct weight for each input to minimize false-positive results. Setting up the weights for each input node is the first phase of the system called the learning phase. During the learning phase, the system starts to apply the incoming dataset to develop input weights that will generate the most accurate prediction of the output. A portion of the input dataset will be fed to the network to learn and predict the weight for each node. In this model, the dataset was divided with learning: testing ratios of 90:10, 80:20, 70:30, 60:40, and 50:50. The accuracy of the model was tested for each ratio. The architecture of the MLP network is generally built as follows:
• Input layer (1) has m different incoming inputs {x1:1, x1:2, …, x1:m}, and each input is assigned a weight w, where x1:I = wi [28].
• From 2 to i hidden layers, each layer accepts input from its previous layer, where for the jth layer, the layer has nodes {xj:1, xj:2, …, xj:n} with a weight of xj:k = ϒ (∑j = 0n−1 (wi:j k xi−1: j)), where xi−1:0 = 1. The function ϒ denotes the hyperbolic tangent activation function that is applied for the hidden layers, and ϒ(c) = (ec−e−c)/ec + e−c, where c denotes the ∑ function.
• Output layer (O) has {xO:1, xO:2, …, xO:L} number of nodes with the weight of xO:k = ϒ (∑j = 0L (wO:j k xi−1: j)), where xi−1:0 = 1. The function ϒ denotes the identity activation function that is applied for the output layer with a continuous target, where ϒ(c) = c, where c denotes the ∑ function [28].
The pseudocode of the anomaly detection is shown in Algorithm 1.
As mentioned above, the most important task is to assign a weight for every node. The correct weight assignment increases the accuracy of predicting the correct output based on the incoming features. The weights for the nodes are set up during the training phase in three steps. The first step is to randomly initialize the weight and run the model to compute the resulting error function based on the assigned weight. The error function runs the backpropagation algorithm for this computation. Then, based on the results coming from the error function, the MLP algorithm reassigns the weight and reruns the error function. The MLP algorithm will continue the training phase as long as the training error ratio is larger than .01 and will stop if the ratio is less than or equal to .01 or when the algorithm reaches an initial stopping number of loops K3. If the MLP algorithm stops due to an error ratio <= 0.01, then the algorithm will use the resulting weights for the next phase: the testing phase. Otherwise, the algorithm will use the weight set that has the minimum error ratio for the testing phase [28].
One aspect to avoid during the testing phase is overfitting or underfitting data. Overfitting of the data occurs when the model performance increases in the training phase and decreases in the testing phase. This happens due to the memorization of the training data by the model rather than generalization [33]. In contrast, underfitting the data occurs when the model performance drops during the training phase. This situation occurs when the model cannot determine the relationships between the inputs and the target values for each input. In the learning phase for any model, the goal is to achieve a balance where the model learns from the input examples and generates weights for each input example to increase output accuracy [30].
The proposed technique is a hybrid method for predicting handwritten letter recognition datasets using anomaly detection and MLPNN methods. This method consists of two sub-methods: anomaly detection grouping based on letter feature similarity and outliers and MLPNN-based classification of handwritten letter recognition datasets. The goal of this study is to offer a handwritten letter identification methodology that utilizes a hybrid anomaly detection algorithm and an MLPNN prediction method to improve classification accuracy (effectiveness) and minimize misclassification rates.
The algorithm works as follows:
• Anomaly Detection: The first step is to use anomaly detection techniques to identify the letters that deviate significantly from the average shape of the letters in the dataset. This is achieved by computing the Mahalanobis distance between each letter and the mean shape of the letters in the dataset.
• MLPNN Classification: The next step is to use MLPNN to classify the letters that were not identified as anomalies in the previous step. This is done by training the MLPNN on a subset of the data that consists of letters that are similar in shape to the letter being classified.
• Combining the Results: Finally, the results of both anomaly detection and MLPNN are combined to form the final prediction for the letter being recognized. If the letter is identified as an anomaly in the first step, the prediction is based on the Mahalanobis distance. If it is not an anomaly, the prediction is based on the output of the MLPNN.
This hybrid method takes advantage of the strengths of both anomaly detection and MLPNN, allowing for more accurate recognition of handwritten letters.
This work establishes a novel strategy by combining the supervised and unsupervised learning approaches of anomaly detection and MLPNN techniques. This yields the hybrid anomaly detection algorithm and MLPNN prediction process that is demonstrated in Algorithm 2.
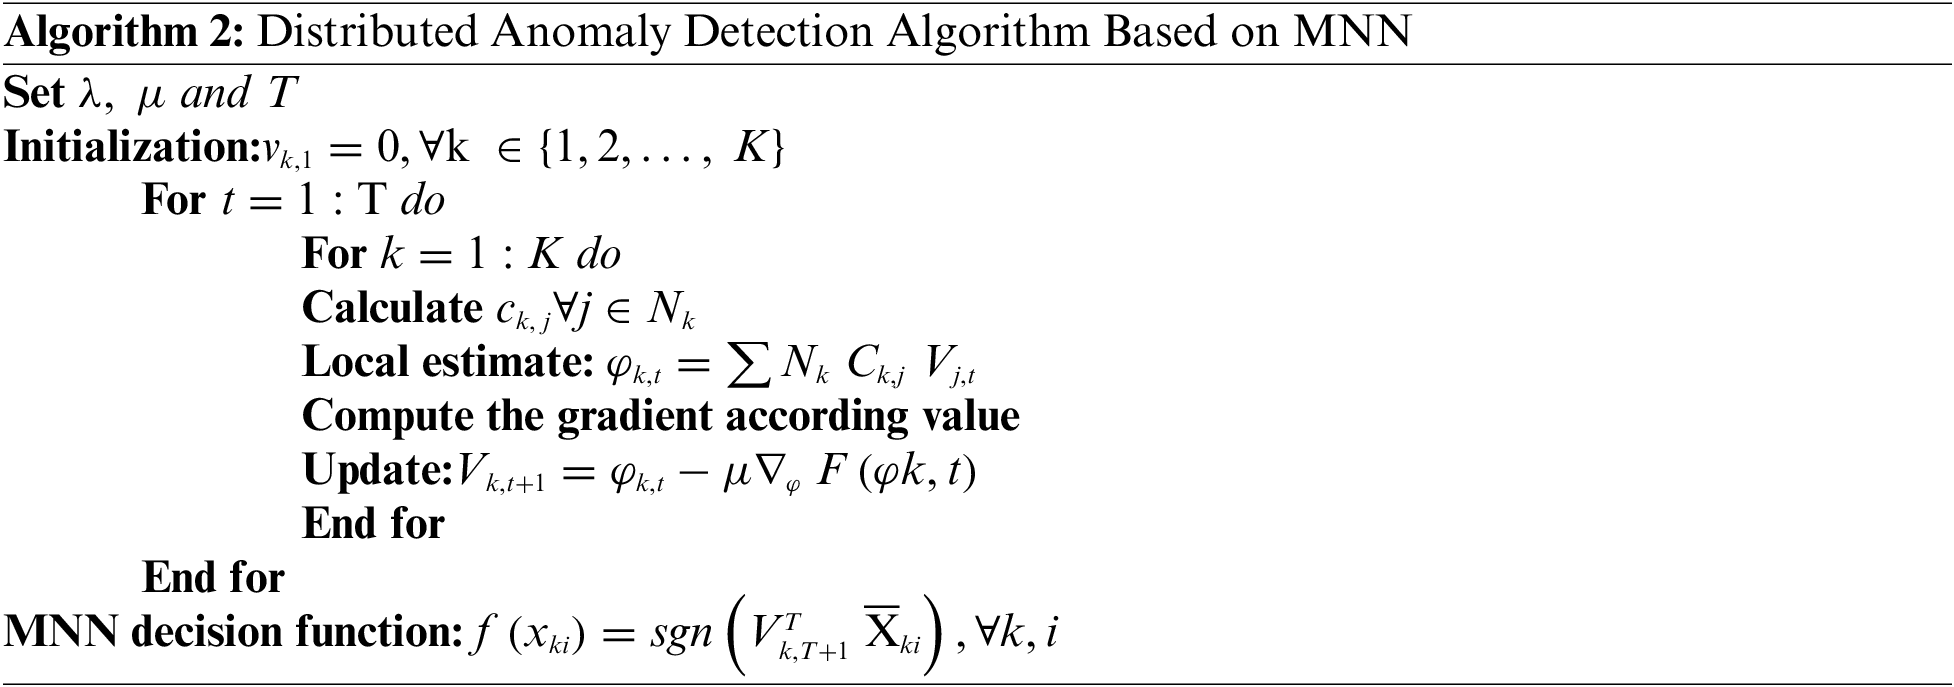
The notations of Algorithm 2 can be defined as follows:
• MNN: Multi-layer Neural Network
• decision function: The function used to make decisions or predictions
• anomalies detection: The process of identifying anomalies or unusual patterns in the data
• node k: Refers to a specific node in the MNN architecture
• Set μ, T, and λ: These are variables that need to be set or predefined before executing the algorithm Their specific purposes and values are not provided in the given context
• vk, 1: Represents an initial value for variable vk at time step 1 for node k
• For t ←−1 to T Do: A loop that iterates from time step 1 to time step T
• For k ←−1 to T Do: A loop that iterates through each node from 1 to T
• ck, j: Represents a specific computation or calculation for variable ck corresponding to node k and j, where j belongs to the set of neighboring nodes Nk
• Local estimate ϕk, t: Refers to a local estimation or calculated value at time step t for variable ϕk related to node k
• ΣjNk ck, j vj, t: The summation of the computed values ck, j multiplied by the corresponding vj, t for each neighboring node j of node k
• Compute the gradient according to rate: Indicates the computation of the gradient according to some specified rate or method. The specific details of the gradient computation are not provided in the given context
• Update vk, t + 1: The update of variable vk from time step t to t + 1 based on the calculated ϕk, t, μ (the learning rate), and the gradient ∇ϕ F (ϕk, t)
• MNN decision function f(xki): Refers to the decision function used for the MNN, which takes the input vector xki and calculates the corresponding decision or prediction. The specific calculation involves using weights wi, a bias term b, and the input features xki
This hybrid technique is considered to examine the trained method’s output. Due to the very large number of instances associated with handwritten letter recognition data, the dataset was divided into 10 sections for training and testing the anomaly detection MLPNN algorithm using 5-fold cross-validation. The anomaly detection ADMLPNN stages of the presented approach are shown in order in Fig. 3.
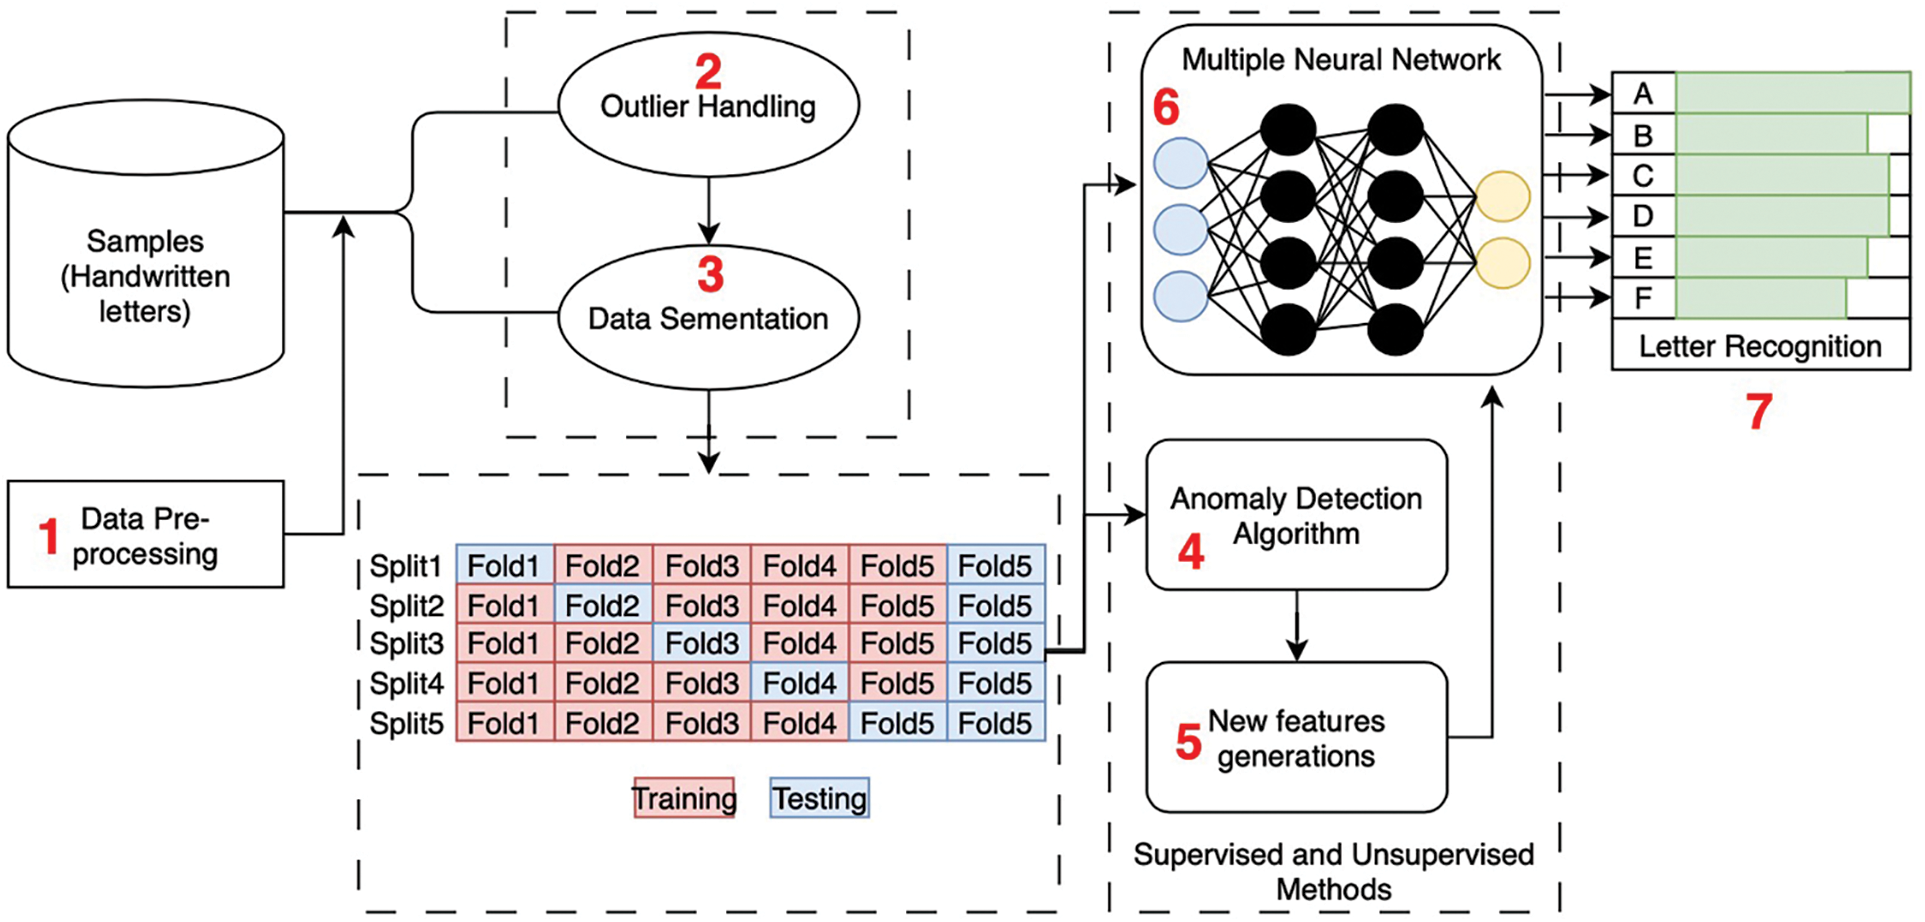
Figure 3: Hybrid anomaly detection MLPNN approach
In this study, the researchers aimed to evaluate the performance of a newly proposed method for handwritten letter recognition. They conducted an experimental design using the UCI handwritten letter recognition dataset.
To assess the accuracy of the letter identifier, the researchers employed a testing approach called anomaly detection MLPNN training with 5-fold cross-validation. This means that they divided the dataset into five subsets or folds. They trained the model on four of these folds and evaluated its performance on the remaining fold. This process was repeated five times, with each fold serving as the test set once.
The researchers partitioned the dataset into different proportions for training and testing. They used the following training set sizes: 50%, 60%, 70%, 80%, and 90%. Correspondingly, the test set sizes were: 50%, 40%, 30%, 20%, and 10%. For each combination of training and test sets, they performed a rotation of each slice of the training set with the corresponding group of testing data. This rotation helps ensure that the model is trained on a diverse range of examples and tested on different subsets of the data.
The anomaly detection approach was used to classify the handwritten letters based on their properties, specifically their comparable class letter properties (from A to Z). The algorithm extracted four distinct groups based on the letter properties and the number of occurrences. Group 1 had 6590 instances, group 2 had 5943 instances, group 3 had 5759 instances, and group 4 had 1708 instances.
Fig. 4 in the study illustrates the distribution of instances among these four groups using the anomaly detection method. This figure likely provides a visual representation, such as a bar chart or scatter plot, showing the number of instances in each group and how they are distributed.
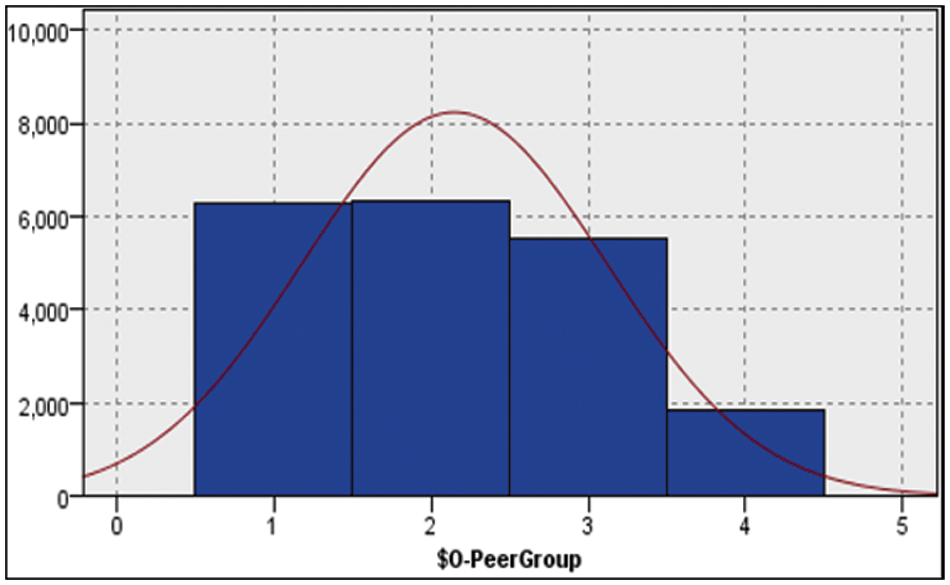
Figure 4: Handwritten letter instance distribution
As shown in Fig. 4, the datasets were automatically divided into 4 groups. Each group contains different types and numbers of letter instances with their features.
This study noted that the highest number of letter instances is group 1, which contains 6590 samples, while the lowest number of letter instances is group 4, which contains 1708 samples. The algorithm automatically calculates the optimal number of groups using the criteria given in the grouping criterion group. Fig. 5 shows the anomaly index and anomaly detection (true or false) across the extracted anomaly groups.
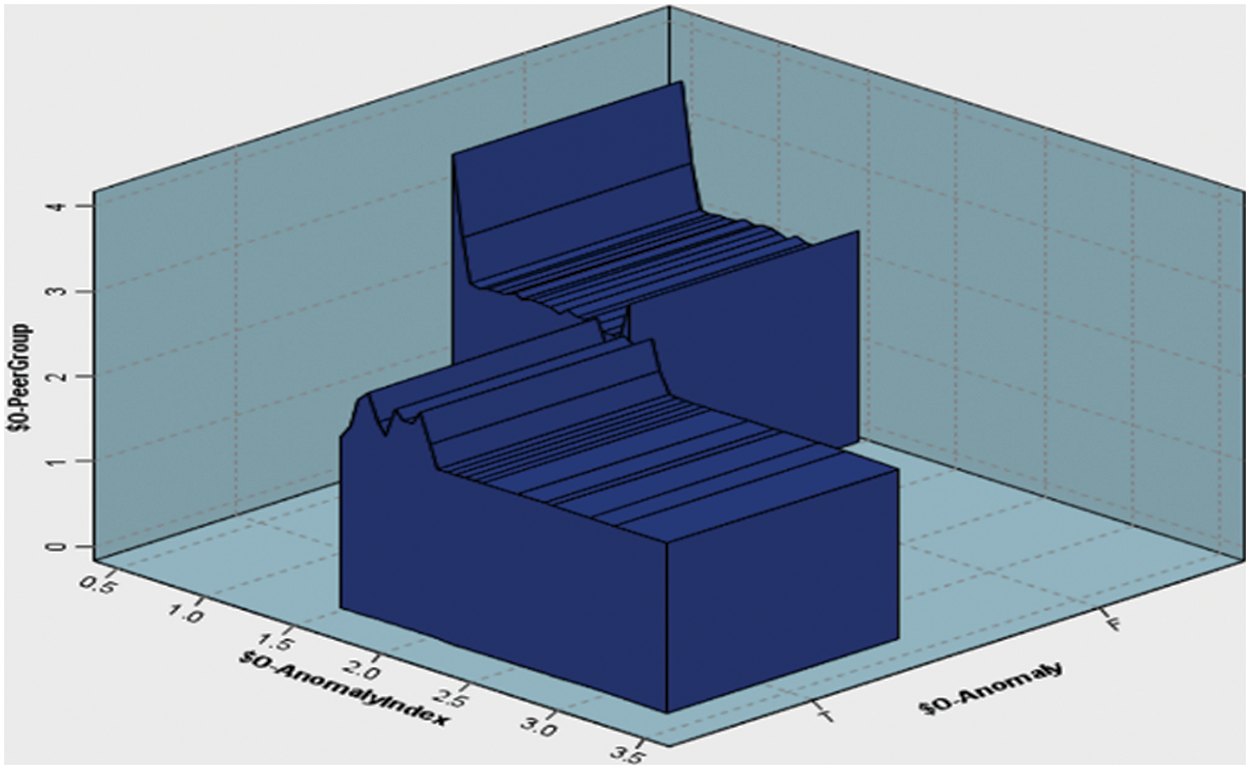
Figure 5: Anomaly index and anomaly detection vs. anomaly groups
This research noted that in Fig. 5 there are different outputs such as anomaly index and anomaly detection and anomaly groups. The anomaly index is a numerical value that is used to quantify the degree of anomaly in a given data point. Anomaly detection is a process that involves identifying data points with an abnormally high or low anomaly index value, which are considered to be anomalies. Anomaly detection has been used to identify outliers in an HR dataset by identifying unusual patterns in letters. On the other hand, the Anomaly groups in the graph refer to a collection of anomalous letter points that have a higher degree of similarity than with the other data points in the HR dataset. In other words, they form clusters of anomalies within the graph. Anomaly groups in graphs can provide additional insights into the underlying structure of the letters, allowing for more effective analysis and interpretation. While both anomaly detection and anomaly groups in graphs can be used to identify anomalies in a dataset, anomaly groups in graphs provide a more granular view of the data, highlighting the relationships between anomalies and the structure of the graph. This information can be useful in letter recognition. However, anomaly groups in graphs can be more computationally intensive to identify and may require specialized algorithms to effectively find and analyze the clusters.
In addition, the algorithm extracted the anomaly index and anomaly output across the whole dataset with 10000 samples. The extracted numbers of anomaly indices for the four groups are 8, 15, 14, and 13, respectively. In groups 1–4, several anomaly records have been found such as 14, 135, 18, and 32 from an estimated total of 6590, 5943, 5759, and 1708 pieces of data.
6 Experimental Results and Discussion
The UCI handwritten letter recognition dataset was acquired to conduct an experimental investigation. As mentioned before, the study trained and tested the dataset using a 5-fold cross-validation technique. The experiment employed the MLPNN classifier over the dataset with and without grouping results to explore the hybrid approach’s improved results. The cross-validation approach yielded the following recognition accuracy results:
True Positive (TP): The number of properly categorized letter recognition executables; False Positive (FP): The number of letter recognitions that are incorrectly categorized as nonletters; True Negative (TN): The number of erroneously categorized letter recognition executables; and False Negative (FN): The number of letters that are not executable.
False Positive Rate (FPR) is an important factor in anomaly detection models, as it measures the rate at which normal instances are falsely identified as anomalous. It is a key metric to evaluate the effectiveness of an anomaly detection model in real-world scenarios. When evaluating an anomaly detection model, it is important to consider the threshold used for anomaly detection, as different thresholds can have a significant impact on the FPR. A low threshold may result in a high FPR, as more normal instances are falsely identified as anomalous, while a high threshold may result in a low FPR, but may also miss some true anomalies. In the Letter Recognition dataset that was used in the experiments, since it does not contain ground truth for anomaly letters, it is not possible to directly calculate the FPR. However, this study proposed a method to detect arbitrary anomaly letters and assigned them to a nearby cluster. This approach allows for a qualitative assessment of the FPR, as it enables the detection of false positives that may have been wrongly assigned as anomalies.
The UCI handwritten letter recognition data were analyzed to establish the level of letter recognition. Each incident was classified from (A to Z) letters. The hybrid strategy is used to train and evaluate the dataset using a combination of anomaly detection and MLPNN. The dataset was then separated into several groups using the anomaly detection technique, with each group containing distinct occurrences. The primary purpose of grouping is to identify patterns and structures by clustering handwritten letter samples with similar patterns together. This will reduce the recognition complexity and ensure correct recognition classification. The training and testing processes on the dataset yielded the results shown in Fig. 3, which illustrates a set of results acquired using the MLPNN classifier approach with and without grouping using the anomaly detection process. The output of anomaly detection is used as a new feature in the combination process to label each instance in the dataset with a group name, as detailed in Section 5. By clustering the handwritten letter samples into comparable groups, this feature may strengthen the correlation between them. To obtain high accuracy, the MLPNN classifier is used again using the output of the anomaly detection technique. Fivefold cross-validation was used throughout the training and testing procedures, both with and without grouping, to analyze the integrated characteristics of the handwritten letter dataset. Each training and testing experiment used different samples from the handwritten letter dataset as an input variable to the MLPNN. Then, the target field is a feature of a class (letter from A to Z). When the MLPNN approach categorizes the dataset using the anomaly detection grouping output, the findings of the MLPNN classifier with grouping demonstrate an increase in accuracy. Interestingly, as shown in Section 2, the anomaly detection unsupervised approach increases handwritten letter recognition accuracy by 92.84%. Moreover, Table 3 shows the performance results on the UCI handwritten letter recognition dataset using the MLPNN method.
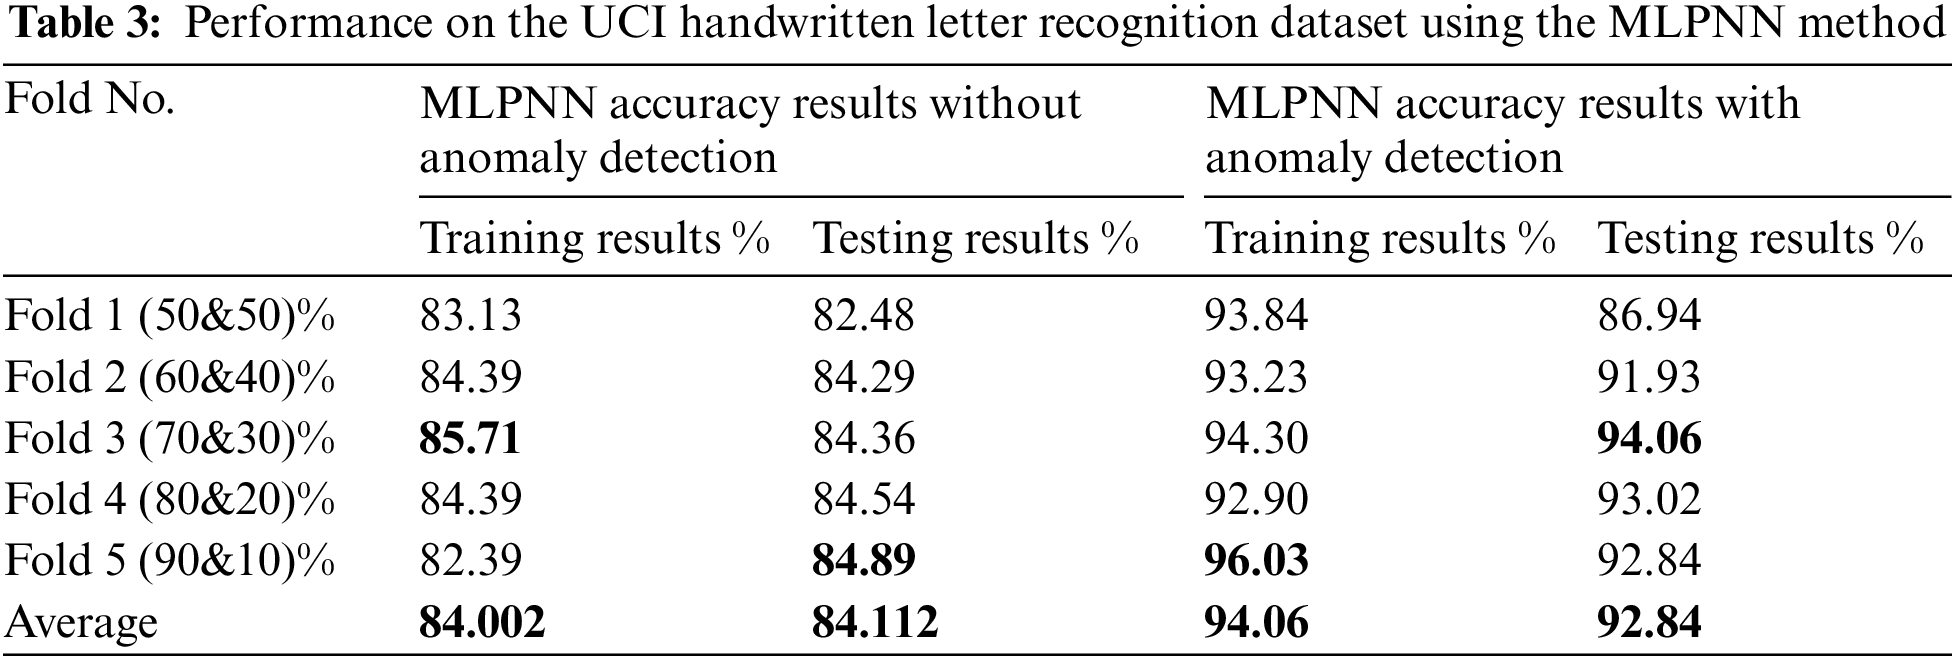
Figs. 6a–6e and 7a–7e illustrate the MLPNN’s training and testing output with and without the anomaly detection clustering method. The 5-fold cross-validation has been performed, and the average classification accuracy for training and testing trials using MLPNN without grouping was 84.002% and 84.112%, respectively. Additionally, depict the results that were obtained by the MLPNN classifier with grouping using an anomaly detection method, which achieved 94.06% accuracy in the training and 92.84% accuracy in the testing tests. Without grouping, high-performance training and testing outcomes were reached in folds 3 and 5, respectively, with an 85.71% accuracy ratio. In contrast, in the training and testing trials, the recognition results with anomaly detection grouping were obtained in folds 5 and 3 with 96.03% and 94.06%, respectively. In conclusion, when the anomaly detection technique is used, an improvement is observed. When the MLPNN output is combined with the anomaly detection method, the results of the MLPNN with grouping are improved, and letter recognition is more accurate.
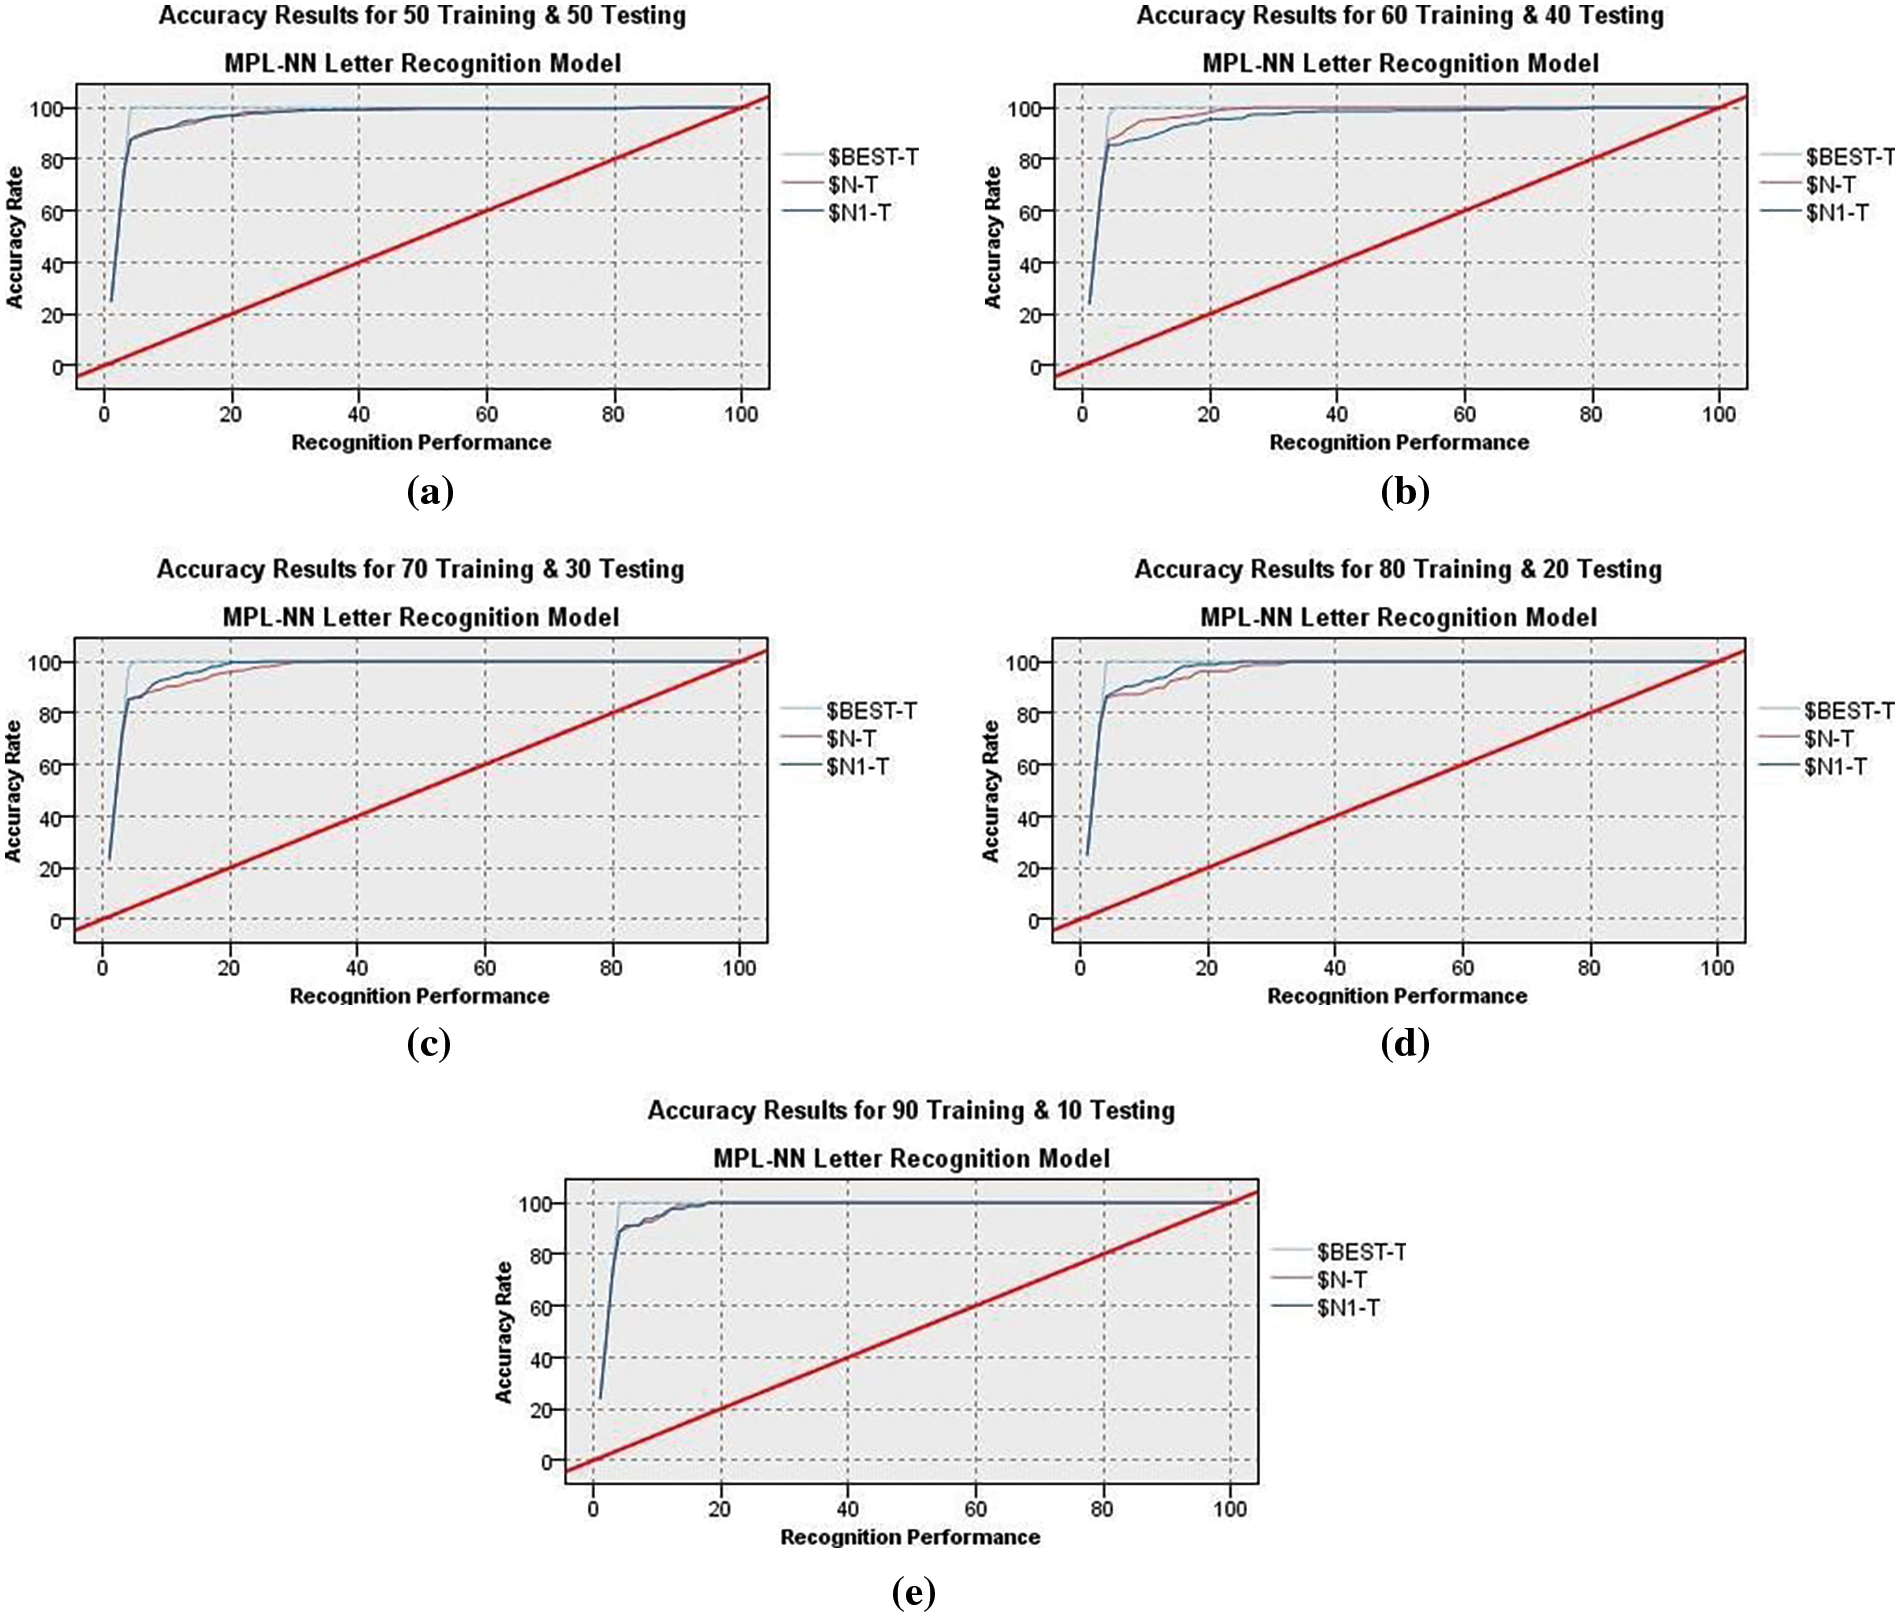
Figure 6: MLPNN recognition results
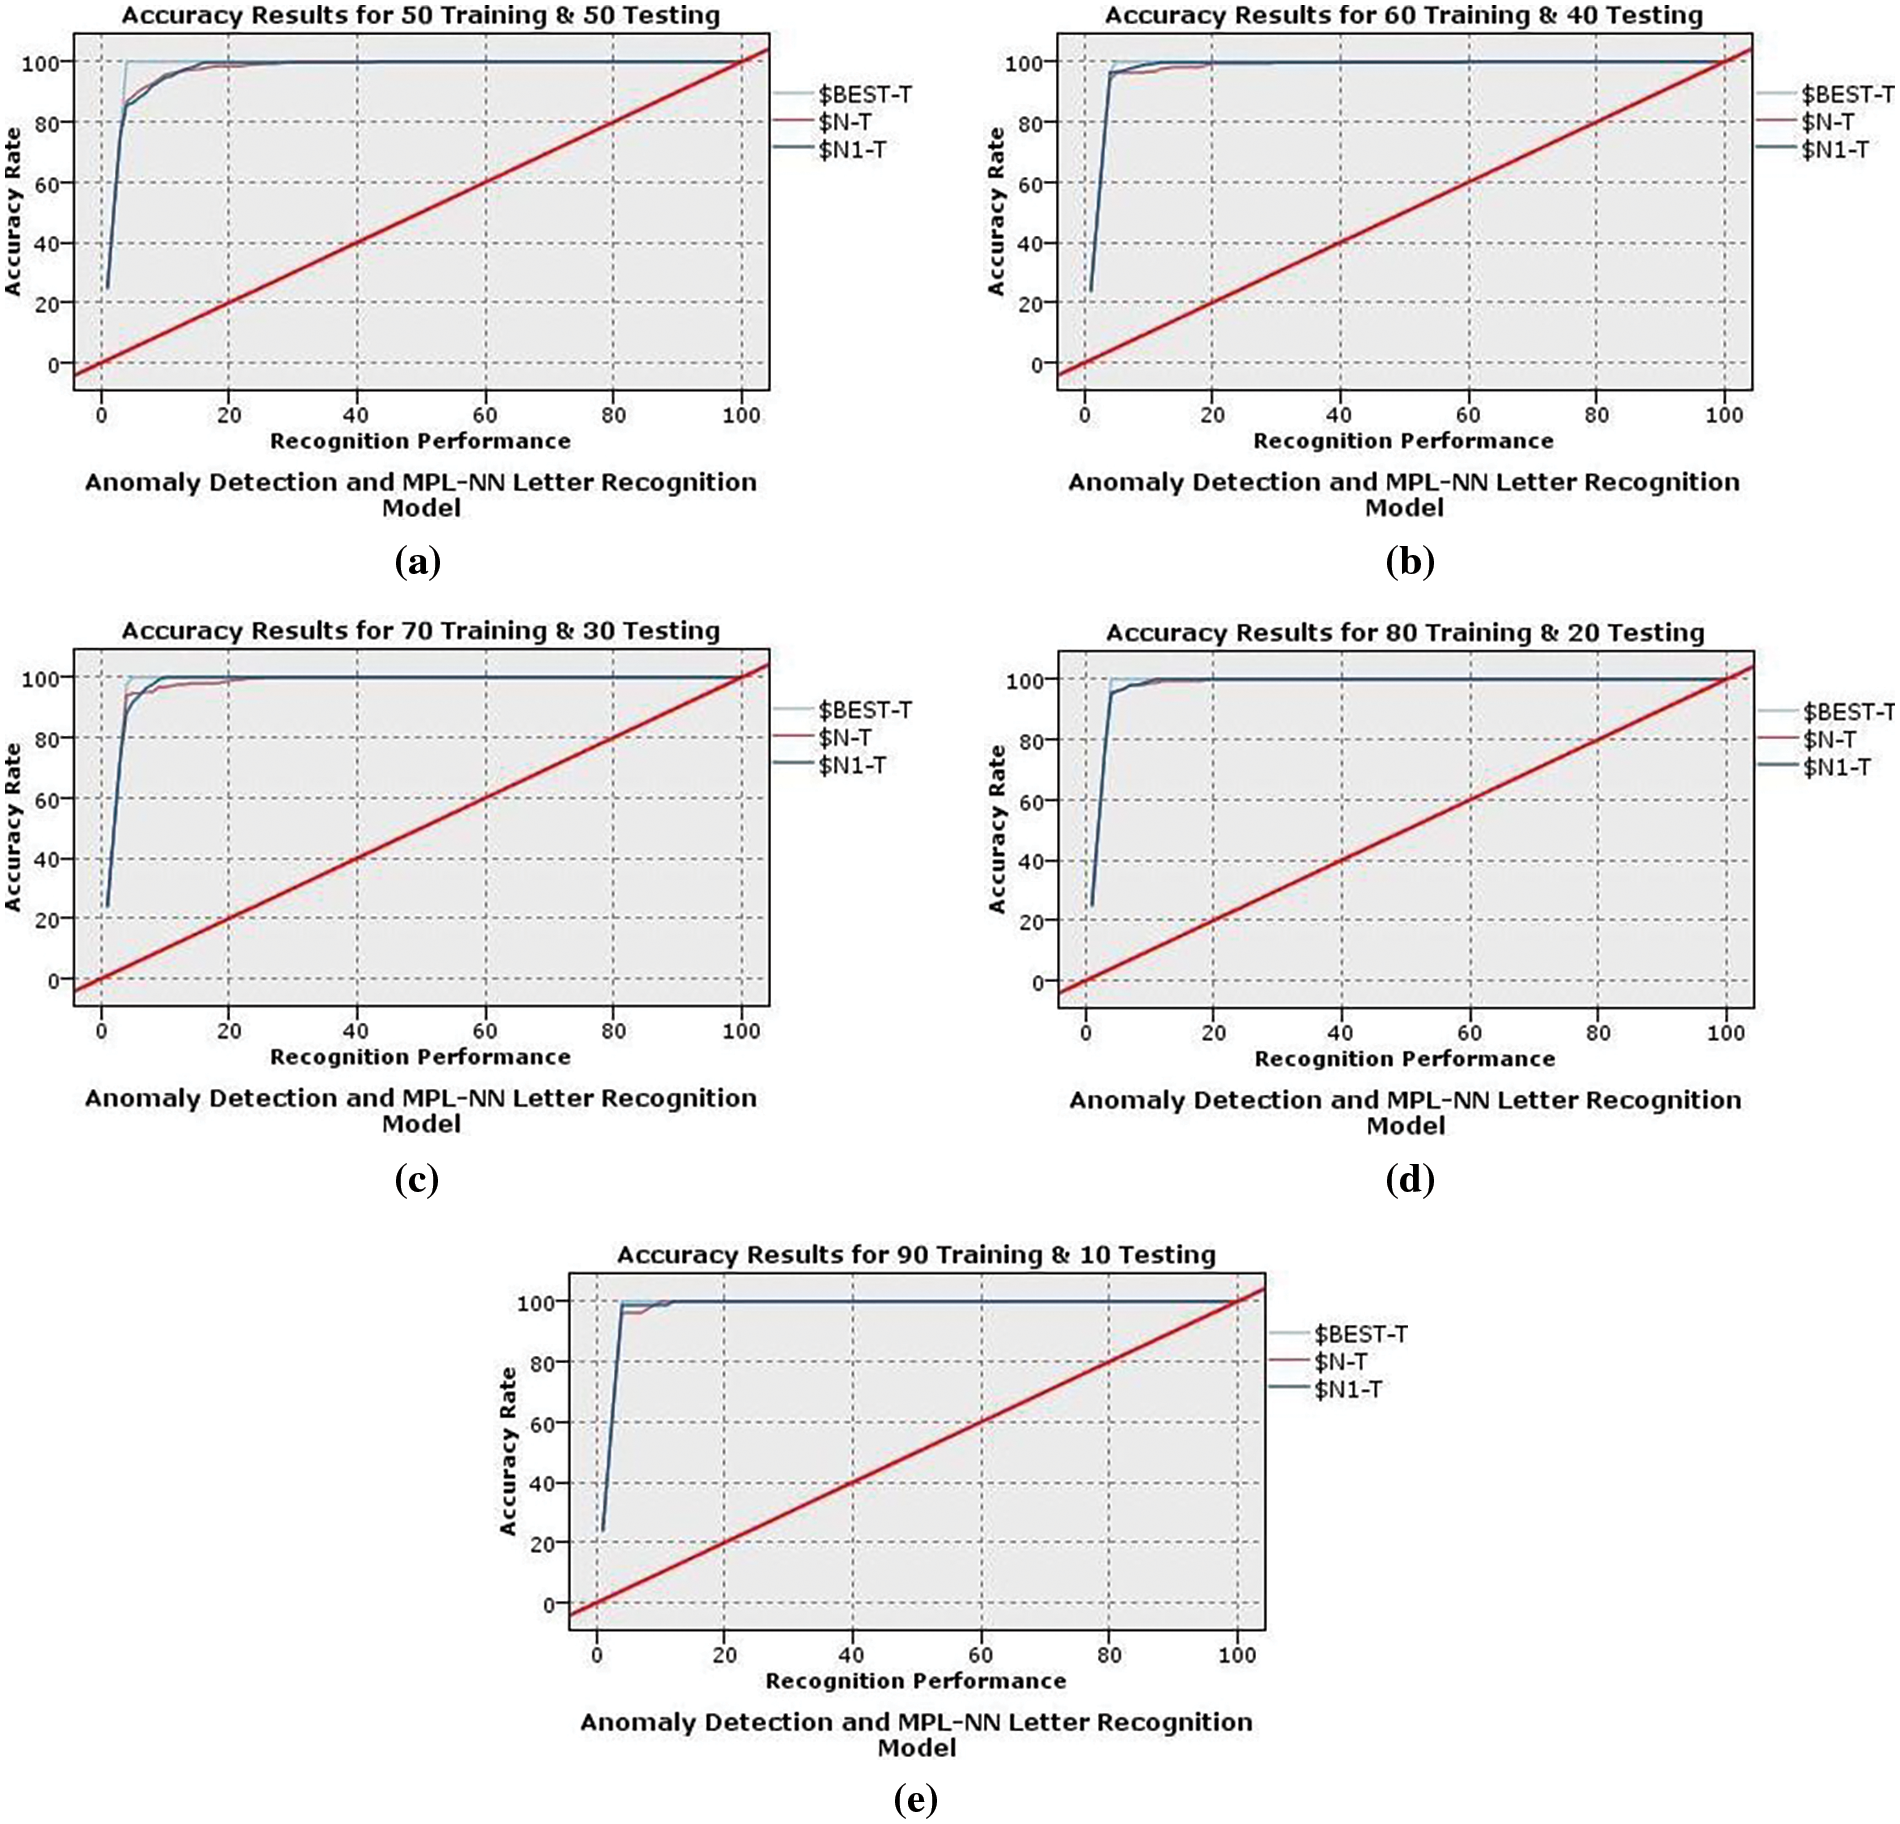
Figure 7: Anomaly detection-MLPNN recognition results
This study used the t-test to determine the statistical significance of the findings produced in the first experiment using the MLPNN and the second experiment using the anomaly detection MLPNN method. The t-test significance level (usually less than 0.05) indicates that there is a significant difference between the two variables. Based on the recognition results among the letters, 0.000512 in the training recognition phase and 0.000927 in the testing recognition phase, as determined in Table 4, this criterion was stressed in evaluation measures. This suggests that the anomaly detection-MLPNN method improved accuracy significantly and that there is a substantial difference between the MLPNN method with and without grouping.
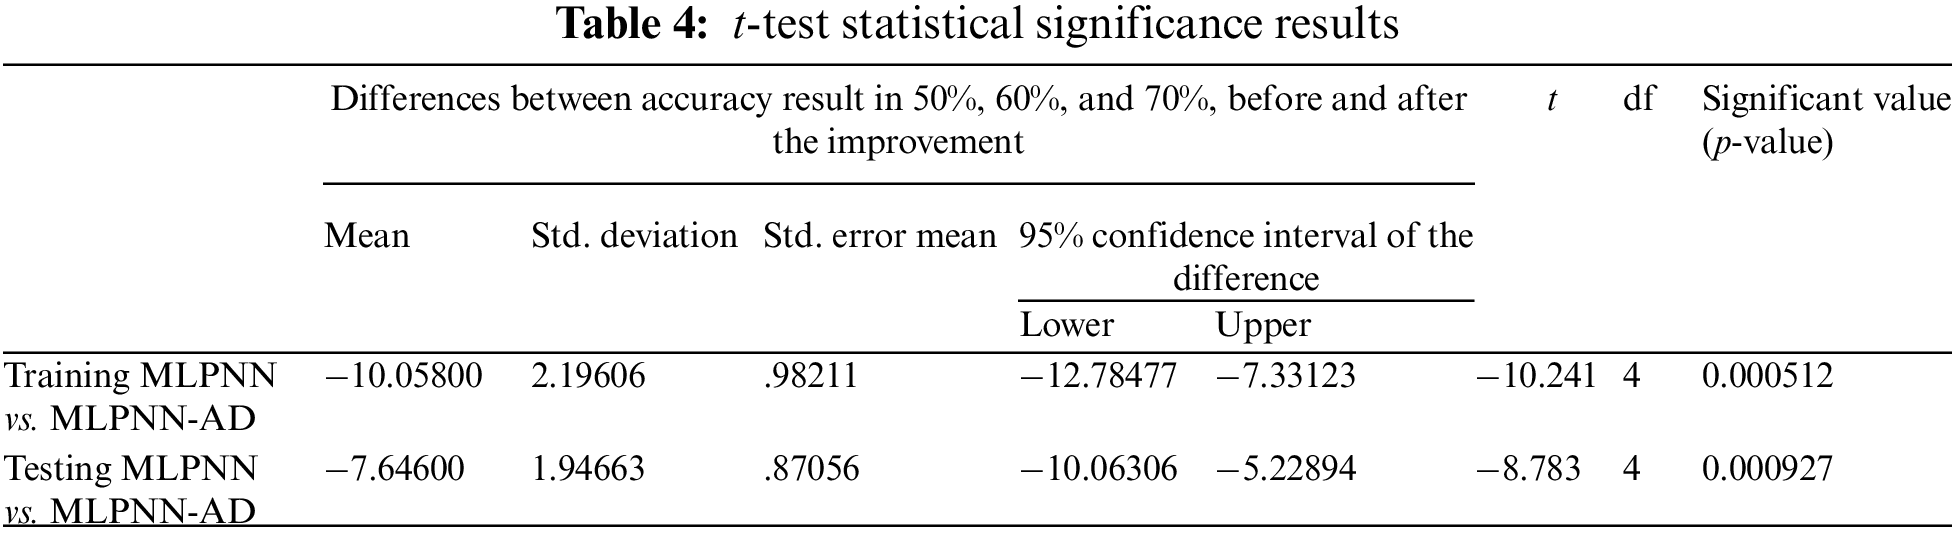
Table 4 shows the statistical significance results based on the t-test. In this article, the results were significant in both the training and testing experiments. In addition, the 95% confidence intervals of the difference between the MLPNN and MLPNN-AD methods from the lower to the upper clause were (−12.78477) and (−7.33123), respectively. This means that the recognition performance is improved when combining anomaly detection with the MLPNN algorithm. Furthermore, the significance value (p-value) was less than 0.05, which means that the results were enhanced significantly.
Fig. 8 illustrates the comparison between the anomaly detection MLPNN method and existing techniques. The proposed anomaly detection MLPNN achieves a high recognition accuracy of 92.84%.
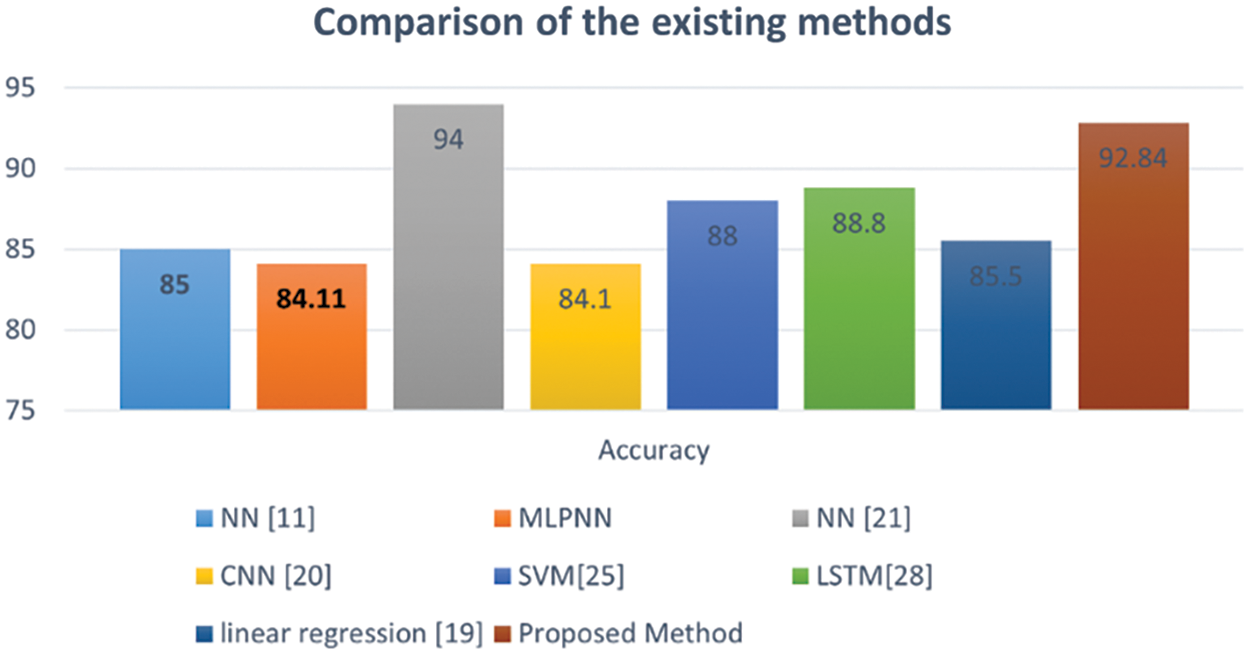
Figure 8: Comparison of the accuracy of the anomaly detection MLPNN technique to that of existing letter recognition classifiers
The hybrid method of using anomaly detection and MLPNN for handwritten letter recognition is a relatively new technique and can be compared to other existing techniques used for the same task. One of the main advantages of the hybrid method is that it combines the strengths of both anomaly detection and MLPNN. Anomaly detection is good at identifying letters that deviate significantly from the average shape, while MLPNN is good at classifying letters that are similar in shape to the training data. By combining the two techniques, the hybrid method can provide a more accurate recognition of handwritten letters. Another advantage of the hybrid method is that it is flexible and can be easily adapted to different datasets. Anomaly detection can be adjusted to work with different types of features, while MLPNN can be trained on different subsets of the data to improve performance. Compared to existing techniques such as NN, MLPNN, CNN, SVM, Linear Regression, and LSTM, the hybrid method provides a more robust solution for handwritten letter recognition except for the study of Handwritten English character recognition using the neural network [24] with 94% accuracy because of the small number of samples (500) only. The hybrid method, on the other hand, can handle these issues more effectively by combining the strengths of both anomaly detection and MLPNN. In conclusion, the hybrid method of anomaly detection and MLPNN for handwritten letter recognition is a promising technique that can provide improved accuracy and flexibility compared to traditional methods.
Offline handwritten character recognition (HCR) is comparatively one of the more challenging tasks as it lacks temporal information, such as stroke count and direction, ink pressure, and unexpected handwriting variability. These issues lead to a poor level of precision. However, neural networks demonstrate superior performance in a variety of sectors of computer vision and are widely used in major areas of character recognition and document analysis. The main contribution of this research is the proposal of a hybrid algorithm that combines MLPNN architectures and anomaly detection to enhance the accuracy of recognizing offline handwritten English capital letters and reduce errors in letter identification.
During this study, the UCI letter recognition dataset was trained and tested by applying the anomaly detection process on a 5-fold cross-validation technique. The MLPNN classifier was employed over the dataset with and without grouping results. The resulting output from the anomaly detection is then added as new features to label the instances of the dataset before processing the dataset using the MLPNN-based classification. The results of the hybrid model in this research showed a significant improvement in the accuracy of the output with a substantial difference in the accuracy results comparing applying the MLPNN with and without grouping. This hybrid technique boosted the accuracy from 84.11% using the multiple neural networks to an impressive 92.84% with the proposed method.
However, although some written English documents are typed, such as circulars and certificates, most English texts include a combination of small and capital letters. Thus, as this model can recognize capital letters in English, it would be more powerful for the model to recognize small as well as capital English letters.
Also, currently, the proposed algorithm accurately recognizes offline handwritten letters. The MLPNN component of the hybrid method requires a large amount of training data and a complex network structure. That makes the hybrid method more suitable for recognizing offline written letters and less suitable for cases requiring immediate recognition, such as online written letters. An improvement to the hybrid method is required to enhance the training time and therefore to apply the method to online writing letters.
Moreover, the proposed method recognizes English letters. However, it was not tested on letters from other languages. Recognizing letters from different languages, such as Arabic, will differ from English letters because of the special nature of handwriting, where one word can have one or more segments. Additionally, the shape of the letter in writing differs based on the position of the letter in the word, i.e., at the beginning, middle, or end of the word. This might add extra complexity to the model while processing the Arabic letters dataset. Testing the proposed method on Arabic letters as an example is required to explore how suitable this method is for detecting other languages’ letters.
In conclusion, the proposed hybrid model has significant potential for improving the accuracy of recognizing offline handwritten characters and reducing the errors in identifying such characters. The proposed model can be applied in different fields such as handwritten letter recognition software, document digitization, fraud detection, OCR technology improvement, and signature verification. This study has several implications and suggestions for future research and practical application which may include the following:
• The proposed model can be enhanced to recognize both small and capital English letters making it applicable to a wider range of written text.
• The proposed algorithm can be optimized on other simpler structure neural networks that can run with smaller training data for recognizing online handwritten text.
• The proposed model can be more suitable for recognizing offline written letters since it requires a large amount of training data and a complex network structure.
• The proposed model can be applied to similar writing systems letters such as French or Spanish.
• The proposed model can be enhanced to include different writing systems such as Arabic or Farsi.
• The anomaly detection process can be applied to different text recognition tasks and other machine learning techniques to improve accuracy and reduce errors.
• The proposed model can be tested using different datasets to evaluate it in offline handwritten recognition of English letters.
Acknowledgement: The authors acknowledge the UCI repository assistance to allow the use of their dataset [23].
Funding Statement: The authors received no funding for this study.
Author Contributions: The authors confirm contribution to the paper as follows: Conceptualization, N. A., A. O., A. M. and H. A.; methodology, N. A. and A. M.; software, H. O.; validation, N. A., A. O., A. M. and H. A.; formal analysis, A. O.; investigation, N. A., A. O., A. M. and H. A.; resources, N. A., A. O., A. M. and H. A.; writing—original draft preparation, N. A., A. O., A. M. and H. A.; writing—review and editing, , N. A., A. O., A. M. and H. A.; visualization, H. A.; supervision, N. A., A. O., A. M. and H. A.; project administration, N. A., A. O., A. M. and H. A.; funding acquisition, N. A., A. O., A. M. and H. A. All authors have read and agreed to the published version of the manuscript.
Availability of Data and Materials: The data collected during the data collection phase are available from the corresponding authors upon request.
Conflicts of Interest: The authors declare that they have no conflicts of interest to report regarding the present study.
References
1. F. Magoulès, V. Marquevielle and P. A. Dutilleul, “Artificial neural network based method for handwriting recognition to speech generation,” Journal of Algorithms & Computational Technology, vol. 3, no. 1, pp. 45–58, 2009. [Google Scholar]
2. W. B. Huber, S. H. Cha, C. C. Tappert and V. L. Hanson, “Use of chatroom abbreviations and shorthand symbols in pen computing,” in Ninth Int. Workshop on Frontiers in Handwriting Recognition, Kokubunji, Japan, IEEE, pp. 575–579, 2004. [Google Scholar]
3. M. Anitha and D. Elangovan, “Efficient conversion of handwritten text to braille text for visually challenged people,” in Int. Conf. on Emerging Current Trends in Computing and Expert Technology, Janakpuri New Delhi, India, Springer, pp. 941–949, 2019. [Google Scholar]
4. K. Wu, H. Fu and W. Li, “Handwriting text-line detection and recognition in answer sheet composition with few labeled data,” in 2020 IEEE 11th Int. Conf. on Software Engineering and Service Science (ICSESS), Beijing, China, IEEE, pp. 129–132, 2020. [Google Scholar]
5. N. Cilia, T. D’Alessandro, C. Stefano, F. Fontanella and A. di Freca, “Comparing filter and wrapper approaches for feature selection in handwritten character recognition,” Pattern Recognition Letters, vol. 168, no. C, pp. 39–46, 2023. [Google Scholar]
6. J. R. Ward and T. Kuklinski, “A model for variability effects in handprinting with implications for the design of handwriting character recognition systems,” IEEE Transactions on Systems, Man and Cybernetics, vol. 18, no. 3, pp. 438–451, 1988. [Google Scholar]
7. J. Kim and C. Tappert, “Handwriting recognition accuracy versus tablet resolution and sampling rate,” in Proc. of the 7th Int. Conf. on Pattern Recognition, Montreal, Canada, pp. 917–918, 1984. [Google Scholar]
8. M. Seul, L. O’Gorman and M. J. Sammon, “Global image analysis,” in Practical Algorithms for Image Analysis with CD-ROM: Description, Examples, and Code. Cambridge, UK: Cambridge University Press, pp. 21–51, 2000. [Google Scholar]
9. N. Jamil, T. M. T. Sembok and Z. A. Bakar, “Noise removal and enhancement of binary images using morphological operations,” in 2008 Int. Symp. on Information Technology, Kuala Lumpur, Malaysia, IEEE, pp. 1–6, 2008. [Google Scholar]
10. A. Khamis, Z. Ismail, K. Haron and A. Tarmizi Mohammed, “The effects of outliers data on neural network performance,” Journal of Applied Sciences, vol. 5, no. 8, pp. 1394–1398, 2005. [Google Scholar]
11. A. Sharma and D. R. Chaudhary, “Character recognition using neural network,” International Journal of Engineering Trends and Technology (IJETT), vol. 4, no. 4, pp. 662–667, 2013. [Google Scholar]
12. G. Singh and M. Sachan, “Multi-layer perceptron (MLP) neural network technique for offline handwritten gurmukhi character recognition,” in 2014 IEEE Int. Conf. on Computational Intelligence and Computing Research, Coimbatore, India, IEEE, pp. 1–5, 2014. [Google Scholar]
13. F. Sorbello, G. Gioiello and S. Vitabile, “Handwritten character recognition using a MLP,” in Knowledge-Based Intelligent Techniques in Character Recognition. Boca Raton, USA: CRC Press Publishers, pp. 91–119, 2020. [Google Scholar]
14. O. Batsamhan and Y. Singh, “Mongolian character recognition using multilayer perceptron (MLP),” in Proc. of the 9th Int. Conf. on Neural Information Processing, ICONIP’02, Singapore, IEEE, vol. 2, pp. 621–625, 2002. [Google Scholar]
15. M. Goldstein and S. Uchida, “A comparative evaluation of unsupervised anomaly detection algorithms for multivariate data,” PLoS One, vol. 11, no. 4, pp. e0152173, 2016. [Google Scholar] [PubMed]
16. J. Pradeep, E. Srinivasan and S. Himavathi, “Diagonal based feature extraction for handwritten character recognition system using neural network,” in 2011 3rd Int. Conf. on Electronics Computer Technology, Kanyakumari, India, IEEE, pp. 364–368, 2011. [Google Scholar]
17. J. P. Oliveira and R. D. Sousa, “Unsupervised anomaly detection of retail stores using predictive analysis library on sap hana XS advanced,” Procedia Computer Science, vol. 181, pp. 882–889, 2021. [Google Scholar]
18. Y. Netzer, T. Wang, A. Coates, A. Bissacco, B. Wu et al., “Reading digits in natural images with unsupervised feature learning,” in NIPS Workshop on Deep Learning and Unsupervised Feature Learning, Granada, Spain, 2011. [Google Scholar]
19. A. Coates, B. Carpenter, C. Case, S. Satheesh, B. Suresh et al., “Text detection and character recognition in scene images with unsupervised feature learning,” in 2011 Int. Conf. on Document Analysis and Recognition, Beijing, China, IEEE, pp. 440–445, 2011. [Google Scholar]
20. V. Christlein, M. Gropp, S. Fiel and A. Maier, “Unsupervised feature learning for writer identification and writer retrieval,” in 2017 14th IAPR Int. Conf. on Document Analysis and Recognition (ICDAR), Kyoto, Japan, IEEE, pp. 991–997, 2017. [Google Scholar]
21. C. Huang, C. Liu, J. Wen, L. Wu, Y. Xu et al., “Weakly supervised video anomaly detection via self-guided temporal discriminative transformer,” in IEEE Transactions on Cybernetics, Piscataway, NJ, USA, pp. 1–14, 2022. [Google Scholar]
22. C. Huang, C. Liu, Z. Zhang, Z. Wu, J. Wen et al., “Pixel-level anomaly detection via uncertainty-aware prototypical transformer,” in Proc. of the 30th ACM Int. Conf. on Multimedia, Lisboa, Portugal, pp. 521–530, 2022. [Google Scholar]
23. D. Dua and C. Graff, “UCI machine learning repository,” University of California, School of Information and Computer Science. Irvine, CA, 2019. [Online]. Available: http://archive.ics.uci.edu/ml [Google Scholar]
24. A. Pal and D. Singh, “Handwritten English character recognition using neural network,” International Journal of Computer Science & Communication, vol. 1, no. 2, pp. 141–144, 2010. [Google Scholar]
25. C. Bishop, “Statistical pattern recognition,” in Neural Networks for Pattern Recognition. Oxford, UK: Oxford University Press, pp. 1–28, 1995. [Google Scholar]
26. Y. B. Hamdan, “Construction of statistical SVM based recognition model for handwritten character recognition,” Journal of Information Technology, vol. 3, no. 2, pp. 92–107, 2021. [Google Scholar]
27. A. Rana, P. Vaidya and G. Gupta, “A comparative study of quantum support vector machine algorithm for handwritten recognition with support vector machine algorithm,” Materials Today: Proceedings, vol. 56, pp. 2025–2030, 2022. [Google Scholar]
28. IBM, “Anomaly detection algorithm,” in IBM SPSS Modeler 17 Algorithms Guide. USA: IBM Corporation, pp. 3–7, 2015. [Google Scholar]
29. N. Saqib, K. F. Haque, V. P. Yanambaka and A. Abdelgawad, “Convolutional-neural-network-based handwritten character recognition: An approach with massive multisource data,” Algorithms, vol. 15, no. 4, pp. 129, 2022. [Google Scholar]
30. M. Geetha, R. Suganthe, S. Nivetha, S. Hariprasath, S. Gowtham et al., “A hybrid deep learning based character identification model using CNN, LSTM, and CTC to recognize handwritten English characters and numerals,” in 2022 Int. Conf. on Computer Communication and Informatics (ICCCI), Coimbatore, India, pp. 1–6, 2022. [Google Scholar]
31. S. U. Amin, Y. Kim, I. Sami, S. Park and S. Seo, “An efficient attention-based strategy for anomaly detection in surveillance video,” Computer Systems Science and Engineering, vol. 46, no. 3, pp. 3939–3958, 2023. [Google Scholar]
32. S. Ul Amin, M. Ullah, M. Sajjad, F. A. Cheikh, M. Hijji et al., “EADN: An efficient deep learning model for anomaly detection in videos,” Mathematics, vol. 10, no. 9, pp. 1555, 2022. [Google Scholar]
33. J. Kolluri, V. K. Kotte, M. Phridviraj and S. Razia, “Reducing overfitting problem in machine learning using novel l1/4 regularization method,” in 2020 4th Int. Conf. on Trends in Electronics and Informatics (ICOEI), Tirunelveli, India, IEEE, pp. 934–938, 2020. [Google Scholar]
Cite This Article
 Copyright © 2024 The Author(s). Published by Tech Science Press.
This work is licensed under a Creative Commons Attribution 4.0 International License , which permits unrestricted use, distribution, and reproduction in any medium, provided the original work is properly cited.
 Downloads
 Citation Tools