
 Submit a Paper
 Propose a Special lssue
 Open Access
ARTICLE
Fault Diagnosis of Wind Turbine Generator with Stacked Noise Reduction Autoencoder Based on Group Normalization
1 School of Automation and Electrical Engineering, Lanzhou Jiaotong University, Lanzhou, 730070, China
2 Rail Transit Electrical Automation Engineering Laboratory of Gansu Province (Lanzhou Jiaotong University), Lanzhou, 730070, China
* Corresponding Author: Wenhui Zhang. Email:
(This article belongs to the Special Issue: Wind Energy Development and Utilization)
Energy Engineering 2022, 119(6), 2431-2445. https://doi.org/10.32604/ee.2022.020779
Received 11 December 2021; Accepted 08 March 2022; Issue published 14 September 2022
 View Full Text
 Download PDF
Abstract
In order to improve the condition monitoring and fault diagnosis of wind turbines, a stacked noise reduction autoencoding network based on group normalization is proposed in this paper. The network is based on SCADA data of wind turbine operation, firstly, the group normalization (GN) algorithm is added to solve the problems of stack noise reduction autoencoding network training and slow convergence speed, and the RMSProp algorithm is used to update the weight and the bias of the autoenccoder, which further optimizes the problem that the loss function swings too much during the update process. Finally, in the last layer of the network, the softmax activation function is used to classify the results, and the output of the network is transformed into a probability distribution. The selected wind turbine SCADA data was substituted into the pre-improved and improved stacked denoising autoencoding (SDA) networks for comparative training and verification. The results show that the stacked denoising autoencoding network based on group normalization is more accurate and effective for wind turbine condition monitoring and fault diagnosis, and also provides a reference for wind turbine fault identification.Keywords
On September 22, 2020, the dual-carbon strategy proposed by General Secretary Xi Jinping during the 75th Session of the World United Nations General Assembly triggered extensive and profound systemic economic and social changes, which can be realized through the transformation of technology and industrial structures. The only way to achieve this is to actively develop efficient, clean and safe new energy materials and power supply equipment. In recent years, the installed capacity of wind energy in China has gradually increased due to its high efficiency, safety and renewablility. As wind becomes an even more important utility resource, minimizing operating and maintenance costs has become a key issue in making wind energy competitive with fossil fuels. Wind turbines are subject to unexpected failures due to operational and environmental conditions, aging, etc. Accurate estimation of failure times ensures reliable power production and reduces maintenance costs [1].
Fault diagnosis and prognosis are some of the most crucial functionalities in complex and safety-critical engineering systems [2]. At present, most scholars identify the majority of faults by analyzing the changes in the electrical or mechanical signals of wind turbines [3]. In reference [4], mechanical faults of generators are diagnosed by examining signs such as vibration, temperature, and speed of generators. However, the amount of data is large, and it is difficult for humans to obtain useful information from. Some scholars proposed fault diagnosis based on the pattern recognition method, analyzing diversified signals of wind turbines to build a set of high-dimensional models and then conducting visual analysis to obtain fault characteristics [5], but the process is complex and difficult to apply to engineering practice. Some people also use the weak fault information extraction technology of the three-phase stator current detection method to diagnose generator faults [6], but the reliability is low and the communication pressure is high. The above traditional methods can diagnose wind turbine faults in a particular range. Still, the SCADA data of wind turbines remain complicated, and it has the characteristics of high dimension and nonlinear information. The traditional methods cannot dig any more in depth helpful or useful information from a large amount of data.
In recent years, the development and application of deep learning technology has also led to outstanding achievements in many different fields. The super learning ability of the model also provides a new vision for intelligent fault diagnosis to a certain extent. In reference [7], the authors put forward a method based on the output voltage and current monitoring capacity of the wind turbine power converter. This effectively solves a major problem, that the power converter sometimes has difficulties in monitoring the relevant parameters under normal working conditions, and uses it to combine with a neural network; in this manner, it is possible to get a correct understanding of whether a fault is actually happening, as well as what type of fault it is. Some scholars have proposed a method of combining deep self-encoding (DAE) network and XGBoost [8]. The calculation example shows that the DAE algorithm can capture the early faults of wind turbine generators, and the XGBoost algorithm can identify different fault types more accurately than other algorithms. A more accurate and effective implemention of a combination wind power generator unit fault diagnosis was achieved. In reference [9], the authors optimized the BP neural network by using the excellent global search ability of the PSO algorithm, which improves the convergence speed and stability of the BP neural network to a certain extent, so as to accurately and effectively identify the fault type of the wind turbine gearbox. In reference [10], the author proposed a stacked auto-encoding network based on batch normalization, which effectively solves the gradient dispersion problem in the feature extraction of common auto-encoding networks when there are many parameters. The verification results show that the batch-normalized SAE network has a more optimized network model, as well as a higher recognition accuracy; In reference [11], an intelligent fault diagnosis method of rolling bearing based on optimized and improved stacked denoising autoencoders (SDAE) is proposed. The student psychology-based optimization (SPBO) algorithm is used to adaptively select the super parameters of the denoising autoencoder (DAE) network to determine the optimal structure and parameters of the SDAE network, and then extract the fault state features with stronger representation. Experimental results show that the diagnosis method based on the SPBO-SDAE network is superior to traditional methods ineffective feature extraction, diagnosis speed and fault diagnosis accuracy. In reference [12], the author proposed a fault diagnosis model based on stacked noise reduction autoencoders, and used simulation data to train the model. The training results show that the method can effectively monitor the operating status and fault conditions of wind turbines, and has certain practical value. In reference [13], a novel CNN with the function of spectrum calculation and fault diagnosis was designed, in which the spectrum calculation network and the fault diagnosis network are connected in series. Only by system input and output can the fault diagnosis be realized, which avoids the complex process of the traditional method. The proposed network model is applied to the heavy-duty industrial robot system, and the best performance is demonstrated by several experiments. In reference [14], the authors proposed the use of the Predictive Maintenance model with a Convolutional Neural Network (PdM-CNN), to classify automatically rotating equipment faults and advise when maintenance actions should be taken. With this model companies can improve the financial performance of their rotating machine monitoring by reducing sensor acquisition costs for fault identification and classification problems, easing their way towards the digital transformation required for the fourth industrial revolution. It can be seen that the current research on stacked noise reduction autoencoders in the field of fault diagnosis is still in the application stage, and there is still a lack of optimization of both network parameters and performance.
In this paper, the group normalization (GN) algorithm is introduced into the stacked denoising autoencoder (SDA) network, and the network parameters and performance of the common SDA are optimized. Firstly, based on a large amount of SCADA data of generators in a wind power plant, the relationships contained in the SCADA data of generators are explored in depth by using the SDA network. Secondly, the group normalization idea is used to solve the problems of slow convergence speed, swing and complex calculation in the process of algorithm implementation, and the mapping model between SCADA system data and faults is obtained. Finally, the effectiveness and superiority of the proposed method is demonstrated by comparing with the traditional methods, it is further proved that the proposed method has a strong ability to extract useful information from huge amounts of SCADA data and is reliable in wind turbine fault diagnosis, which is of importance in the condition monitoring field of wind turbines.
2 Deep Learning Network Model Construction
2.1 Mathematical Modeling Based on Autoencoder
An autoencoder is an asymmetric neural network composed of the input layer, hidden layer, and output layer. Fig. 1 shows its network structure.

Figure 1: Autoencoder network structure
Suppose there is m SCADA data input to the autoencoder, and each sample has n-dimensional features,
where W1, b1 respectively represent the weight matrix and the bias matrix of the encoder; W2, b2 respectively represent the weight matrix and the bias matrix of the decoder; σ is the activation function.
The function of activation is to add some nonlinearity to the neural network, so that the neural network can better solve more complex problems. At present, there are many kinds of activation functions commonly used. The rectified linear function ReLU can solve the problem of data gradient dispersion well, as shown in Eq. (3). However, when the input of a neuron is 0, or the neuron flows through a vast gradient, ReLU will not be activated; that is to say, the rise of the neuron will always be 0. For this reason, the Leaky ReLU function is used in this paper.The Leaky ReLU function assigns a non-zero slope to all negative values to solve the problem of neuron "death" in the ReLU function, as shown in Eq. (4). Fig. 2 shows the function’s image.

Figure 2: ReLU and Leaky ReLU functions
2.2 Stacked Noise Reduction Autoencoder
The denoising autoencoder (DAE) is improved by adding noise to the input data to prevent overfitting problems based on the autoencoder to make the learned encoder robust [15]. In recent years, the self-coding network has been effective in equipment fault detection and diagnosis. Some scholars have proposed an improved variable learning rate stacked autoencoder (SAE) model to reconstruct the temperature of the rear bearing of the generator, verifying that the network has been effective concering the fault diagnosis of the bearing temperature of the wind turbine [16]. Some scholars have also proposed extracting partial discharge signal features based on a stack-type noise reduction autoencoding network. This method removes the inherent feature vector of the partisan discharge phase distribution spectrum through a network adaptive approach and characterizes different discharge types; it trains and tests the network to realize the classification and recognition of the gas-insulated switchgear (GIS) [17].
For a single hidden layer autoencoder, one of the many variants of the Back-Propagation algorithm (the most typical method is the Stochastic Gradient Descent, SGD) is usually used for training, which can achieve very effective results. However, when applied in a network with multiple hidden layers, the Back-Propagation presents some problems. After the first few layers of training, the error becomes very small, and the training becomes ineffective. Although more advanced Back-Propagation methods alleviate the problems to some extent, they still cannot solve the one problem of slow learning speed, especially when the amount of training data is limited. As mentioned earlier, if each layer can be pre-trained as a simple self-decoder and then stacked, then that would improve the training efficiency greatly. As shown in Fig. 3 [18], at first, unsupervised pre-training is performed on each single hidden layer denoising autoencoder unit, then it is stacked, and finally, the overall reverse tuning training is performed to obtain a stacked noise reduction the autoencoder while the n-layer hidden layer structure is proposed.

Figure 3: Structure of stacked denoising autoencoder
Use the softmax classification function in the last layer of the network to change the output of the network into the form of a probability distribution. For the sample vector set {
Then use the classification cross-entropy [19] as the loss function to measure the predicted value and true target value of the training network output (that is, the expected network output result), and by minimizing the distance between these two distributions, the training is the predicted value of the network is as close as possible to the target value. Eq. (6) shows the classification cross-entropy:
The RMSProp algorithm’s [20] full name is the Root Mean Square Prop algorithm, which optimizes the problem of excessive swing amplitude in updating the loss function and further accelerates the convergence speed. The RMSProp algorithm performs a differential square weighted average on the gradient of the weight W and the bias b of the loss function. This algorithm introduces an attenuation factor based on the AdaGrad algorithm and solves the problem that the learning rate decreases rapidly as the training period increases. The RMSProp algorithm is shown in Eq. (7), in iteration t-th:
The hidden layer parameter update will lead to a network output data change distribution when the neural network is training. This offset phenomenon will gradually amplify according to the chain derivation rule as the number of layers increases. When the output data distribution changes, the network has to learn a new distribution, which significantly reduces the learning speed of the neural network itself. Therefore, this paper introduces the Group Normalization (GN) algorithm [21]. Compared with the traditional BN algorithm, the GN algorithm is not affected by the batch size and improves the training and convergence speed. In the literature [22], the GN algorithm is applied to the recurrent neural network (CNN) to realize the fault identification and diagnosis of the CWRU motor bearing.
Add the GN algorithm between the full connection of each layer of the neural network and the activation function. The schematic diagram of the network with the GN algorithm shows in Fig. 4. The GN algorithm normalizes features from the dimension of channels. After learning each layer can obtain two network parameters

Figure 4: Add the network schematic diagram of the GN algorithm
In Eq. (8),
4 Establish the Wind Turbine Fault Diagnosis Model Based on the GN-SDA Network
The state monitoring and fault diagnosis analysis process of wind turbine generators based on the GN-SDA network is as follows: firstly, a group of generator SCADA data with fault samples is selected, and each variable is normalized to make it uniformly mapped to the interval [0,1]. Then, it is all divided into training data set and test data set. Substitute the training set into the network, use the RMSProp algorithm to pre-train step by step. After pre-training, use the GN algorithm to optimize the network parameters, and determine the mapping relationship between wind turbine characteristic parameters and fault types; based on the established mapping relationship, it is compared with the test set to determine the type of generator fault. At that point, the diagnosis result is further adjusted to establish its mapping relationship, and the possible cause of the fault is analyzed. The specific process is shown in Fig. 5.

Figure 5: Wind turbine fault diagnosis flow chart based on GN-SDA network
5.1 Wind Turbine Data Collection and Characteristic Parameter Selection
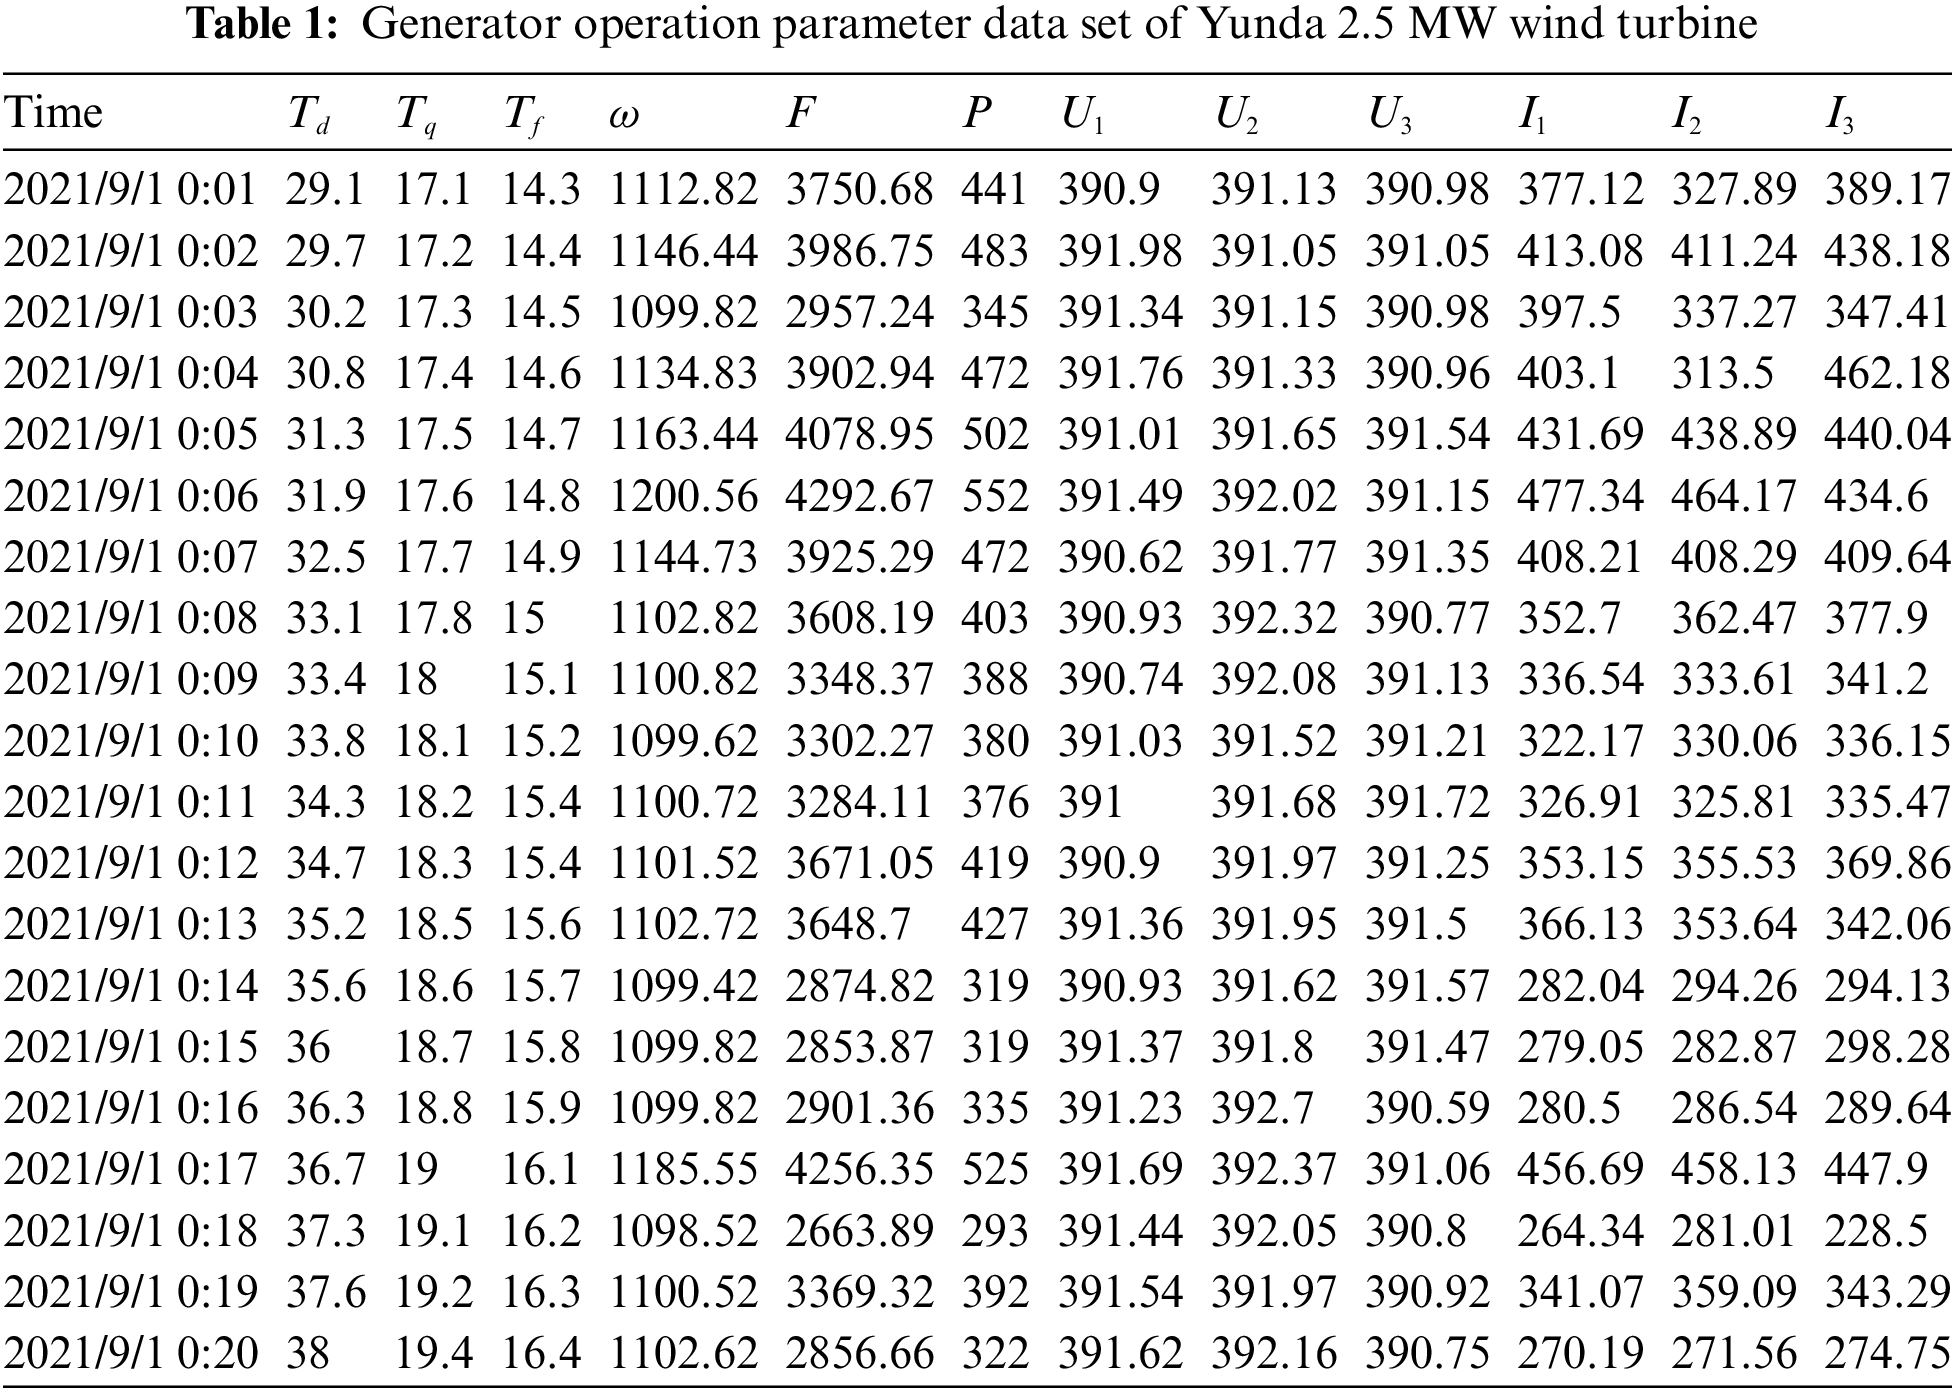
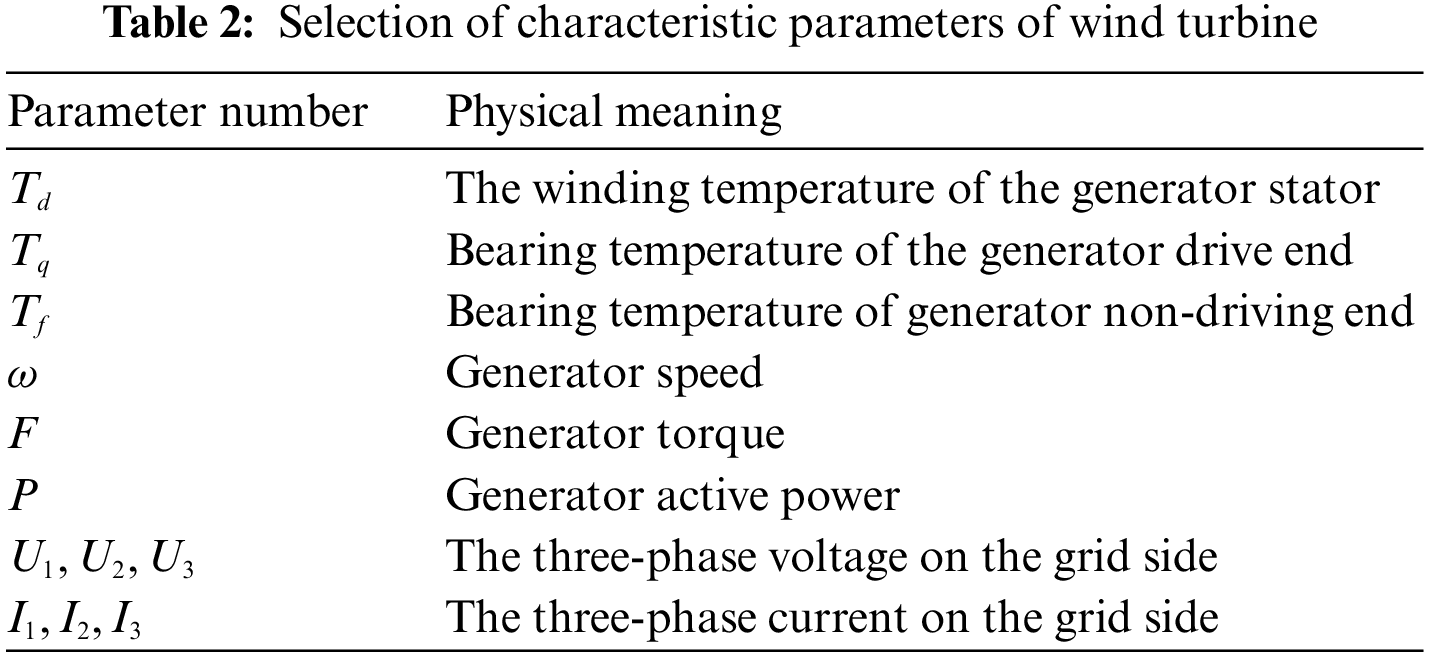
To realize the fault identification and diagnosis of wind turbines, it is necessary to monitor various operating parameters of the generator, such as generator stator winding temperature, generator bearing temperature, generator speed, generator torque, generator active power and other parameters [23]. In this paper, the monitoring data of the No. 01 doubly-fed asynchronous wind generator with a capacity of 2.5 MW in a wind farm for nearly one year is selected and used as the source of the sample data set for this study. In order to ensure the validity of the data in the research process, when selecting the research data, according to the characteristics of the power performance, the relevant data of the generator in the process of zero power is eliminated, and the elimination of the power in the process of increasing from a negative value to a positive value data and power in the process of decreasing from a positive value to a zero value or a negative value [24]. The sample data set is shown in Table 1. Select the parameters that have a more significant impact on the operation of the wind turbine as the characteristic parameters for fault diagnosis, and the selection results are shown in Table 2.
The collected SCADA data of the wind turbine is randomly divided into a training set and a test set, the training set is substituted into the SDA network without GN layer and the GN-SDA network for training, and then the test set is substituted into the GN-SDA network for verification, training the GN-SDA network under different parameters to determine the optimal network model. The network model built in this paper determines that the number of network layers to be iterated is 8 layers, and the model adopts a fully connected method, in which the encoder has 4 layers, the decoder has 4 layers, and the learning rate of the stacked noise reduction self-encoding network is set to 0.001.
In this paper, Keras is used to build a deep learning framework, the code is written by PyCharm in Anacoda environment, and the selected training set is substituted into the model for training. After training, the test set is substituted into the model to verify the training accuracy of the network.
5.2 Fault Diagnosis Analysis of Generator Based on GN-SDA Network
5.2.1 Generator Fault Diagnosis Output
According to the statistics, in all faults of wind turbine generators, bearing faults, stator faults, rotor faults account for 40%, 38%, 10%, respectively, and other faults account for just 12%. It can be seen that the bearing is the component most prone to failure [25]. According to the fault analysis of wind turbines, the common faults are numbered, as shown in Table 3. The network’s output is the probability of failure for each element of the wind generator output by the Softmax function. By comparing the maximum likelihood obtained from the training set and the maximum likelihood obtained from the test set, the components of the wind generator with failure can be obtained, and the cause of failure can be further analyzed. Select a set of faulty data of the above-mentioned No. 01 wind turbine as the test set for verification.

In order to represent the specific diagnosis of each type of fault by the GN-SDA network, the fault diagnosis confusion matrix of the output test set is shown in Fig. 7. The abscissa in the figure is F1–F8 from left to right, representing the predicted label; the ordinate is F1–F8 from top to bottom, representing the actual label, the depth of the color represents the strength of the correlation, and the diagonal line represents each type of sample fault diagnosis accuracy. As can be seen from Fig. 6, through the comparison of misclassification shown in the confusion matrix, the classification recognition rate of the model is low when detecting F1, F2, F3 and F6, and a slight misclassification phenomenon occurs. This is because the temperature of the wind turbine’s three-phase winding is close, and so the model is prone to the misclassification phenomenon in the analysis, but in general, 99.86% of fault samples can be correctly diagnosed, indicating that the GN-SDA network can efficiently to diagnose wind turbine faults and classify them.

Figure 6: No. 01 wind turbine fault data set classification confusion matrix

Figure 7: Comparison of training loss values of SDA network and GN-SDA network
5.2.2 Comparison of the SDA Network and the GN-SDA Network When the Number of Iterations Is Different
Train in the built GN-SDA network, and substitute the training set into the normal stacked noise reduction autoencoder network and the stacked noise reduction autoencoder based on group normalization for comparison. The comparison result is shown in Fig. 7.
It can be seen from Fig. 8 that as the number of iterations increases, the network loss value of the ordinary SDA network decreases. Still, after falling to a certain level, the loss value increases as the number of iterations increases. The GN-SDA network loss value drops faster, and the loss value tends to be stable after about 300 iterations, so the GN-SDA network has a certain fault recognition ability. It can be seen that the GN-SDA network has more vital learning ability and training accuracy than the ordinary SDA network. We chose 300 iterations, which met the expected standard.

Figure 8: Comparison of different sample numbers in the SDA network
5.2.3 Comparison of the SDA Network and the GN-SDA Network When the Number of Samples Is Different
In order to further reflect the superiority of the GN-SDA network, the training set and test set are compared in the SDA network and the GN-SDA network respectively (the SDA network and the GN-SDA network have the same activation function and optimization algorithm). The network accuracy is obtained when the number of samples is different, as is shown in Figs. 8 and 9.

Figure 9: Comparison of different sample numbers in the GN-SDA network
It can be seen from Figs. 8 and 9 that when the number of samples is small, the accuracy of the SDA network and the GN-SDA network are relatively low. This is because the deep learning network itself needs to dig useful information from a large amount of data. With the increase in the number of samples, the accuracy of the training set and test set in the SDA network and the GN-SDA network are both on the rise. When the number of samples increases to a certain extent, the sample correct rate of the training set and the sample correct rate of the test set of the two networks gradually stabilize. This shows that the training process based on a large number of data samples has a greater impact on the accuracy of the network. But when the number of samples is the same, it can be seen that the correct rate of the GN-SDA network is higher than that of the SDA network.
It can be seen that in a large amount of redundant SCADA data, the GN-SDA network has a stronger learning ability and better prediction accuracy than the SDA network, and can quickly dig out useful information to realize the fault identification and identification of wind turbine diagnoses.
5.3 Comparison of Different Optimization Algorithms
In order to further illustrate the superiority of the group normalized stacked denoising autoencoding network, it is compared with the CNN network, the ordinary SDA network, the SDA network optimized by the PSO algorithm, and the SDA network optimized by the BN algorithm (the learning algorithms and activation functions of the CNN network, the ordinary SDA network, the PSO-SDA network and the BN-SDA network are all the same). The iteration times of the GN-SDA and the ordinary SDA are 300 times, the CNN is 400 times, the PSO-SDA is 500 times, and the BN-SDA is 250 times. The variable is the size of sample number, and the comparison results are shown in Table 4.

It can be seen from the comparison results that the GN-SDA network greatly improves the network learning accuracy compared to the other models. Due to the backpropagation algorithm used by the CNN network, the demand for data is very large. In addition, the existence of pooling layer in CNN network leads to the loss of some useful information, making CNN network inefficient; SDA is better than CNN, but the data recognition and learning accuracy rate is not high enough; PSO-SDA and BN-SDA are optimized on the basis of the ordinary SDA network. Although the accuracy rate can reach more than 96%, it is still lower than the diagnostic accuracy rate of the method proposed in this paper, and the network training time is long. The GN-SDA effectively solves the problems of redundant data and overfitting, and greatly improves the training and convergence rate of the network. Therefore, the GN-SDA network has more advantages in wind turbine fault identification and diagnosis.
Stacking a noise reduction autoencoding network effectively solves the over-fitting problems of the common autoencoding network. In order to further accelerate the network training and convergence rate, a group normalization algorithm to optimize the stacked noise reduction autoencoding network is used in this paper. The model has been verified, and the conclusions are as follows:
1. Compared with the CNN network, the proposed method effectively solves the problems of data jumble and over-fitting, and achieves the optimal training and convergence rate. At the same time, it has high diagnostic accuracy under different sample numbers;
2. Compared with the common SDA network, the PSO-SDA network and the BN-SDA network, the proposed method has smaller network loss value, faster convergence speed and better generalization, and has an higher diagnosis accuracy with the same number of samples, achieving a positive certain fault diagnosis ability.
The application of deep learning technology in fault identification and diagnosis is one of the main research directions as we move into the future. The method proposed in this paper to optimize the stacked noise reduction self-encoding network using a group normalization algorithm can effectively identify the fault data of wind turbines, and then accurately diagnose the fault types of wind turbines, in the aspect of the operation and maintenance of wind turbines has good application prospect.
Funding Statement: Supported by the National Natural Science Foundation of China (51767014), 2018--2021.
Conflicts of Interest: The authors declare that they have no conflicts of interest to report regarding the present study.
References
1. Rezamand, M., Kordestani, M., Carriveau, R., Ting, S. K., Saif, M. (2020). Critical wind turbine components prognostics: A comprehensive review. IEEE Transactions on Instrumentation and Measurement, 69(12), 9306–9328. DOI 10.1109/TIM.2020.3030165. [Google Scholar] [CrossRef]
2. Kordestani, M., Saif, M., Orchard, M. E., Razavi-Far, R., Khorasani, K. (2021). Failure prognosis and applications–A survey of recent literature. IEEE Transactions on Reliability, 70(2), 728–748. DOI 10.1109/TR.2019.2930195. [Google Scholar] [CrossRef]
3. Xu, J. L., Ge, Z. S., Chen, Q. (2018). Overview of wind turbine fault diagnosis. Science and Technology Vision, 36, 34–36. [Google Scholar]
4. Gao, P. (2020). Analysis of wind turbine condition monitoring and fault diagnosis technology. Modern Salt Chemical Industry, 5, 93–94. [Google Scholar]
5. Yang, W. (2018). Summary of research on fault diagnosis and prediction technology of wind turbine generators. Engineering Construction and Design, 4, 77–78. [Google Scholar]
6. Ma, Y., Cong, P. T., Liu, J. Y., Zhang, H. P., Wang, X. (2021). Wind turbine stator current weak fault information extraction technology. One Heavy Technology, (3), 62–63+11+16. [Google Scholar]
7. Moeini, R., Tricoli, P., Hemida, H., Baniotopoulos, C. (2017). Increasing the reliability of wind turbines using condition monitoring of semiconductor devices: A review. IET Renewable Power Generation, 12(2), 182–189. DOI 10.1049/iet-rpg.2017.0477. [Google Scholar] [CrossRef]
8. Zhao, H. S., Yan, X. H., Wang, G. L., Yin, X. L. (2019). Application of deep self-encoding network and XGBoost for wind turbine generator fault diagnosis. Automation of Electric Power Systems, 1, 81–86. [Google Scholar]
9. Gui, B. B., Lin, G. H., Xie, Y. Y., Hu, H. (2019). PSO-BP-based wind turbine gearbox fault diagnosis. Journal of Hunan Institute of Engineering (Natural Science Edition), 3, 21–25. [Google Scholar]
10. Wang, T. (2021). Research on fault Diagnosis of Wind Turbine Rotor System based on deep learning (Master’s Thesis). Lanzhou, China: Lanzhou Jiaotong University, Lanzhou. [Google Scholar]
11. Du, X. J., Jia, L. L. (2021). Rolling bearing fault diagnosis based on optimized stacked denoising autoencoder. Journal of Jilin University (Engineering and Technology Edition). https://doi.org/10.13229/j.cnki.jdxbgxb20210415. [Google Scholar]
12. Qin, D. P. (2019). Online monitoring and fault diagnosis model of wind turbine based on stacked noise reduction self-coding network (Master’s Thesis). Shanghai Jiao Tong University, Shanghai. [Google Scholar]
13. Chen, L., Cao, J., Wu, K., Zhang, Z. (2021). Application of generalized frequency response functions and improved convolutional neural network to fault diagnosis of heavy-duty industrial robot. Robotics and Computer-Integrated Manufacturing. https://sci-hub.ee/10.1016/j.rcim.2021.102228. [Google Scholar]
14. Souza, R. M., Nascimento, E., Miranda, U. A., Silva, W., Lepikson, H. (2020). Deep learning for diagnosis and classification of faults in industrial rotating machinery. Computers & Industrial Engineering, 153, 107060. DOI 10.1016/j.cie.2020.107060. [Google Scholar] [CrossRef]
15. Vincent, P., Larochelle, H., Bengio, Y., Manzagol, P. A. (2008). Extracting and composing robust features with denoising autoencoders. Proceedings of the 25th International Conference (ICML 2008), Helsinki, Finland. [Google Scholar]
16. Yang, X. Y., Lv, W., Wang, C., Li, S. W. (2021). Bearing fault diagnosis based on sliding Window-KL divergence and improved stack self-coding. Machine Tools and Hydraulics, 17, 179–184. [Google Scholar]
17. Zhang, J. S., Jang, W., Pan, W. J. (2021). Research on GIS insulation defect recognition based on stack-type noise reduction autoencoder. Electrical Automation, 4, 81–83+118. [Google Scholar]
18. Zhao, Z. Y. (2017). Python machine learning algorithm (The First Version). Beijing, China: Electronic Industry Press. [Google Scholar]
19. Chollet, F. (2018). Python deep learning (The First Version). Beijing, China: People Post Press. [Google Scholar]
20. Yang, Y., Du, F. (2018). Deep learning in action. (The First Version). Beijing, China: Tsinghua University Press. [Google Scholar]
21. Wu, Y. X., He, K. M. (2020). Group normalization. International Journal of Computer Vision, 128(3), 742–755. DOI 10.1007/s11263-019-01198-w. [Google Scholar] [CrossRef]
22. Chen, Z., Mauricio, A., Li, W., Gryllias, K. (2020). A deep learning method for bearing fault diagnosis based on cyclic spectral coherence and convolutional neural networks. Mechanical Systems and Signal Processing, 140(3), 106683. DOI 10.1016/j.ymssp.2020.106683. [Google Scholar] [CrossRef]
23. Xu, Z. W. (2020). Research on the condition monitoring method of doubly-fed wind turbine generator system based on deep learning (Master’s Thesis). Zhejiang University of Technology, Zhejiang, China. [Google Scholar]
24. Guo, T. T. (2019). On-line recognition of abnormal state of variable-condition pitch system of wind turbines (Master’s Thesis). Beijing Jiaotong University, Beijing, China. [Google Scholar]
25. Li, G., Qi, Y., Li, Y. Q., Zhang, J. F., Zhang, L. H. (2021). Research progress on fault diagnosis and state prediction of wind turbines. Automation of Electric Power Systems, 4, 180–191. [Google Scholar]
Cite This Article
 Copyright © 2022 The Author(s). Published by Tech Science Press.
This work is licensed under a Creative Commons Attribution 4.0 International License , which permits unrestricted use, distribution, and reproduction in any medium, provided the original work is properly cited.
 Downloads
 Citation Tools