
 Submit a Paper
 Propose a Special lssue
 Open Access
ARTICLE
Voltage Profile Enhancement and Power Loss Reduction with Economic Feasibility Using Small Capacity Distribution Transformers
1 Department of Electric Power Techniques, Al-Hussain University College, Karbala, 56001, Iraq
2 School of Artificial Intelligence, Wuchang University of Technology, Wuhan, 430223, China
3 State Company of the North Distribution Electricity, Ministry of Electricity, Baghdad, 10013, Iraq
4 Department of Informatics and Software Engineering, Cihan University-Erbil, Erbil, Kurdistan, 44001, Iraq
5 Najaf Gas Turbine Power Plant, General Company of the Electricity Production, Ministry of Electricity, Baghdad, 10013, Iraq
6 General Company of the Electricity Transmission-North Region, Ministry of Electricity, Baghdad, 10013, Iraq
* Corresponding Author: Rasool M. Imran. Email:
Energy Engineering 2022, 119(6), 2447-2467. https://doi.org/10.32604/ee.2022.021871
Received 10 February 2022; Accepted 31 May 2022; Issue published 14 September 2022
 View Full Text
 Download PDF
Abstract
Usually, rural areas can be electrified via three-phase distribution transformers with relatively large capacities. In such areas, low voltage lines are used for long distances, which cause power losses and voltage drop for different types of consumers. Reducing losses and improving voltage profiles in rural distribution networks are significant challenges for electricity distribution companies. However different solutions were proposed in the literature to overcome these challenges, most of them face difficulties when applied in the conventional distribution network. To address the above issues, an applicable solution is proposed in this paper by installing a number of small-capacity distribution transformers instead of every single large-capacity transformer in rural areas. The proposed approach is implemented in the branch network of Al-Hoqool village, which belongs to the Nineveh distribution network. The network has been inspected on-site, drawn, and analyzed using the electrical systems analysis program (ETAP). The analysis showed that using the single-phase pole-mounted transformers can improve the voltage in the network’s end by 29% and enhance the voltage profile for all consumers. The analysis has also demonstrated that the modification can reduce the total power losses by 78% compared to the existing network. Concerning the economic aspect, the payback period for the proposed network is assigned to be 20 months.
Keywords
Electricity demand is rising continuously due to the population increment and economic growth, which necessitates increasing the generated power accordingly [1]. The electricity sector in Iraq has to face growing demand on the one hand and addressing the persistent issue of generation shortage on the other hand [2]. Another adverse impact on the electricity sector comes from permitting low-efficiency appliances that consume high power [3,4]. Moreover, the unauthorized connections at some regions of the distribution network (DN) increase the burden and prevent controlling the issue. A solution to the mentioned issues could be increasing electricity production, which may be tricky due to the present financial crisis. A more economical solution can be presented by reducing the power loss (PL) in the DN [5]. Reducing PL saves power and improves the voltage profile at the consumer end [6]. The DN is the last stage of the power grid that represents the link between the high voltage transmission system and consumers. The DN distributes the power from the substation to various consumers using distribution lines and distribution transformers (DTRs). In designing a DN of a power grid, the line length should be short because a long line means more technical power losses due to the high current at a low voltage level [7]. However, in some rural areas, the three-phase DTRs supply the consumers through long distribution lines due to the long distances between consumers. This issue needs to be addressed to avoid extensive PLs during the high current, regulate the voltage at the user end, and reduce the rating capacity of power equipment. According to a study for calculating the technical losses in elected urban areas conducted by the state company of the north distribution electricity (SCNDE), the technical PL of the low voltage (LV) network represents about 7.3% of the total power. This percentage increases in rural areas because LV lines extend for relatively long distances, which affects the performance of the DN due to voltage reduction.
The 2014 World Bank Report stated that the world average annual PL in the transmission and distribution systems is about 8.26% of the transmitted power [8]. Losses in DNs form 5% of the total load in the power system. Such losses became a significant concern and a greater challenge for electrical engineers. According to the mentioned report, the technical and non-technical losses rate of the transmission and distribution systems in Iraq is 50.632%. This rate indicates a significant issue compared to some other countries, e.g., the losses rate forms 5.956% in the United States, 5.430% in Australia, and 4.485% in Japan [9].
DTR is a significant piece of equipment in DN that plays a vital role in system efficiency [10]. The overall efficiency of a DTR depends on how much the transformer is being loaded [11]. The load factor, which is defined as the ratio of the average load to the peak load, plays an essential role in determining the transformer size [12]. Transformers must be sized according to the expected peak load instead of the average load. Thus, when there is a considerable difference between the peak and average loads, the load factor will be small. Distribution companies always try to boost network efficiency by increasing equipment efficiency along with minimizing the operating cost. Replacing the traditional large-capacity DTRs with suitable multiple small capacity transformers available in the global markets can contribute to efficiency enhancement and cost minimization. The traditional large-capacity DTR is usually placed at the nearest location of the load, and the loads are connected to the DTR through long LV lines. The long LV lines cause a considerable voltage decrement, especially for consumers who fall at the tail end [13,14].
1.2 Literature Review and Research Gap
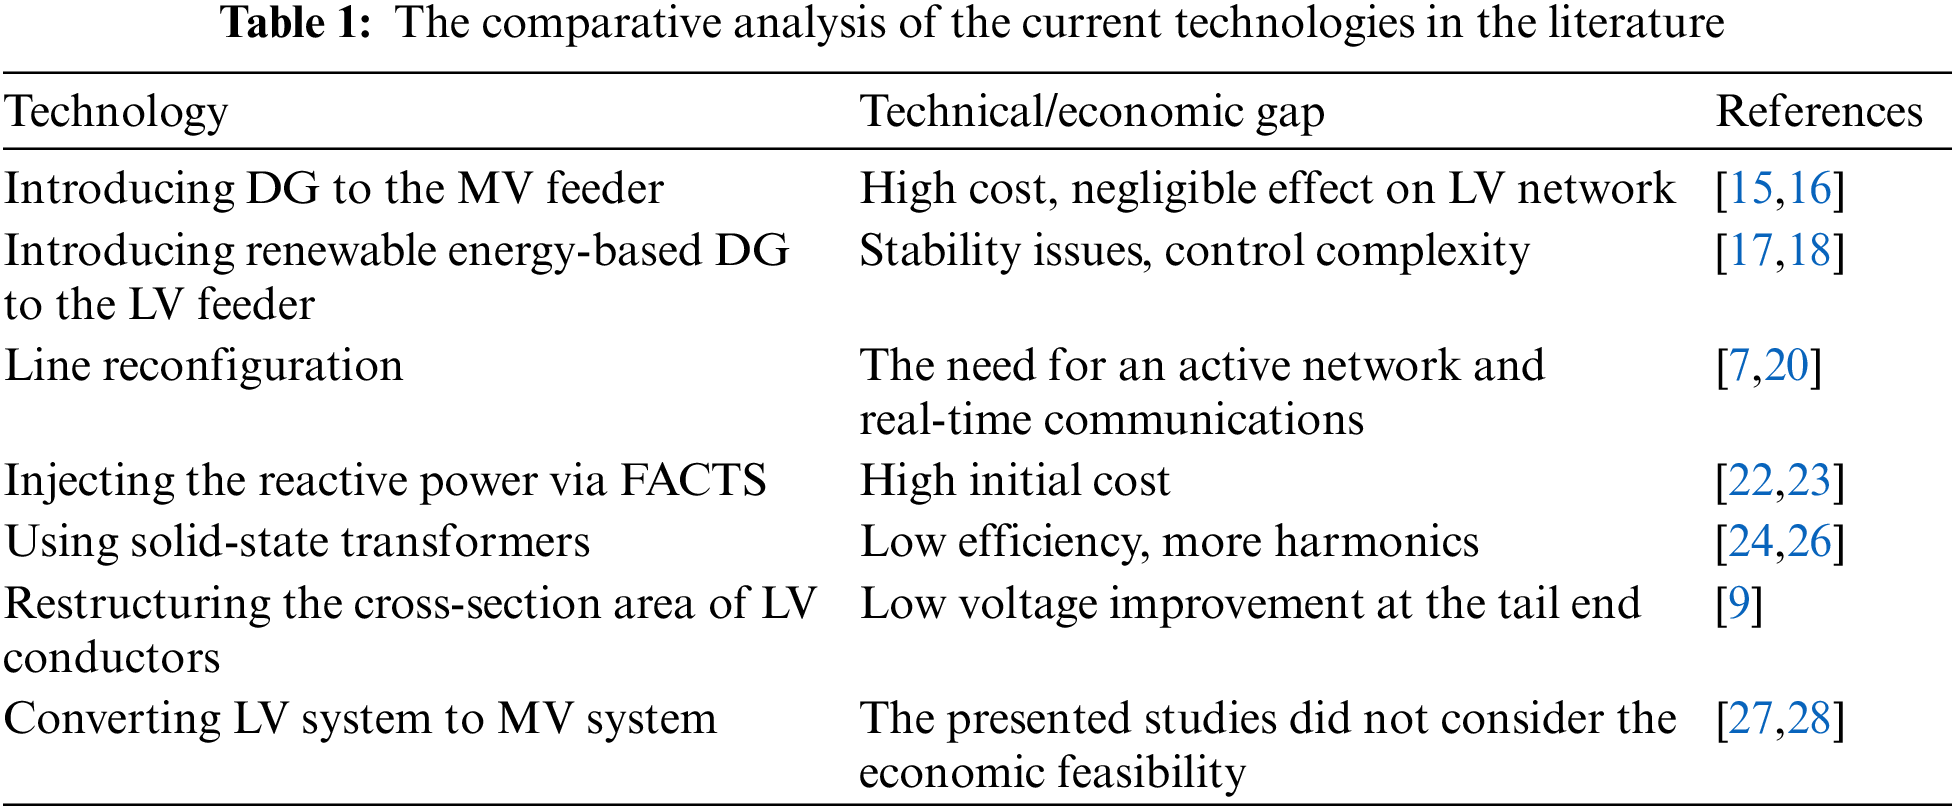
Voltage regulation in DN has been discussed in a wide range of studies with different strategies. Authors in [15,16] proposed introducing distributed generator (DG) to the MV feeder of DN. Such a proposal may not have a practical impact on enhancing the voltage profile at the LV feeder and consumer side. Renewable energy-based DGs can be used in the LV network to boost the voltage profile, which was proposed in [17,18]. Integrating non-dispatchable energy resources may introduce stability issues in the power grid. Also, such integration requires an intelligent control system to avoid reverse power flow [19]. A line reconfiguration method can be applied to distribute the load between feeders when needed and thereby reduce the PL [7,20]. The line reconfiguration method improves the voltage profile at both the LV and MV sides of the DN. But it is a real-time strategy that requires active DN with an intelligent control system [21]. The conventional DN may lack real-time communications between the power system and the load. A study to compensate the reactive power and enhance the voltage profile using flexible AC transmission systems (FACTS) was proposed in [22]. Injecting the reactive power via FACTS can improve the voltage profile effectively, and it is suitable for sensitive loads [23]. FACTS devices cannot respond to the challenges of the present network as they transmit a limited amount of power unless utilizing high rating devices with a high initial cost. Power loss reduction by replacing the core-type transformers with solid-state transformers is also suggested in [24]. Such transformers have the capability to run under different load conditions due to their fast response. Also, these transforms are able to auto-enhance the voltage profile in the MV lines of DN. Possible drawbacks of using solid-state transformers are presented by the efficiency reduction, cost increment, and the amount of harmonics injected into the DN due to the major use of power electronic components [25,26]. An approach to restructuring the cross-section area of LV conductors and replacing them with conductors of larger cross-section areas was presented in [9]. However the mentioned approach is suggested to reduce the PL, the voltage profile improvement cannot reach a satisfactory level at the tail end due to conductor physical limitations. Another solution is proposed to convert the LV system in DN to an MV system, including transformers and lines [27]. This approach is applicable to conventional DN and does not require updating the control of the power grid. Optimization of the unit number of transformers is proposed for the same approach in order to minimize the number of transformers used in the MV system [28]. This approach focused on reducing the power losses and enhancing the voltage profile. Nevertheless, the economic visibility was not considered, and the payback period was not determined. The discussed technologies presented in the literature and their technical/economic gaps are also clarified in Table 1.
The proposed approach aims to provide the consumer with higher quality power and reduce the amount of PL produced in the long LV lines. This paper focuses on reducing power losses, enhancing voltage profile, and assessing the economic feasibility of modifying the DNs of rural areas in Northern Iraq. The main contributions of the paper can be clarified as follows:
• Introduce an applicable solution to reduce PLs in the LV lines and improve the voltage at the consumer end.
• Install a new type of DTRs to reinforce the Iraqi radial DN.
• Calculate the economic feasibility of introducing these DTRs to the DN.
This paper consists of seven sections as follows: Section 2 presents the traditional DTR in Iraq, its design, and its no-load and load losses. Section 3 gives an idea of the pole-mounted single-phase DTR and its types. Section 4 contains an overview of the network size and geographical area of SCNDE. Section 5 clarifies the case study of this paper and the implementation of the ETAP program to analyze the particular network. This section also lists the steps required to calculate the technical losses and shows the results of the economic feasibility analysis. Section 6 discusses the advantages and limitations of the proposed method. Section 7 concludes the paper and gives some future proposals.
2 Traditional Distribution Transformers in Iraq
DTRs are the essential devices that receive the power, step down its voltage, and distribute it to the loads as required. The existing DTRs are supplied by the distribution voltage of 11 kV to feed the loads through the secondary winding with a line voltage of 0.416 kV [29]. The primary windings of the transformer are connected in the form of a Delta. In contrast, the secondary windings are connected in a Star form with a link to the ground from the interconnection (neutral) point. Such connection ensures balancing and stabilizing the loads on the three phases of the transformer, as shown in Fig. 1a. Transformer iron-core is often made of silicon steel and structured according to the transformer capacity. Low-voltage coils are often made from copper, while high-voltage coils are made of varnished copper. Fig. 1b shows the core and windings structure of the distribution transformer.
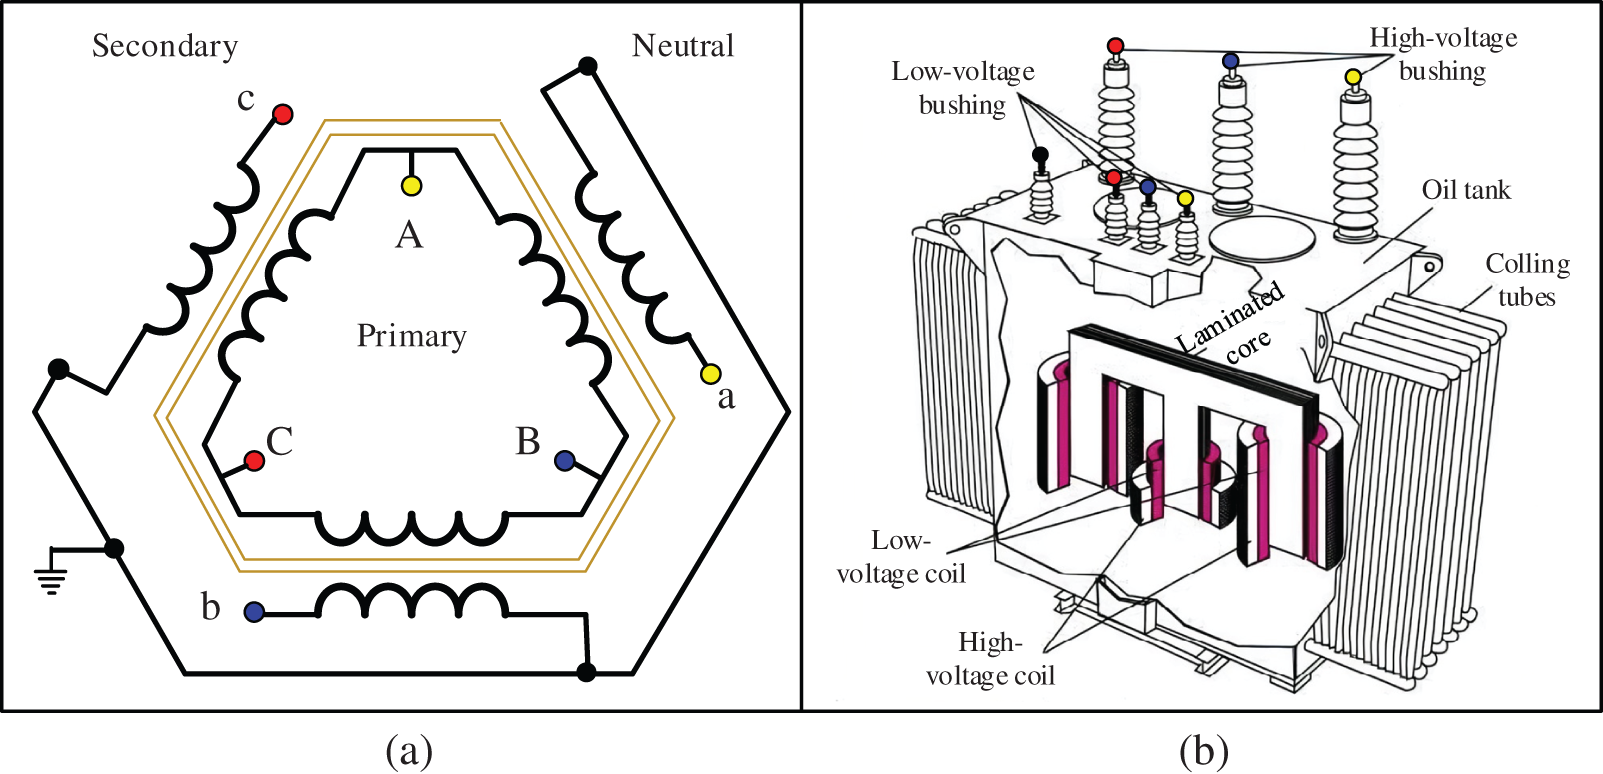
Figure 1: Distribution transformers; (a) Scheme for interconnection of 11/0.4 distribution transformers; (b) The cross-section in distribution transformer
Generally, the transformers are considered the most efficient electrical machines, with efficiency typically about or higher than 95%. However, the cost of PL is an essential factor in selecting transformers for networks. The transformer losses are divided into two components, no-load losses, and load losses. The no-load losses in the transformer core occur 24 h a day, 365 days a year when voltage is applied to the transformer regardless of the load. These losses are mostly constant, appearing even when the secondary windings are open. No-load losses can be divided into:
• Hysteresis losses in iron-core platelets.
• Eddy currents losses in ferrous cardiac platelets.
• I2R losses due to no-load current.
• Stray eddy current losses.
• Dielectric losses.
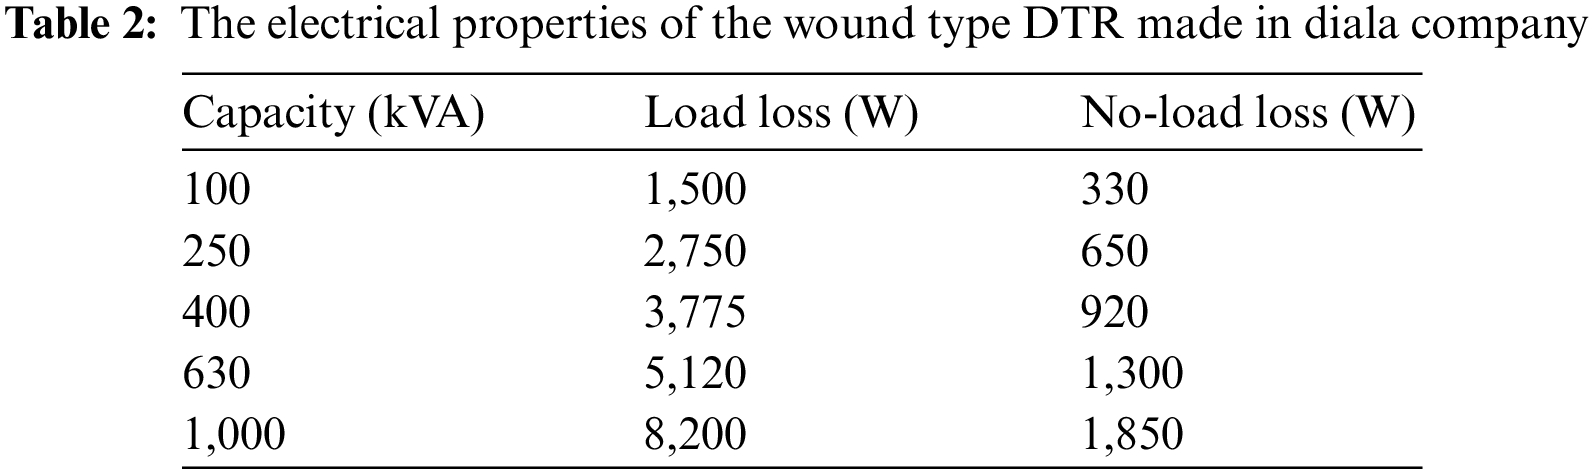
Hysteresis and eddy current losses contribute to more than 99% of the no-load losses, while other losses are trivial and can be ignored. Load losses are varied according to the load on the transformer, and they represent heat losses in the conductor due to both load current and eddy current. These losses increase with increasing temperature due to the proportional increment in conductor resistance. Load losses are hard to quantify due to the difficulty in estimating both peak load and load factor. The estimation difficulty comes from the load alteration in terms of the day, week, and season due to the ambient temperatures. Hence, load estimation may require intelligent programs that summarize and analyze the load data for long periods over several years. In Iraq, there are two different designs for three-phase transformers of various capacities (100, 250, 400, 630, and 1,000) kVA, Core-type and Wound-type. Table 2 shows the electrical properties, including load and no-load losses, of the wound type DTRs made in Iraq by Diala Company, with 11 kV [30].
3 Single-Phase Pole-Mounted Distribution Transformers
Single-phase pole-mounted DTRs have capacities between 5 and 100 kVA with a voltage up to 36 kV. Transformers of this type are usually oil-immersed and suitable for installation on poles [31]. They represent an economical choice, especially for small DNs. Depending on the load requirements, these transformers can be connected between two phases of a three-phase system or between a single-phase and ground. Single-phase pole-mounted transformers are classified into four types depending on the protection system, as follows:
• Conventional “S”.
• Surge-protecting “SP”.
• Current-protecting “CP”.
• Self-protected “CSP”.
These types represent a wide range of protection capabilities to meet various load requirements. This paper deals with the first and fourth types, shown in Fig. 2, due to their importance for the utilized network. Considering a single-phase version of the transformer, different sizes are available as 1, 1.5, 2, 3, 5, 7.5, 10, 15, 25, 37.5, 50, and 75 kVA. The available sizes for three-phase transformers are 3, 6, 9, 15, 30, 45, and 75 kVA. Concerning the current plan of Iraq ministry of electricity to gradually replace the line voltage of DN from 11 kV to 33 kV, this type of transformer has a dual voltage switch that enables it to work on both line voltages 11 kV and 33 kV. Furthermore, these transformers operate with both network frequencies, 50 Hz and 60 Hz.
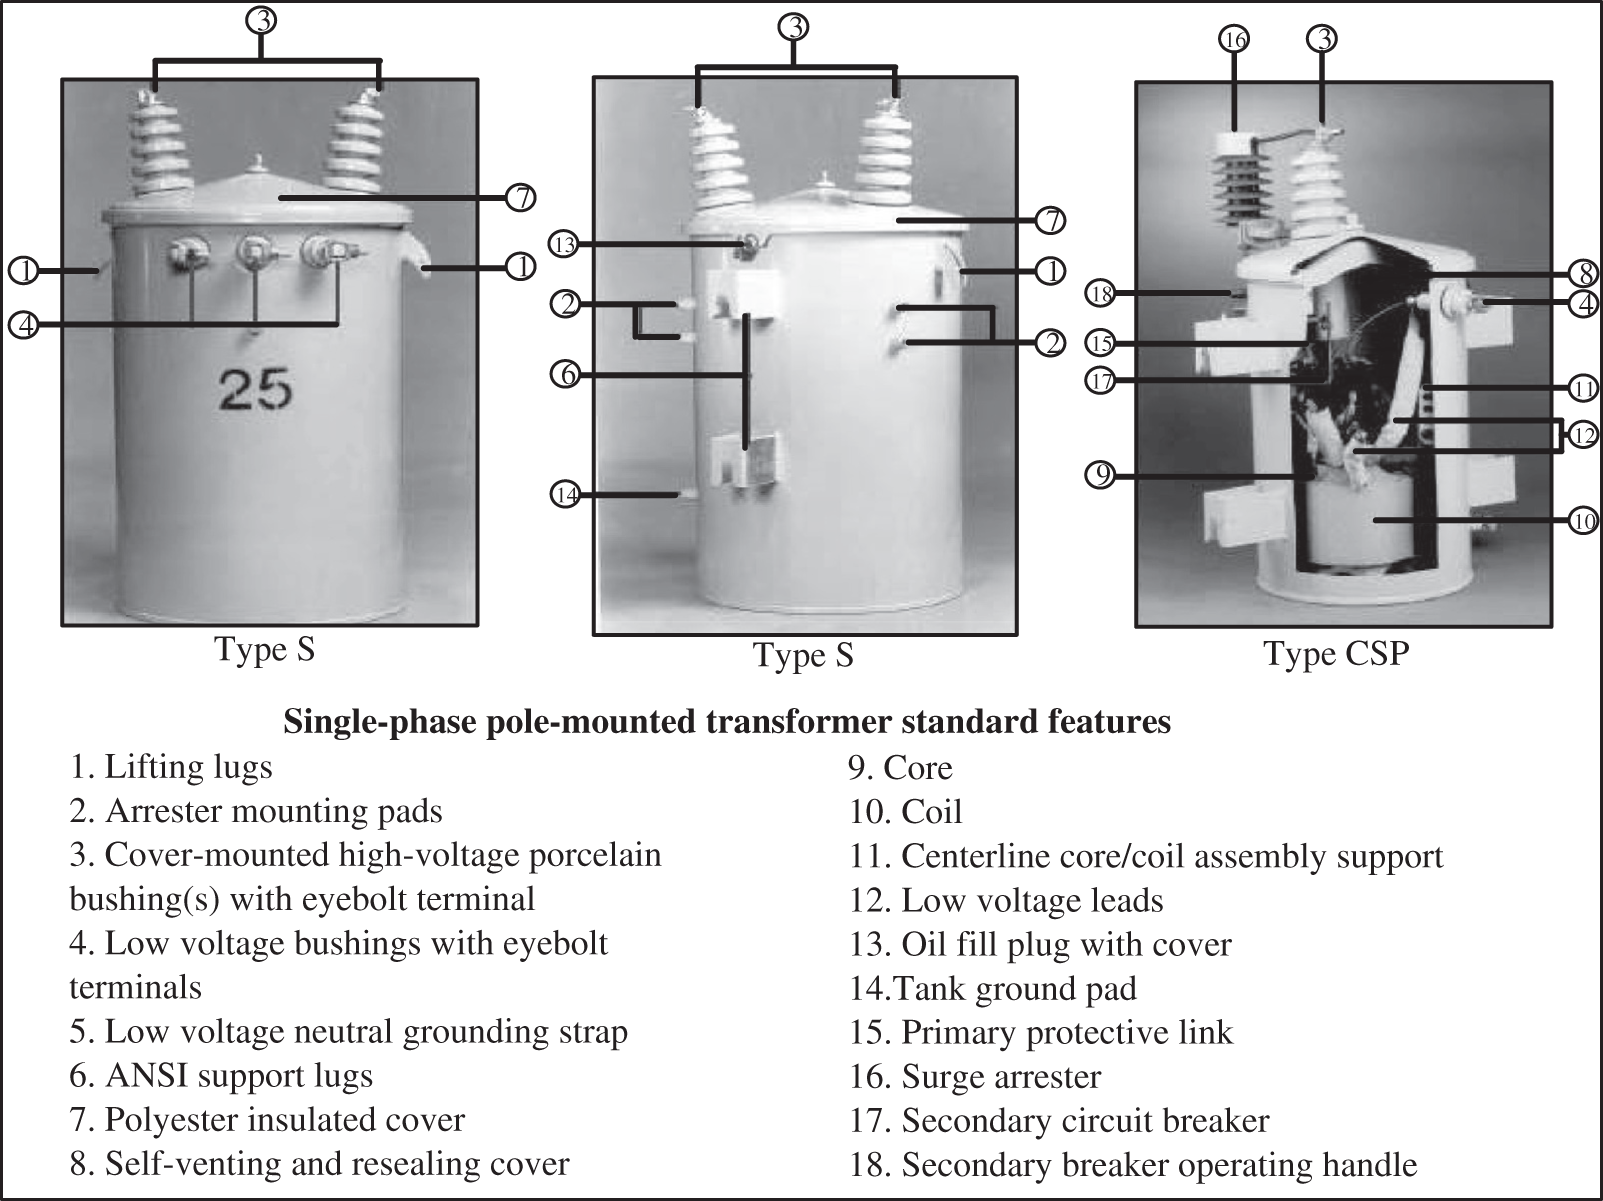
Figure 2: Standard S-Type and CSP-Type single-phase distribution transformers
4 State Company of the North Distribution Electricity
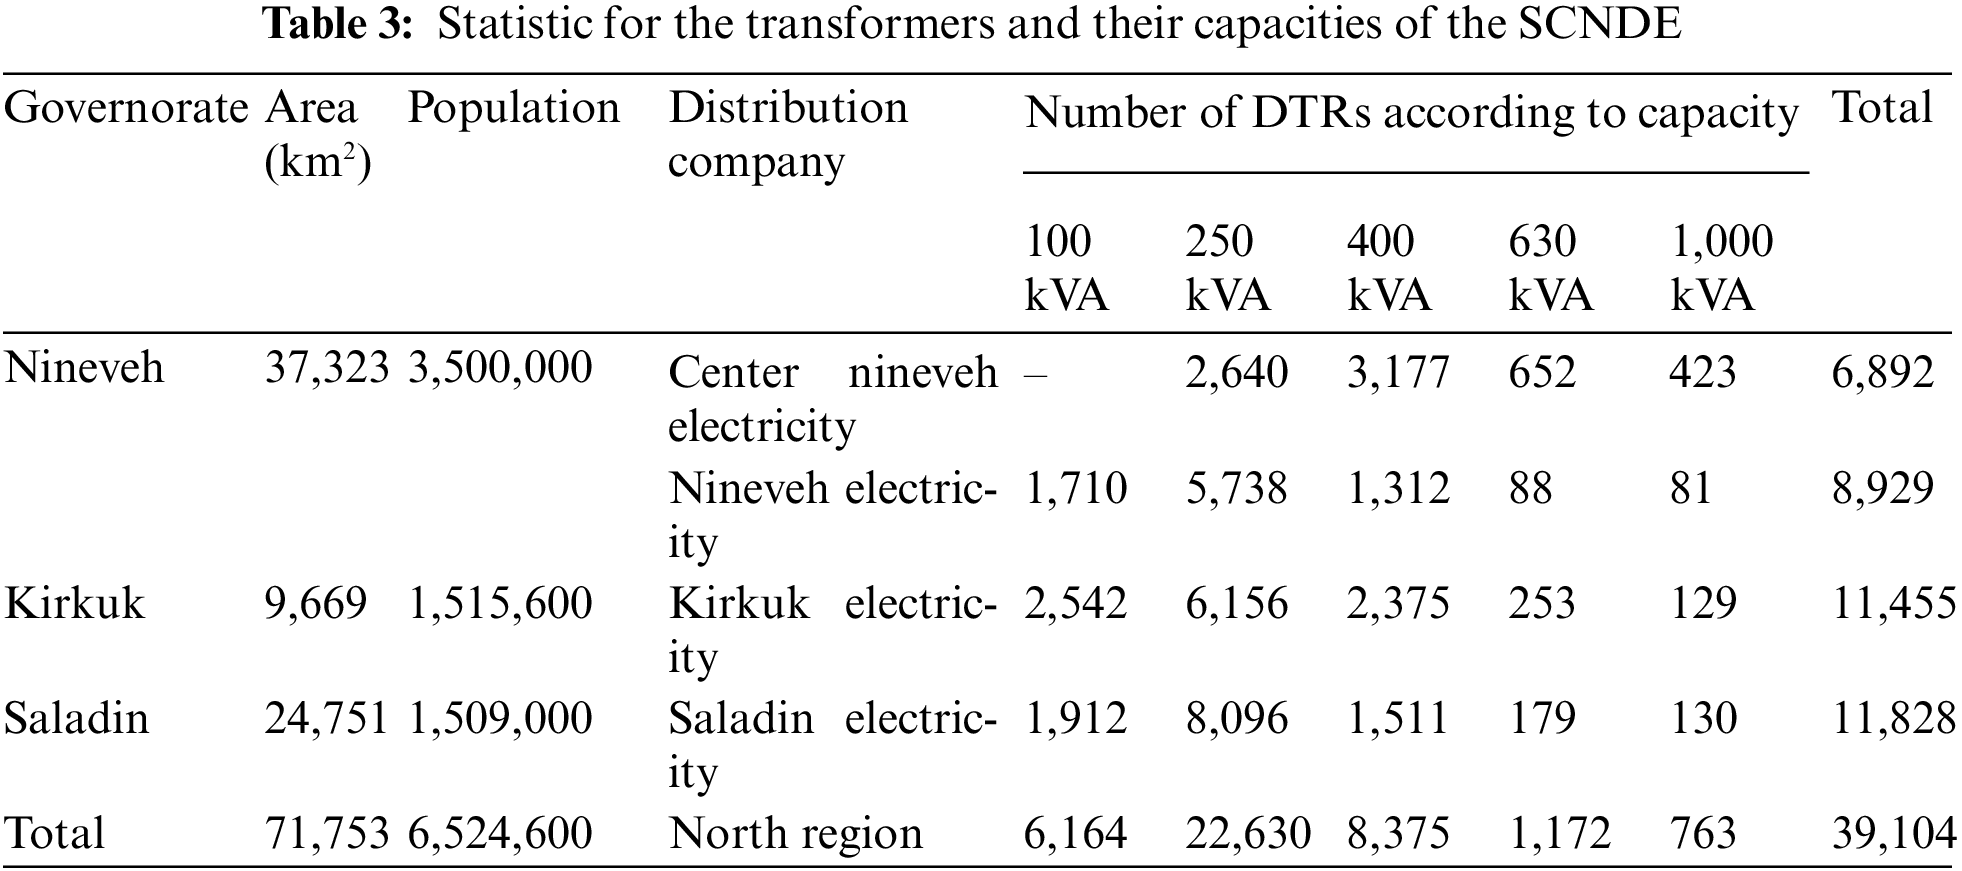
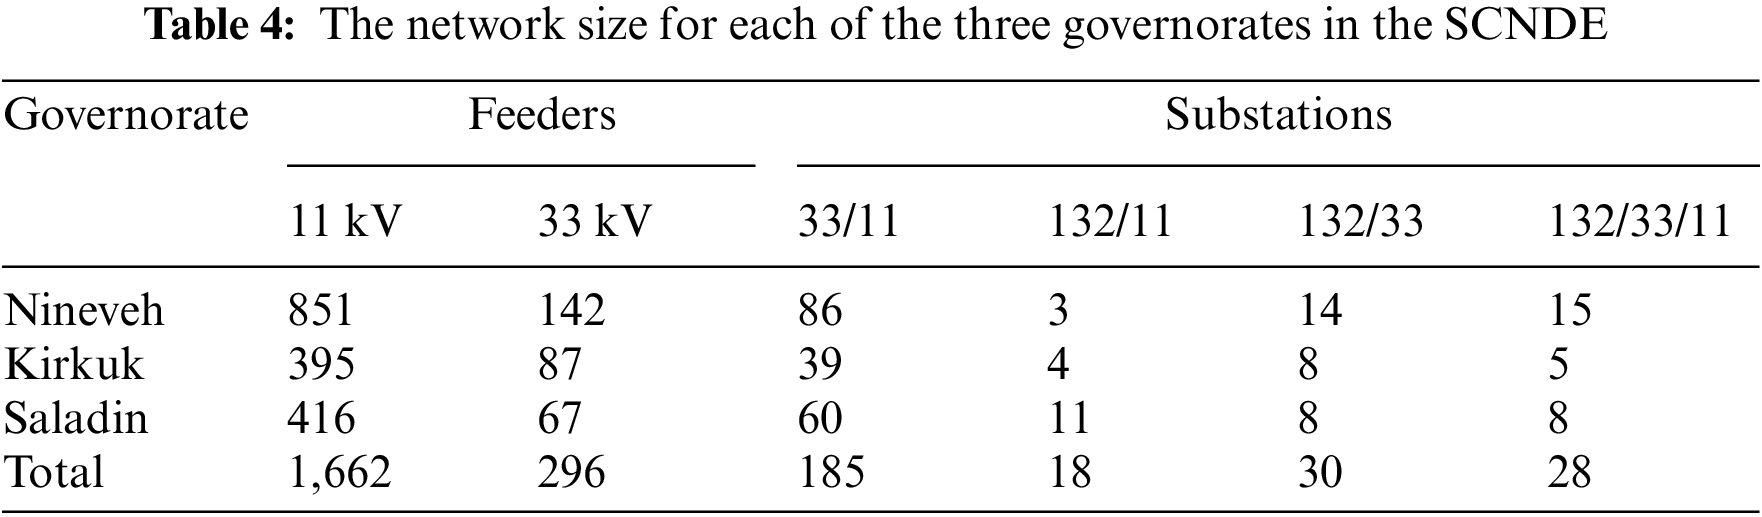
SCNDE is one of the formations of the ministry of electricity in Iraq that provides distribution services to three governorates (Nineveh, Kirkuk, and Saladin). The map in Fig. 3 shows the geographical service area of the company, where the study is conducted on one of its DNs. SCNDE provides the services to 801,294 subscribers of all categories (residential, commercial, agricultural, industrial, and governmental) with 39,104 transformers of different capacities and 1662 MV feeders. The company provides its services to more than 6.5 million citizens over an area of more than 71,500 km2. Table 3 shows the number of operating transformers, their capacities, the geographical area, and the population density of each governorate in the company. Table 4 illustrates the network size for each of the three governorates.
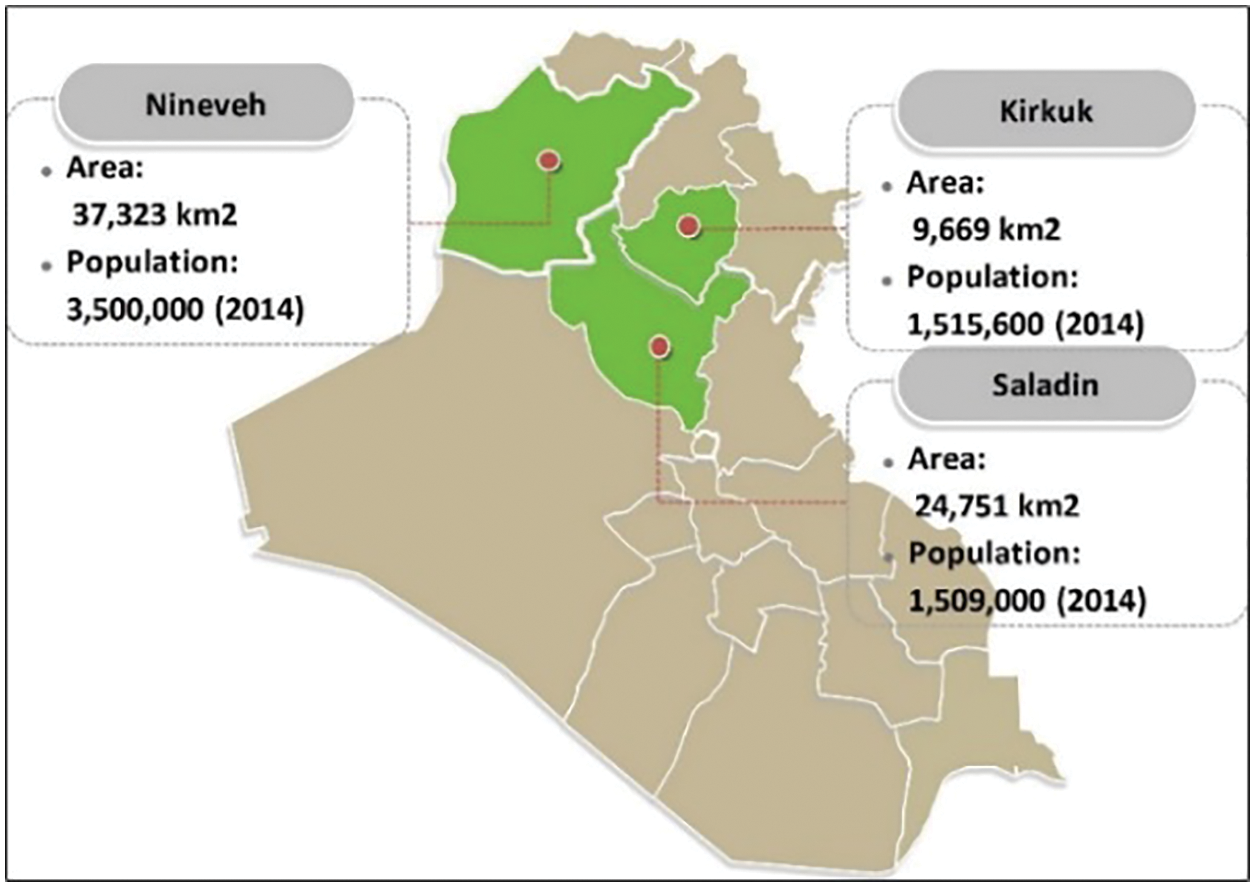
Figure 3: Iraq map clarifying in green the geographical service area for the SCNDE
This section presents the economic and technical feasibility of the small capacity distribution transformers in a rural area of the SCNDE. The following steps are considered to conduct the case study.
Step 1: Choosing a network of a village located within the geographical zone of the SCNDE
A network of the village named Al-Hoqool in the governorate of Nineveh has been selected. Fig. 4 shows the village is located on the main road between two districts, Tallkayf and Batnay, precisely on the longitude and latitude of N36.511880 and E43.119302, respectively.
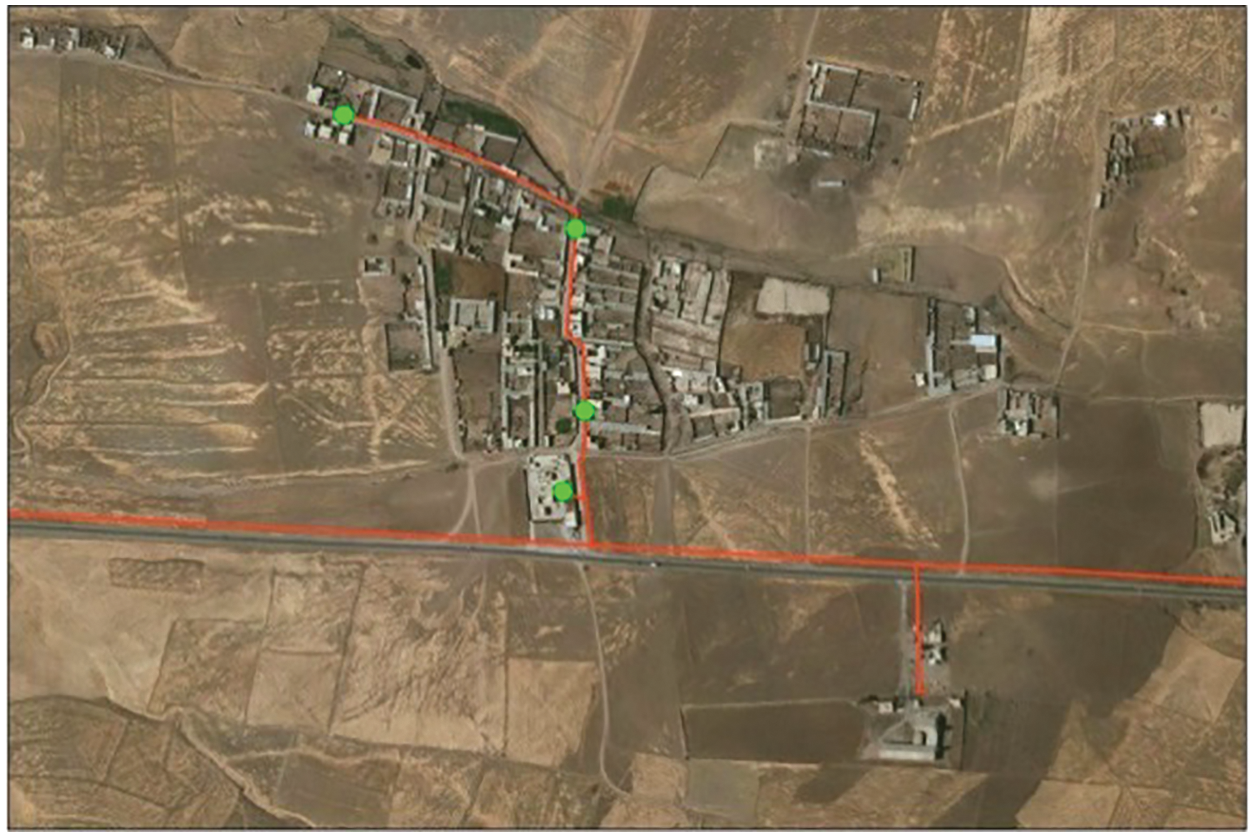
Figure 4: Al-Hoqool village on the map with DTRs marked in green colour
Step 2: On-site inspection and network plotting
The village is fed by an 11 kV feeder from the Tallkayf substation (voltage 33/11 and capacity of 2 × 16 MVA). The maximum load for the station is 14.4 MVA. The highest load for the feeder is 263 A and the feeder load during the fall period is 175 A. The feeder length includes 110 m cable and 10,220 m overhead line. There are four DTRs in the village, as shown in Fig. 4. This study is concerned with the DTR (No. 11278) of 250 kVA that supplies 24 residential loads, as shown in Fig. 5. This DTR was chosen because it has many residential loads, whereas several suffer from a high voltage drop, especially at node 39. Also, many unauthorized connections were reported at some nodes of this DTR network. Fig. 5 was plotted after performing an on-site review for LV and MV lines of the specified DN. The plot describes the MV lines and eight poles marked with red colour. The LV network of 1,471 m length and 31 tubular steel poles is indicated in green colour.
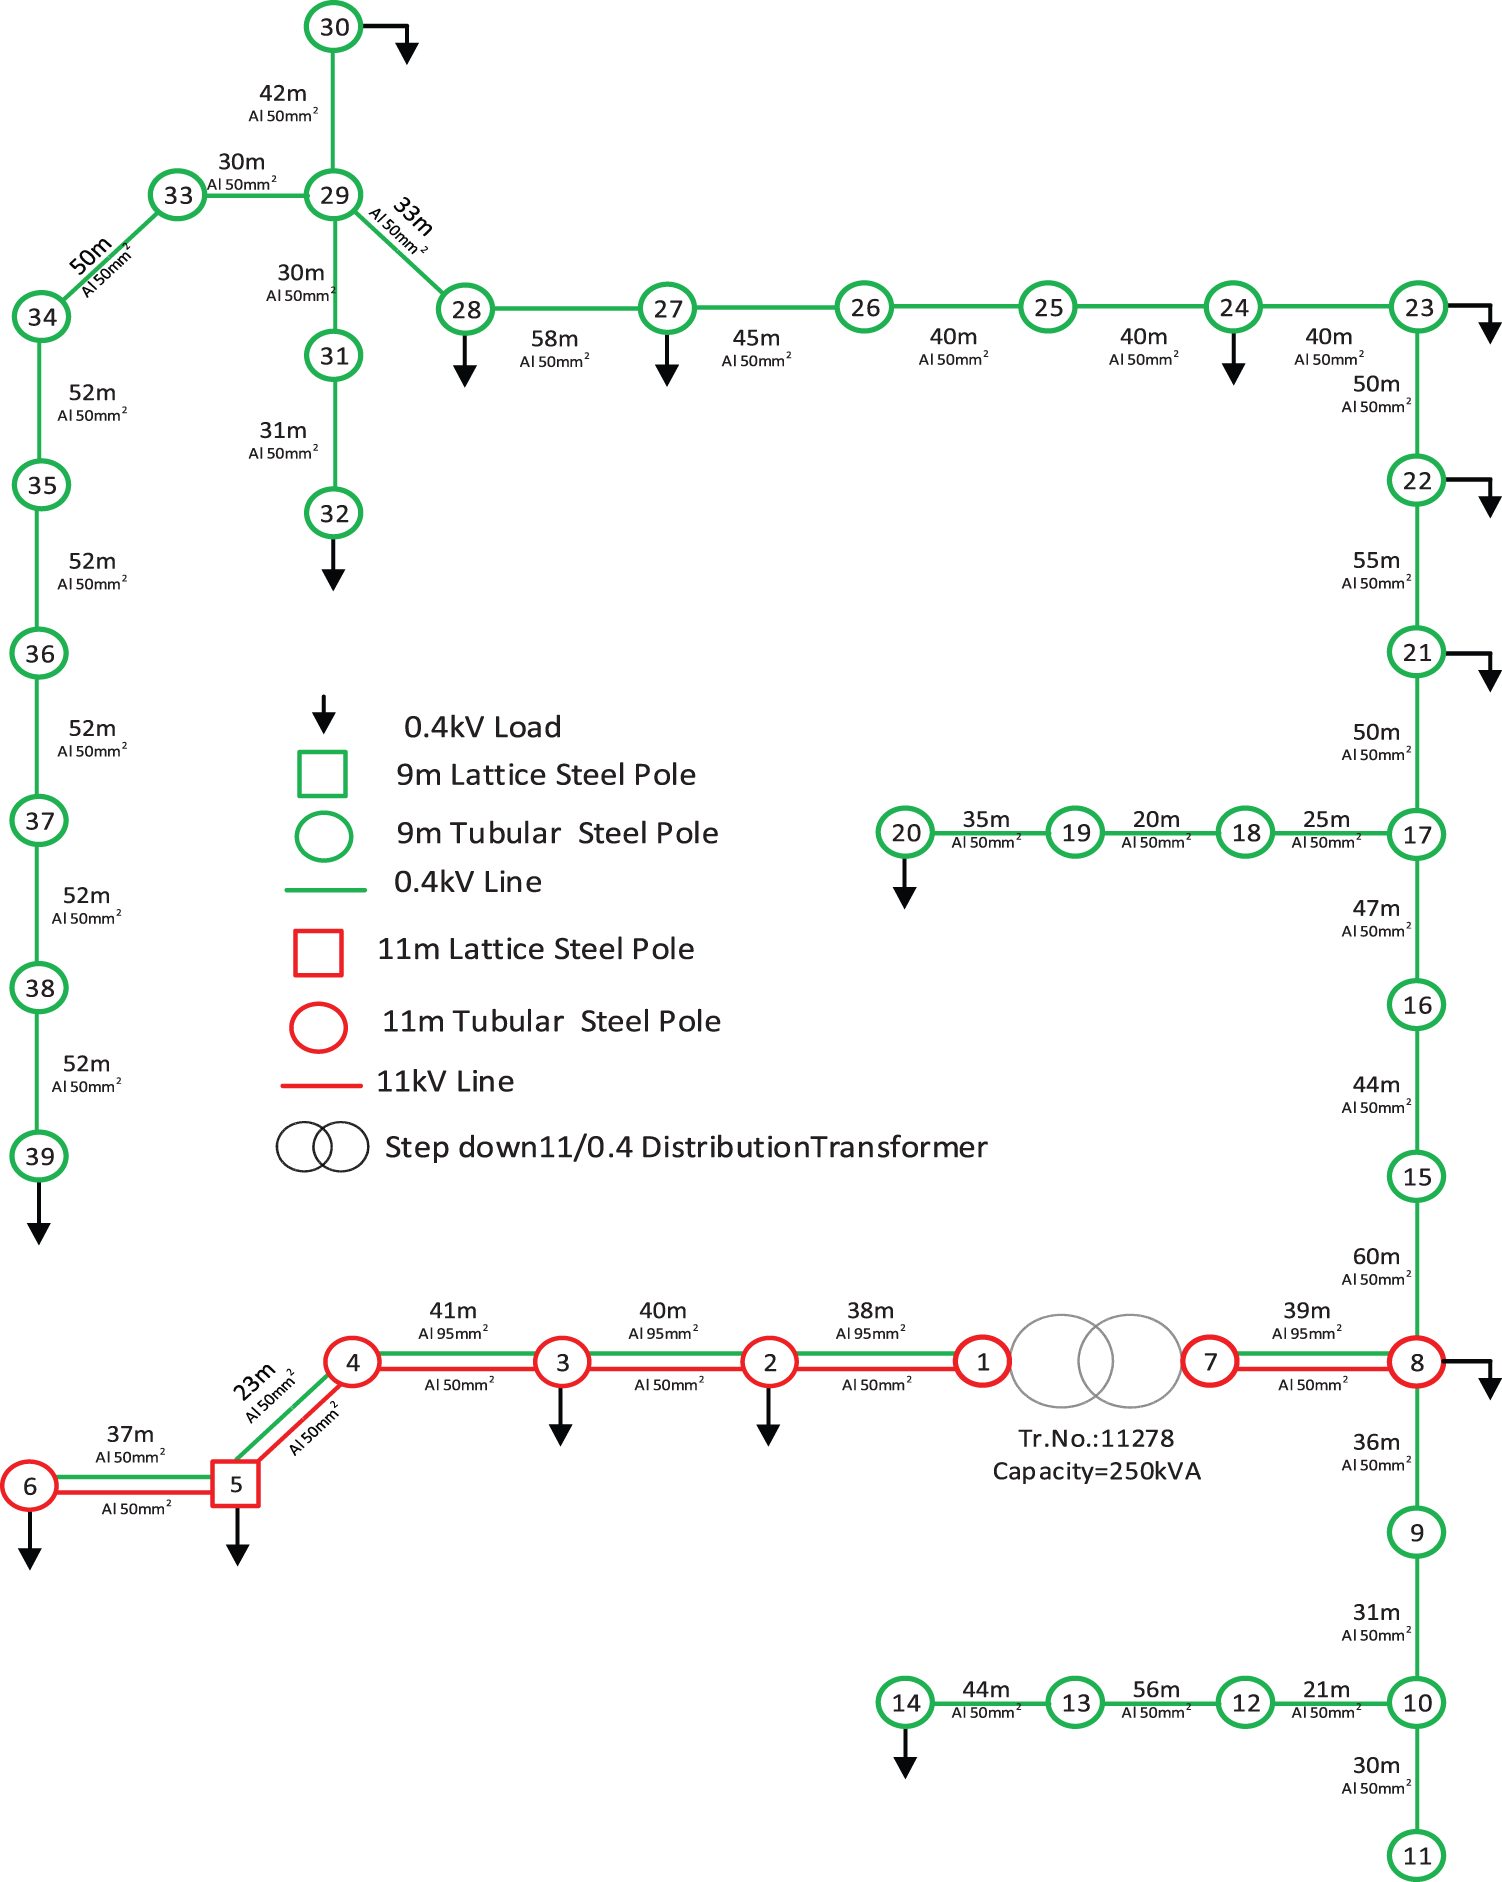
Figure 5: The case study network with DTR No. 11278
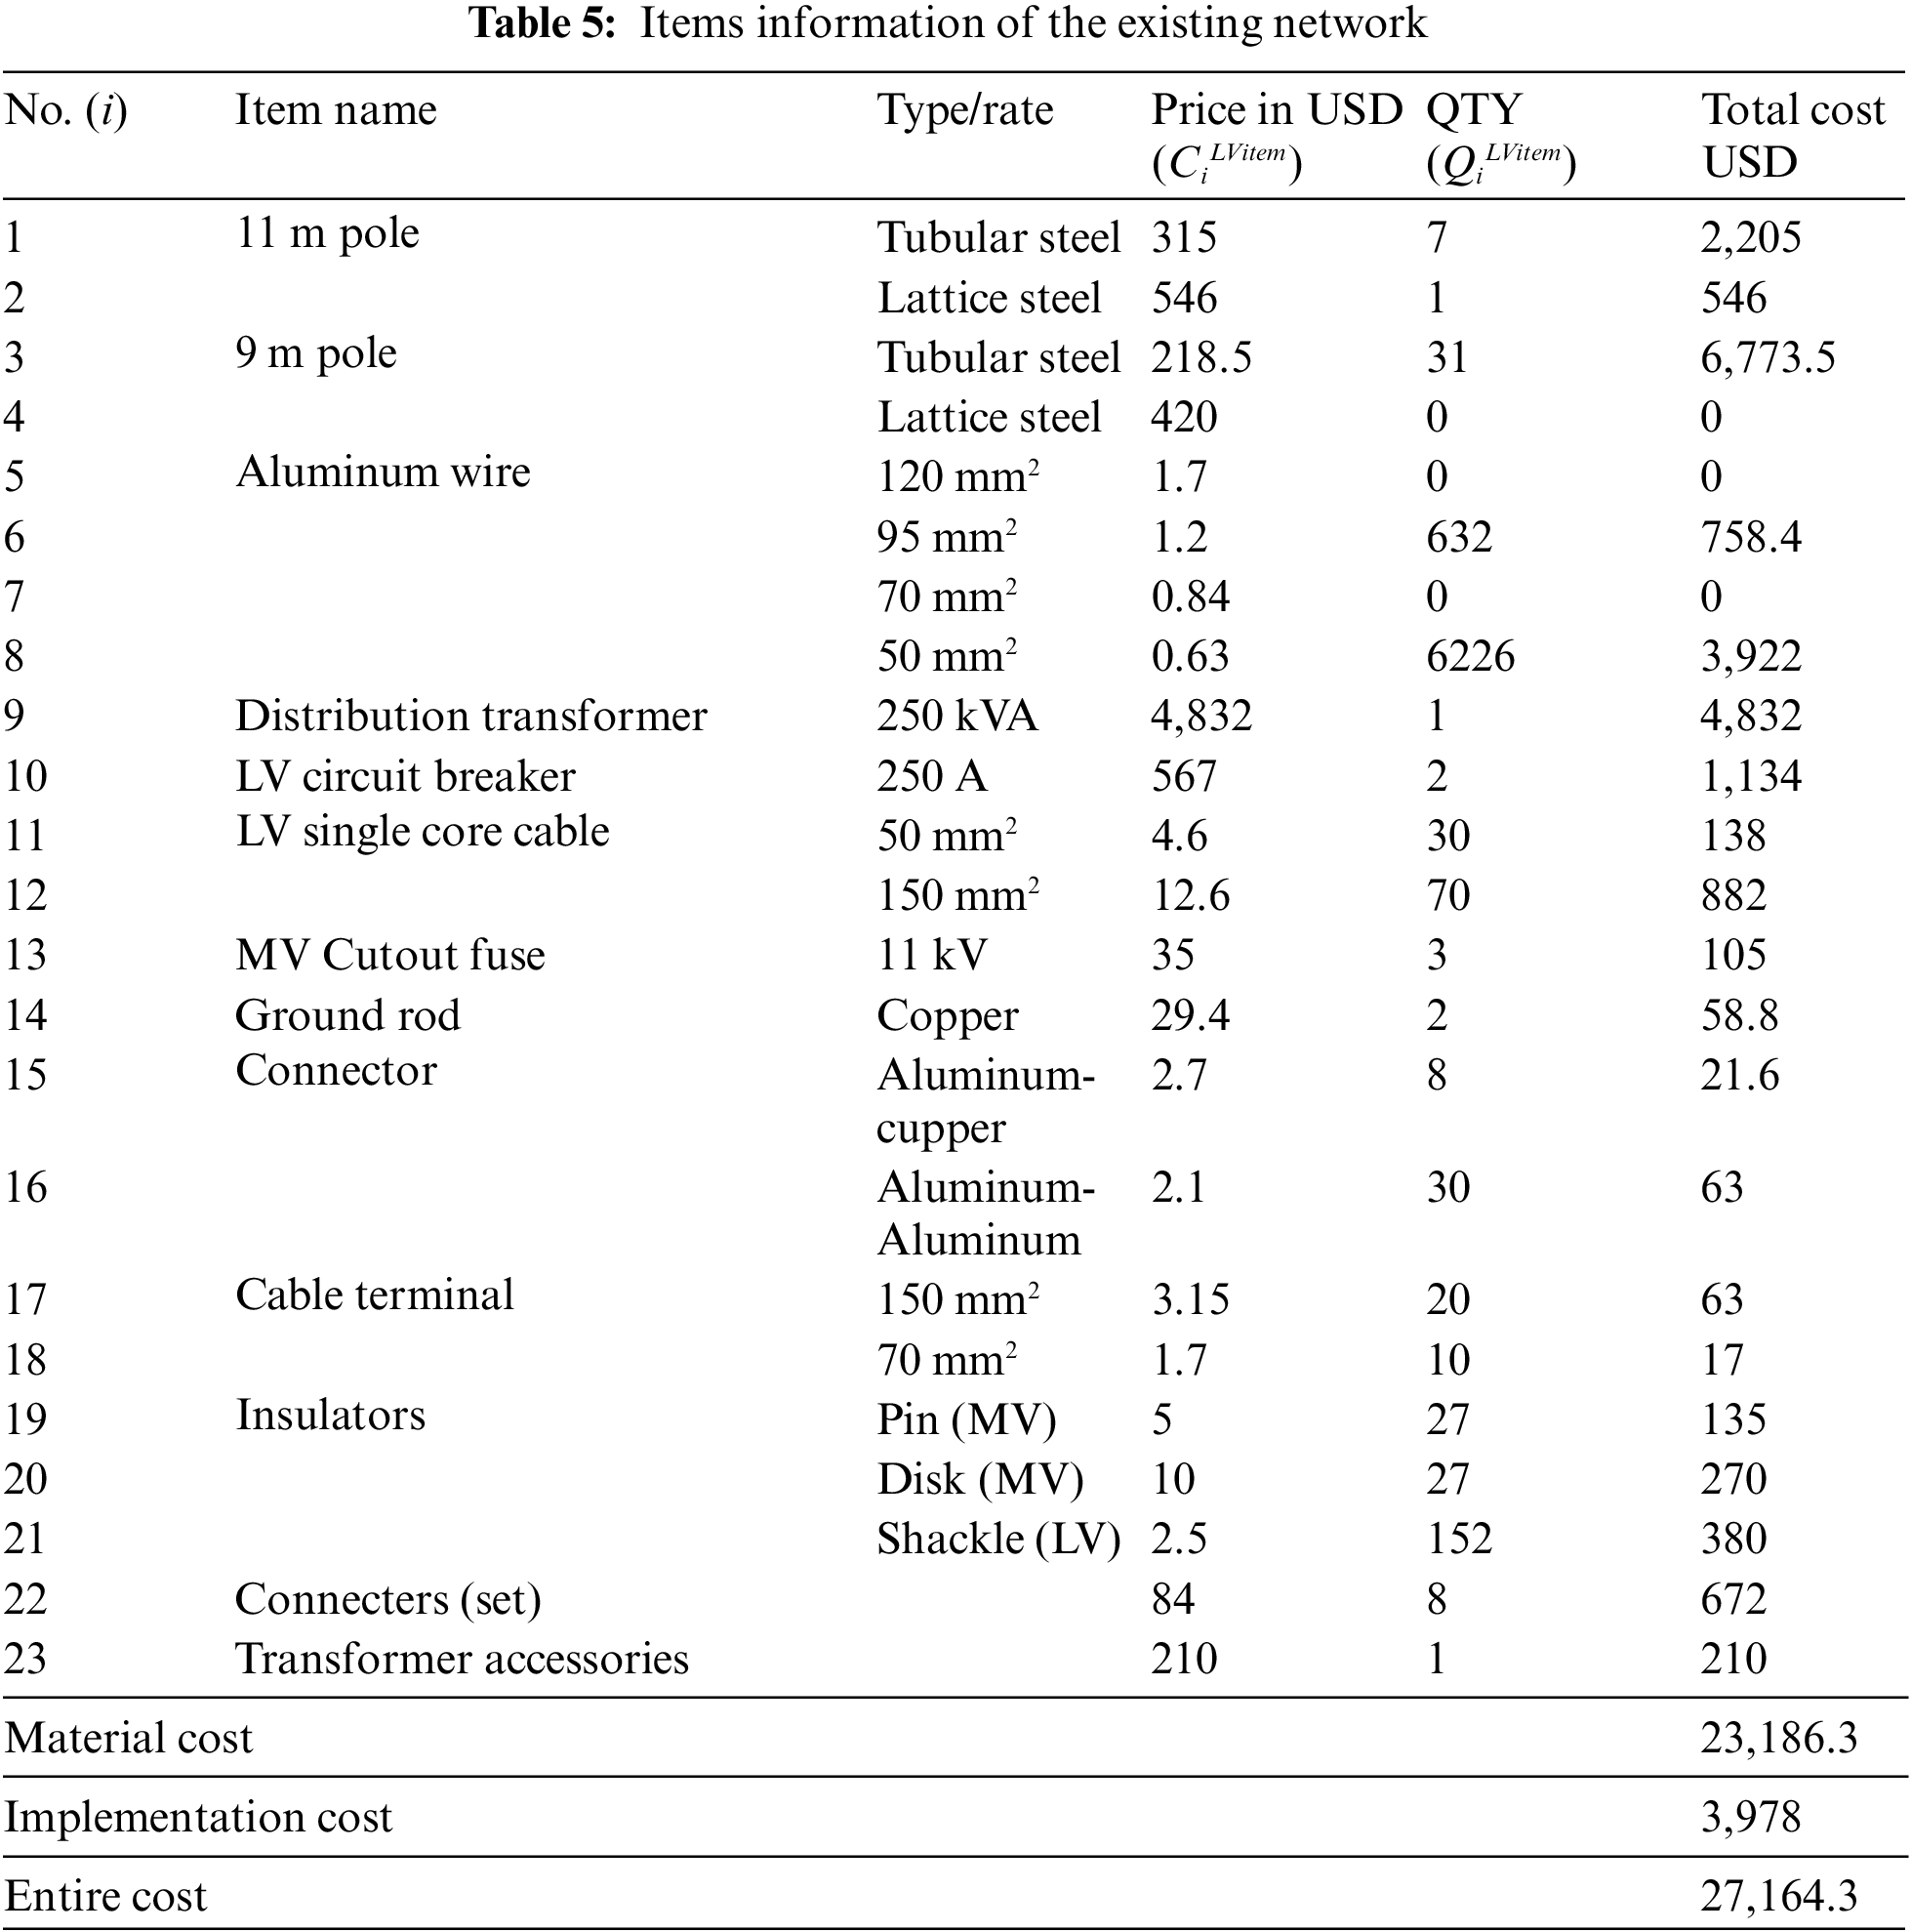
Step 3: Calculating the cost of the existing network (DTRs, MV (11 m) and LV (9 m) poles, cables, insulators, etc.)
The cost of the existing network can be calculated as follows:
where CLVnet, NLVitem, CiLVitem, and QiLVitem represent the LV network cost, the total number of LV network items, the ith LV item cost, and the ith LV item quantity, respectively. By using network details in Table 5, the total cost of the existing network is calculated, which is equal to 27,164 USD.
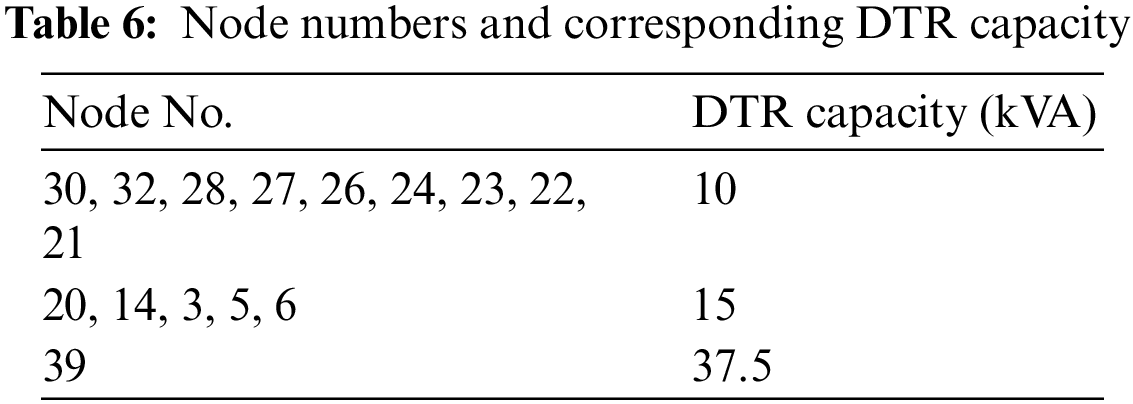
Step 4: Estimating the consumption rate for each consumer
In this step, the data for the previous and next readings of all consumers for a particular period are achieved to estimate the consumption rate of each consumer and the load rate of each node in the network. Table 6 shows the maximum load (DTRs capacity) at each node (pole) at a lagging power factor of 0.95.
Step 5: Simulating the existing network using ETAP
ETAP is one of the essential simulation programs used for dynamic analysis of the electrical network under various operating conditions [32]. ETAP provides the highest level of reality in simulating and analyzing complex electrical networks. The program provides the necessary tools to design and analyze the electrical system with interconnected electrical elements. Also, it enables the user to access and control the stored database of each component of the system. The program is characterized by the accuracy of dealing with data and taking into account all detailed features, including the Swing process. The network in Fig. 5 was represented in the ETAP program, version 16 beta, to calculate the technical losses and the voltage drops.
Step 6: Calculating the technical and non-technical losses of the existing network (LV lines and DTRs)
After simulating the network, the ETAP is run to perform load flow calculations, record the operating loads, and calculate the PLs of LV wires and DTRs. The PL of LV network can be represented as:
where PLLVnet, PLiLVline, PLiLVtr, NLVline, and NLVtr are the LV network’s PL, the ith LV line’s PL, the ith LV transformer’s PL, the number of LV lines, and the number of LV transformers, respectively.
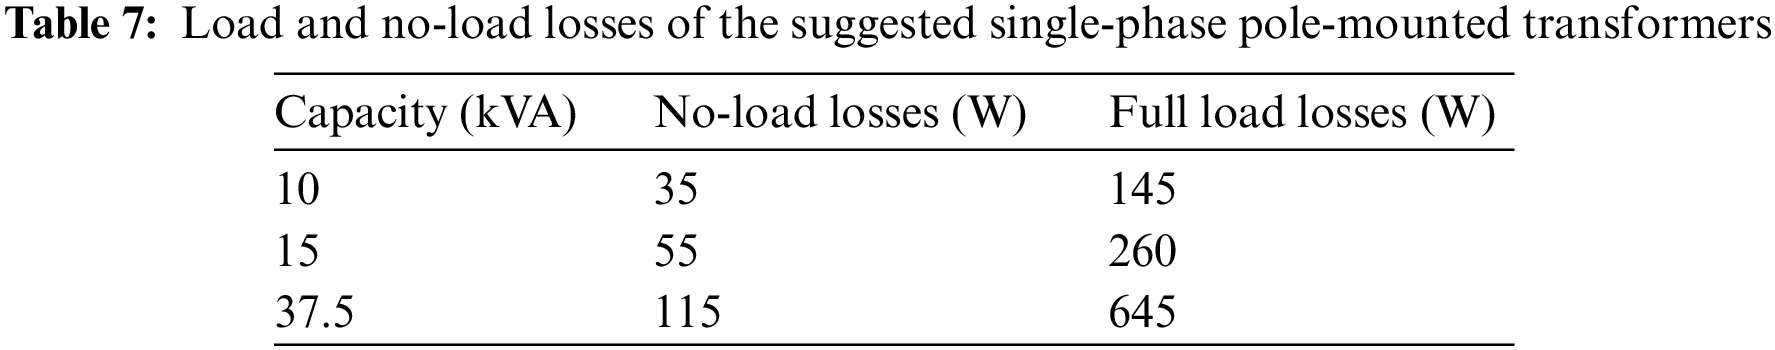
Accordingly, PLLVnet represents 23.79 kW, constituting 16.3% of the total power. The load and no-load l losses of the suggested transformers with different capacities are presented in Table 7.
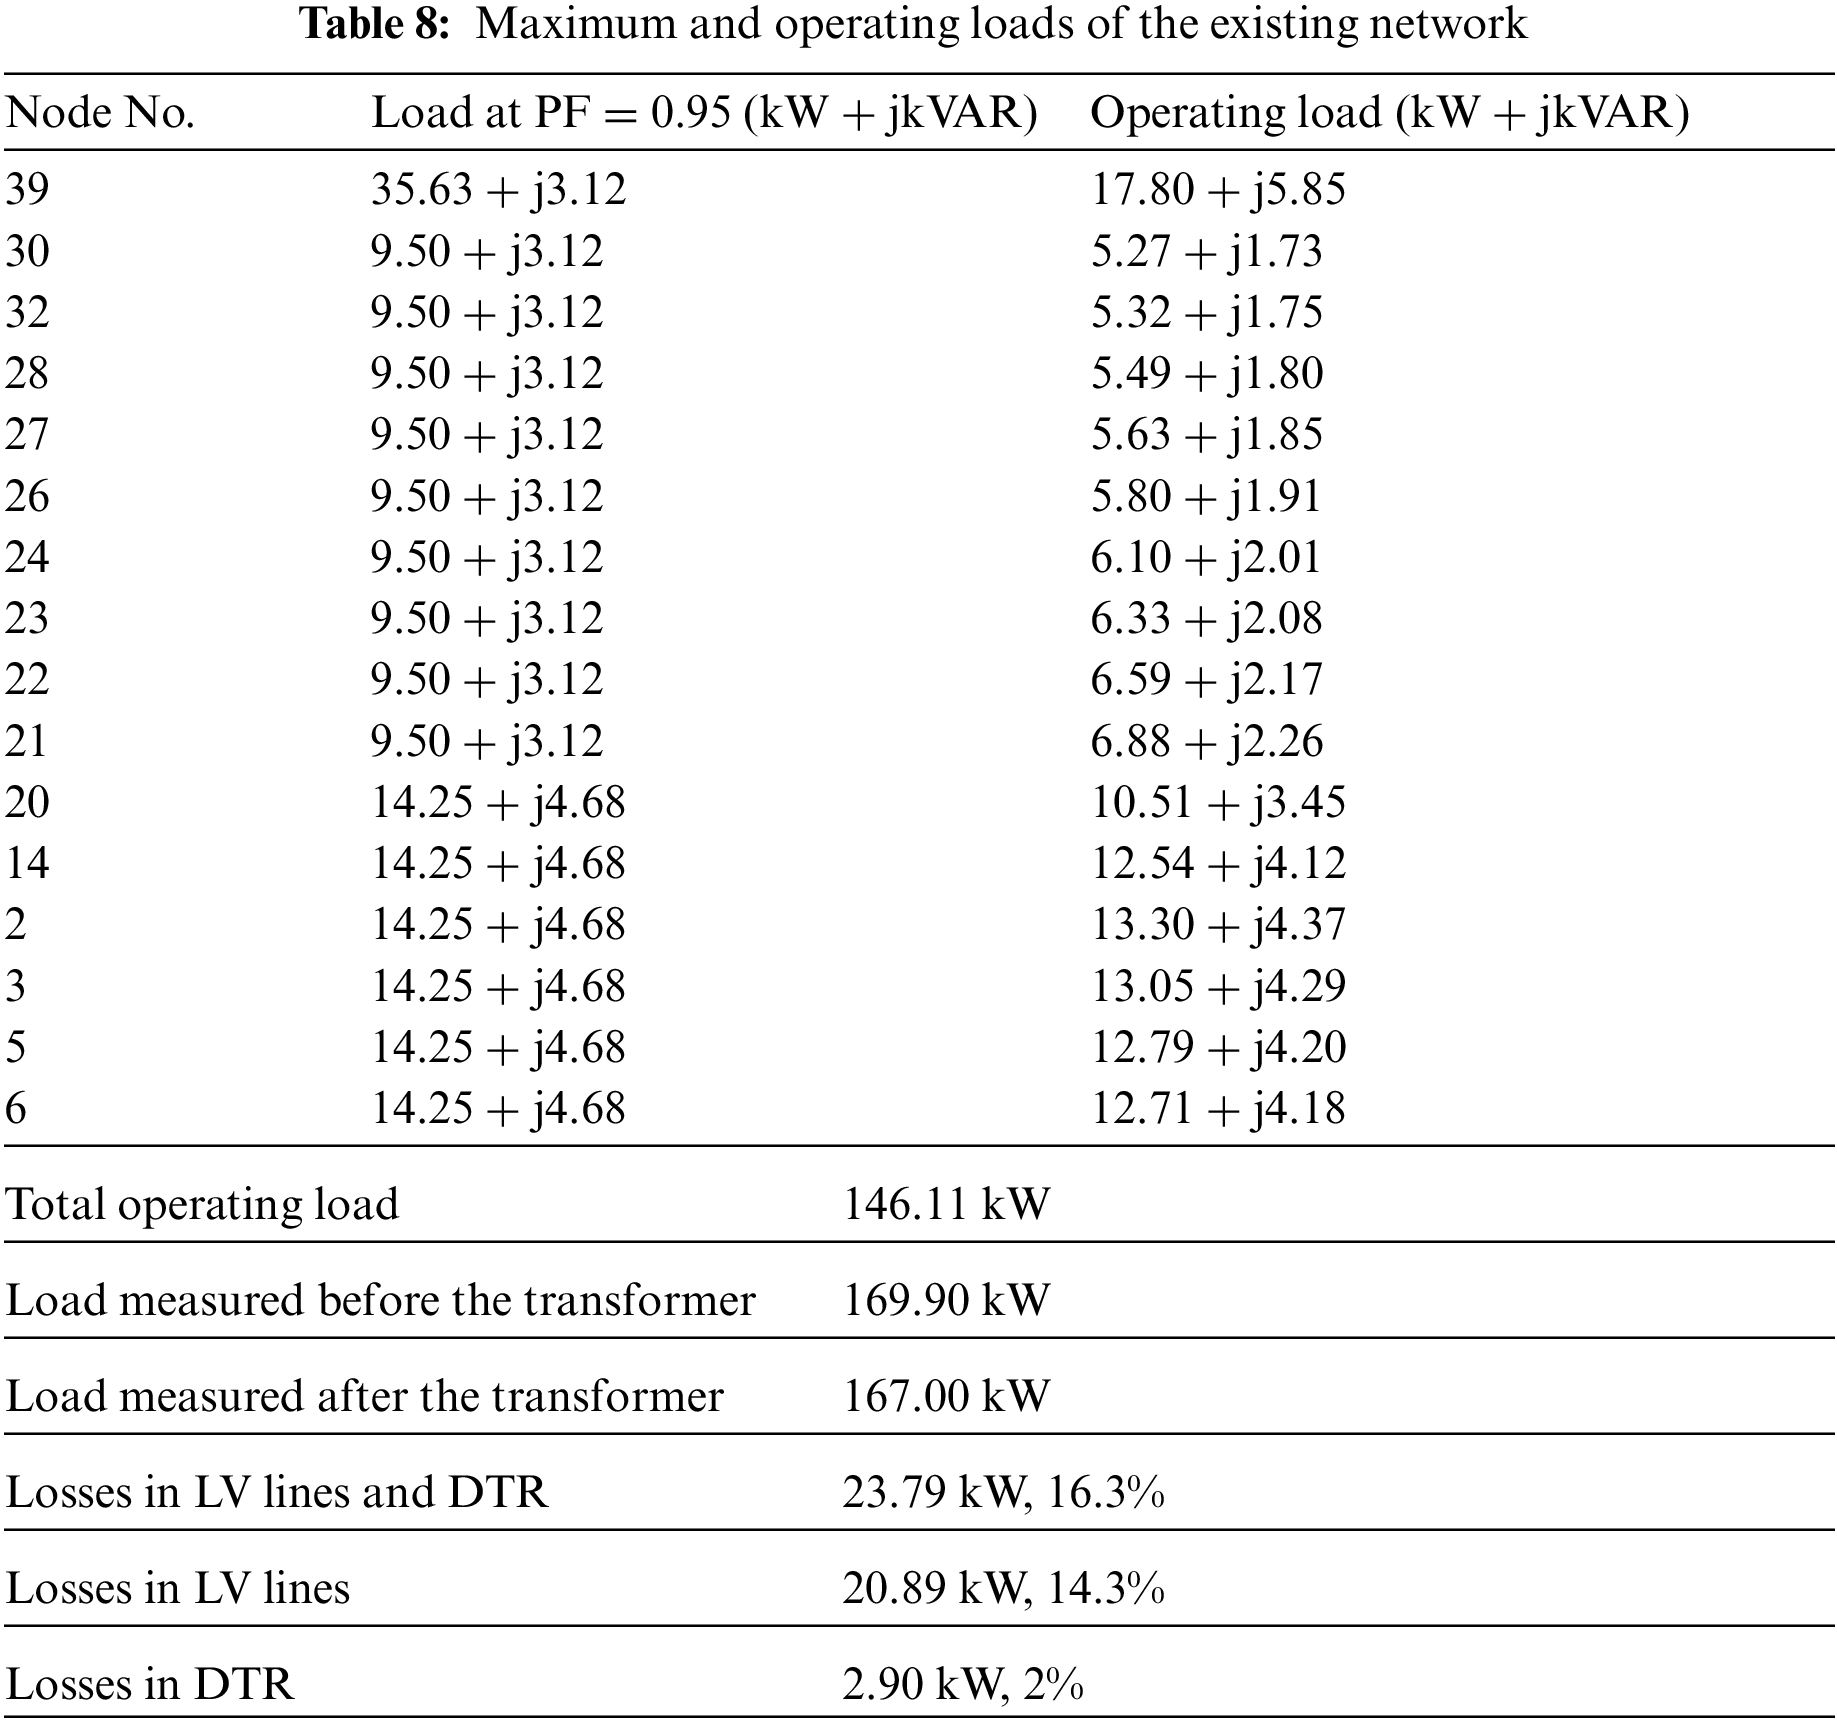
The losses in LV lines form 20.89 kW, which means 14.3% of the total power. Whereas the losses of the transformer are 2.9 kW, which constitutes 2% of the total power, as shown in Table 8. The table shows the maximum load can be applied to each node for a PF of 0.95. These values of load are utilized to assess the highest possible PL for the network. Table 8 also shows the actual operating load at each node after implementing the load flow analysis.
Step 6: Designing a new network of multiple small DTRs and shorter LV lines
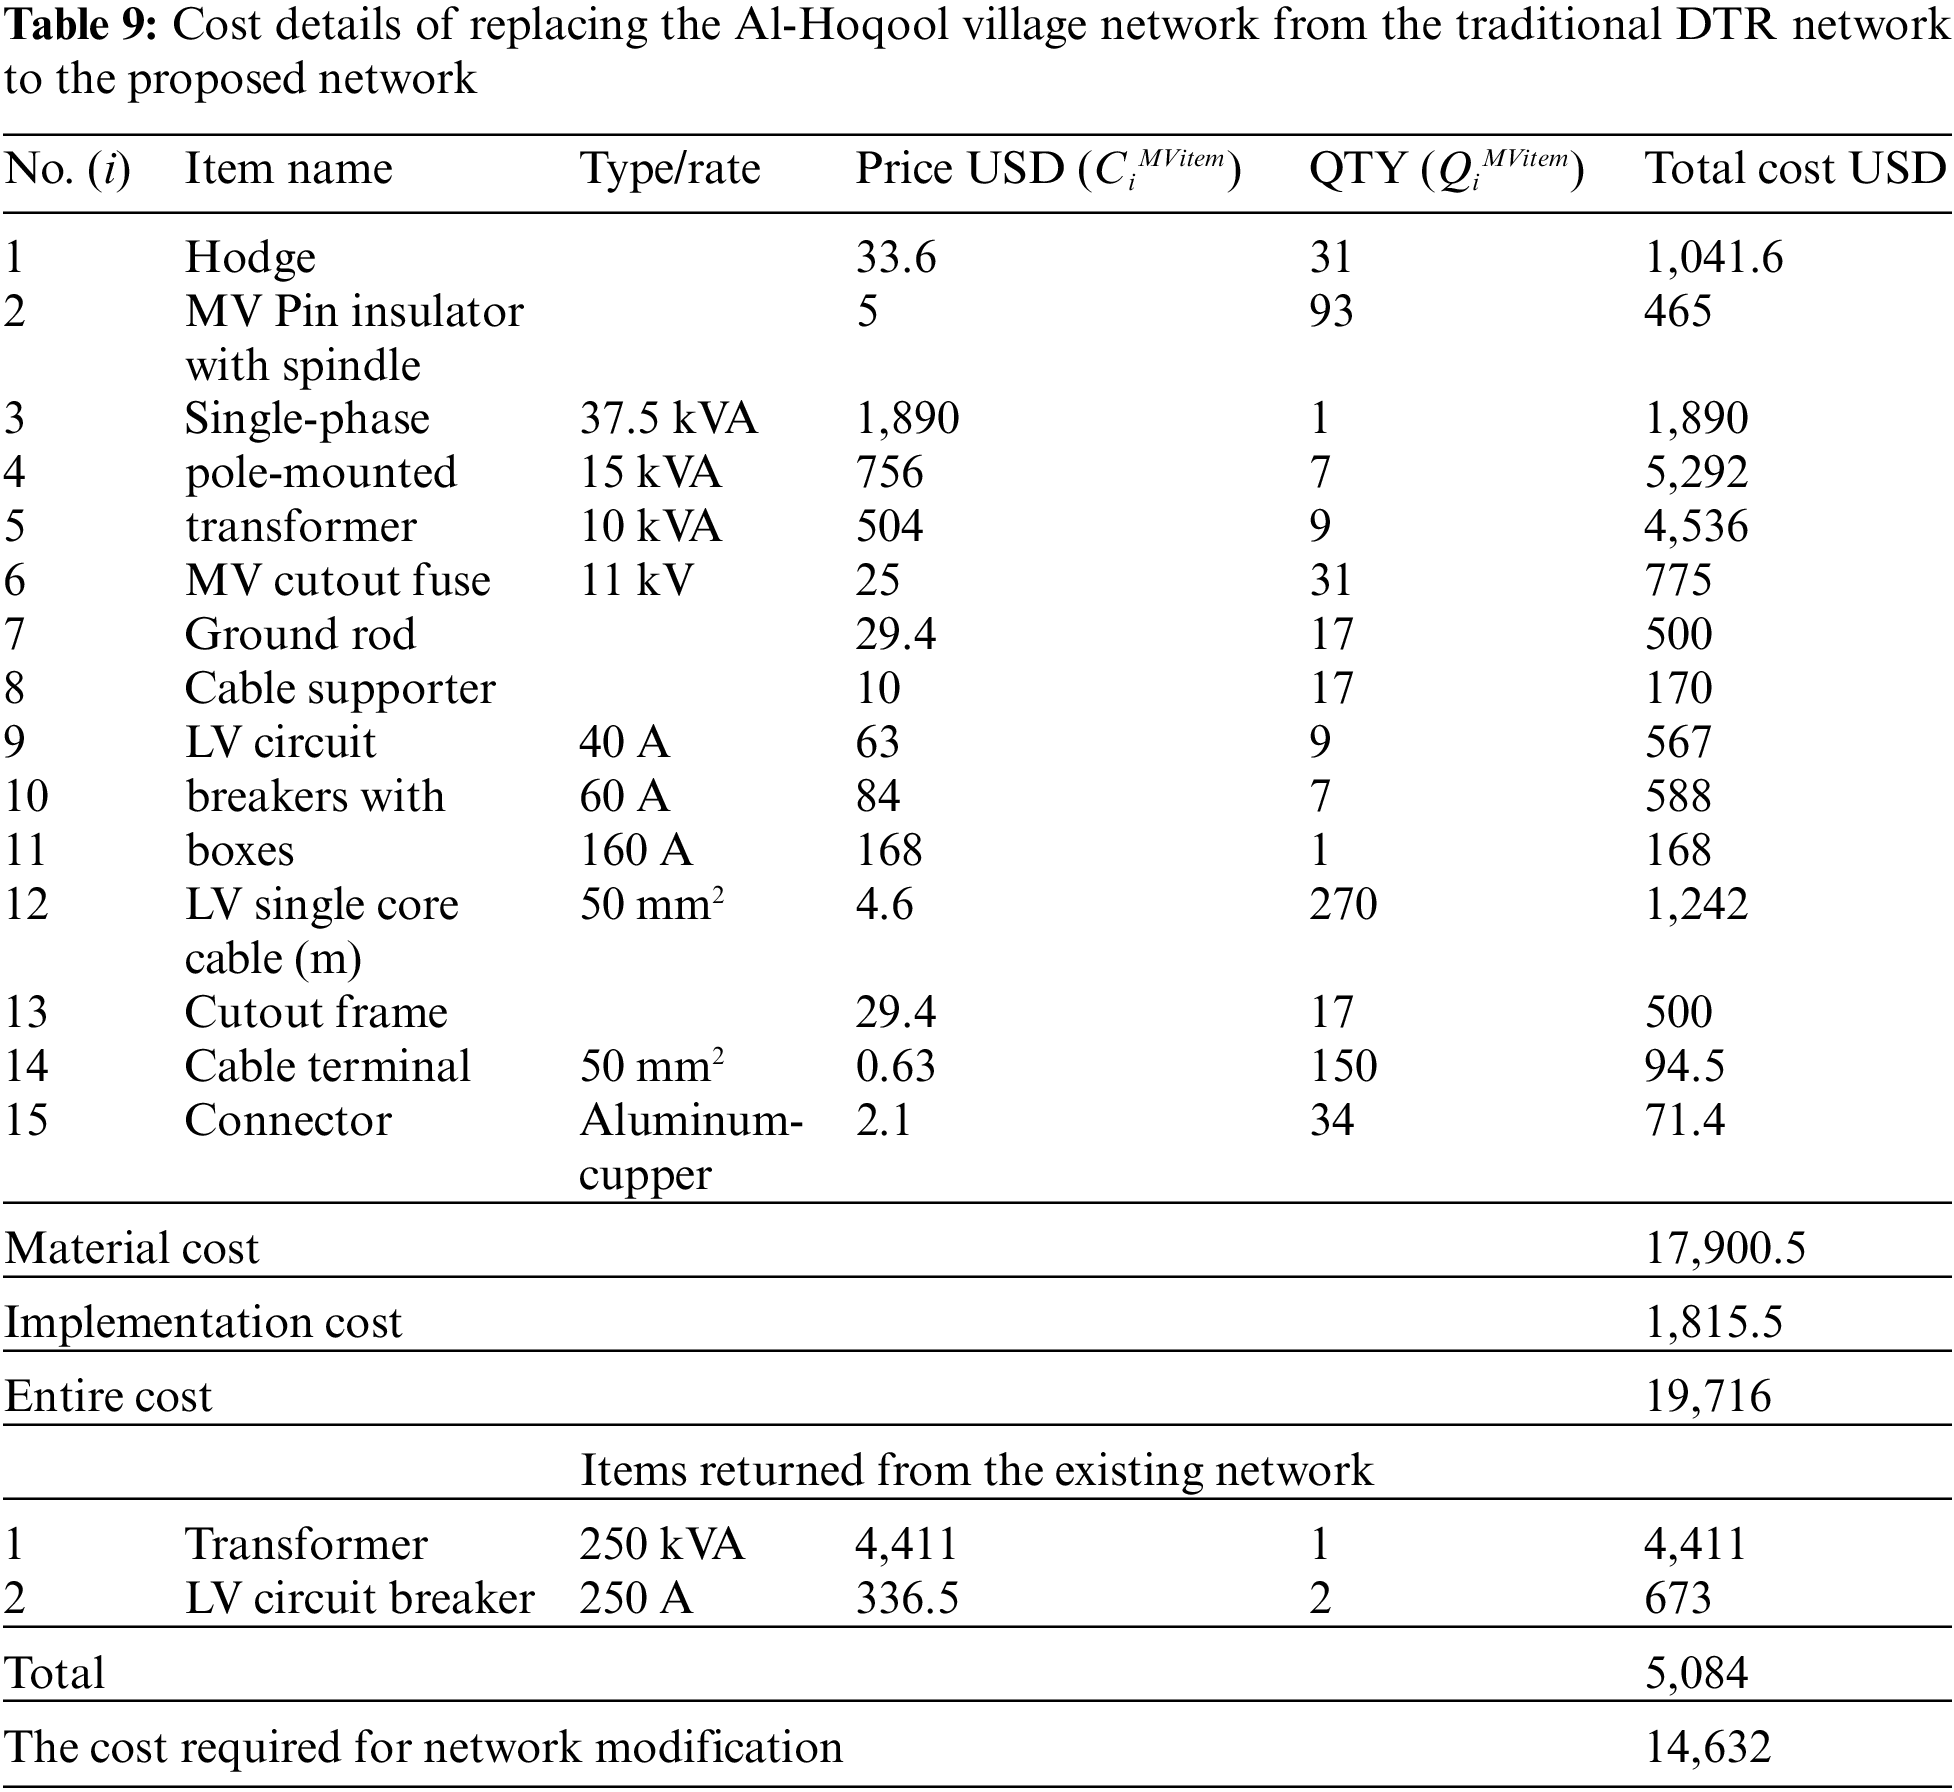
A new medium voltage distribution system (MVDS) is proposed and designed to eliminate the high PL in the LV network, which forms 14.3%, as shown in Fig. 6. The DTR of 250 kVA was removed, and 17 transformers were installed with capacities of 37.5 kVA (1), 15 kVA (7), and 10 kVA (9). Given that the overhead lines, poles and cables in the village network are in good condition, a modification to the existing LV poles is proposed to enable them to carry the MV 11 kV lines. The pole modification is proposed by adding the so-called “Hodge”, which is a curved iron triangle with a height of 2 m placed on the top of the 9 m pole. Hodge contains holes in its base to fix the MV insulators. LV cables are used to replace MV network cables. Several other components of the existing LV network can be used in the proposed network to reduce the modification cost. The existing three-phase transformer, LV circuit breakers, and LV insulators can be used at another network, in which its cost can also be subtracted from the modification cost, as shown in Table 9.
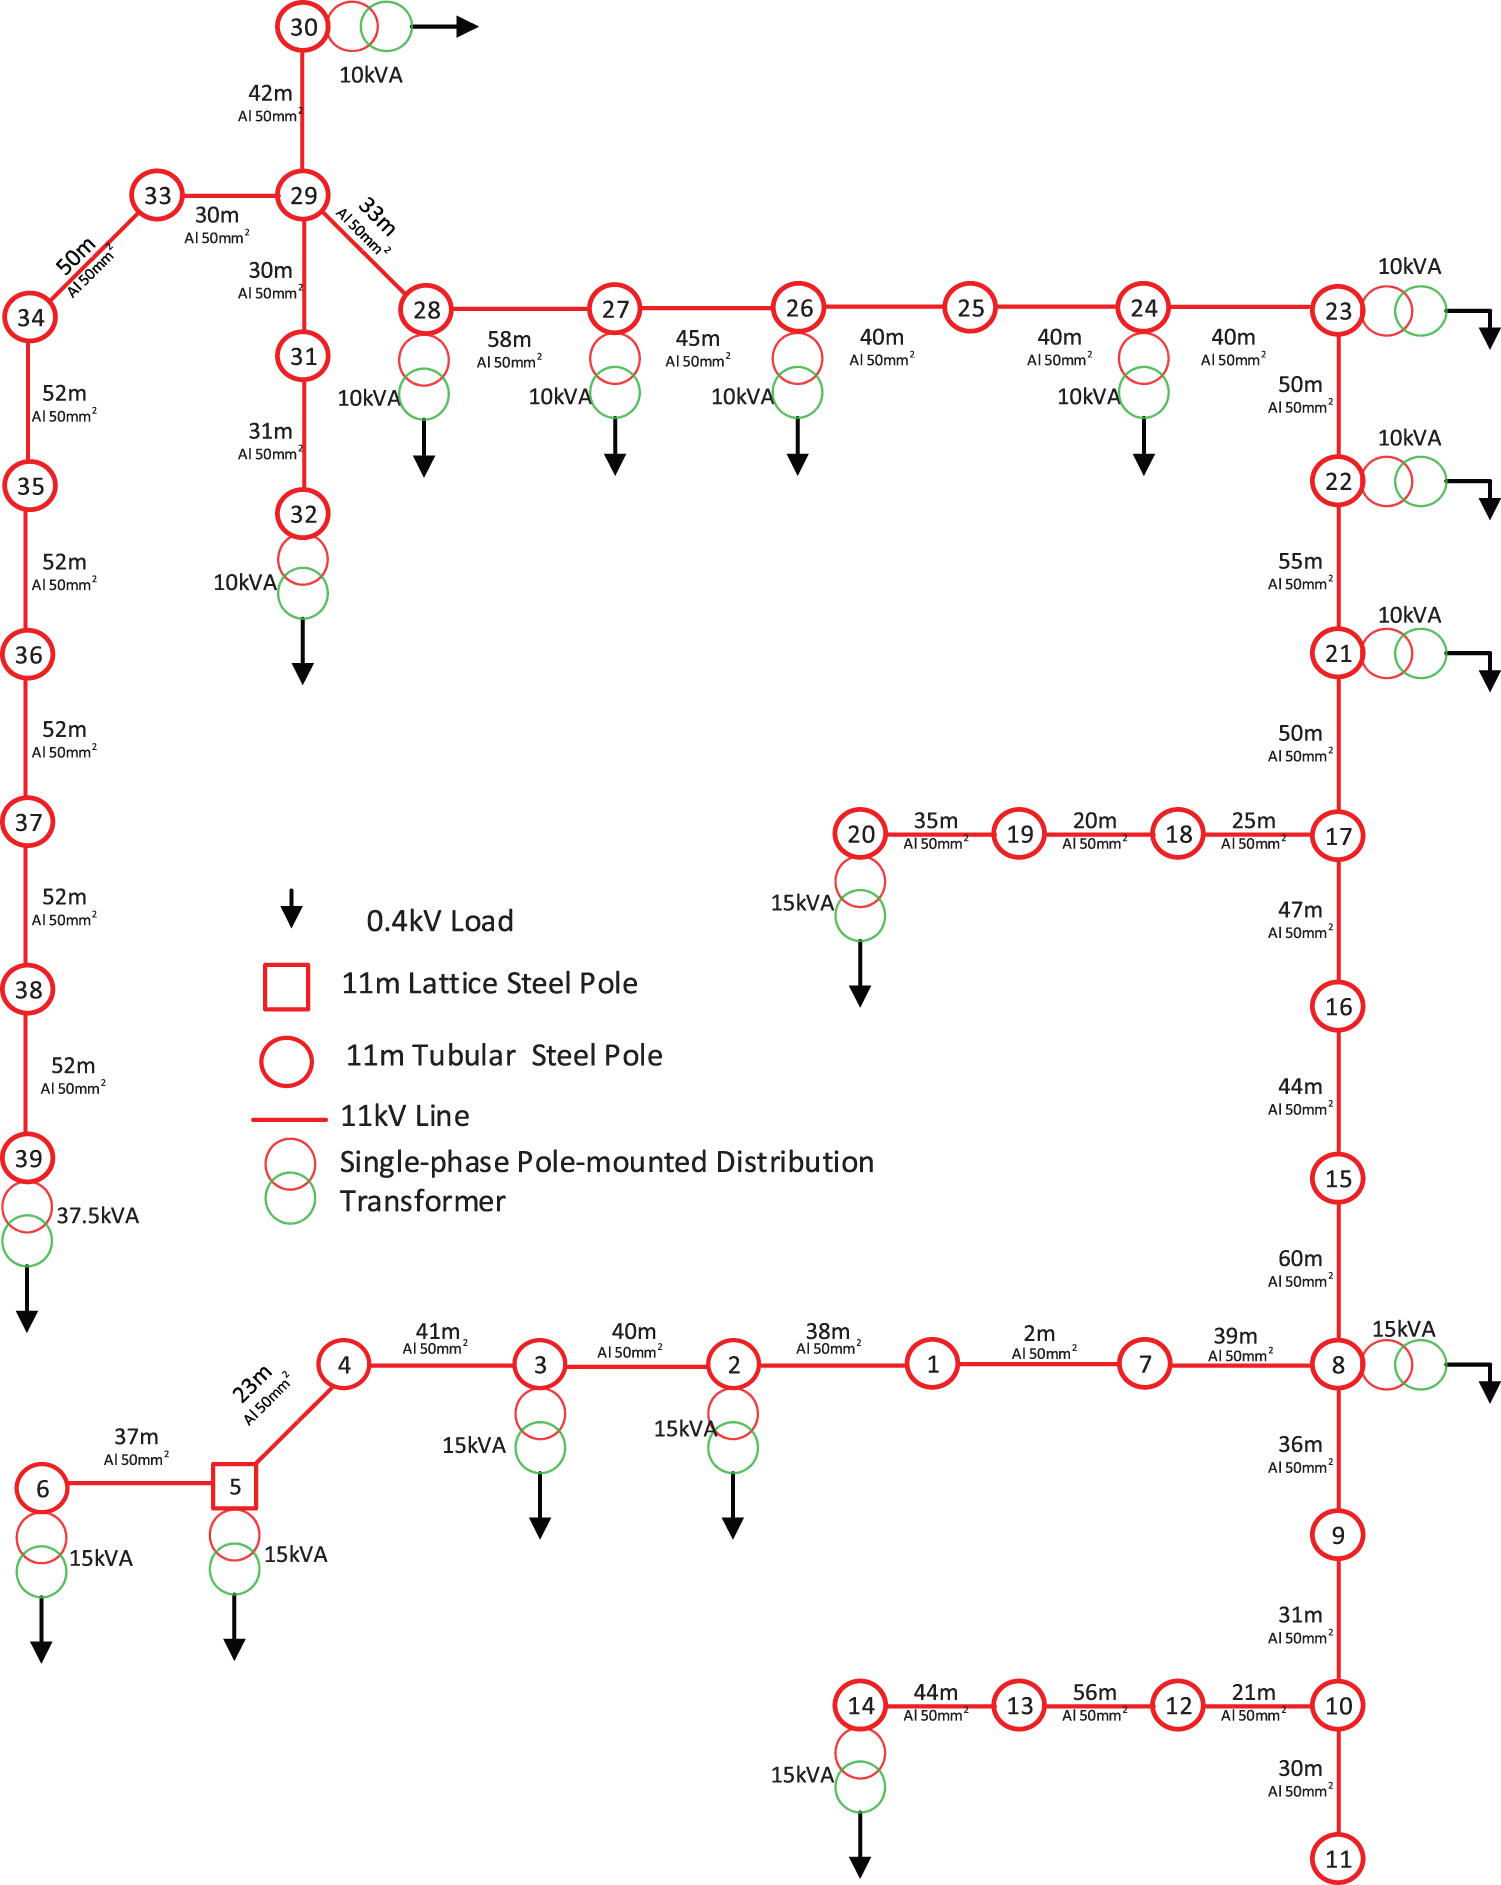
Figure 6: Single line diagram of the proposed network
Step 7: Calculating the cost of the proposed network, including transformers, poles, cables, insulators, etc.)
The cost of the new network can be calculated as follows:
where CMVnet, CiMVitem, QiMVitem, and NMVitem are the cost of the proposed MV network, the ith MV item cost, the ith MV item quantity, and the number of MV items, respectively. By subtracting the cost of the returned components from the existing network using the data of Table 9, the cost of forming and implementing the new network can be calculated, which is equal to 14,632 USD.
Step 8: Representing the proposed network in the ETAP simulation software
The proposed network shown in Fig. 6 has represented in the ETAP program to find out the values of technical PL and voltage drop.
The PLDiff equals 19.21 kW in the full network load, and this value will be changed when the load changes.
Step 9: Calculating the new network's technical losses
After representing the network in the ETAP program, the program performed the load flow calculations, recorded the operating loads, and determined the PL for 11 kV lines and 11/0.24 kV DTRs according to the following equation:
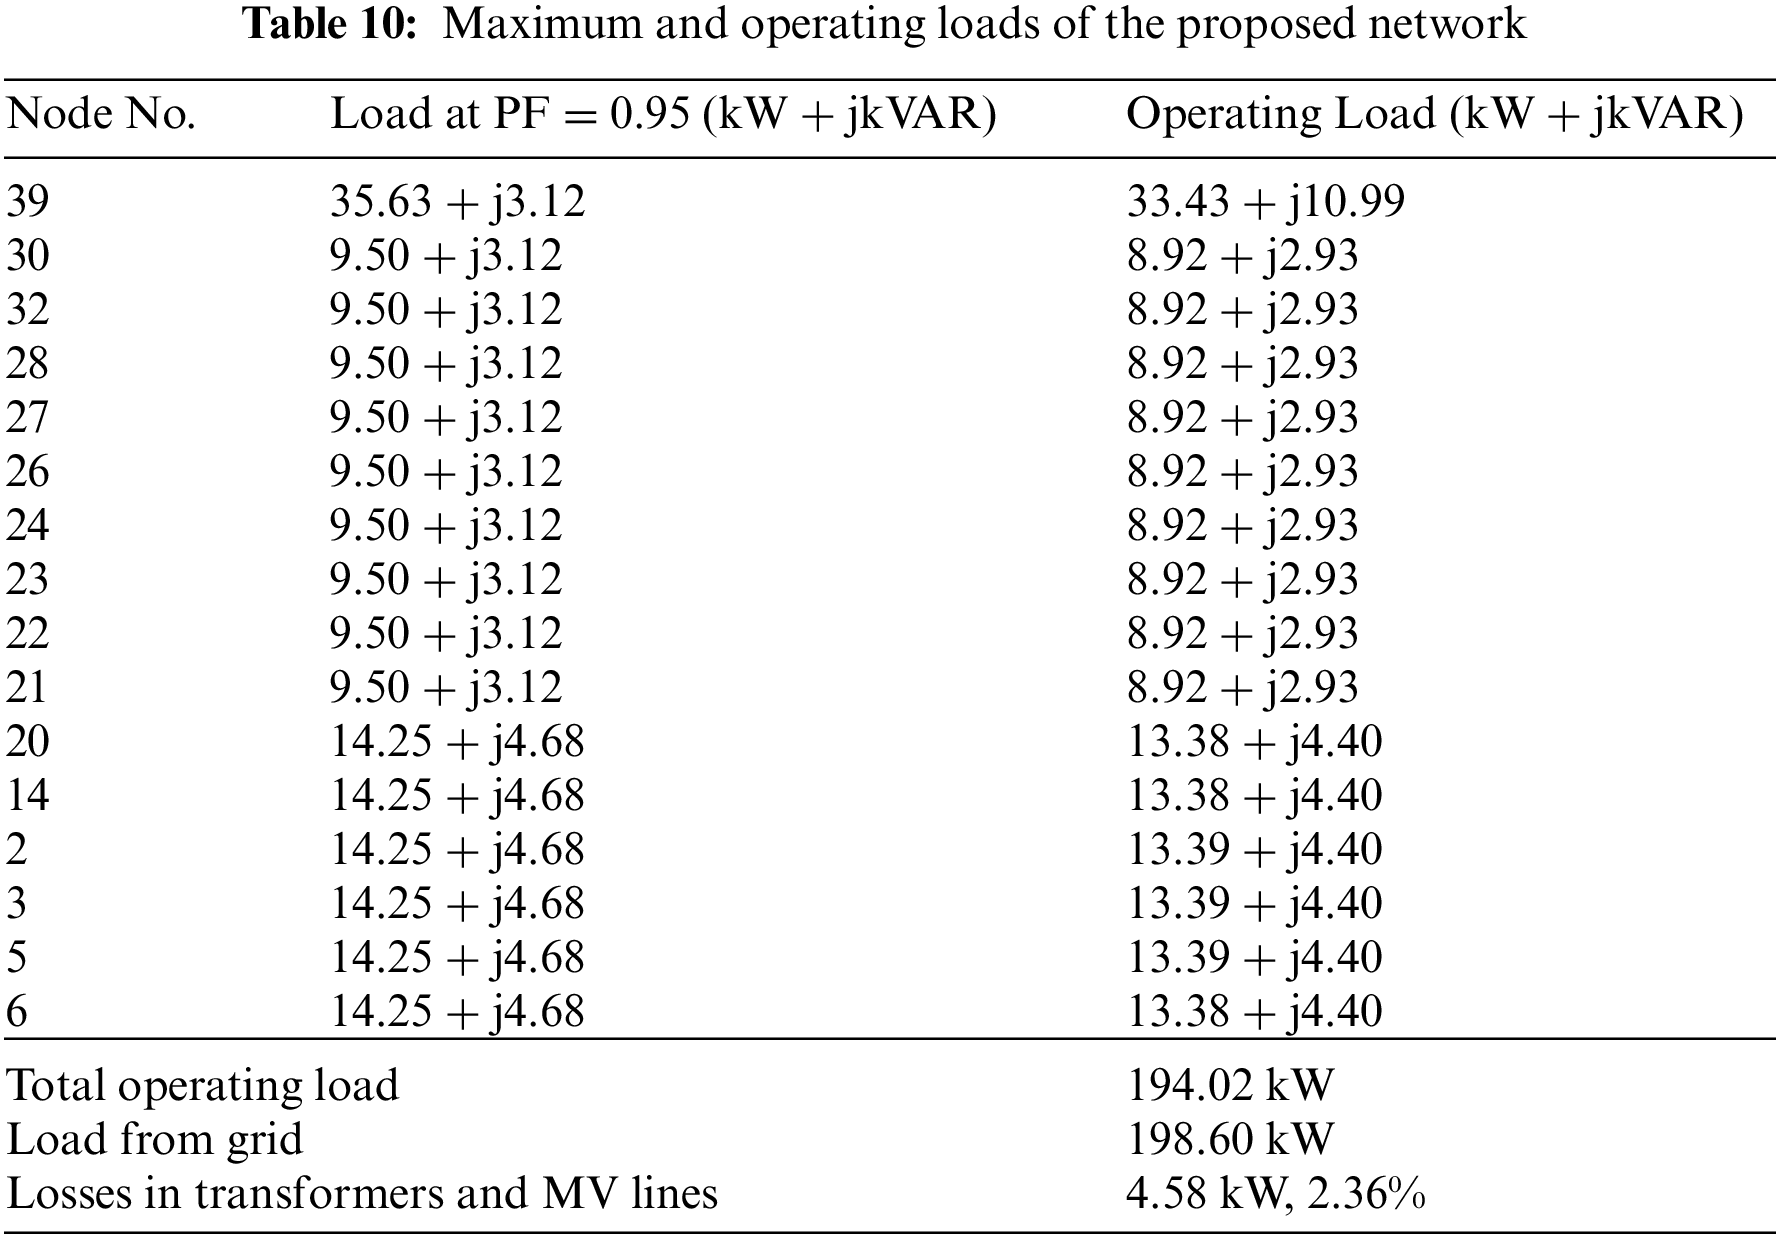
where PLMVnet, PLiMVline, PLiMVtr, NMVline, and NMVtr represent the PL of the MV network, the ith MV line’s PL, the ith MV transformer’s PL, the number of MV lines, and the number of MV transformers, respectively. Using the data of the maximum and operating loads of the proposed network in Table 10, the PLMVnet can be calculated, which is equaled 4.58 kW, which forms 2.36% of the total power. The data of Table 10 has been achieved in the same way of that in Table 8 after reimplementing the load flow analysis at each node.
Step 10: Calculating the losses difference between the existing network, as in Step 6, and the proposed network, as in Step 10
The difference in PL between the two networks (PLDiff) can be calculated as:
Step 11: Converting the difference in energy losses to cost
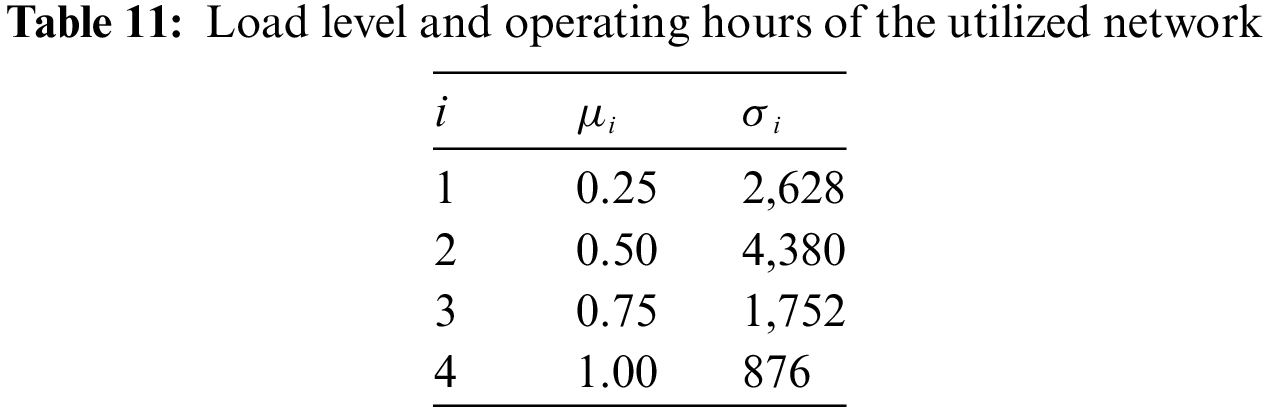
The PLDiff calculated in Step 11 must be converted into energy losses in “kWh” and energy losses must be converted into cost in “USD”.
Given that the load curve during the year can be divided into four sections (i) with different levels (µi) and different operating hours (σi). Table 11 lists section parameters of load level and operating hours that achieved from SCNDE. By using Eq. (6) and the data of Table 11, the difference in annual energy losses between the two networks (ELDiff) can be calculated, which is equaled 96,761 kWh.
The monthly return from implementing the proposal (CRMonth) can be clarified as:
where CUnit is the cost of producing an electric unit in Iraq, which is 0.09 USD regardless of the support provided by the ministry of electricity. Thus, the monthly return from the proposal of the studied network is equaled to 725.7 USD.
Step 13: Calculating the cost difference between the new network, as in Step 8, and the existing network, as in Step 3
The estimated cost difference of changing the existing network to the proposed network (CDiff) can be clarified in (8), which is equaled to 14,632 USD. This amount can be recovered during the payback period that will be calculated in the next step.
Step 14: Calculating the payback period of the modification expenses
The payback period (PbMPeriod) is calculated by dividing the total amount needed to change the network by the monthly return from reducing the losses (the amounts of additional units) as:
According to (9), the payback period for network modification is 20 months. The interest obtained after this period is considered the company profit. In addition to the economic feasibility, Fig. 7 shows the technical feasibility of proposing the network modification. Fig. 7 clarifies that the voltage profiles of all nodes have significantly improved after implementing the proposal, especially at the end of the line.
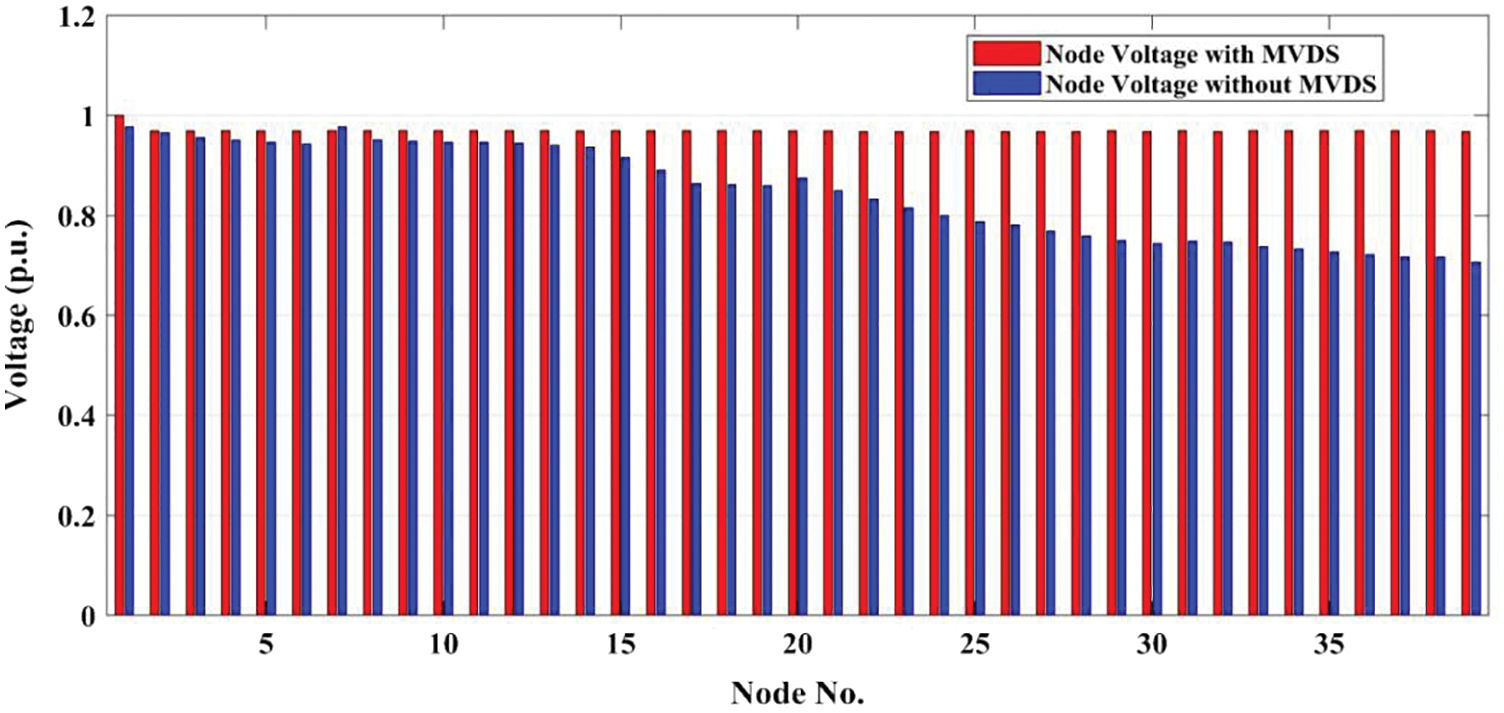
Figure 7: Voltage profiles before and after implementing the proposed approach
According to Fig. 7, the voltage of node 39 for the highest load was 0.706 PU before the modification. After applying the proposed modification in the ETAP, the voltage became 0.968 PU for the same load. The maximum voltage drop has been reduced from 0.294 PU to 0.032 PU.
Step 15: Considering the study is practically implemented if the period for reimbursement is acceptable
The period of 20 months is considered very acceptable for this network due to the load nature in the rural area. Such modification is also considered urgent to improve the voltage profile for consumers who fall at the end of the line, where the existing voltage cannot operate their appliances properly.
6 Discussion of Proposal Features
This section compares the results and highlights both the advantages and limitations of the proposal. The comparison between the two systems is shown in Table 12.
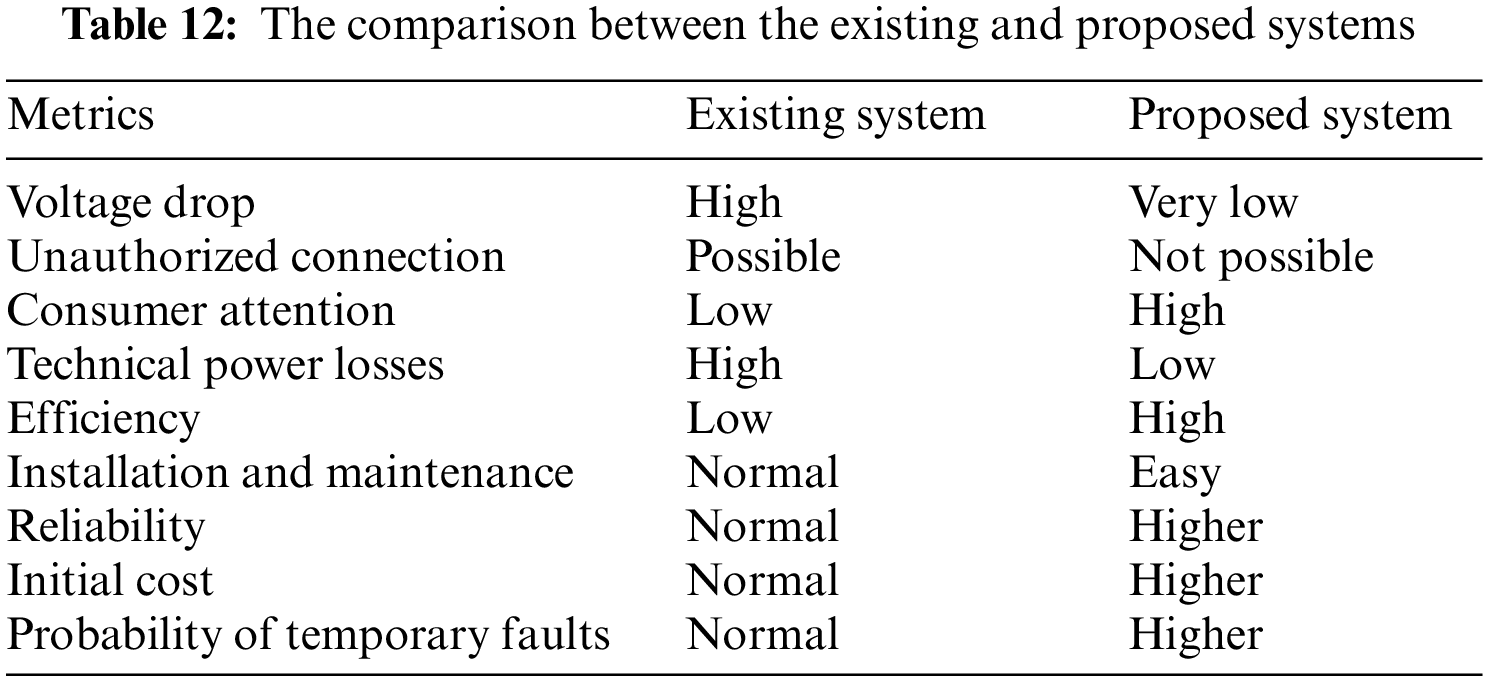
• The voltage drop can be significantly reduced in the MVDS, which improves the equipped voltage for all consumers and makes the operating load match the actual load at all network nodes.
• The line voltage will increase from 0.4 kV to 11 kV, so there is no possibility for unauthorized connections that increase the PL and prevent load estimation.
• Some consumers do not pay attention to energy saving and do not avoid overloading the network DTR which may suffer from frequent failures and affect the entire network. Using a single-phase pole-mounted transformer for a small number of consumers encourages them to save energy by avoiding the failure of their particular transformer.
• The technical losses will be reduced significantly, and the difference in losses can support the network in terms of additional units instead of increasing the energy production.
• The modification increases the efficiency of the entire system because the efficiency is higher in a single-phase transformer than in a three-phase transformer with the same capacity [33].
• The new transformers are small in size, light in weight, and thus easy to install and maintain.
• When a fault happens to one transformer, the network and the rest of the transformers remain working, which increases the reliability of the network.
• The initial cost of the proposed network is higher than that of the existing network. However, all expenses will be returned during the payback period.
• Increasing the number of transformers on the feeder increases the probability of temporary faults.
This paper discussed implementing the MVDS to reduce the PL and improve the voltage profile in rural DNs. The proposed concept was applied to a network in the Tallkayf district of 39 nodes, which suffers from high PL and significant voltage drop. The PL of the utilized network accounted for 14.3% of the total network power, and the voltage drop at the last node of the network was 30%. The network modification has included replacing the 0.4 kV lines with 11 kV lines and replacing the large capacity DTR with 17 small capacity single-phase pole-mounted transformers. The economic and technical feasibility clarified that the initial cost of the proposed network is higher than the cost of the current network, but all expenses will be returned during the payback period, which is 20 months. The interest obtained after this period is considered the company profit. The difference in EL can be used to support the network in terms of additional units instead of increasing the allocated amount of generation. This proposal is applicable for larger DNs in Iraq in which the issues of PL and voltage drop are more vital.
In future work, studying the effect of the third harmonic on the distribution network when using single-phase transformers will be conducted. Also, the use of single-phase transformers to balance 11 kV feeders is planned to perform in the future.
Acknowledgement: The authors would like to acknowledge the State Company of the North Distribution Electricity as well as the General Companies of the Electricity Transmission-North Region and the Electricity Production-Al-Furat Middle Region. Special thanks to Planning and Studies Office, Ministry of Electricity, Iraq for their support.
Funding Statement: The authors received no specific funding for this study.
Conflicts of Interest: The authors declare that they have no conflicts of interest to report regarding the present study.
References
1. Nepal, R., Nirash, P. (2019). Energy security, electricity, population and economic growth: The case of a developing South Asian resource-rich economy. Energy Policy, 132(1), 771–781. DOI 10.1016/j.enpol.2019.05.054. [Google Scholar] [CrossRef]
2. Tran, Q. T., Davies, K., Roose, L., Wiriyakitikun, P., Janjampop, J. et al. (2020). A review of health assessment techniques for distribution transformers in smart distribution grids. Applied Sciencce, 10(22), 8115. DOI 10.3390/app10228115. [Google Scholar] [CrossRef]
3. Flaih, F. M., Lin, X., Waqar, A., Imran, R. M. (2016). Voltage profile and power loss improvement in distribution system using MVDS considering economic enticements. 2016 IEEE 11th Conference on Industrial Electronics and Applications, pp. 1122–1126. Hefei, China. [Google Scholar]
4. Relva, S. G., Vinicius, O. D., André, L. G., Miguel, E. U., Peta, A. et al. (2021). Enhancing developing countries’ transition to a low-carbon electricity sector. Energy, 220, 119659. DOI 10.1016/j.energy.2020.119659. [Google Scholar] [CrossRef]
5. Pegado, R., Zocimo, Ñ., Yuri, M., Carlos, C. (2019). Radial distribution network reconfiguration for power losses reduction based on improved selective BPSO. Electric Power Systems Research, 169(3), 206–213. DOI 10.1016/j.epsr.2018.12.030. [Google Scholar] [CrossRef]
6. Ali, H., Shafaat, U., Irfan, S., Naseer, A., Faisal, K. (2018). Economic loss minimization of a distribution feeder and selection of optimum conductor for voltage profile improvement. 2018 International Conference on Power Generation Systems and Renewable Energy Technologies, pp. 1–6. Islamabad, Pakistan. [Google Scholar]
7. Flaih, F. M., Lin, X., Abd, M. K., Dawoud, S. M., Li, Z. et al. (2017). A new method for distribution network reconfiguration analysis under different load demands. Energies, 10(4), 455. DOI 10.3390/en10040455. [Google Scholar] [CrossRef]
8. World Bank (2019). Electric power transmission and distribution losses (% of output). http://data.worldbank.org/indicator/EG.ELC.LOSS.ZS. [Google Scholar]
9. Flaih, F. M., Lin, X., Dawoud, S. M., Almallah, M. R. (2015). Cost analysis of hybrid restructuration for distribution system to improve voltage and minimize losses. TELKOMNIKA Indonesian Journal of Electrical Engineering, 16(3), 431–438. DOI 10.11591/tijee.v16i3.1633. [Google Scholar] [CrossRef]
10. Feil, D. P., Silva, P. R., Bernardon, D. P., Marchesan, T. B., Sperandio, M. et al. (2017). Development of an efficient distribution transformer using amorphous core and vegetable insulating oil. Electric Power Systems Research, 144, 268–279. DOI 10.1016/j.epsr.2016.12.015. [Google Scholar] [CrossRef]
11. Chaves, T. R., Martins, M. I., Martins, K. D., De Francisci, S. (2021). Application study in the field of solutions for the monitoring distribution transformers of the overhead power grid. Energies, 14(19), 6072. DOI 10.3390/en14196072. [Google Scholar] [CrossRef]
12. Uddin, M., Romlie, M. F., Abdullah, M. F., Syahirah, A. H., Kwang, T. C. (2018). A review on peak load shaving strategies. Renewable and Sustainable Energy Reviews, 82, 3323–3332. DOI 10.1016/j.rser.2017.10.056. [Google Scholar] [CrossRef]
13. Prakruthi, G. B., Veeramanju, K. T. (2017). Backward-forward algorithm approach for computation of losses in LVDS and proposed HVDS-towards loss minimization and voltage improvement in agricultural sector. International Conference on Cognitive Computing and Information Processing, pp. 415–429. Singapore. [Google Scholar]
14. Zala, Y. (2017). Comparative study and simulative analysis of high voltage and low voltage distribution systems for rural agricultural loads: Simulation using etap software. 2017 IEEE International Conference on Smart Energy Grid Engineering, pp. 46–50. Oshawa, ON, Canada. [Google Scholar]
15. Razavi, S., Rahimi, E., Javadi, M. S., Nezhad, A. E., Lotfi, M. et al. (2019). Impact of distributed generation on protection and voltage regulation of distribution systems: A review. Renewable and Sustainable Energy Reviews, 105(1), 157–167. DOI 10.1016/j.rser.2019.01.050. [Google Scholar] [CrossRef]
16. Ismael, S. M., Shady, H. A., Almoataz, Y. A., Zobaa, A. F. (2019). State-of-the-art of hosting capacity in modern power systems with distributed generation. Renewable Energy, 130(6), 1002–1020. DOI 10.1016/j.renene.2018.07.008. [Google Scholar] [CrossRef]
17. Kumar, C., Jaisiva, S., Amaladoss, C. R., Logeshwari, V. (2021). Hybrid renewable energy based smart grid system for reactive power management and voltage profile enhancement using artificial neural network. Energy Sources, Part A: Recovery, Utilization, and Environmental Effects, 43(19), 2419–2442. DOI 10.1080/15567036.2021.1902430. [Google Scholar] [CrossRef]
18. Memon, M. A., Ghullam, M. B. (2021). Economical benefits of integrating solar energy based DG units on an existing low voltage distribution network in pakistan. International Journal of Emerging Trends in Engineering Research, 9(5), 597–601. [Google Scholar]
19. Rawat, M. S., Shelly, V. (2019). A comprehensive review on impact of wind and solar photovoltaic energy sources on voltage stability of power grid. Journal of Engineering Research, 7(4), 178–202. [Google Scholar]
20. Jyotsna, S., Tiwari, R. (2019). Real power loss minimisation of smart grid with electric vehicles using distribution feeder reconfiguration. IET Generation, Transmission & Distribution, 13(18), 4249–4261. DOI 10.1049/iet-gtd.2018.6330. [Google Scholar] [CrossRef]
21. Aziz, T., Lin, Z., Muhammad, W., Liu, S. (2021). Review on optimization methodologies in transmission network reconfiguration of power systems for grid resilience. International Transactions on Electrical Energy Systems, 31(3), 12704. DOI 10.1002/2050-7038.12704. [Google Scholar] [CrossRef]
22. Gandoman, F. H., Ahmadi, A., Sharaf, A. M., Pierluigi, S., Josep, P. et al. (2018). Review of FACTS technologies and applications for power quality in smart grids with renewable energy systems. Renewable and Sustainable Energy Reviews, 82(10), 502–514. DOI 10.1016/j.rser.2017.09.062. [Google Scholar] [CrossRef]
23. Mohamed, S. A. (2020). Enhancement of power quality for load compensation using three different FACTS devices based on optimized technique. International Transactions on Electrical Energy Systems, 30(3), 12196. DOI 10.1002/2050-7038.12196. [Google Scholar] [CrossRef]
24. Syed, I., Vinod, K., Zeineldin, H. H. (2018). Loss reduction in radial distribution networks using a solid-state transformer. IEEE Transactions on Industry Applications, 54(5), 5474–5482. DOI 10.1109/TIA.2018.2840533. [Google Scholar] [CrossRef]
25. Abu-Siada, A., Budiri, J., Abdou, A. (2018). Solid state transformers topologies, controllers, and applications: State-of-the-art literature review. Electronics, 7(11), 298. DOI 10.3390/electronics7110298. [Google Scholar] [CrossRef]
26. Saleh, S. A., Ozkop, E., Alsayid, B., Richard, C., Xavier, F. S. et al. (2019). Solid-state transformers for distribution systems-part II: Deployment challenges. IEEE Transactions on Industry Applications, 55(6), 5708–5716. DOI 10.1109/TIA.2019.2938143. [Google Scholar] [CrossRef]
27. Solanki, A. S., Dolly, T. (2020). A comparative study for effective distribution network system among LVDS and HVDS. CSVTU Research Journal, 9(1), 16–22. DOI 10.30732/RJET.20200901003. [Google Scholar] [CrossRef]
28. Majeed, I. B., Amevi, A., Eduful, G., Michael, M. B., Ruhiya, A. (2019). Migration from low to high voltage distribution system: An optimization of selected unit transformers using linear programming with matlab. Procedia Manufacturing, 35(5), 552–560. DOI 10.1016/j.promfg.2019.05.078. [Google Scholar] [CrossRef]
29. Survilo, J. (2017). Transformer design according to criteria and load profile. IEEE 58th International Scientific Conference on Power and Electrical Engineering of Riga Technical University, pp. 1–4. Riga, Latvia. [Google Scholar]
30. Diala State Company (2018). Distribution transformers, electrical characteristes. https://www.dialacompany.com/distribution.htm. [Google Scholar]
31. Nachimuthu, S., Zuo, M. J., Seewald, S., Richard, J., Connor, T. (2020). Modelling of inspection cycles for power distribution transformers. Asia-Pacific International Symposium on Advanced Reliability and Maintenance Modeling, pp. 1–5. Vancouver, BC, Canada. [Google Scholar]
32. ETAP (2022). Electrical power system analysis software. https://etap.com/. [Google Scholar]
33. Ellis, M., Blackburn, T. (2000). Analysis of potential for minimum energy performance standards for distribution transformers. In: Prepared for the Australian Greenhouse Office under national appliance and equipment energy efficiency program, pp. 1–87. [Google Scholar]
Cite This Article
 Copyright © 2022 The Author(s). Published by Tech Science Press.
This work is licensed under a Creative Commons Attribution 4.0 International License , which permits unrestricted use, distribution, and reproduction in any medium, provided the original work is properly cited.
 Downloads
 Citation Tools