
 Submit a Paper
 Propose a Special lssue
 Open Access
ARTICLE

Multi-Criteria Decision-Making for Power Grid Construction Project Investment Ranking Based on the Prospect Theory Improved by Rewarding Good and Punishing Bad Linear Transformation
1 Guangdong Power Grid Co., Ltd., Guangzhou, 510410, China
2 Electric Power Development Research Institute, China Electricity Council (CEC), Beijing, 100053, China
* Corresponding Author: Mingrui Zhao. Email:
Energy Engineering 2023, 120(10), 2369-2392. https://doi.org/10.32604/ee.2023.028727
Received 04 January 2023; Accepted 23 March 2023; Issue published 28 September 2023
 View Full Text
 Download PDF
Abstract
Using the improved prospect theory with the linear transformations of rewarding good and punishing bad (RGPBIT), a new investment ranking model for power grid construction projects (PGCPs) is proposed. Given the uncertainty of each index value under the market environment, fuzzy numbers are used to describe qualitative indicators and interval numbers are used to describe quantitative ones. Taking into account decision-maker’s subjective risk attitudes, a multi-criteria decision-making (MCDM) method based on improved prospect theory is proposed. First, the [−1, 1] RGPBIT operator is proposed to normalize the original data, to obtain the best and worst schemes of PGCPs. Furthermore, the correlation coefficients between interval/fuzzy numbers and the best/worst schemes are defined and introduced to the prospect theory to improve its value function and loss function, and the positive and negative prospect value matrices of the project are obtained. Then, the optimization model with the maximum comprehensive prospect value is constructed, the optimal attribute weight is determined, and the PGCPs are ranked accordingly. Taking four PGCPs of the IEEERTS-79 node system as examples, an illustration of the feasibility and effectiveness of the proposed method is provided.Keywords
The planning, investment, and construction of power grids are the basis for ensuring the safe and stable operation of power systems. The power grid construction has the characteristics of large investments and long periods [1]. In such a way that the cash flow of power grid companies can operate stably and maximize the economic and social benefits of investing in the power grid, it is an urgent problem that must be solved now [2]. In the electricity market environment, the traditional mode of investment has a lot of inconsistencies, resulting that it being difficult to accurately estimate PGCP income, and thus has a high investment risk [3]. Hence, developing investment ranking methods that comply with the market rules and enterprises’ actual situations is crucial.
The comprehensive evaluation index system is generally adopted for the investment ranking of PGCPs [4–6]. Its advantage is that it can not only consider subjective and objective factors like technical and economic benefit but also consider the operability of the project. However, when using the comprehensive indicator system for evaluation, the difficulties lie in 1) the quantification of quantitative indicators and qualitative indicators [7–9]; 2) how to analyze and compare indicators with different attributes and dimensions under the same scale; 3) how to consider the decision-makers risk appetite when evaluating the project.
The power market environment is characterized by uncertainties like on-grid price, electricity sales, power supply cost, power sales price, etc. [10]. For quantitative indicators in the comprehensive indicator system, uncertainty methods are often used to describe them, such as the interval number method [11], the fuzzy method [12], the probability method [13], and multi-scenario method [14]. The attribute values of quantitative indicators are described in this paper using the interval number method. For qualitative indicators, this paper uses expert evaluation and the triangular fuzzy number method [15] to quantify.
In the comprehensive evaluation index system of PGCPs investment ranking, there are not only technical indicators such as coordination, security, and reliability [16,17], but also economic indicators such as investment cost and investment income [18], as well as objective indicators such as project maturity [7]. In terms of indicator attributes, benefit indicators, cost indicators, and moderate indicators (the closer the indicator value is to a specific value, the better it is) are involved. Because the dimensions and attributes of each indicator are different, the data needs to be initialized for analysis and comparison. The commonly used initialization methods include normalization transformation, range maximization transformation, interval transformation, averaging transformation, and percentage transformation [19–21]. At the time of initialization, most of the literature has reduced all indicators to the interval [0, 1]. The disadvantage of this method is that it only rewards but not punishes the indicator data, which has certain limitations. In response to this problem, Reference [22] first proposed the liner transformation of rewarding good and punishing bad (RGPBIT), expanding the index interval to [−1, 1], and giving negative punishment to indicators below the mean value. References [23,24] proved that the resolution accuracy can be improved based on the principle of RGPBIT. Therefore, this paper proposes to use the RGPBIT to normalize all index data.
When evaluating and making decisions on PGCPs, the current common methods include dynamic programming [25], the best matching degree method of the project library [26], and optimization methods aiming at minimizing investment risk [27] or optimizing a certain index [28,29]. For instance, Reference [30] built a multi-objective decision-making optimization model for smart grid investment and proposed a solution method based on the hybrid cuckoo algorithm, which provided a reference for grid enterprises to develop grid business. Reference [31] established a multi-stage investment decision-making model to achieve the highest return on power grid projects. The effectiveness of the model and its advantages in improving investment efficiency were verified by case simulation and analysis. Reference [32] aimed for the maximum comprehensive benefit, introduced the investment feedback mechanism and established the PGPC’s investment timing optimization model.
In line with the above discussion, some gaps should be noted. On the one hand, the above methods all focus on objective indicators and fail to take into account the subjective preferences of decision-makers. In fact, under uncertainty, the risk preference of decision-makers is crucial to the decision results. Prospect theory [33,34] organically combined psychology and economics, and it believes that when facing gains, decision-makers are risk averse, but when facing losses, they are risk preference, and they are more sensitive to losses, which is suitable for dealing with their subjective preference in the PGCP investment decision-making in this paper. On the other hand, although the principle of RGPBIT has been proven to have high resolution, it has not been effectively applied in the research of PGCP investment decision-making. Therefore, this paper applies the prospect theory to ranking the PGPCs’ investment and introduces RGPBIT to improve the conventional prospect theory. In this way, an optimization model for maximizing the comprehensive prospect value is developed, and the PGCPs are ranked according to the comprehensive prospect value.
Overall, the main contribution of this paper is twofold. Firstly, under the framework of technical and economic analysis of PGCPs, this paper introduces the management factors of PGCPs and constructs a comprehensive performance evaluation index system with 4 dimensions of technology, efficiency, importance, and maturity, which expands the dimensions of investment decision evaluation of PGCPs. Secondly, the multi-criteria decision-making (MCDM) model for PGCP investment is constructed by combining prospect theory with the RGPBIT technique. The model can fully consider decision makers’ subjective preferences, and the RGPBIT overcomes the limitations of traditional initialization methods of reward without punishment, which can improve the resolution accuracy of indicators, thus making the results more reliable.
The rest of this paper is as follows: Section 2 constructs the indicator system for evaluating the comprehensive performance of PGCPs. Section 3 introduces the method of the decision-making matrix based on RGPBIT. Section 4 represents the MCDM model based on improved prospect theory. Section 5 reports the results of the case study and Section 6 summarizes this paper.
2 Comprehensive Indicator System for Investment Ranking of PGCPs
The focus of PGCP investment decision-making should mainly include two aspects: the technical level of the project and the investment benefit of the project. The former ensures the feasibility of project construction, and the latter ensures the economy of project investment. However, for power grid enterprises, there may be a large number of PGCPs that can meet the feasibility and economy. Therefore, it is necessary to further consider the project management factors when making investment decisions. The main management factors include two aspects. One is the importance of the project, that is, the supporting role of the proposed project for the operation of the power system, such as reducing the system overload ratio; The second is the management level of the whole process of the project, which reflects whether the proposed project can be completed with high quality as planned.
To sum up, drawing on relevant research [5,8,18], the comprehensive indicator system for investment ranking is mainly divided into 4 dimensions: technology, benefit, project importance, and maturity. Each dimension is subdivided into indicators, as shown in Fig. 1. When establishing the indicator system, the evaluation indicators are divided into 3 layers, namely target, dimension, and indicator layers. The indicators included in various levels are as follows:
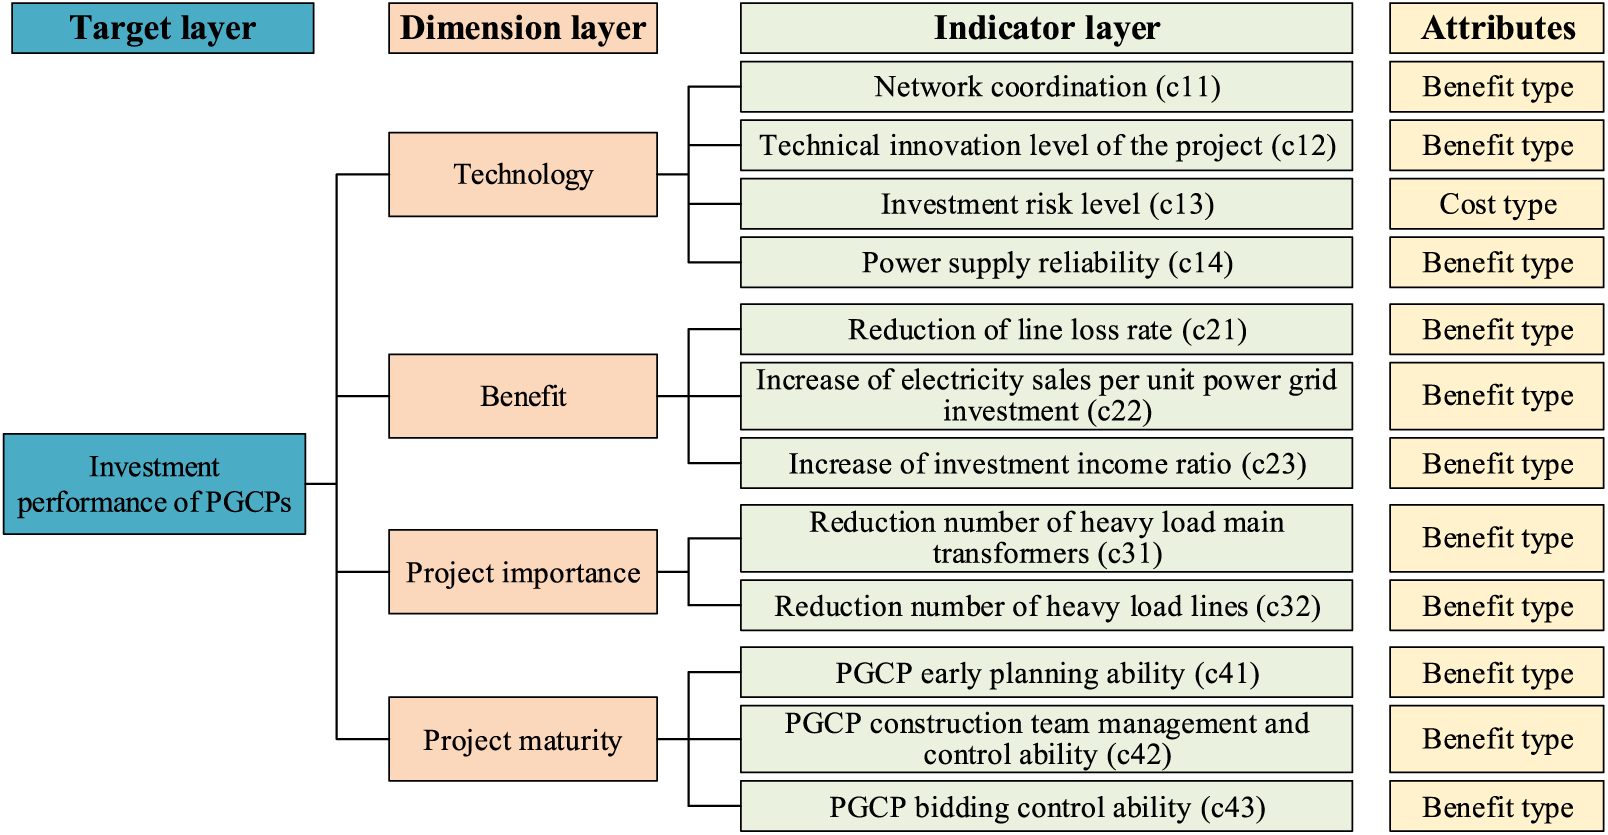
Figure 1: Comprehensive indicator system for investment ranking of PGCPs
Technology indicators. It mainly includes network coordination, technical innovation level, power supply reliability, and investment risk level.
Benefit indicators. It mainly considers the economic and social benefits, including the reduction of line loss, the increase in investment income ratio, as well as the increase in electricity sales.
Project importance indicators. Different PGCPs have different degrees of importance. Here, it mainly considers the reduction number of heavy load main transformers and heavy load lines after the project construction.
Project maturity indicators. Such indicators refer to the ability to control the early planning and implementation of the project, the ability to complete the project, and the ability to achieve the expected objectives of the project. It includes PGCP early planning ability, PGCP participation team management and control ability, and PGCP bidding control ability.
3 Equations and Mathematical Expressions
Let
3.1 Indicator Uncertainty Characterization
(1) Characterization of quantitative indicator
Uncertainties exist in the market environment like on-grid price, electricity sales, power supply cost, power sales price, etc., so each indicator is also uncertain. The uncertainty of each quantitative indicator is described in this paper using the interval number method. Set the interval of
(2) Characterization of qualitative indicators
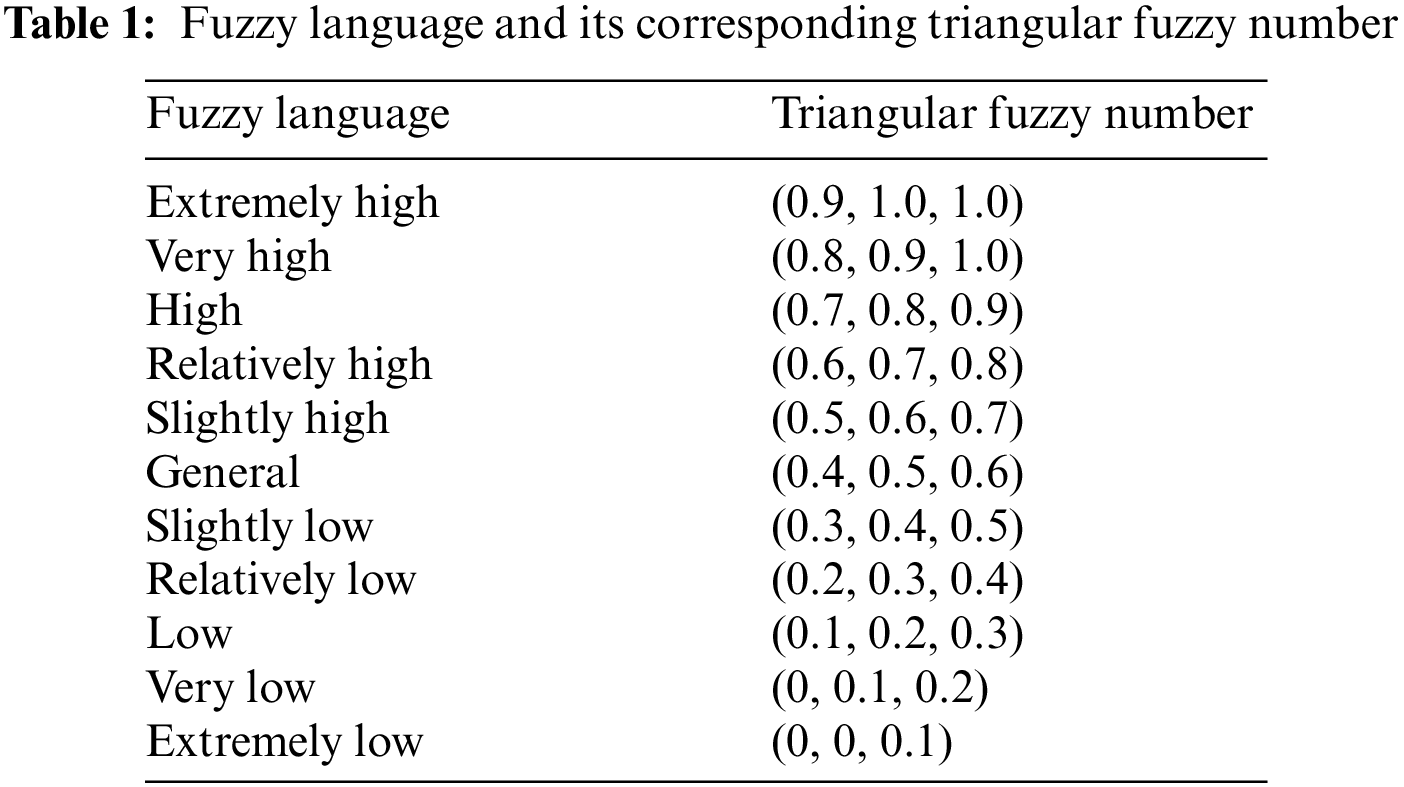
This paper quantifies qualitative indicators using triangular fuzzy numbers [14,35]. Table 1 shows the fuzzy language and numbers.
Suppose that
where
3.2 The Normalized Decision-Making Matrix Based on RGPBIT
This section transforms the above indicator values to [−1, 1] interval based on the RGPBIT operator. The main method is: when the indicator value is better than the average level, assign the index value as [0, 1]; When the index value is less than the average value, assign the index value as [−1, 0].
(1) RGPBIT of quantitative indicators
Let:
Among them, for benefit type indicators, it is:
For cost type indicators, it is:
where
where
(2) RGPBIT of qualitative indicators
Let:
Among them, for benefit type indicators, it is:
For cost type indicators, it is:
where
Through the RGPBIT operator, the evaluation matrix
3.3 Determination of the Best and Worst Schemes
The best and worst schemes are given below for quantitative and qualitative indicators, respectively.
(1) The best and worst schemes of quantitative indicators (interval indicator)
Define:
The corresponding attribute value is recorded as
Define:
The corresponding attribute value is recorded as
(2) The best and worst schemes of qualitative indicators (fuzzy indicator)
Define:
The corresponding fuzzy attribute value is recorded as
Define:
The corresponding fuzzy attribute value is recorded as
The best scheme point set and the worst scheme point set of each indicator constitute the attribute values of the best scheme and the worst scheme respectively. The vectors composed of the best attribute values and the worst attribute values are as follows:
The best attribute value vector:
In the formula, if
The worst attribute value vector:
In the formula, if
3.4 Construction of Decision-Making Matrix Based on the Grey Correlation Coefficient
The closeness of each indicator to the best and worst scheme points reflects the advantages and disadvantages of the indicator. Based on this, this paper uses the gray correlation method [36,37] to characterize the closeness of each indicator to the best and worst scheme points, and constructs the decision-making matrix of alternatives.
If the index set of the
where
If
If
The positive correlation coefficient matrix
4 PGCP Investment Ranking Method Based on Prospect Theory
Prospect theory [38] is a method taking into account the subjective feelings of decision-makers, that is, when facing gains, decision-makers are risk averse, and when facing losses, they are risk preference.
Calculating the prospect value of each PGCP is based on prospect theory. By combining the value function and decision-making weight, the prospect value is determined, and it is calculated as follows:
where
4.1 Value Function and Decision-Making Weight
In decision-making, the value function [39] is the value formed by subjective feelings. The commonly used value function is as follows:
where parameter
Generally, the decision-making weight [41] is determined according to Eq. (20):
where
4.2 Improved Benefit and Loss Function
The prospect theory shows that when facing the decision, the decision-maker will judge the benefits and losses of the decision according to the reference point value, so selecting the reference point is crucial to the results of the decision. In this paper, the best scheme and the worst scheme based on RGPBIT are used as reference points to judge the benefits and losses of decision results. Specifically, when the best scheme is taken as a reference point, the indicator values of the alternative are inferior to the best scheme, so the decision-maker is faced with losses, and at this time the decision-maker pursues risks. When the worst scheme is taken as a reference point, the indicator values of the alternative are superior to the worst scheme, so the decision-maker is faced with benefits, and the decision-maker is risk-averse at this point.
Therefore, using the prospect theory and the correlation coefficient of every indicator with the best/worst scheme, the prospect value of each indicator will be calculated.
The attribute value of the
In the formula,
The positive and negative prospect value matrices of the project indicators can be obtained from the benefits and losses value functions, which are
4.3 Comprehensive Prospect Value of PGCP
According to Eq. (20), the indicator decision-making weights of the scheme benefits and losses are:
where
The comprehensive prospect value
When performing MCDM issues, in order to make each alternative’s comprehensive prospect value larger, the optimal weight of each index is obtained through optimization methods. The optimization model is as follows:
In the formula,
The comprehensive optimal prospect values of various PGCPs are gained from Eq. (25), and the projects can be ranked from large to small based on the comprehensive optimal prospect values.
In this section, the typical IEEE-RTS79 node system [42] is applied for a case study to verify the applicability of the developed model. As a result of regional load growth, transmission lines and transformers need to be planned. The information on planned PGCPs (1, 2, 3, 4) is as follows. The marketization rate is set to be 0.3. Then, the project cost of the transmission line for one km is 1.4 million yuan and the project cost of the transformer is 400000 yuan/MVA [43]. The service life of the equipment is 18 years.
PGCP 1: There is an increased load of 136 MW on the bus 6. Therefore, it is proposed to construct a new 25.76 km transmission line, which connects node 6 and node 10. Besides, an 80 MVA transformer is added at the same time. The investment fee is 68.06 million yuan and the operation cost for the project is 5 million yuan/year.
PGCP 2: There is a changed load at bus 4, increasing from 74 to 285 MW. A new 44 km transmission line is proposed to be built from node 4 to node 9, and the transformer capacity is increased from 240 to 300 MVA. Then, the investment fee is 85.6 million yuan and the operation cost for the project is 5.9 million yuan/year.
PGCP 3: There is a changed load at bus 5, increasing from 71 to 300 MW. A new 36 km transmission line is proposed to be built from node 1 to node 5, and the transformer capacity is increased from 120 to 320 MVA. Then, the investment fee is 130.4 million yuan and the operation cost for the project is 5.2 million yuan/year.
PGCP 4: There is a changed load at bus 8, increasing from 171 to 270 MV, a new 26 km transmission line is proposed to be built between nodes 7 and 8, and the transformer capacity is increased from 200 to 300 MVA. The investment fee is 76.4 million yuan and the operation cost for the project is 5 million yuan/year.
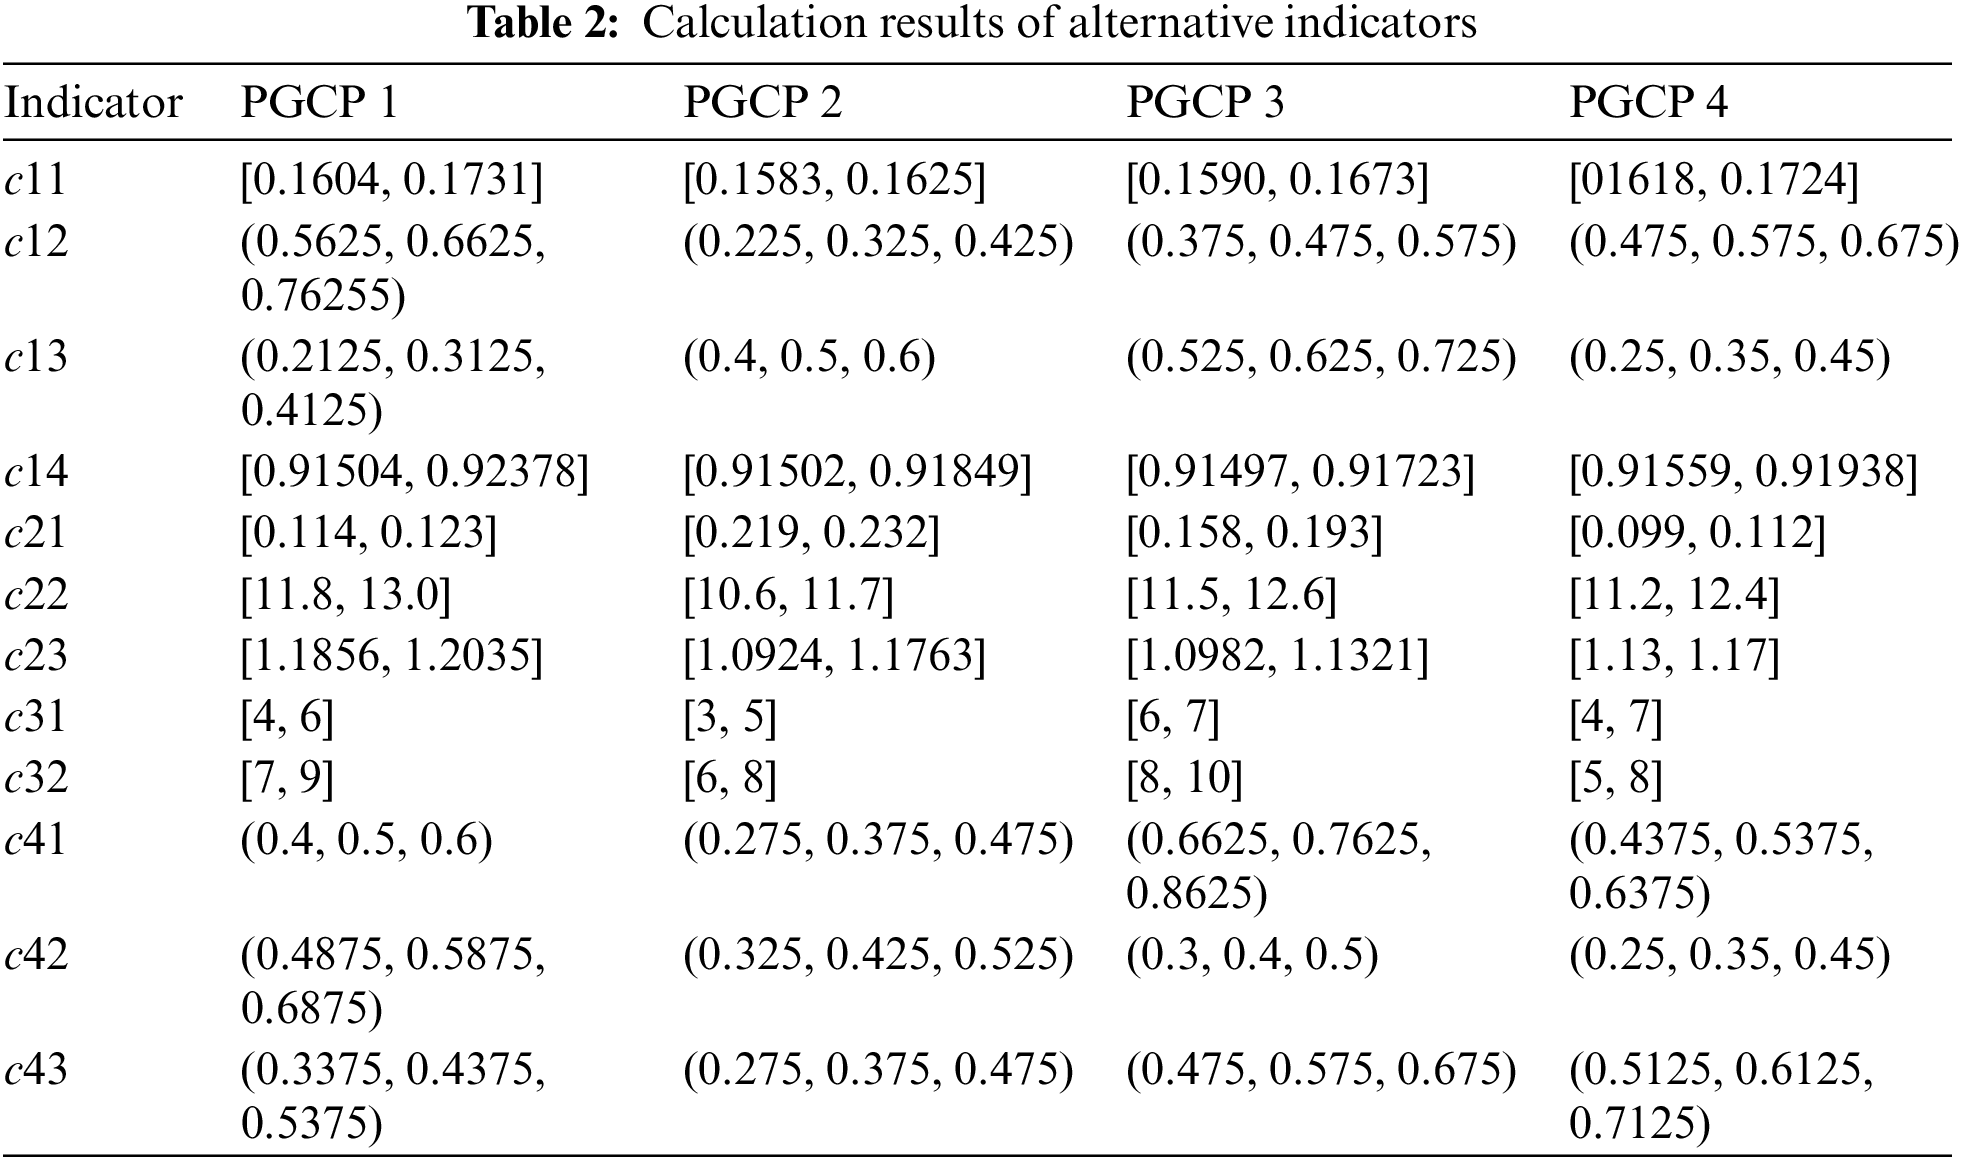
In the indicator system in Fig. 1, PGCP early planning ability, PGCP participation team management and control ability, PGCP bidding control ability, technical innovation level of the project, and investment risk level are qualitative indicators, which are quantified by fuzzy methods according to expert scoring. For the rest quantitative indicators, the calculation of the network coordination indicator is the same as that in reference [44], and calculating the load loss rate is used to determine the reliability of the power supply. For indicators such as reduction of line loss rate, the power flow with/without the planning project is calculated in a given system, and then the indicator values are obtained accordingly. For the increase in electricity sales, based on the economic development situation, the gray prediction model is employed to predict the electricity demand, and the increased electricity amount is the increased electricity sold. For the investment income ratio index, the investment amount and income are calculated respectively by combining the life-cycle and uncertainty methods [45], and the ratio of the two is the investment income ratio. The calculation process and results of each indicator are shown in Appendix A, and the results of each indicator for investment ranking of PGCPs are obtained, as shown in Table 2.
5.3 Investment Ranking Results of Alternatives
(1) Results of RGPBIT
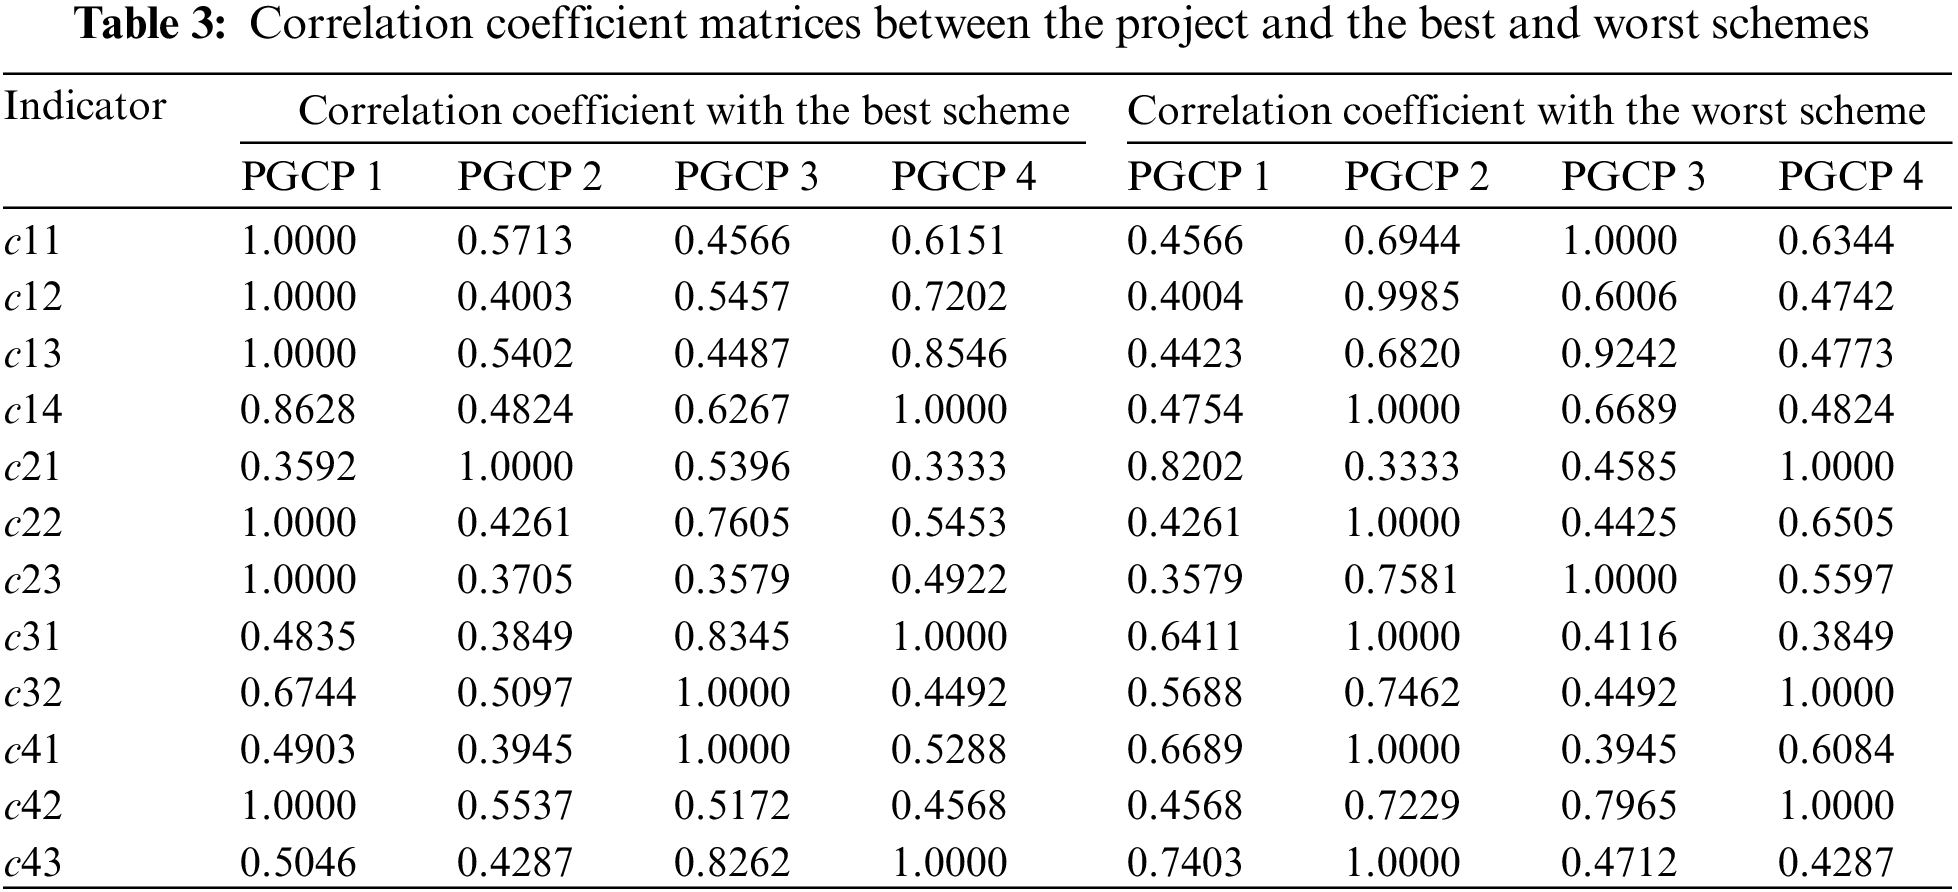
In the indicator system in Fig. 1, only the investment risk level is the cost type indicator, and other indicators are benefit type indicators. Firstly, the RGPBIT operator is carried out for the indicators, and the normalized matrix of the transformed indicator value belonging to [−1, 1] is obtained. The best and worst scheme points are obtained accordingly, and the correlation coefficient matrices of the project indicators and the ideal points are obtained. The results are shown in Table 3.
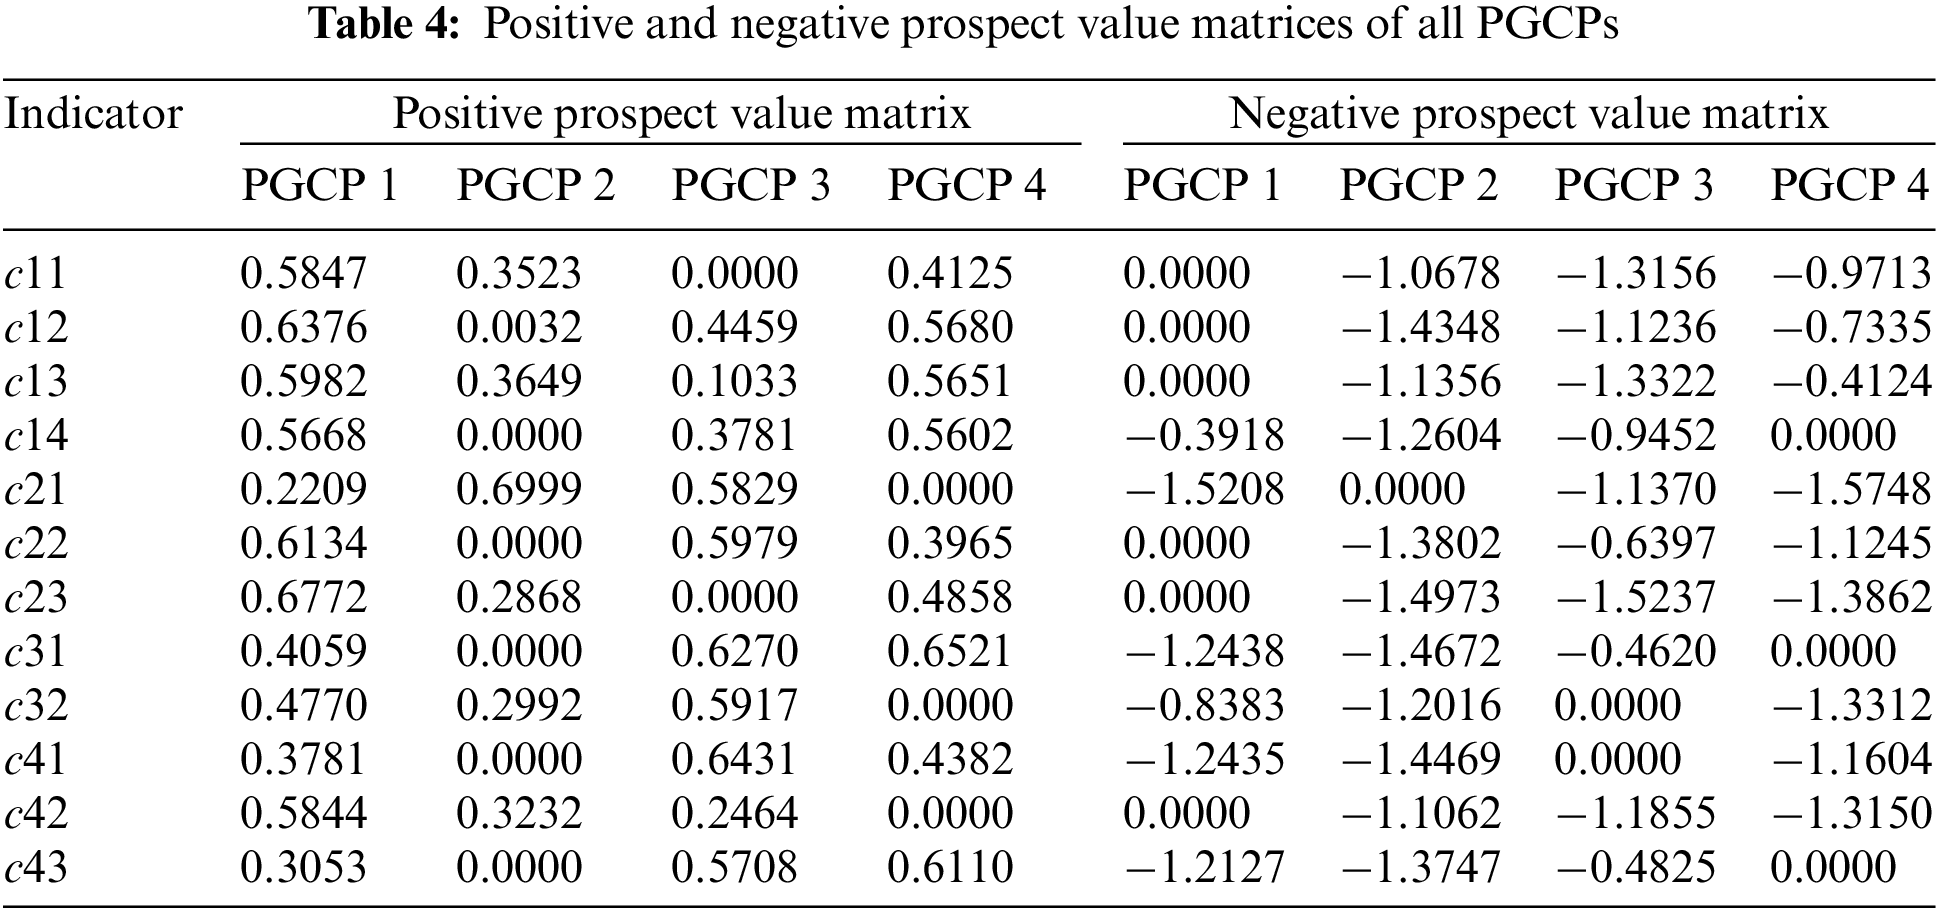
(2) Positive and negative prospect value matrices
The value function and decision-making weight parameters used in the prospect theory calculation are [40]:
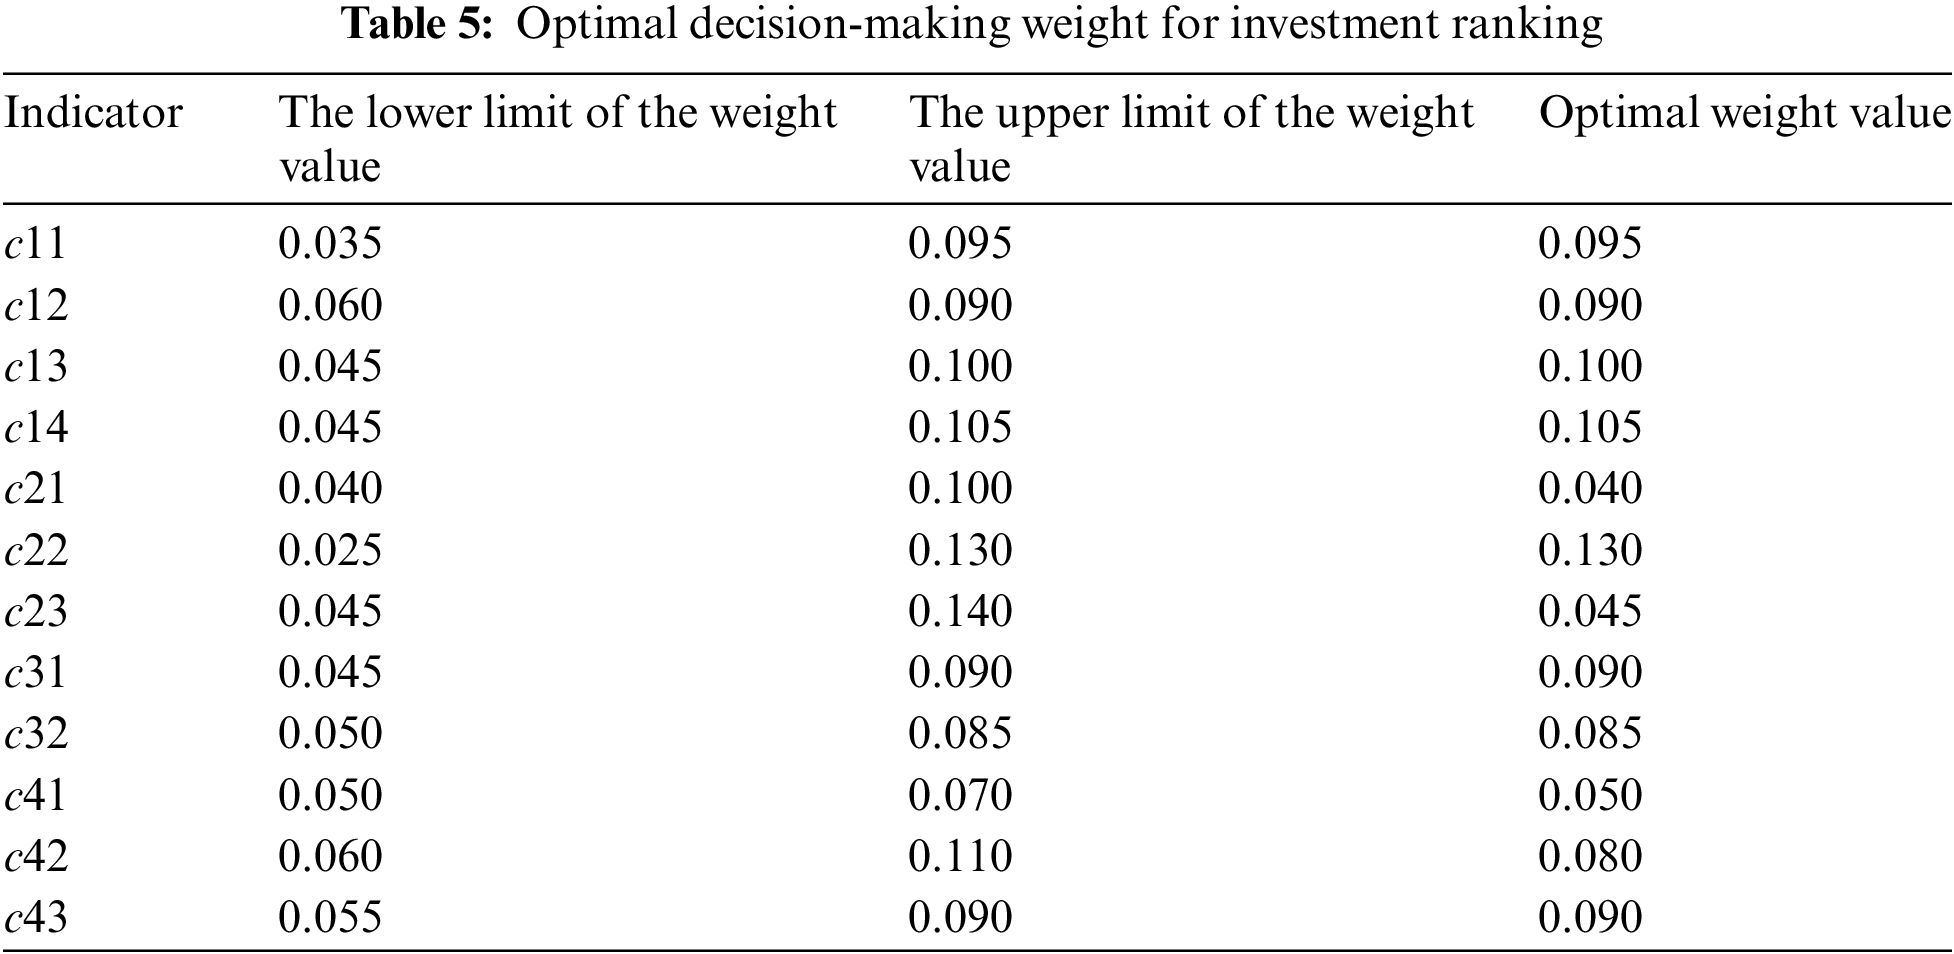
(3) Optimal decision-making weight and comprehensive prospect value
The optimal decision-making weight is calculated using Eq. (24), as shown in Table 5.
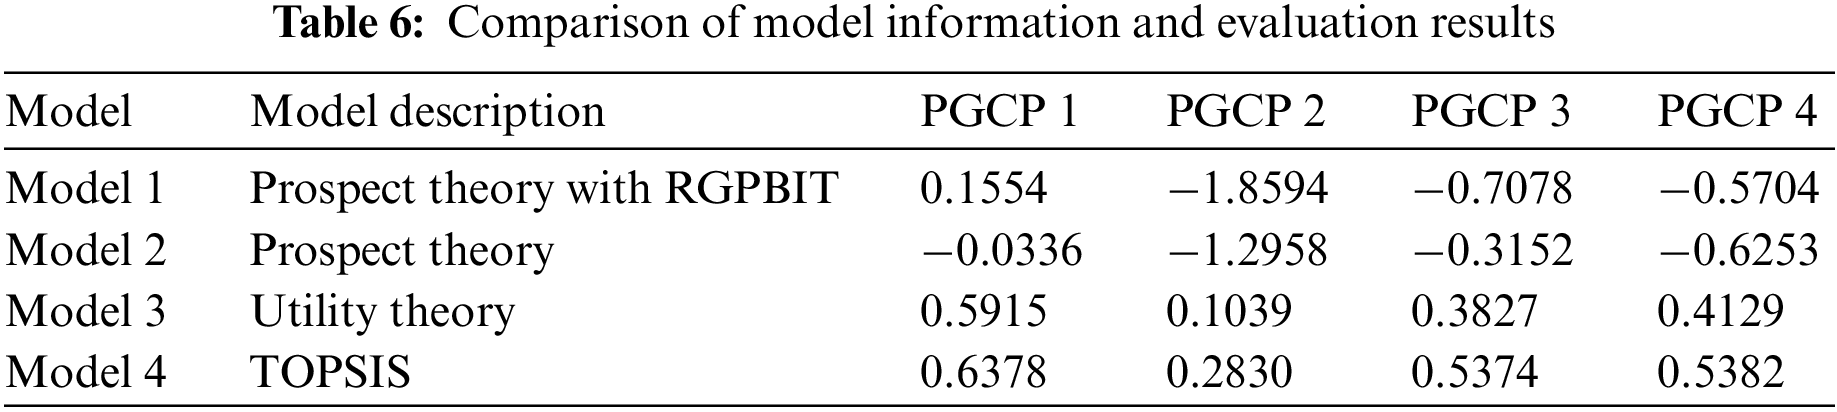
Further, according to Eq. (25), the comprehensive prospect values of PGCPs 1 to 4 are respectively 0.1554, −1.8594, −0.7078, and −0.5704, so the investment ranking of the four PGCPs should be
5.4 Comparative Analysis of Models
To further verify the effectiveness of the proposed model, three comparison models are designed in this section. The model information and corresponding evaluation results are shown in Table 6.
Based on the calculation results in Table 6, this section further tests the robustness and effectiveness of the proposed model. Among them, the robustness is analyzed by the ranking consistency test [46,47], and the effectiveness of the model is analyzed by the sample separation test [9,48]. The following indicators are constructed:
where
where
According to the calculation results of the four models, the ranking consistency and sample separation index of each model can be calculated, as shown in Tables 7 and 8.
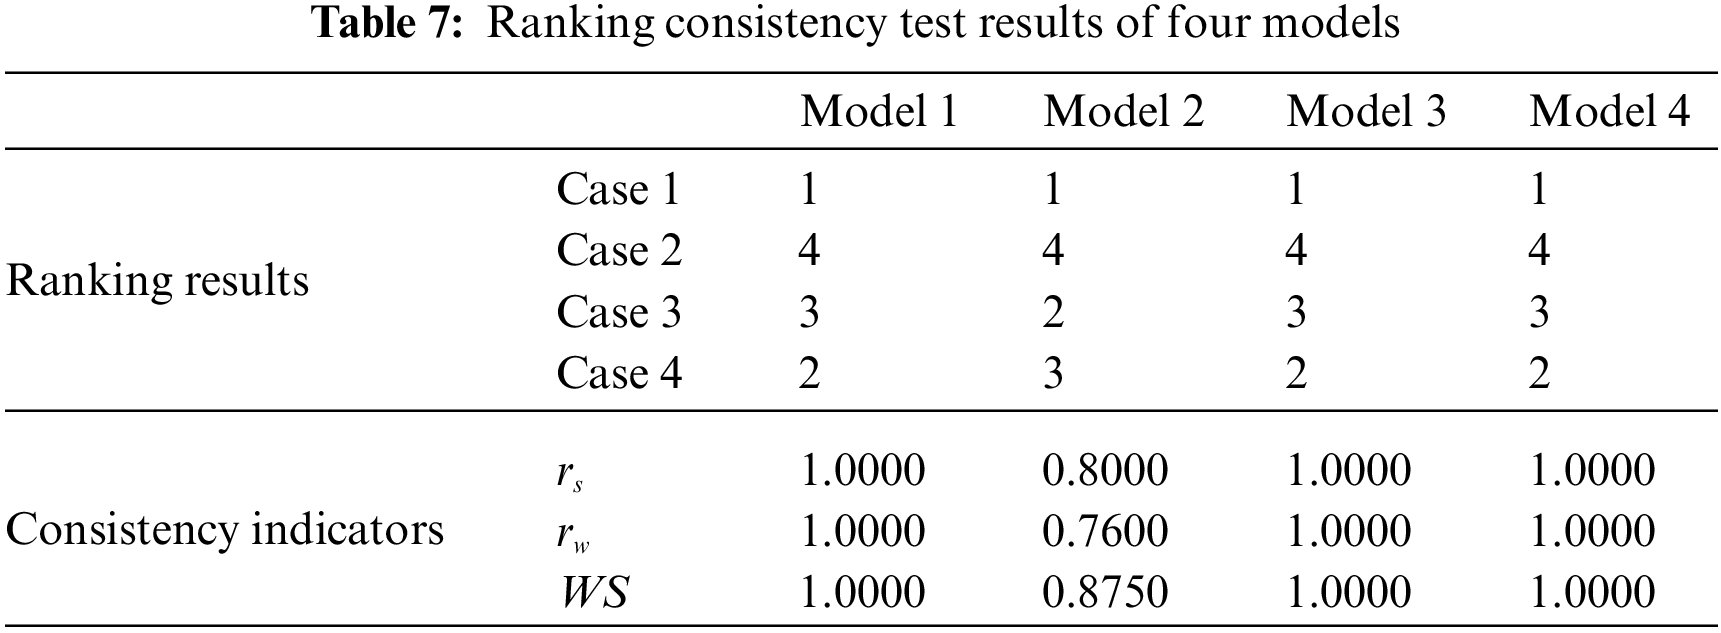
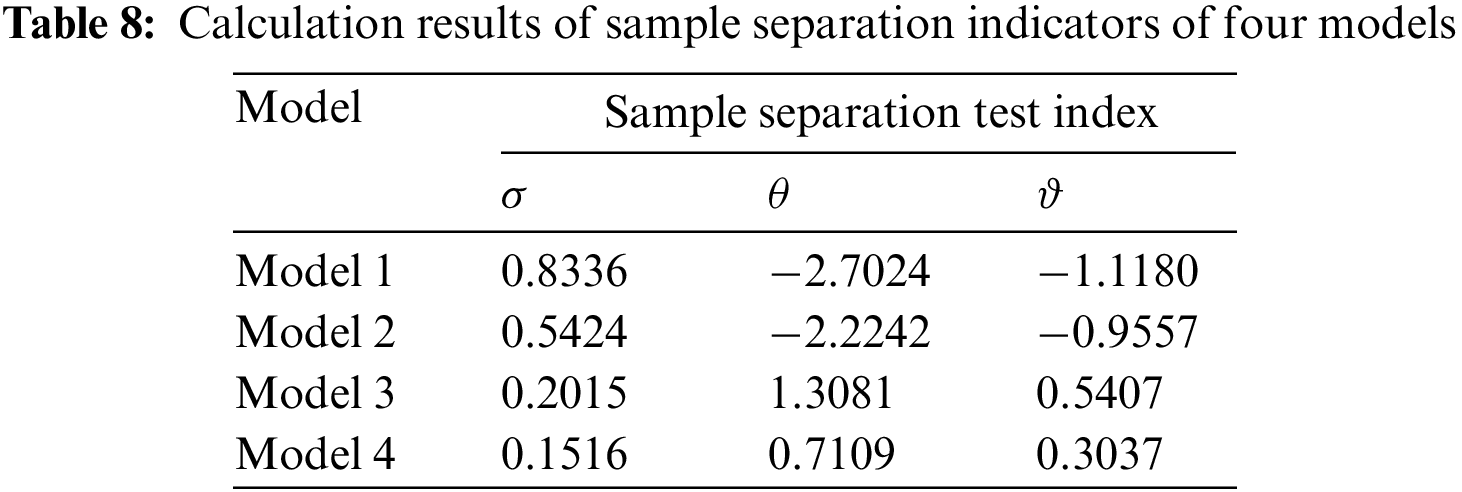
According to Tables 7 and 8, on the one hand, the ranking consistency test results show that the ranking results of Model 3 and Model 4 are identical to that of Model 1, and the ranking consistency coefficients are all 1. The ranking results of Model 2 and Model 1 are different, but the best and worst schemes are the same. Therefore, the ranking results of the three comparison models are highly consistent with those of Model 1, indicating that the constructed model is robust. On the other hand, the sample separation test results show that the three separation index values (or the absolute values of the index) of Model 1 are significantly greater than the values of the three contrast models, indicating that the constructed model can more clearly distinguish the sample differences, thus improving the decision-making efficiency. Next, this section further compares and analyzes the results of the four models.
(1) Comparison and analysis with traditional prospect theory model
This paper adopts the prospect theory method improved by RGPBIT operator. Compared with the traditional prospect theory method, RGPBIT combines reward and punishment, overcoming the shortcomings of the existing method of “only rewarding but not punishing”.
The results based solely on prospect theory are shown in the second row of Table 6. It can be seen that the ranking result based on the comprehensive prospect value of the traditional prospect theory model is
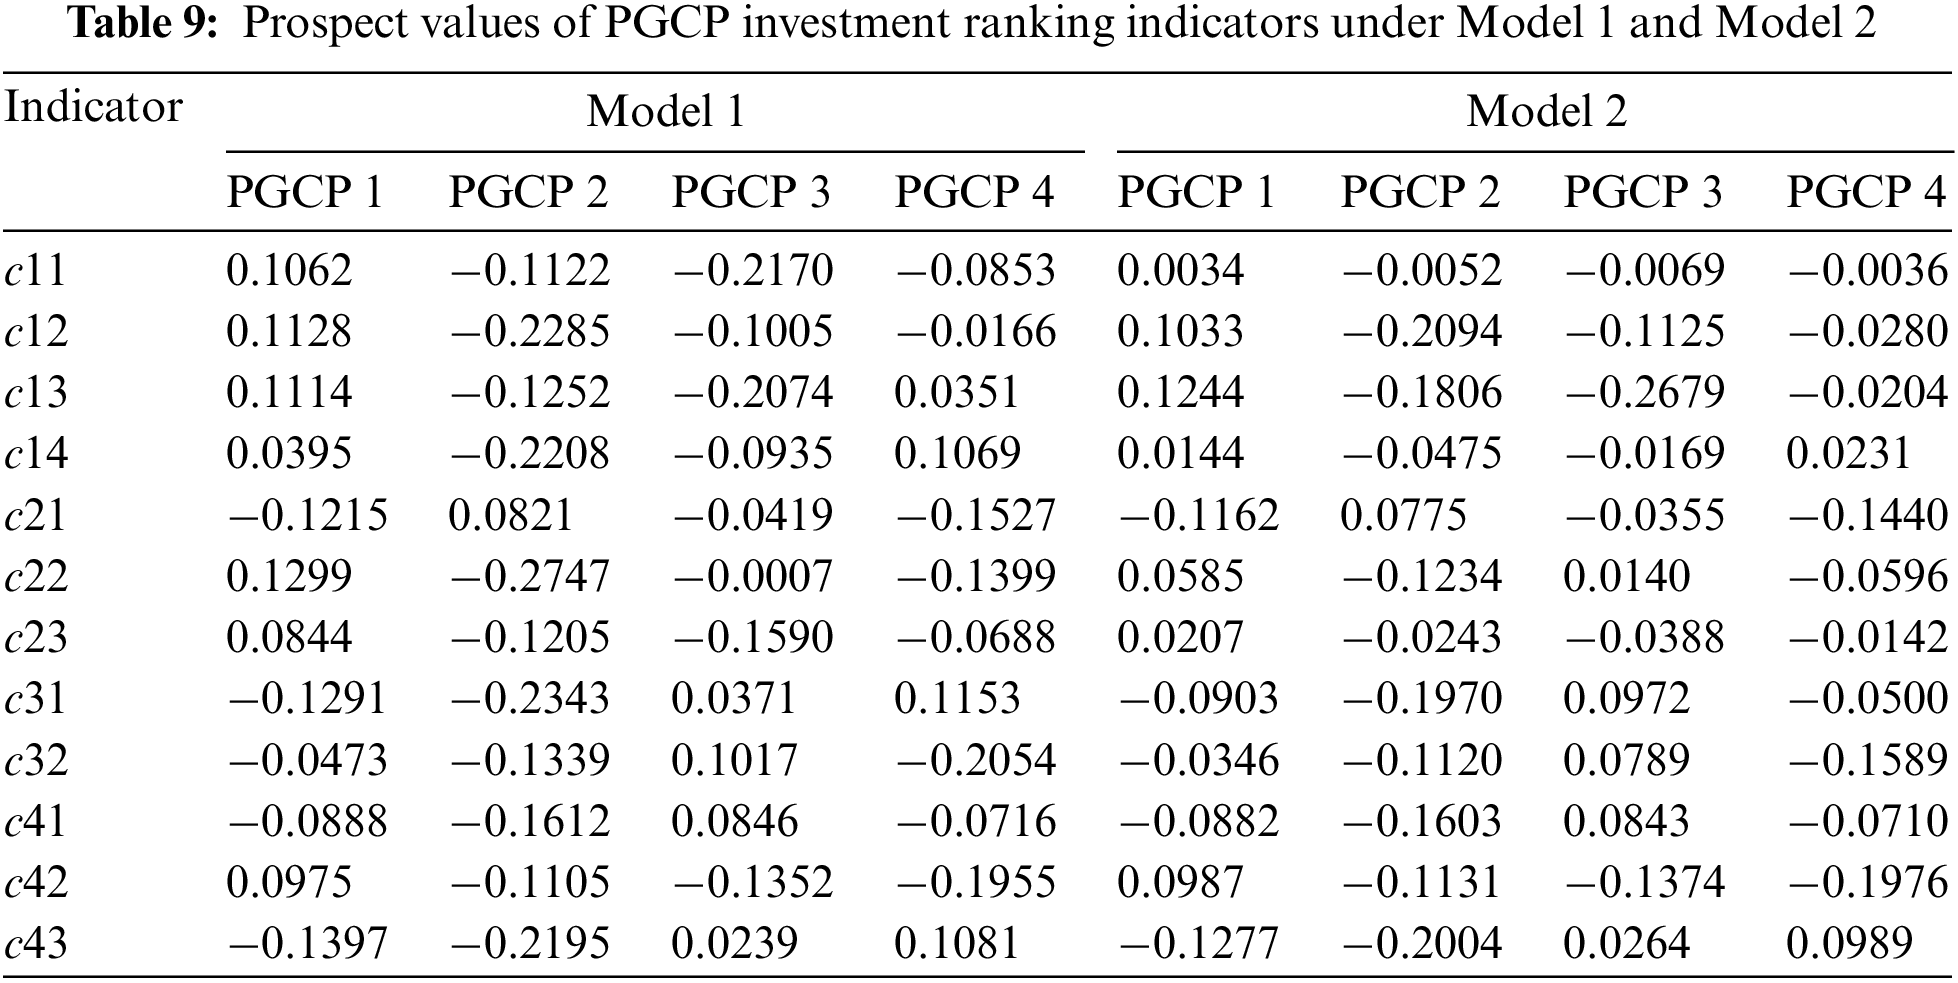
Table 9 represents the prospect values of each PGPC indicator for the two methods (Model 1 and Model 2). It can be seen that under the effect of “punishing the good”, the prospect values of network coordination, power supply reliability, and investment income ratio of PGCP 3 are obviously smaller than those based on traditional prospect theory. However, only one indicator named power supply reliability of PGCP 4 is significantly less than the result based on traditional prospect theory. Therefore, it can be seen that the proposed RGPBIT prospect theory model in this paper not only considers the “rewarding the good”, but also takes into account the “punishing the bad”. Compared with the traditional prospect theory results based on “rewarding the good”, the investment ranking results of PGCPs may be different.
(2) Comparative analysis with utility theory model
The investment ranking results of PGCPs based on utility theory are further given in this paper, as shown in the third row of Table 6. The utility theory takes the decision-maker as a rational person to make rational judgments on various risks in decision-making problems, and then make decisions [49,50]. The common point of this method with the proposed RGPBIT prospect theory is that decision-makers risk preference is taken into account when making investment decisions. The difference is that in RGPBIT prospect theory, decision-makers have different risk attitudes towards benefits and losses, while the utility theory judges whether the decision-maker is risk-seeking, risk aversion, or risk neutral according to the expected value calculated from the utility function. Generally, in most cases, the results of prospect theory are consistent with those of utility theory [51,52]. It can be seen from Table 6 that the ranking of four PGCPs based on comprehensive utility values is
(3) Comparison and analysis with TOPSIS model
According to TOPSIS, the positive ideal solution is the optimal solution, and its attribute values all reach the optimal value. The negative ideal solution is the worst solution with all indicator values reaching the worst. This method compares each alternative with the positive and the negative ideal solutions, and the alternative closest to the positive one and farthest from the negative one is the optimal solution [53,54].
The idea of the TOPSIS method is the same as that of the prospect theory method. The difference is that the prospect theory uses the value function and decision-making weight to reflect the decision-maker’s risk attitude towards benefits and losses, to determine the comprehensive prospect value. The ranking method of TOPSIS uses the distance degree from the ideal solution. It is noted from Table 6 that the rankings of TOPSIS are consistent with that of the proposed RGPBIT prospect theory model in this paper, both of which are
The planning, investment, and construction of the power grid are the basis for ensuring the safe and stable operation of the power system. Power grid construction is characterized by many projects, large investments and long cycles, so it is necessary to develop targeted investment ranking methods. Based on the technology and economic analysis framework of investment decision-making of PGCPs, this paper introduces project management factors and constructs a comprehensive performance evaluation index system for PGCPs. On this basis, taking into account the subjective preferences of decision-makers in the process of PGCP investment decision-making, an MCDM model based on prospect theory is proposed, and the RGPBIT operator is used to improve conventional prospect theory.
Based on the IEEE-RTS79 node example, the investment ranking of four PGCPs to be built is evaluated. The results show that
Compared with the three ranking methods called conventional prospect theory, utility theory, and TOPSIS, the ranking consistency index of the model built in this paper is high, indicating that the proposed model has strong robustness. At the same time, the sample separation indexof the model in this paper is significantly greater than those of the comparison models, indicating that the decision-making efficiency is higher. According to the comparison results, it can be verified that the proposed MCDM method based on RGPBIT improved prospect theory can improve the decision-making efficiency on the premise of ensuring robustness, which can provide a new solution for MCDM of PGCPs with considering the subjective performance of decision makers.
Acknowledgement: Thanks are due to the editors and reviewers for their valuable opinions, which are of great help to improve the quality of this paper.
Funding Statement: The authors received no specific funding for this study.
Author Contributions: The authors confirm contribution to the paper as follows: Study conception and design: S. M., X. W.; Data collection: S. M.; Analysis and interpretation of results: N. Y., M. Z.; Draft manuscript preparation: X. H. All authors reviewed the results and approved the final version of the manuscript.
Availability of Data and Materials: The data supporting this paper’s findings are available on request from the corresponding author.
Conflicts of Interest: The authors declare that they have no conflicts of interest to report regarding the present study.
References
1. Ehsan, A., Yang, Q. (2019). State-of-the-art techniques for modeling of uncertainties in active distribution network planning: A review. Applied Energy, 239(3063–3072), 1509–1523. [Google Scholar]
2. Nikolakakis, T., Chattopadhyay, D., Bazilian, M. (2017). A review of renewable investment and power system operational issues in Bangladesh. Renewable and Sustainable Energy Reviews, 68(11), 650–658. [Google Scholar]
3. Sun, J., Ruze, N., Zhang, J., Zhao, H., Shen, B. (2019). Evaluating the investment efficiency of China’s provincial power grid enterprises under new electricity market reform: Empirical evidence based on three-stage DEA model. Energies, 12(18), 1–17. [Google Scholar]
4. Jiang, Q., Huang, R., Huang, Y., Chen, S., He, Y. et al. (2019). Application of BP neural network based on genetic algorithm optimization in evaluation of power grid investment risk. IEEE Access, 7, 154827–154835. [Google Scholar]
5. Zhao, T., Jiang, Y., Jiang, H., Gao, Y., Wu, W. et al. (2020). Index system and methods for comprehensive assessment of cross-border power grid interconnection projects. Global Energy Interconnection, 3(6),532–544. [Google Scholar]
6. Li, Y., Zhang, F., Li, Y., Li, B., Li, Z. et al. (2019). Evaluating the power grid investment behavior in China: From the perspective of government supervision. Energies, 12(21), 1–23. [Google Scholar]
7. Fang, Y., Wang, X., Shi, J., Wu, X., Yan, H. (2017). Research on operation and economic efficiency evaluation of provincial power grid with integrated renewable energy. Power System Technology, 41(7), 2138–2145. [Google Scholar]
8. Duan, Y., Sun, Y., Zhang, Y., Fan, X., Dong, Q. et al. (2021). Risk evaluation of electric power grid investment in China employing a hybrid novel MCDM method. Mathematics, 9(5), 1–22. [Google Scholar]
9. Zhao, H., Li, B., Lu, H., Wang, X., Li, H. et al. (2022). Economy-environment-energy performance evaluation of CCHP microgrid system: A hybrid multi-criteria decision-making method. Energy, 240(4), 122830. [Google Scholar]
10. Li, W. (2014). Risk assessment of power systems: models, methods, and applications. USA: John Wiley & Sons. [Google Scholar]
11. Wang, Z., Xu, G., Wang, H., Ren, J. (2019). Distributed energy system for sustainability transition: A comprehensive assessment under uncertainties based on interval multi-criteria decision making method by coupling interval DEMATEL and interval VIKOR. Energy, 169(3), 750–761. [Google Scholar]
12. Cui, M., Sun, Y., Yang, J., Li, Y. L., Wu, W. N. (2013). Power grid security comprehensive assessment based on multi-level grey area relational analysis. Power System Technology, 37(12), 3453–3460. [Google Scholar]
13. Wang, C., Yan, C., Li, G., Liu, S., Bie, Z. (2020). Risk assessment of integrated electricity and heat system with independent energy operators based on Stackelberg game. Energy, 198(1), 117349. [Google Scholar]
14. Jing, R., Zhu, X., Zhu, Z., Wang, W., Meng, C. et al. (2018). A multi-objective optimization and multi-criteria evaluation integrated framework for distributed energy system optimal planning. Energy Conversion and Management, 166, 445–462. [Google Scholar]
15. Wen, Q., Liu, G., Wu, W., Liao, S. (2021). Multicriteria comprehensive evaluation framework for industrial park-level distributed energy system considering weights uncertainties. Journal of Cleaner Production, 282, 124530. [Google Scholar]
16. Xu, X., Niu, D., Qiu, J., Wu, M., Wang, P. et al. (2016). Comprehensive evaluation of coordination development for regional power grid and renewable energy power supply based on improved matter element extension and TOPSIS method for sustainability. Sustainability, 8(2), 143. [Google Scholar]
17. Zhao, J., Gómez-Expósito, A., Netto, M., Abur, A., Terzija, V. et al. (2019). Power system dynamic state estimation: Motivations, definitions, methodologies, and future work. IEEE Transactions on Power Systems, 34(4), 3188–3198. [Google Scholar]
18. Hong, T., Koo, C., Kwak, T., Park, H. S. (2014). An economic and environmental assessment for selecting the optimum new renewable energy system for educational facility. Renewable and Sustainable Energy Reviews, 29(5), 286–300. [Google Scholar]
19. Khan, Q., Liu, P., Mahmood, T., Smarandache, F., Ullah, K. (2018). Some interval neutrosophic dombi power bonferroni mean operators and their application in multi-attribute decision-making. Symmetry, 10(10), 459. [Google Scholar]
20. Xue, J., van Gelder, P., Reniers, G., Papadimitriou, E., Wu, C. (2019). Multi-attribute decision-making method for prioritizing maritime traffic safety influencing factors of autonomous ships’ maneuvering decisions using grey and fuzzy theories. Safety Science, 120(4), 323–340. [Google Scholar]
21. Dong, F., Wu, L., Liu, H., Shen, H., Zhai, Z. (2022). Multi-attribute decision analysis on three-parameter interval grey number based on bell-shaped possibility. The Journal of Grey System, 34(2), 59. [Google Scholar]
22. Wang, J., Fan, Z. P. (2004). A synthetic evaluation method for the performance of knowledge management. Journal of Industrial Engineering and Engineering Management, 2, 44–48. [Google Scholar]
23. Willard, A. K., Baimel, A., Turpin, H., Jong, J., Whitehouse, H. (2020). Rewarding the good and punishing the bad: The role of karma and afterlife beliefs in shaping moral norms. Evolution and Human Behavior, 41(5), 385–396. [Google Scholar]
24. Peng, D., Song, B., Zhang, W. (2023). A hesitant fuzzy method of rewarding good and penalizing bad in cloud computing user behavior-based safety evaluation. Journal of Frontiers of Computer Science and Technology, 17, 973–984. [Google Scholar]
25. Gholami, A., Nafisi, H., Askarian Abyaneh, H., Ardakani, A. (2022). Dynamic stochastic joint expansion planning of power systems, natural gas networks, and electrical and natural gas storage. IET Generation, Transmission & Distribution, 16(8), 1489–1506. [Google Scholar]
26. Ge, S. Y., Xu, D. X., Liu, H., Liu, Y., Liang, Y. C. (2012). A two-stage integrated decision optimization method based on the established project library. Power System Protection and Control, 40(22), 118–123 +128. [Google Scholar]
27. Anwar, M. B., Stephen, G., Dalvi, S., Frew, B., Ericson, S. et al. (2022). Modeling investment decisions from heterogeneous firms under imperfect information and risk in wholesale electricity markets. Applied Energy, 306(8), 117908. [Google Scholar]
28. Ge, Y., He, Y., Hu, X., Sun, W., Zhang, W. et al. (2017). Analysis method and empirical research on economic benefit of large-scale consumptive power grid investment. The Journal of Engineering, 2017(13), 1285–1289. [Google Scholar]
29. Yao, X., Fan, Y., Zhao, F., Ma, S. C. (2022). Economic and climate benefits of vehicle-to-grid for low-carbon transitions of power systems: A case study of China’s 2030 renewable energy target. Journal of Cleaner Production, 330(1), 129833. [Google Scholar]
30. Tan, Z., Tan, C., Yu, X., Zhang, H., Pu, L. et al. (2021). Multi-service portfolio investment decision optimization of smart grid based on hybrid cuckoo algorithm. Smart Power, 49(4), 51–57+88. [Google Scholar]
31. Cheng, X., Wu, S., Wang, J., Zhang, W., Zhang, S. et al. (2021). Research on multi-stage investment optimization decision-making of power grid projects in the context of transmission and distribution price reform. Power System Protection and Control, 49(15), 116–123. [Google Scholar]
32. Jin, Z., Li, H., Li, S., Deng, J., Yin, S. et al. (2022). Investment timing optimization method for power grid planning projects considering investment capacity feedback. Electric Power Automation Equipment, 42(3), 168–174. [Google Scholar]
33. Ruggeri, K., Alí, S., Berge, M. L., Bertoldo, G., Bjorndal, L. D. et al. (2020). Replicating patterns of prospect theory for decision under risk. Nature Human Behaviour, 4(6), 622–633. [Google Scholar] [PubMed]
34. Ilbahar, E., Kahraman, C., Cebi, S. (2022). Risk assessment of renewable energy investments: A modified failure mode and effect analysis based on prospect theory and intuitionistic fuzzy AHP. Energy, 239, 121907. [Google Scholar]
35. Dong, J., Wan, S., Chen, S. M. (2021). Fuzzy best-worst method based on triangular fuzzy numbers for multi-criteria decision-making. Information Sciences, 547(4), 1080–1104. [Google Scholar]
36. Yan, R., Tong, W., Jiaona, C., Alteraz, H. A., Mohamed, H. M. (2021). Evaluation of factors influencing energy consumption in water injection system based on entropy weight-grey correlation method. Applied Mathematics and Nonlinear Sciences, 6(2), 269–280. [Google Scholar]
37. Li, H., Li, B., Yang, G., Chen, C., Chen, Y. et al. (2020). Evaluating the regulatory environment of overseas electric power market based on a hybrid evaluation model. International Journal of Fuzzy Systems, 22(1), 138–155. [Google Scholar]
38. Fang, H., Li, J., Song, W. (2018). Sustainable site selection for photovoltaic power plant: An integrated approach based on prospect theory. Energy conversion and management, 174(3), 755–768. [Google Scholar]
39. Zhang, X., Fan, Z. P. (2012). Method for risky hybrid multiple attribute decision making based on prospect theory. Journal of Systems Engineering, 27(6), 772–781. [Google Scholar]
40. Tversky, A., Kahneman, D. (1992). Advances in prospect theory: Cumulative representation of uncertainty. Journal of Risk and Uncertainty, 5(4), 297–323. [Google Scholar]
41. Prietzel, T. T. (2020). The effect of emotion on risky decision making in the context of prospect theory: A comprehensive literature review. Management Review Quarterly, 70(3), 313–353. [Google Scholar]
42. Subcommittee, P. M. (1979). IEEE reliability test system. IEEE Transactions on Power Apparatus and Systems, 6(6), 2047–2054. [Google Scholar]
43. Orosz, T. (2019). Evolution and modern approaches of the power transformer cost optimization methods. Periodica Polytechnica Electrical Engineering and Computer Science, 63(1), 37–50. [Google Scholar]
44. Jing, Z., Zeng, L. (2011). Analysis on urgency degrees of distribution network reconstruction scheme based on advanced AHP. Automation of Electric Power Systems, 35(4), 92–95. [Google Scholar]
45. Wang, M., Tan, F., Zhang, L., Cai, C. (2010). Power grid investment risk evaluation model based on ser-pair analysis theory in power market. Proceedings of the CSEE, 30(19), 91–99. [Google Scholar]
46. Sałabun, W., Wątróbski, J., Shekhovtsov, A. (2020). Are mcda methods benchmarkable? a comparative study of topsis, vikor, copras, and promethee II methods. Symmetry, 12(9), 1549. [Google Scholar]
47. Kizielewicz, B., Wątróbski, J., Sałabun, W. (2020). Identification of relevant criteria set in the MCDA process—Wind farm location case study. Energies, 13(24), 1–40. [Google Scholar]
48. Aytekin, A. (2021). Comparative analysis of the normalization techniques in the context of MCDM problems. Decision Making: Applications in Management and Engineering, 4(2), 1–25. [Google Scholar]
49. Zhang, Q., Xie, Q., Wang, G. (2018). A novel three-way decision model with decision-theoretic rough sets using utility theory. Knowledge-Based Systems, 159(1), 321–335. [Google Scholar]
50. Jiang, C., Guo, D., Duan, Y. (2022). Measure effectiveness of change-based three-way decision using utility theory. Cognitive Computation, 14, 1009–1018. [Google Scholar]
51. Bian, S., Cai, Z. (2005). Consistency of the prospect theory and the expected utility theory. China Economic Quarterly, 5(1), 265. [Google Scholar]
52. Chung, H. K., Glimcher, P., Tymula, A. (2019). An experimental comparison of risky and riskless choice—Limitations of prospect theory and expected utility theory. American Economic Journal: Microeconomics, 11(3), 34–67. [Google Scholar]
53. Behzadian, M., Otaghsara, S. K., Yazdani, M., Ignatius, J. (2012). A state-of the-art survey of TOPSIS applications. Expert Systems with Applications, 39(17), 13051–13069. [Google Scholar]
54. Çelikbilek, Y., Tüysüz, F. (2020). An in-depth review of theory of the TOPSIS method: An experimental analysis. Journal of Management Analytics, 7(2), 281–300. [Google Scholar]
55. Couto, P. R. G., Damasceno, J. C., Oliveira, S. P. (2013). Monte Carlo simulations applied to uncertainty in measurement. Theory and Applications of Monte Carlo Simulations, 2, 27–51. [Google Scholar]
56. Zhao, H., Guo, S. (2016). An optimized grey model for annual power load forecasting. Energy, 107(11), 272–286. [Google Scholar]
Appendix A
Taking the IEEE-RTS79 system as an example, the basic operation data is referred to [42], and the calculation process and results of each indicator are as follows:
(1) Quantitative index calculation
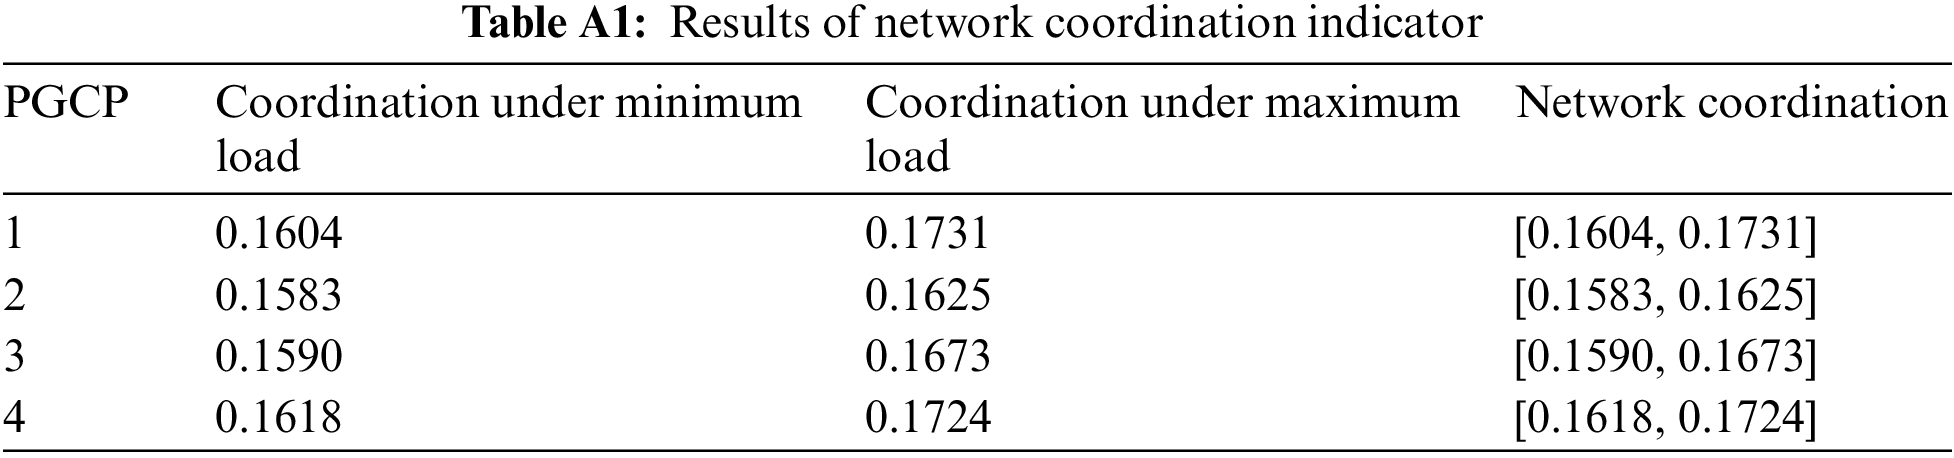
1) Network coordination
Reference [44] gave the calculation method of network coordination, mainly considering line coordination. The line coordination
where
Due to the uncertainty of load, the system power flow is uncertain. The maximum load and minimum load are used to calculate the system coordination, as shown in Table A1.
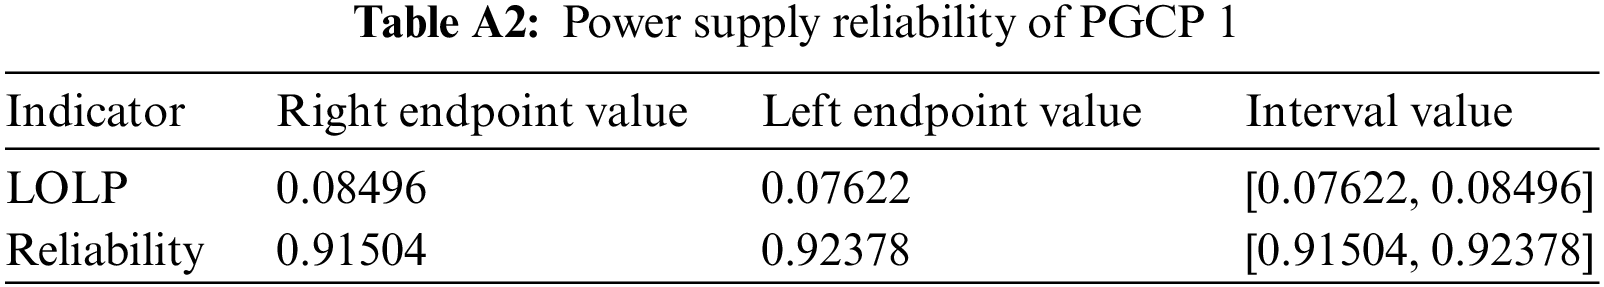
2) Power supply reliability
Load loss rates are used to calculate the power supply reliability index, as shown in Eq. (A2). Based on Monte Carlo simulation [55], the load loss rate of the system after constructing the project is calculated, then by subtracting the load loss rate from 1, it can determine the reliability of the power supply.
where
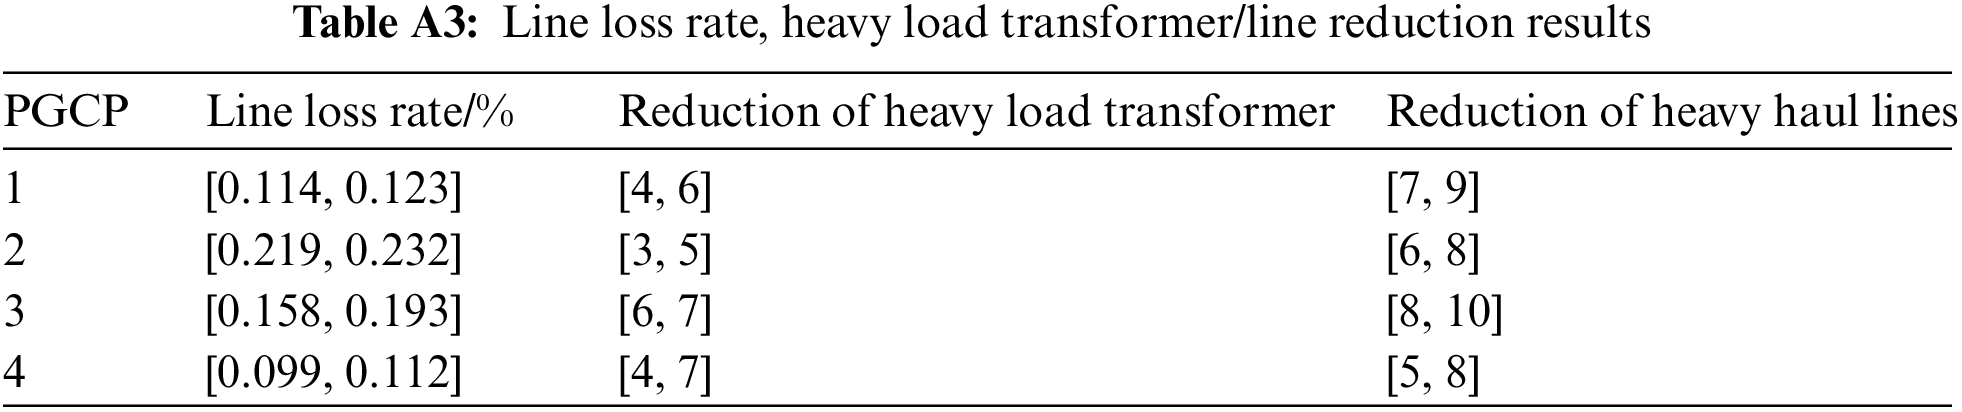
3) Reduction of line loss rate and number of heavy load transformers/lines
For the given system and current operation mode, calculate the power flow with/without each planning project, then the line loss rate of the system is obtained, and the reduction number of heavy load transformers and lines is gained, as shown in Table A3.
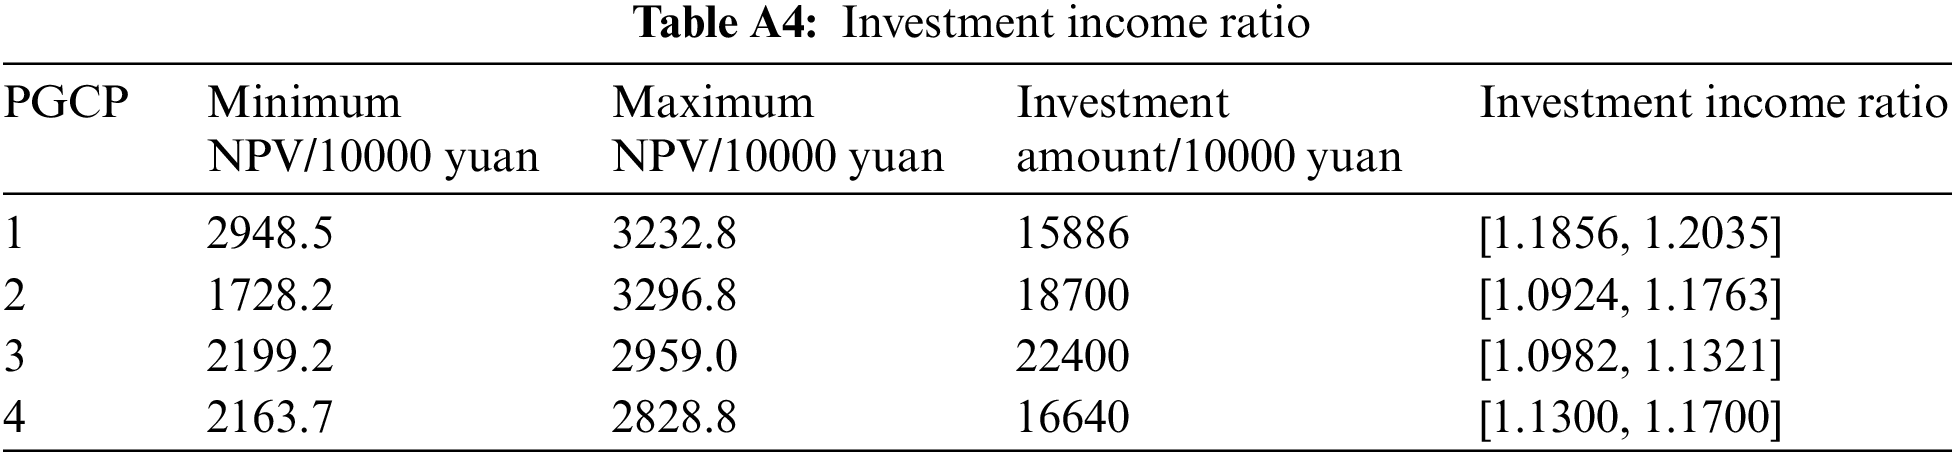
4) Investment income ratio
Reference [45] used the life-cycle method and uncertainty method to calculate the cost and benefit of each construction project. The total investment of the project
where
The projected income
where
Because of the uncertainty of the increased electricity sales, the project investment income is uncertain. In this paper, the interval number is used to represent the uncertainty of the increased electricity sales. Therefore, the project investment income ratio is also an interval indicator, as shown in Table A4.
5) Increased sales of electricity per unit grid investment
According to the economic development situation, the grey prediction model [56] is employed to forecast the electricity demand, and increased electricity sales can be obtained. Taking PGCP 1 as an example, the original load of bus 6 is 136 MW, and the new load is 136 MW. The total load of bus 6 is increased at a rate of 6% every year, reaching the load saturation in the 13th year. Assuming that the annual electricity utilization hours of the load is 4000 h, and taking 110% of the load forecast as the maximum increase in sales, it can be obtained that the minimum and maximum values of PGCP 1’s full life cycle electricity sales are 1879.44 and 2067.38 million kWh, respectively, so the increased sales of electricity per unit grid investment of PGCP 1 is [11.8, 13.0]. For the other three PGCPs, the increased sales of electricity per unit grid investment are [10.6, 11.7], [11.5, 12.6], and [11.2, 12.4], respectively.
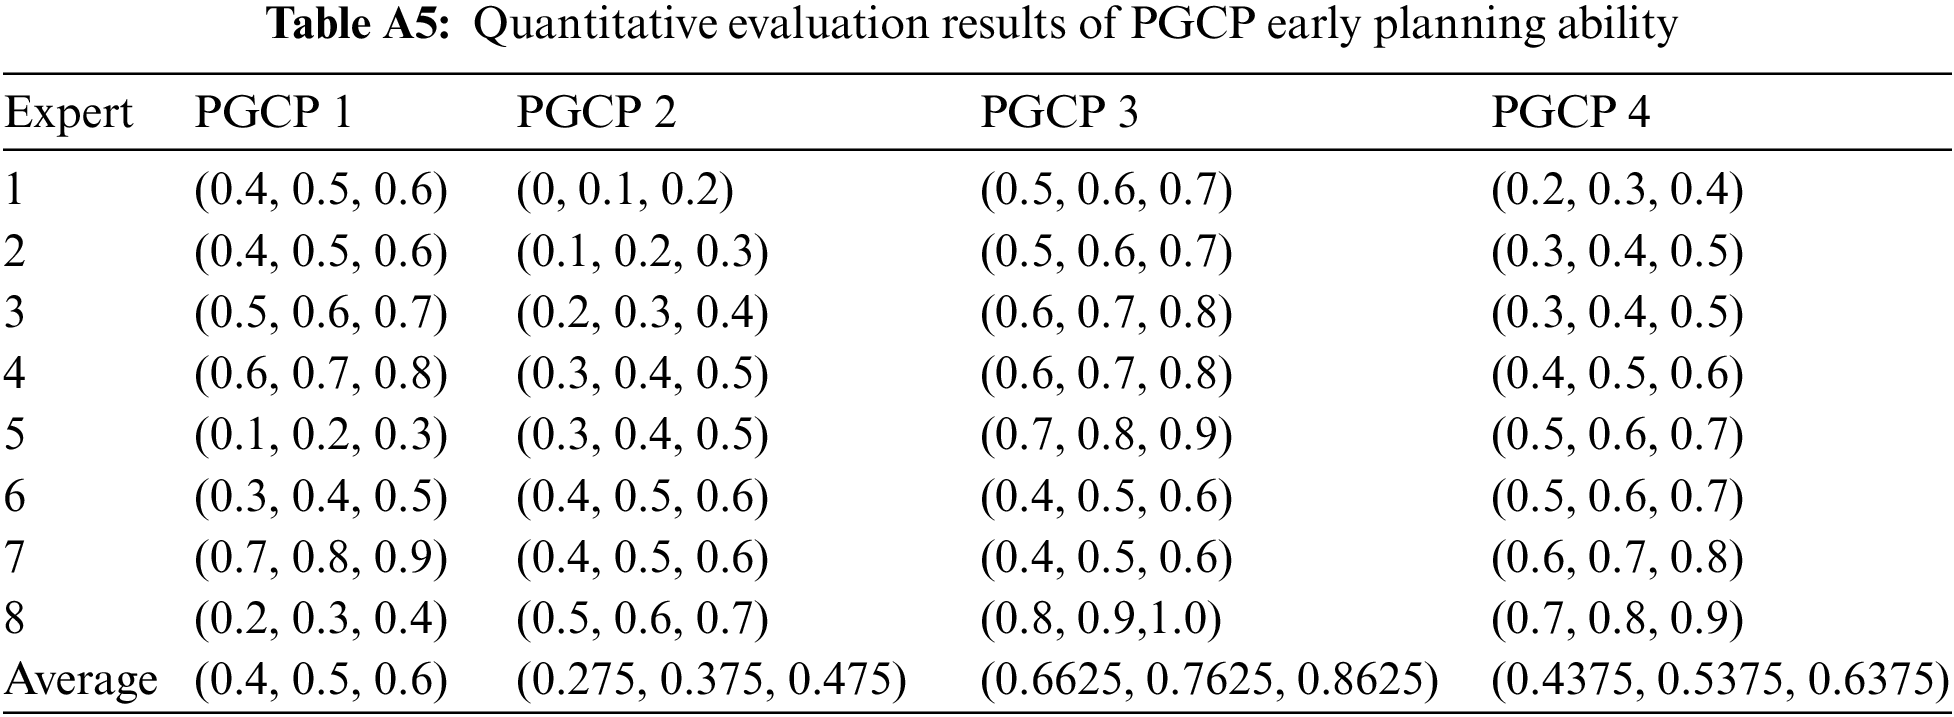
(2) Qualitative index calculation
The quantification of qualitative indicators is expressed by fuzzy triangle numbers, and the quantitative value of each indicator is calculated according to the expert evaluation results. Take the PGCP early planning ability as an example to illustrate, and the quantitative methods of other qualitative indicators are similar. 8 experts from power grid enterprises, construction units, and scientific research institutions are invited for evaluation, and the results are shown in Table A5.
Cite This Article
 Copyright © 2023 The Author(s). Published by Tech Science Press.
This work is licensed under a Creative Commons Attribution 4.0 International License , which permits unrestricted use, distribution, and reproduction in any medium, provided the original work is properly cited.
 Downloads
 Citation Tools