
 Submit a Paper
 Propose a Special lssue
 Open Access
ARTICLE

Modeling and Optimization of Solar Collector Design for the Improvement of Solar-Air Source Heat Pump Building Heating System
1 School of Energy and Environental Engineering, University of Science and Technology Beijing, Beijing, 100083, China
2 MOE Key Laboratory of Enhanced Heat Transfer and Energy Conservation, Beijing Key Laboratory of Heat Transfer and Energy Conversion, Beijing, 100123, China
* Corresponding Author: Junxiao Feng. Email:
(This article belongs to the Special Issue: Advanced Heat Pump Technologies for Renewable Energy Utilization)
Energy Engineering 2023, 120(12), 2783-2802. https://doi.org/10.32604/ee.2023.029358
Received 14 February 2023; Accepted 13 March 2023; Issue published 29 November 2023
 View Full Text
 Download PDF
Abstract
To enhance system stability, solar collectors have been integrated with air-source heat pumps. This integration facilitates the concurrent utilization of solar and air as energy sources for the system, leading to an improvement in the system's heat generation coefficient, overall efficiency, and stability. In this study, we focus on a residential building located in Lhasa as the target for heating purposes. Initially, we simulate and analyze a solar-air source heat pump combined heating system. Subsequently, while ensuring the system meets user requirements, we examine the influence of solar collector installation angles and collector area on the performance of the solar-air source heat pump dual heating system. Through this analysis, we determine the optimal installation angle and collector area to optimize system performance.Keywords
Nomenclature
| Heating performance coefficient of the system | |
| Effective heat collection (kWh) | |
| Air source heat pump (kWh) | |
| Power consumption of air source heat pump during operation (kWh) | |
| Total energy used by the pump while it was running (kWh) | |
| Collector collecting efficiency (%) | |
| Effective heat collection of collector (W) | |
| Gross collector area (m2) | |
| Lighting plane irradiation intensity in the area (W/m2) | |
| Total solar radiation absorbed by solar collectors per unit area (W/m2) | |
| Heat loss of collector (W) | |
| Overall coefficient of heat transfer [W/(m2·°C)] | |
| The average temperature of the heat absorbing plate (°C) | |
| Ambient temperature (°C) | |
| The product of transmittance and absorptivity of collector | |
| Total heating capacity of heat pump (W) | |
| Heat pump power (W) | |
| Heat loss at top of tank (W) | |
| Heat loss at tank edge (W) | |
| Heat loss at the bottom of the tank (W) | |
| Top surface area of tank (m2) | |
| Water tank side surface area (m2) | |
| Bottom surface area of tank (m2) | |
| Heat transfer coefficient at the top of tank [W/m2·°C] | |
| Heat transfer coefficient of tank edge [W/m2·°C] | |
| Heat transfer coefficient at the bottom of water tank [W/m2·°C] | |
| Water tank top ambient temperature (°C) | |
| Water tank edge ambient temperature (°C) | |
| Water tank bottom ambient temperature (°C) |
The strategic allocation of energy across nations is constantly changing, and clean energy development and use are given top priority. Among these, solar air source heat pump systems have garnered a lot of interest, prompting researchers domestically and abroad to conduct extensive research to explore the application scenarios of the system and how to further it. Deng [1] proposed a heating system combining solar energy and air source heat pump with electrical auxiliary heating equipment, and analyzed the impact of electricity price policy on the operating cost. Zhou et al. [2] retrofitted the solar heat pump system to include automatic control devices, thus reducing system energy consumption, but there are problems such as unresponsiveness. Yang [3] conducted a simulation on solar and air-sourced heat pump heating in the Jinan region. He [4] proposed the combined operation of trench collection and air-sourced heat pump units to cater for the everyday heating needs of plateau inhabitants. Guo et al. [5] conducted experimental experiments on a solar and air-sourced heat pump system with five distinct operating modes. The results indicate that the appliance is more eco-friendly and energy-effective than the conventional electricity-powered heating approach. Wu et al. [6] constructed a mathematical model of a solar coupled air source heat pump hot water unit, focusing on the evaporator model according to the characteristics of the unit operation. Kegel et al. [7] proposed heating strategies for three distinct varieties of detached dwellings of equal size on a region of Canada with frigid winters and mild summers and analyzed the types of heating systems suitable for different types of houses in the region by comparing them with conventional air-source heat pumps and ground-source heat pumps. Using TRNSYS, Sterling et al. [8] simulated the efficiency of a solar energy system with an accessory heat source. However, single-source heat pumps are less stable, and their system energy efficiency is not too high despite the presence of auxiliary heating devices. Panaras et al. [9] found that the heat pump start-up temperature significantly affects the system performance. The analysis shows that the specified value of the heat pump’s start-up temperature is a significant performance-influencing element. Tan et al. [10] carried out multi-objective optimization of solar-air source heat pump composite heating system based on fuzzy analytic hierarchy process, and adopted ASHS system for control and adjustment. Dong et al. [11] proposed an integrated solar air-source heat pump heating system with R407c as refrigerant, which is suitable for high-rise buildings with small installation space. Hu et al. [12] researched on hourly load forecasting of variable frequency solar-air source heat pump system based on LSTM, and through automatic control frequency conversion, the system efficiency is increased and the operating cost is reduced. Yu [13] optimized the strategy based on the inadequacy of the time-of-day operation determined by the law of daily solar radiation intensity change during the heating season, and proposed a temperature-controlled time-of-day operation strategy and a predicted dynamic operation strategy. Zhang [14] proposed a new type of solar energy and air source heat pump coupling system suitable for rural buildings, and clarified the form and operation principle of modular coupling system. Li [15] proposed a temperature and humidity independent control air conditioning system based on solution dehumidification and solar-geothermal composite energy.
In contrast to the above literature, in this paper, the Lhasa area is selected as the research object, and the analysis of the effect of solar collector installation angle and solar collector area on the performance of solar air source heat pump duplex heating system is mainly studied. The novelty of the method lies mainly in the following aspects:
(1) This paper selects Lhasa, a special geographical location, as the research object, and selects a solar and air-sourced heat pump duplex heating system with auxiliary warmth device for simulated research in view of the climate characteristics such as abundant solar energy.
(2) In this paper, we use TRNSYS to conduct simulations and mainly study the effect of solar collector installation angle and solar collector area on the performance of solar-air source heat pump duplex heating system, and iterative optimization by GenOpt program, so as to come up with the best installation angle and size.
Firstly, the solar system was simulated using TRNSYS and designed; then, the heating method to meet the heating demand was proposed and the optimization objective function was designed by combining the system performance with the installation parameters; finally, the multi-objective optimization search was carried out using particle swarm optimization algorithm to obtain the best installation parameters. The experimental results show that the method can operate efficiently while maintaining stability, and at the same time is very environmentally friendly due to the full use of renewable energy.
2 Principle of Operation and Simulation Model of a Dual-Supply Solar-Air Source Heat Pump Heating System
2.1 The Operation of a Solar-Air Source Heat Pump Warmth System
The environmental meteorological parameters in Lhasa area are shown in Figs. 1 and 2. The subject of the study is a civilian dwelling in Lhasa, with an entire of four storeys, no subsurface structure portion, a height of 2.8 m, and a general area of 1,600 square meters. under the assumption that the Standards for Heat Design of Civil Buildings (GB 50176-2016) is satisfied (here referred to as GB 50176-2016), according to the Lhasa City belonging to the climate partition, the relevant design provisions in the standard JGJ 26-2018 were used to determine the heat conductivity factors of each exterior structure of the goal construction [16,17]. The heating period in the Lhasa region starts from November 15 of the first year to March 15 of the second year, a total of 120 days, during which the building is heated in a 24-h uninterrupted manner. The external climatic parameters are derived from annual averages. The internal devise parameters were based on the standard JGJ 26-2018, the indoor heating temperature was set at 18°C and 50% relative humidity was observed. The interior wind velocity is below 0.3 m/s. The infiltration airflow change rate is 0.5 times/h. The ventilation index is 30 m3/h per capita. Through load calculation, the building heat load is larger in January and February, throughout heating season, when outside climate is cooler. The goal construction has a maximal hourly heat demand of 66.8 kW. And a total heat burden of 75,720 kWh.
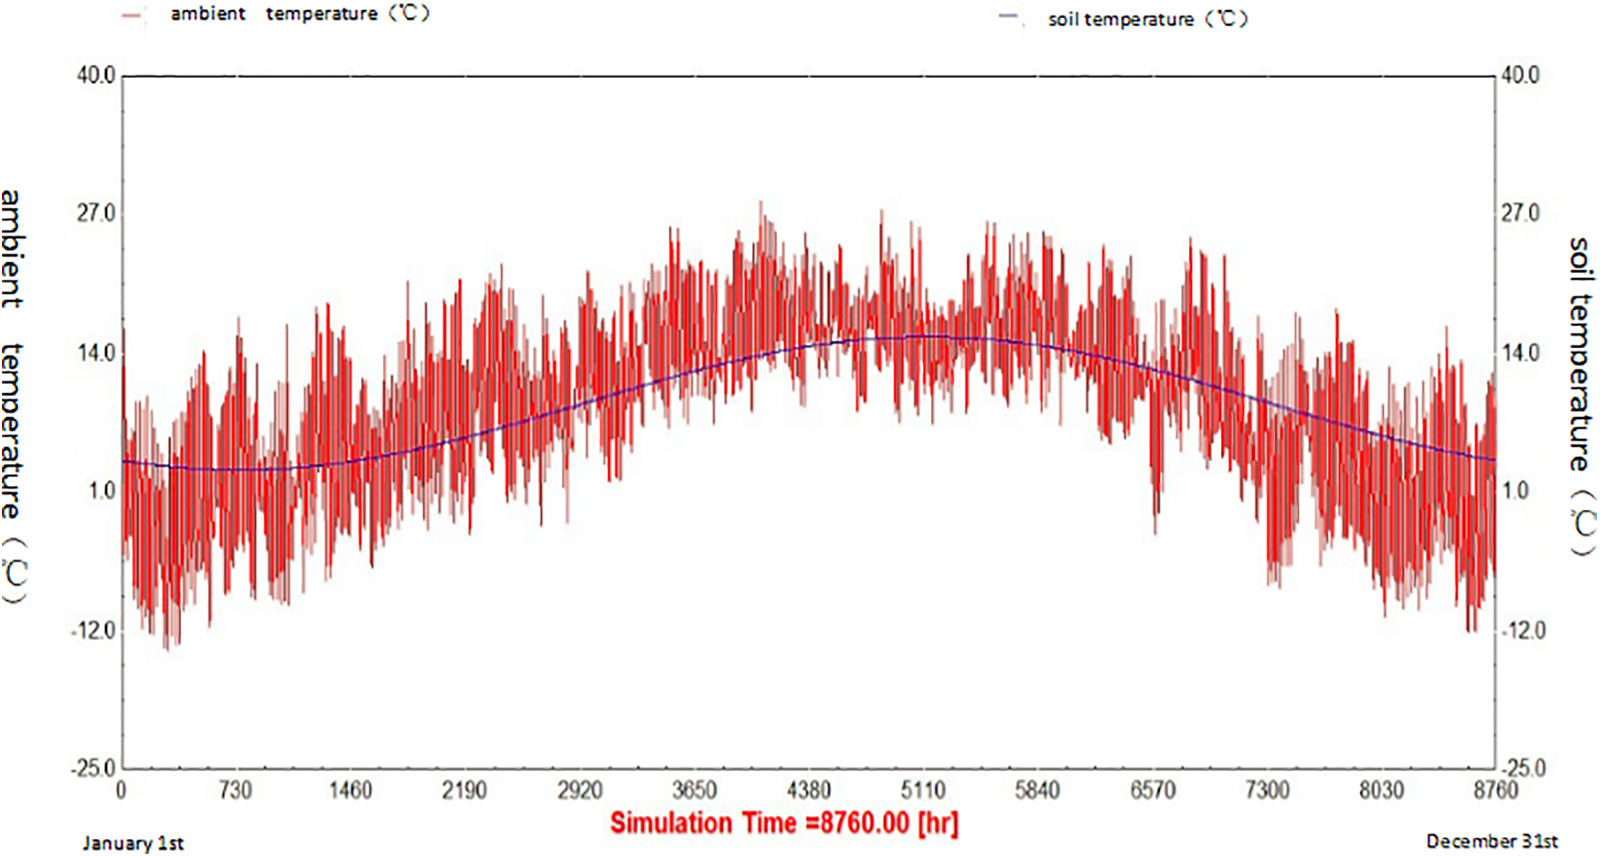
Figure 1: Hourly variation of outdoor dry bulb temperature in Lhasa
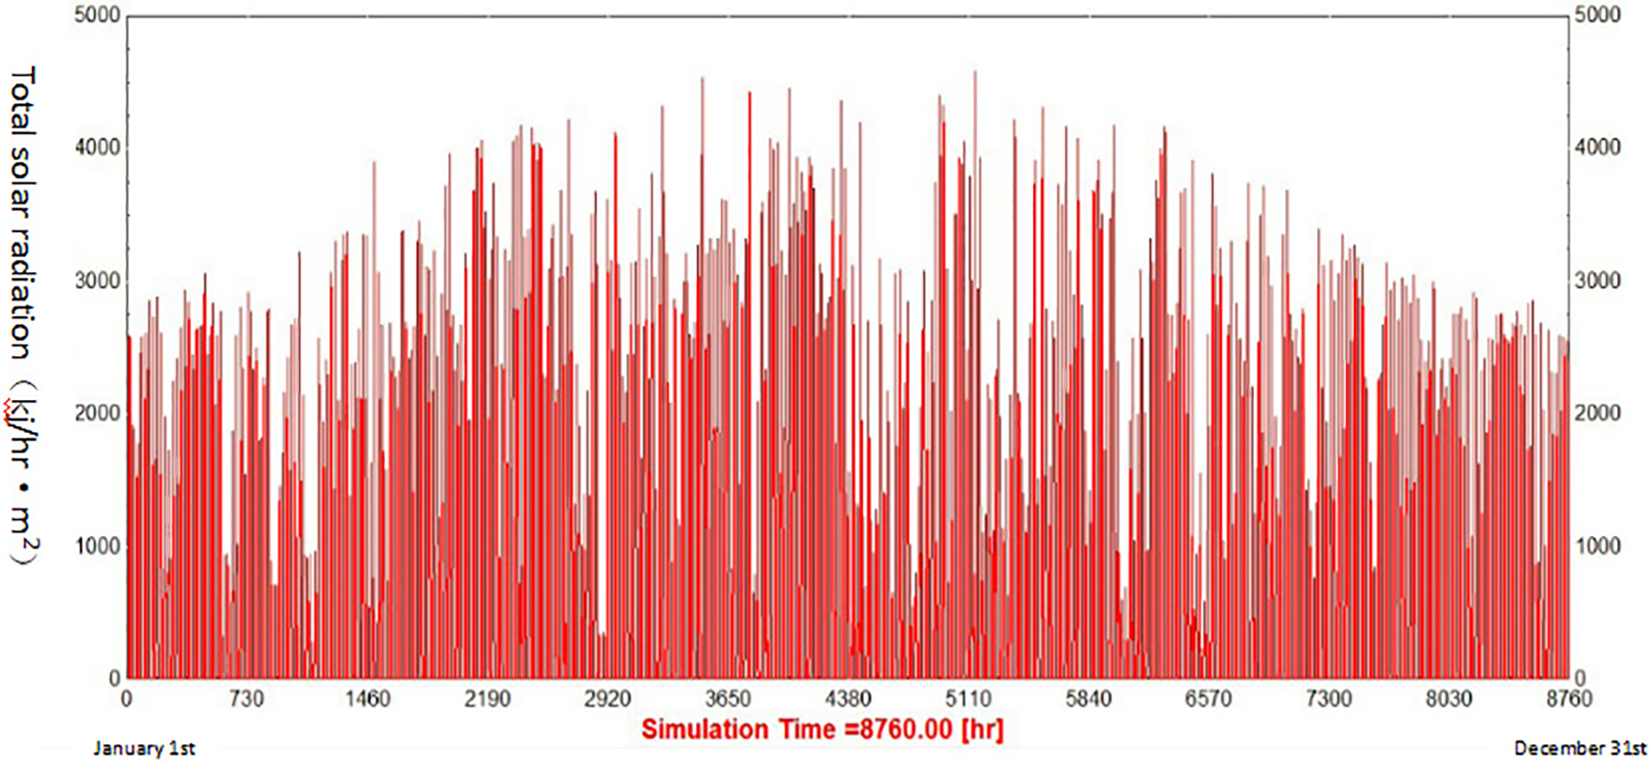
Figure 2: Hourly variation of solar radiation intensity in Lhasa
In order to satisfy the thermal needs of inhabitants of the cold highland region, and considering the shortage of traditional fossil energy reserves in the plateau area, geographical conditions, and environmental protection policies, this paper proposes the use of solar air source heat pump heating system (hereinafter referred to as “dual-supply heating system”) for heat supply. Solar collection, air-source warmth pump, heat retention tank, heating tank, warmth exchanger, water-circulation pump, and end heating apparatus are the primary ingredients the system. The system combines solar collections and air-sourced heat exchangers that operate in parallel through a heat accumulation reservoir, which compensate for its intermittent nature and inability to continuously serve as a system heat source, improving the reliability and applicability of system operation. Fig. 3 depicts a block illustration of the system. It should be noted that the heat production of the air source heat pump needs to meet the demand of the maximum heat load during the heating period of the building under the extreme condition of no solar energy at all, i.e.
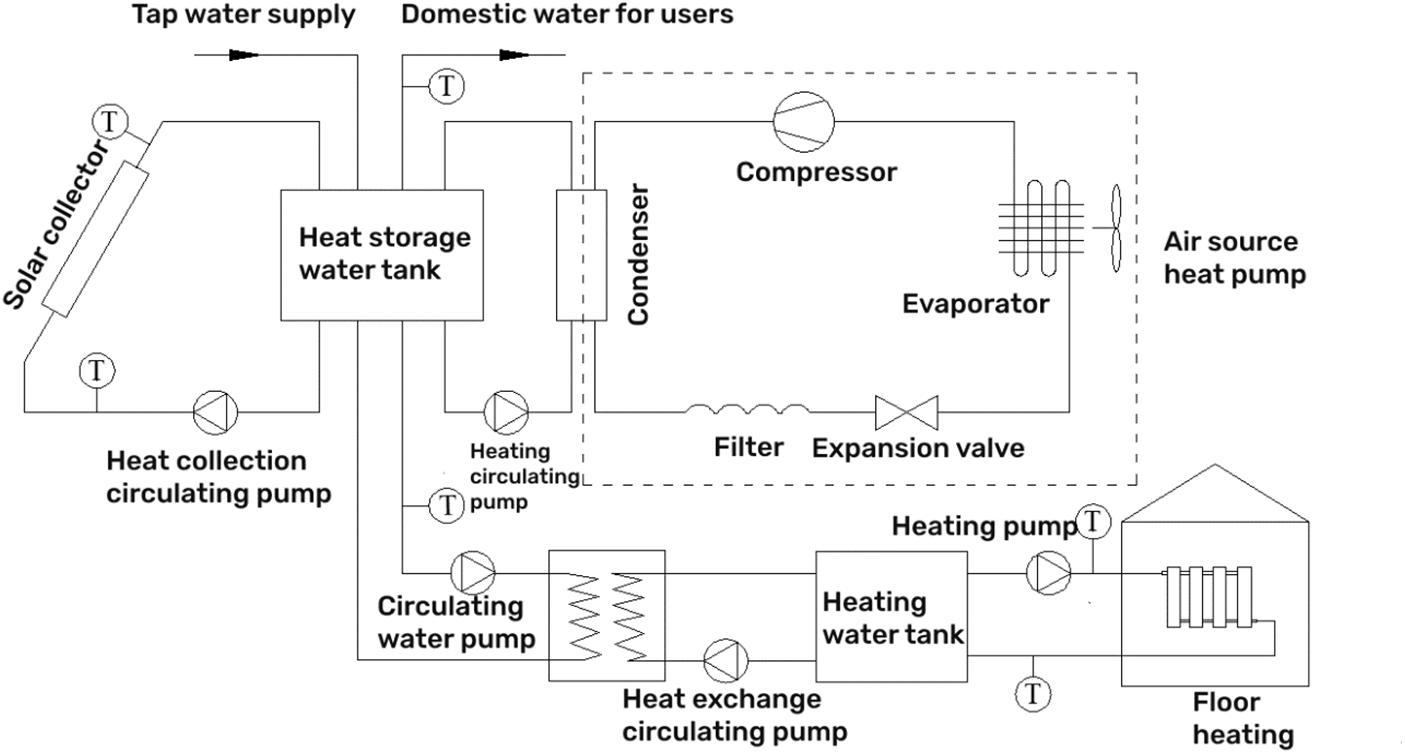
Figure 3: Block illustration of the system
The warming mode of the dual-supply heating system is divided into four types: ① When daytime solar energy levels are adequate, the air source heat pump is turned off, and the solar collection operates as a separate unit, heating the water on the heat accumulation reservoir to the predetermined temperature. The excess solar energy-generated heat continues to stay in heat accumulation reservoir through the practical warmth of water; ② When the intensity of solar irradiation is insufficient, it will not provide sufficient warmth to heat the water in the vessel by itself, it should simultaneously enable the air-sourced heat pump as an united thermal source to assure the system's stability; ③ When the solar irradiation intensity is even lower at night or in rainy weather, the solar collector stops running because it does not satisfy the requirements for beginning the solar collections circuit, at this time, if the temperature of the hot water in the storage tank meets the heating If the temperature of the hot water in the storage tank meets the heating conditions, the priority is given to using the tank's conserved heat to sustain system operation; ④ Under the circumstance of solar collection closure, if the temp of the hot water in the heat accumulation reservoir is less than the minimum water supply temperature, air source heat pump will work independently to supply heat.
2.2 Simulation Modeling of Heating System
This research paper will use TRNSYS for simulation, connect them according to the system operation process and input the relevant operation parameters according to the actual situation to build a simulation model, see the module table in Table 1, and analyze and study the system performance. Based on the block illustration of the system, the aforementioned modules link up sequentially, their appropriate settings are set based on the real system’s operation. Fig. 4 depicts the block illustration of the system.
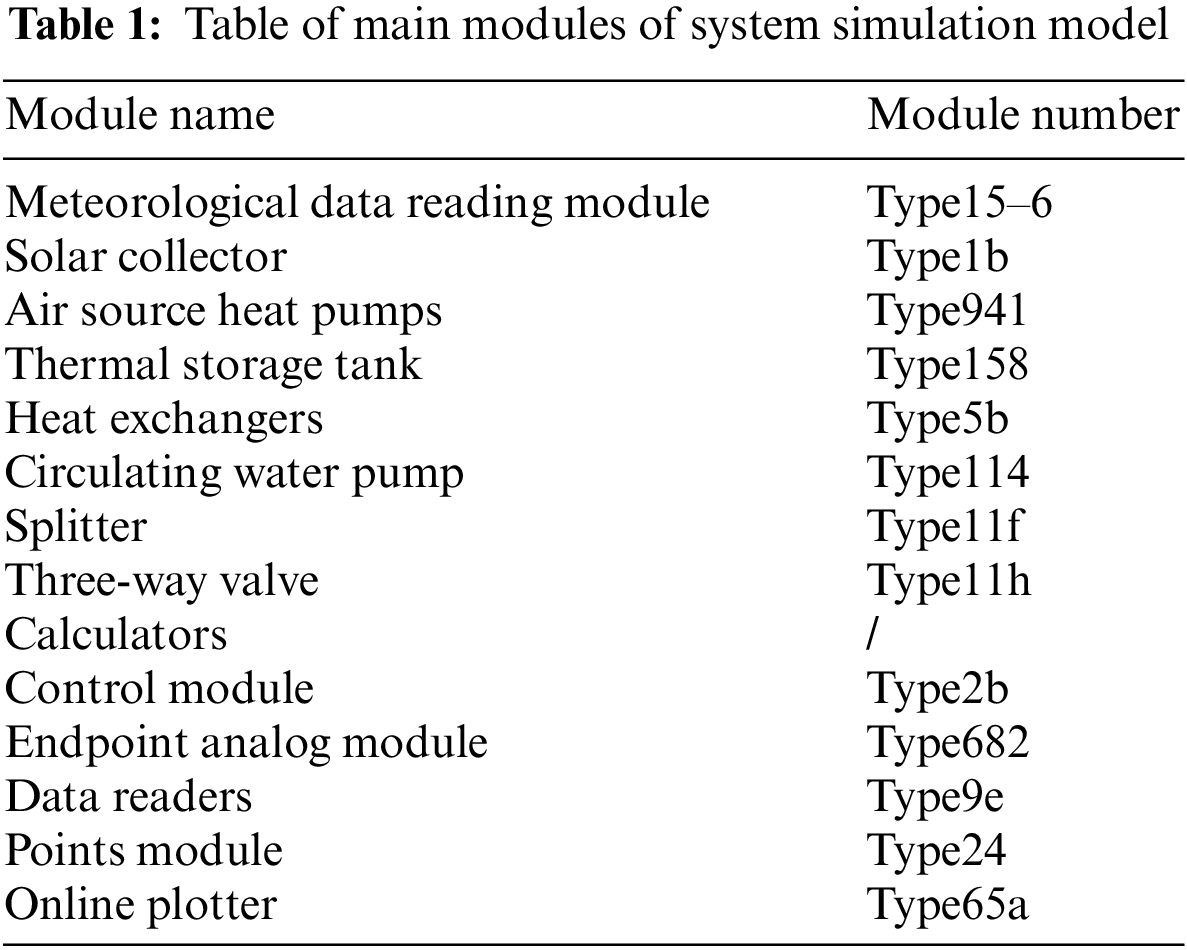
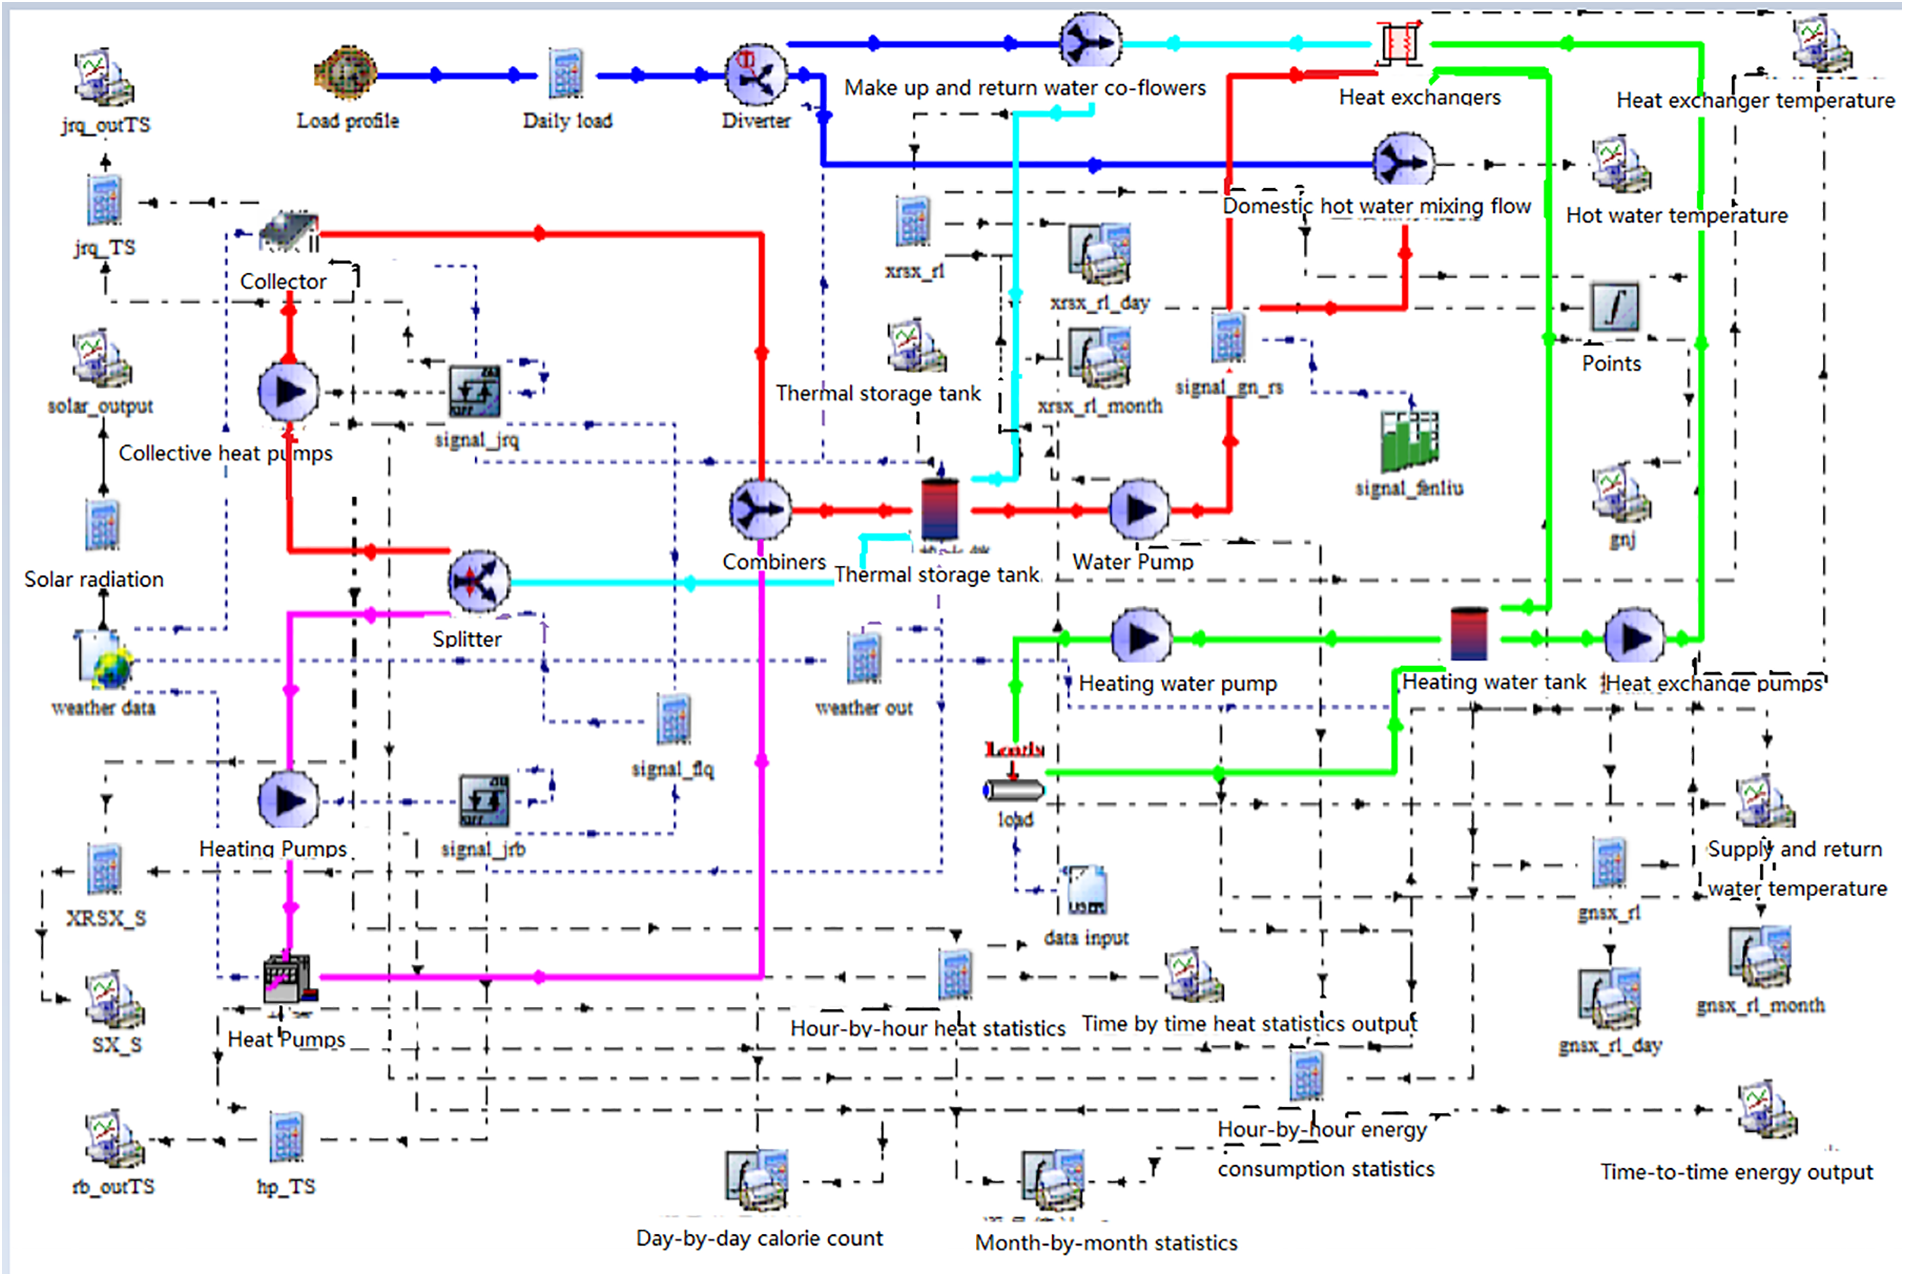
Figure 4: TRNSYS’ block illustration of the system
Type1b heat-collecting efficiency:
The calculation formula of heat collection efficiency
Type941 coefficient of performance
Type158 heat loss:
3.1 Hot Water Temperature for Heating
Fig. 5 depicts the temp fluctuations of the system’s heating supply and return water and residential hot water. The temperature of the residential hot water supply fluctuates slightly, however is generally steady at approximately 60°C, which corresponds to the intended value. The heating supply temp for construction is generally stable between 50°C and 55°C, and the temp variance between the supply and return water fluctuates between 5°C and 10°C. As a result of the building’s thermal retention capacity, the variation in temperature between supply and return water indicates a time lapse. The analysis shows that the design is reasonable and can meet the needs of users.
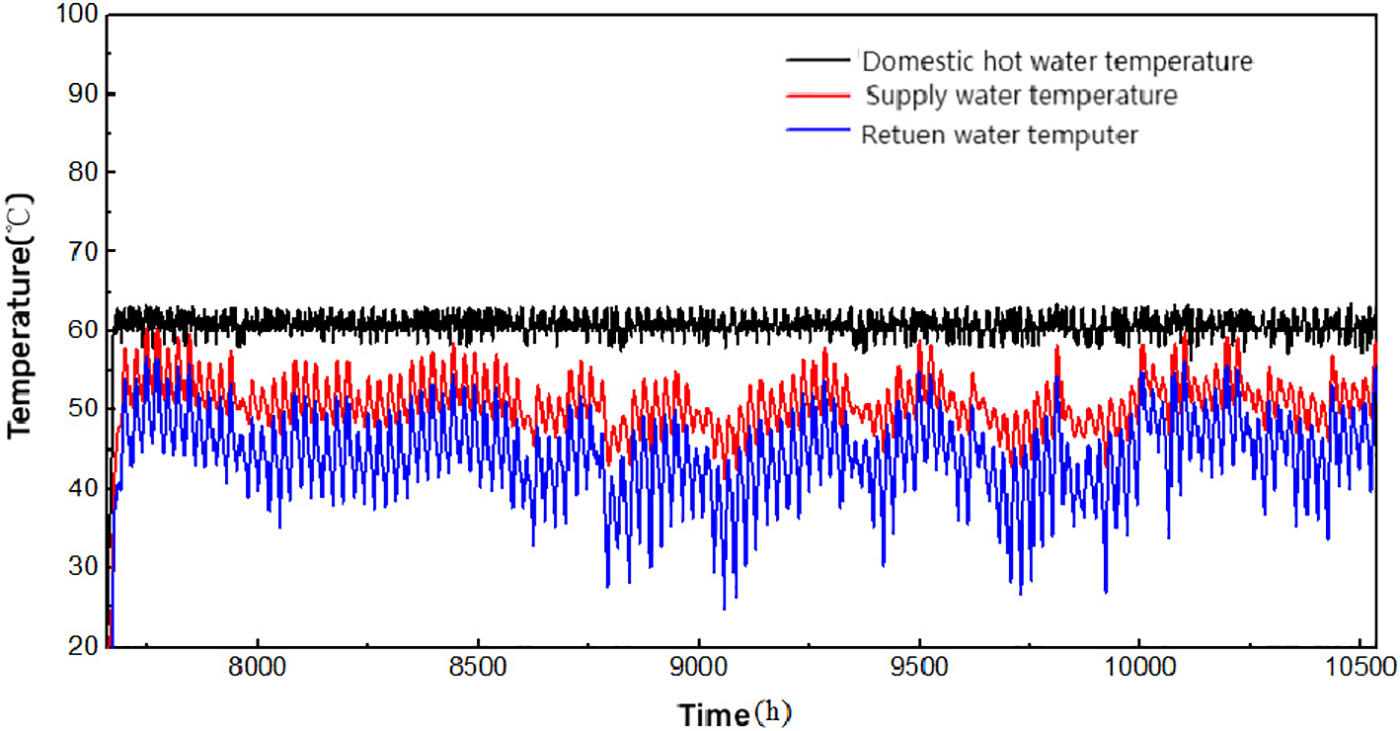
Figure 5: Temperature of system supply and return water and domestic hot water
3.2 Operation Mode and Time Share
Fig. 6 depicts the start-stop signals for the various heating modes of the system during operation in January, when 1 indicates on while 0 indicates off. There are four warming modes: solar collector alone (mode 1), air-sourced heat pump alone (mode 2), combined solar and air-sourced heat pump (mode 3), and storage tank alone (mode 4). On January 16, for example, Mode 1 runs from 11:00 to 18:00 for 7 h, during which time all the system heat comes from the solar radiation energy collected by the collectors. Mode 2 runs from 3:00 to 10:00 and 22:00 to 2:00, 11 h in all. Throughout this time, the sun’s radiation intensity is insufficient for warming the water to the collector cycle starting circumstance, and the warmth of the water in the reservoir is less than the supply’s temp, consequently the air source heat pump provides the entire system burden. Mode 3 runs from 10:00 to 11:00 for 1 h, when the amount of solar radiation is growing and there is a variation in temperature of more than 8°C between the water returning from the vessel and the hot water outlet from the solar collection. The solar collection begins to function, however it is insufficient to supply all the heat; therefore, an air-sourced heat pump is required for a coupled heat source to keep the system working. Mode 4 runs from 18:00 to 22:00 and 2:00 to 3:00 for 5 h, and the thermal storage tank fulfills the conditions for solo functioning. From the analysis of the results, it is easy to see that the air source heat pump is involved in the operation of the total length of 12 h, accounting for 50%.
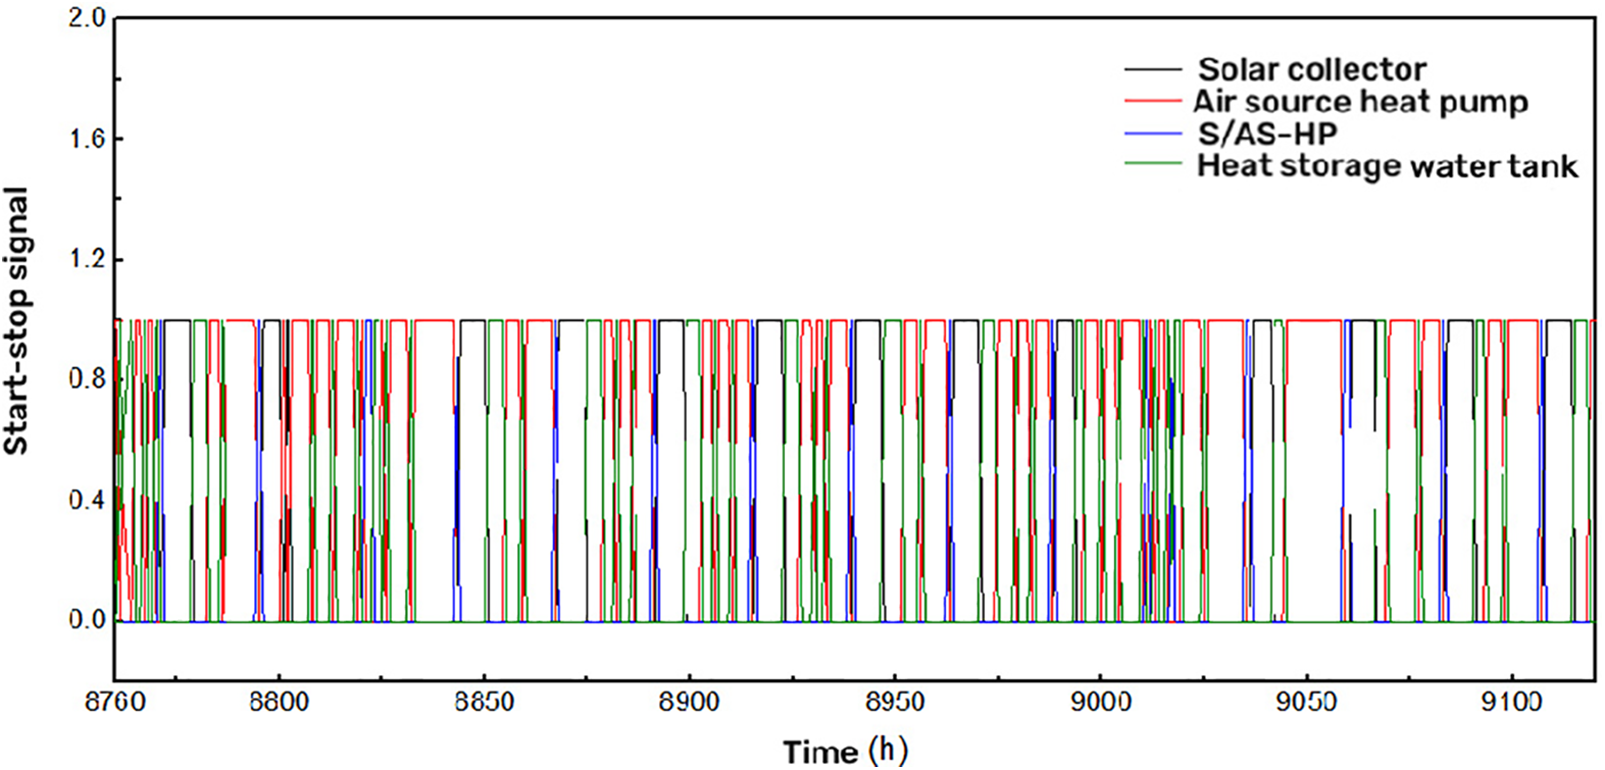
Figure 6: System hourly start and stop signals of different heating modes in Jan
Table 2 calculates the percentage of each mode of warmth based on its entire functioning duration during the warming period. The entire functioning duration for the solar collection is 776 h, or 26.9% of the entire warming stage. The entire duration of the first mode is 667 h, representing 23.16% of the total. The heating duration of the system in the second mode is 1229 h, or 42.68%. Fig. 7 is a bar graph illustrating the proportion of operating hours for different warming way across the months.
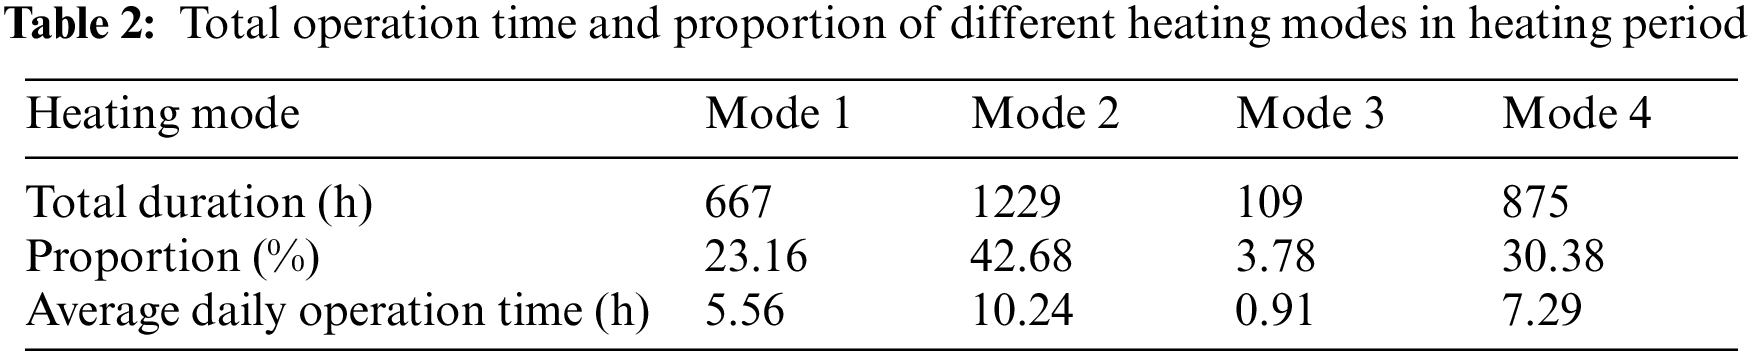
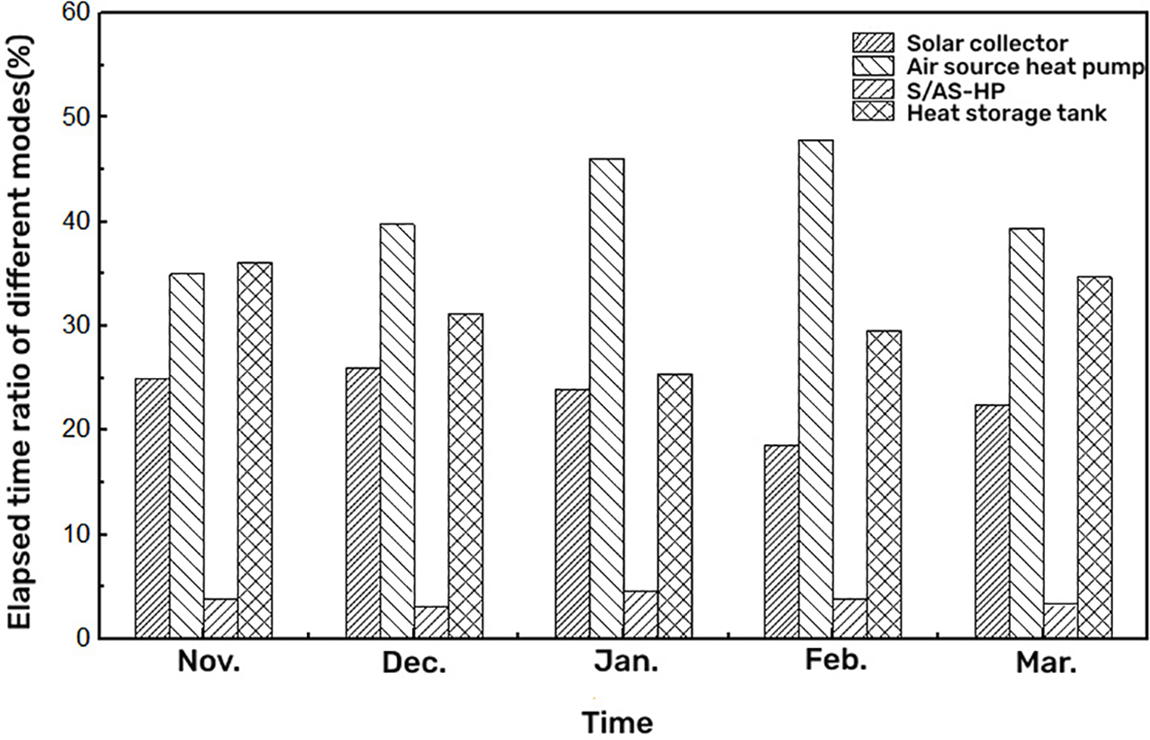
Figure 7: Proportion of operating hours of different heating modes in each month
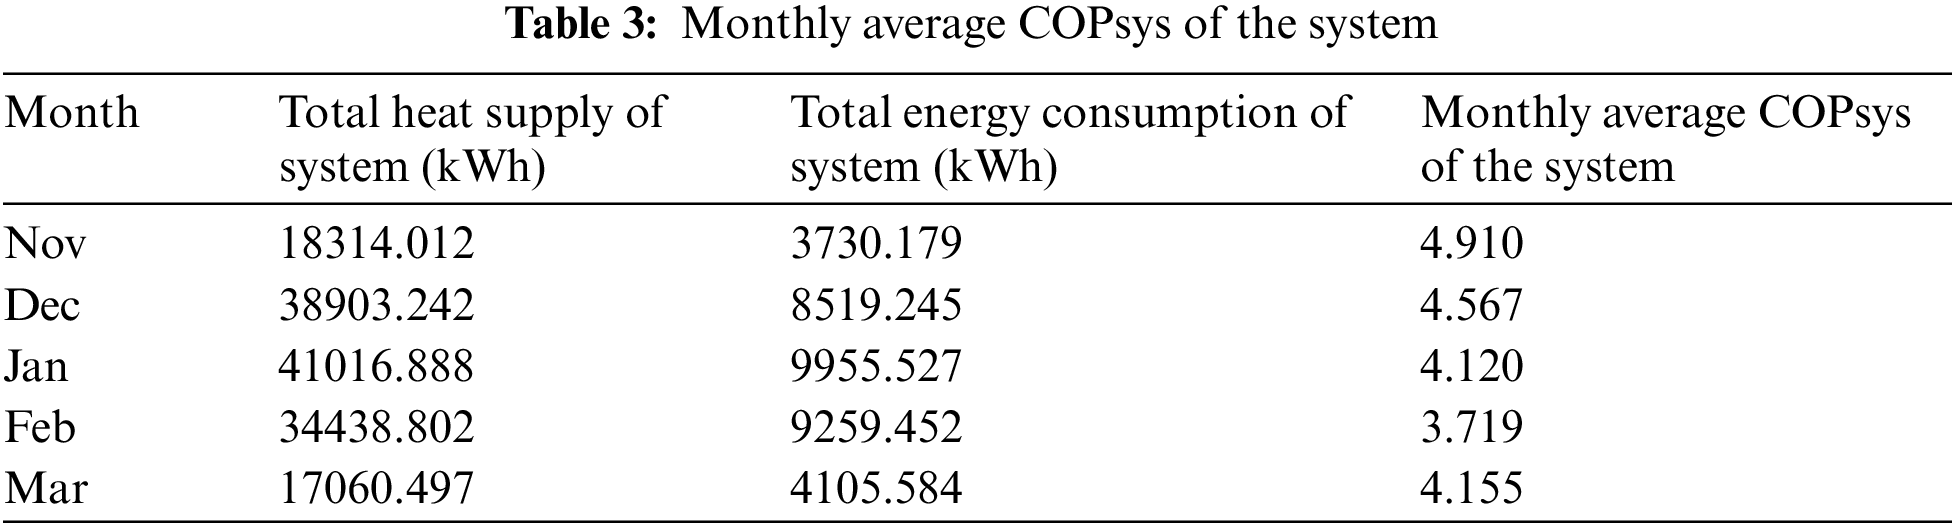
3.3 Comprehensive Energy Efficiency Ratio of Dual-Supply Heating System
In this paper, the entire efficiency of warming system is comprehensively evaluated by using the system heat production performance coefficient
In the formula:
The daily average heating performance coefficient
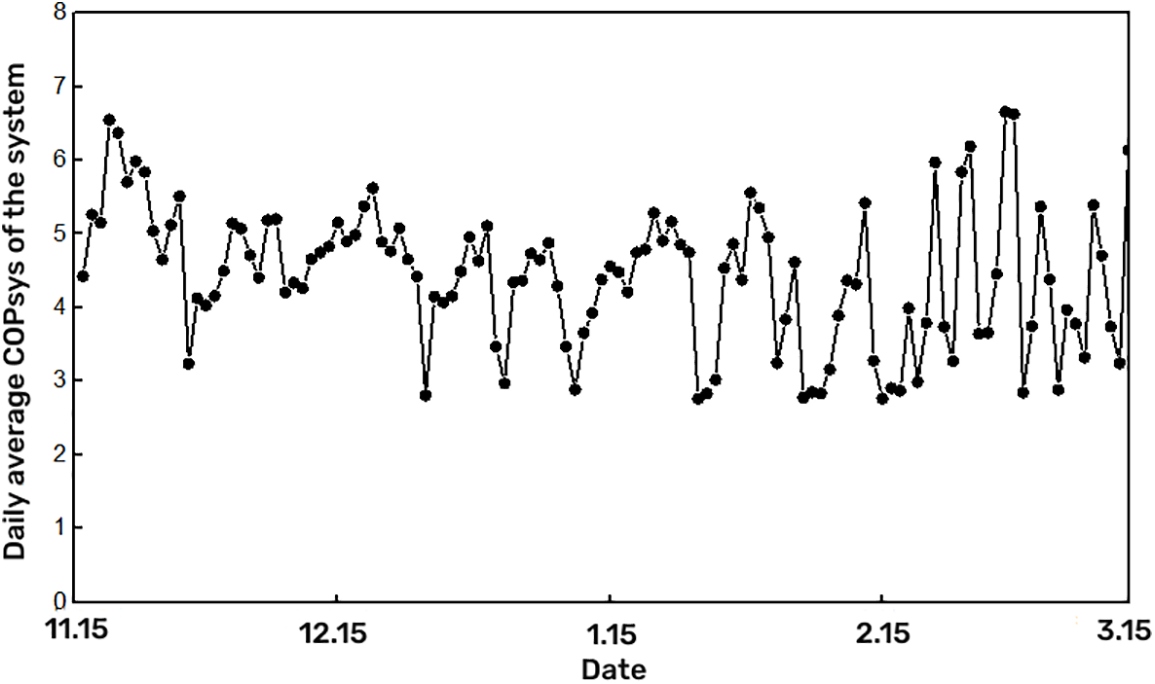
Figure 8: Daily average COPsys of the system
4 System Performance Impact Factor Analysis
The results of the simulation are not optimal, and a system performance impact analysis is performed in order to make the system meet the goals of both optimal performance and maximum economy.
4.1 Impact of Solar Collector Installation Inclination on System Performance
In actual projects, in order to maximize the intensity of solar irradiation received by solar collectors, the installation orientation is generally specified to be due south. Considering that changes in the installation inclination of solar collectors can also have an impact on their effective heat collection, according to the specification GB 50495-2019, when the installation orientation is due south, the installation inclination should be taken in accordance with the latitude of the project location +10°, but this method of taking values is more in consideration of the maximum solar radiation energy that can be received by the surface of solar collectors at noon, i.e. The sun’s incident light and collector surface are vertical, and not from the system operating cycle of the collector to receive the maximum amount of total solar radiation angle to consider taking values. Meanwhile, the tilt angle of solar collector installation is not only related to the azimuth angle and the geographical latitude of the area but also related to the distribution of solar resources and climate characteristics of the area. In order to maximize the total solar radiation obtained by the solar collectors during the system operation time, the installation inclination angle was set to 15°, 20°, 25°, and 30°, respectively, while keeping the installation orientation of the solar collectors unchanged during the simulation system operation. In order to maximize the total amount of solar radiation obtained during the system operation time, the installation inclination was set to 15°, 20°, 25°, 30°, 35°, 40°, 45°, 50°, 55°, 60°, 65°, 70°, 75°, respectively, to find the best angle.
The changes of monthly average collector efficiency and heating period average collector efficiency under different collector installation inclination angles are shown in Figs. 9a and 9b. From Fig. 9a, it can be seen that if the collector installation inclination is less than or equal to 50°, the average monthly collector efficiency first decreases and then increases, but when the installation inclination is greater than 50°, the average monthly collector efficiency decreases with the increase in the installation inclination, and the rate of reduction accelerates, so when the collector inclination is too large, the collector efficiency will be reduced, which is not conducive to system operation. As can be seen from Fig. 9b, with the increase of the collector installation inclination, the average collector efficiency gradually increases during the heating period, with a peak value of 43.55% when the installation inclination is 55°, and the collector efficiency starts to show a decreasing trend when the installation inclination is greater than 55°. The analysis of the results shows that there is an optimal value for the installation inclination angle of the collector, which is generally estimated in engineering directly based on experience, which can easily lead to the reduction of the collector efficiency. In order to make the collector in the best operating condition, it is necessary to conduct dynamic simulation to determine the optimal value according to the specific application scenario of the system.
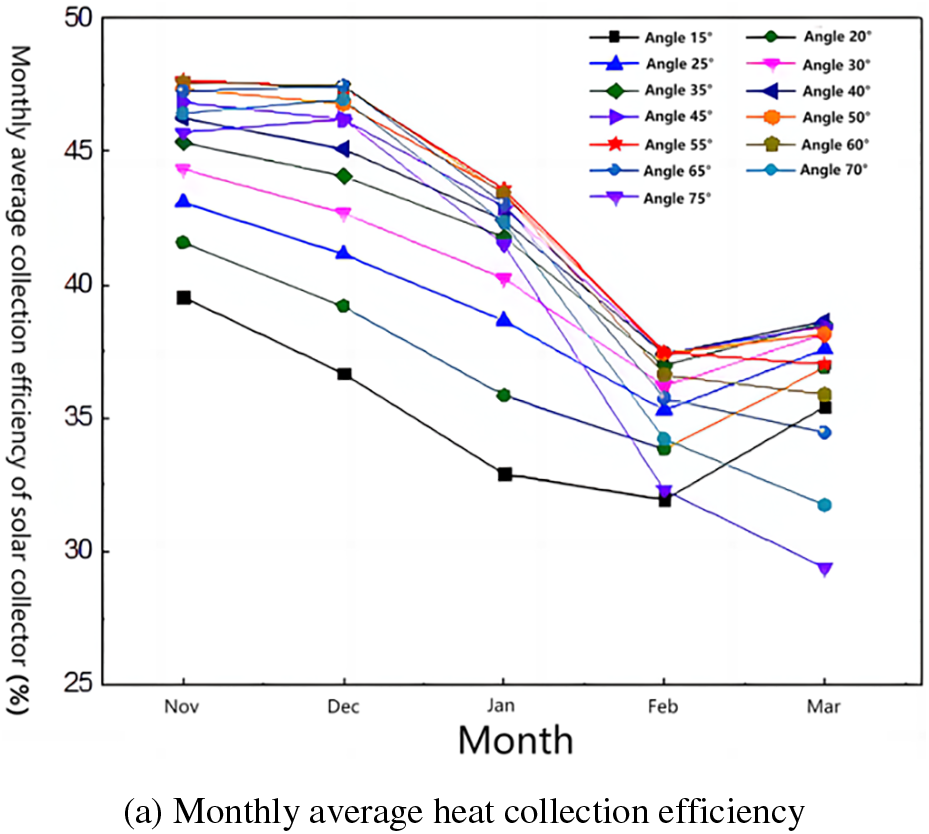
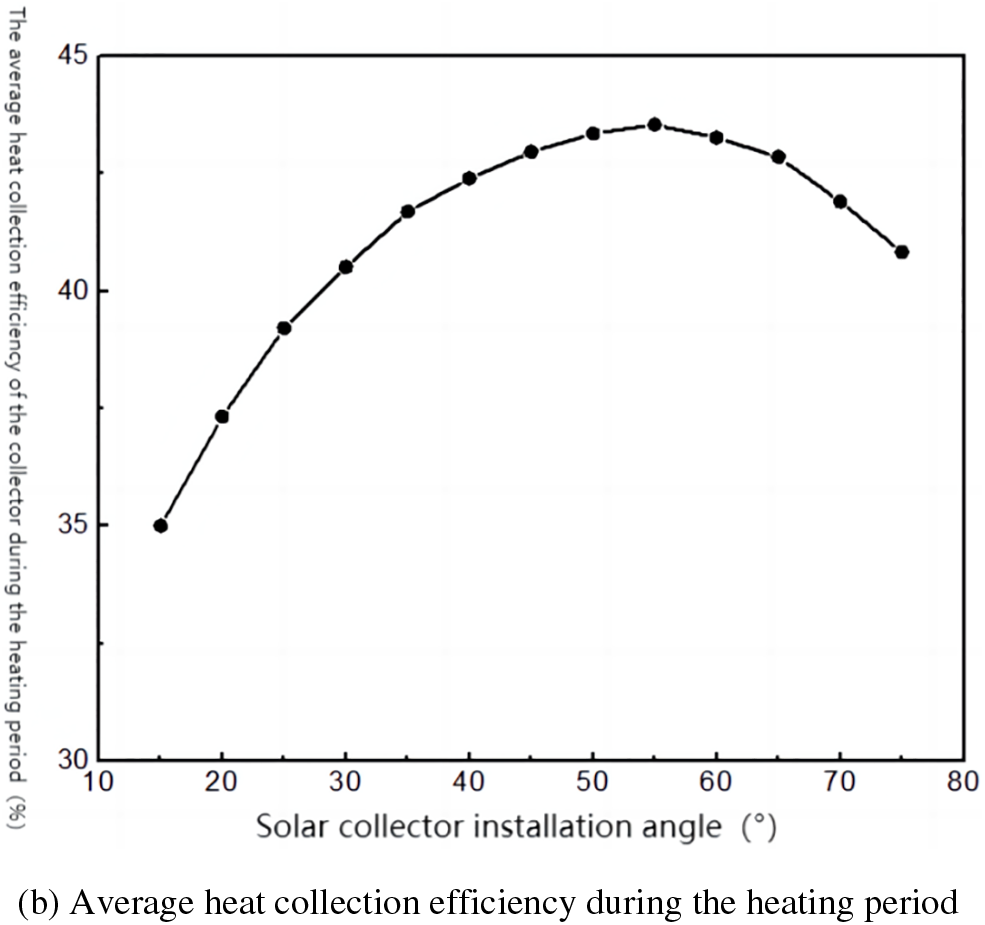
Figure 9: Variation of collector efficiency under different installation angles of solar collectors
Solar guarantee rate refers to: the percentage of heat supplied by solar energy to the total heat supply of the system in a solar thermal system, which is an important indicator to evaluate the degree of solar energy utilization in the system. Figs. 10a and 10b show the changes of the monthly average solar guarantee rate and the average solar guarantee rate during the heating period under different collector installation inclination angles, respectively. As can be seen in Fig. 10a, the trend of solar energy guarantee rate changes in each month under different installation inclination angles remains consistent, with the law of change decreasing first and then increasing. Angle will change with time, the best installation angle of collectors in different months will also be different, in the actual project in summer the best installation angle is generally equivalent to the local latitude, winter than summer to take a larger value, so when the installation angle increases, and Lhasa area latitude difference is expanding, in February~March solar guarantee rate growth rate is reduced.
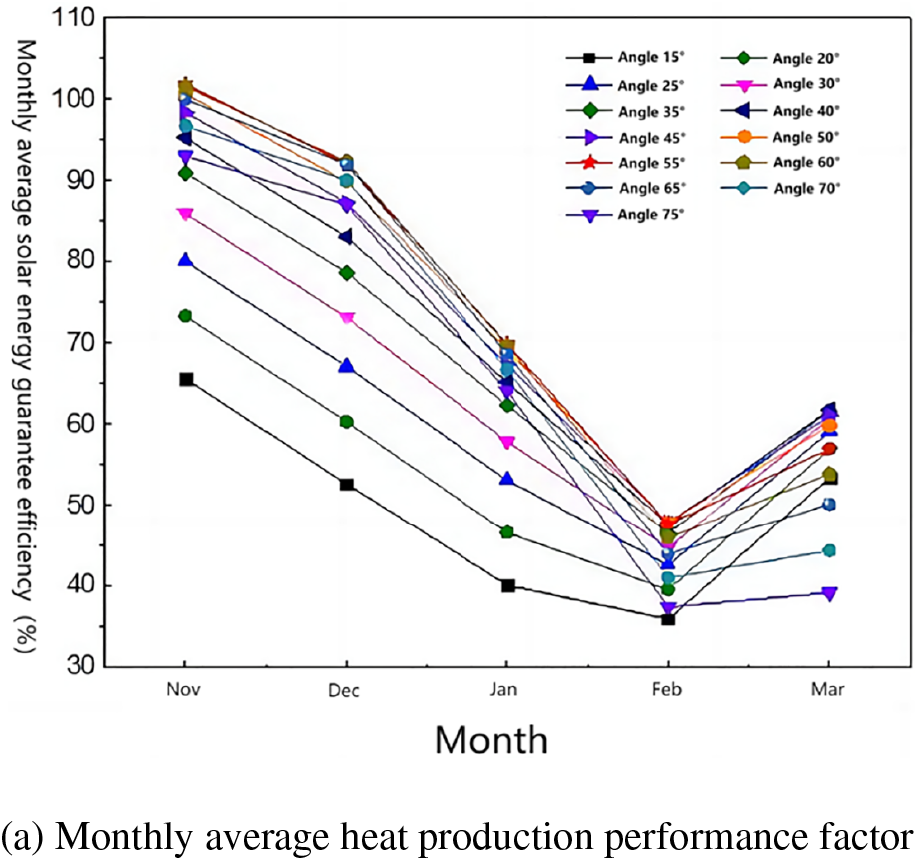
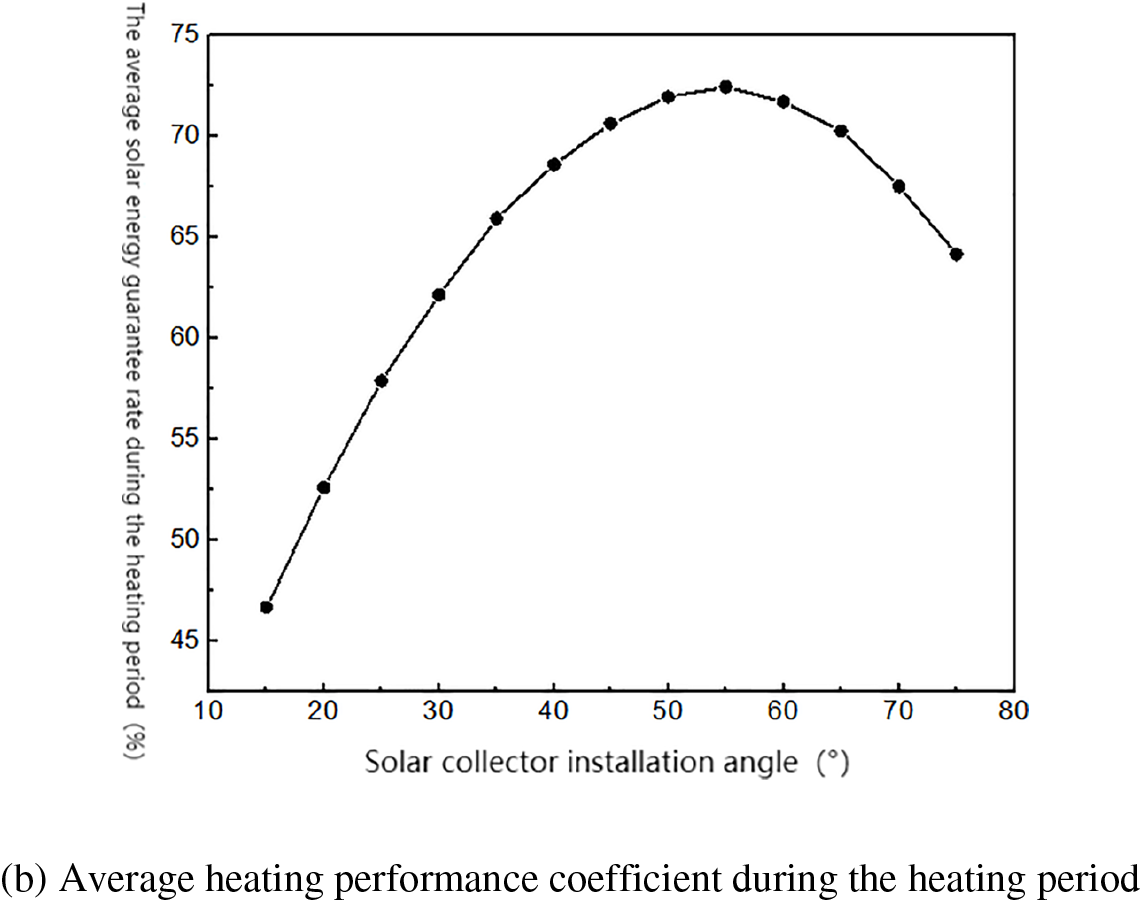
Figure 10: Variation chart of solar energy guarantee rate under different installation angles of solar collectors
In the early heating, due to the high outdoor ambient temperature, small system heat load, and large solar irradiation intensity, the solar guarantee rate can reach up to 100% during this period, i.e., solar collectors can meet the heat required for system operation by running independently; February is the month with the smallest solar guarantee rate during the heating period, and the overall rate is below 50%. Fig. 10b illustrates that the mean solar energy guarantee rate for the whole heating period shows a trend of increasing and then decreasing with the increase of the collector installation inclination, with the maximum value of 72.5%, when the collector installation inclination is 55°.
The effects of different solar collector installation inclinations on the monthly average heating performance coefficient
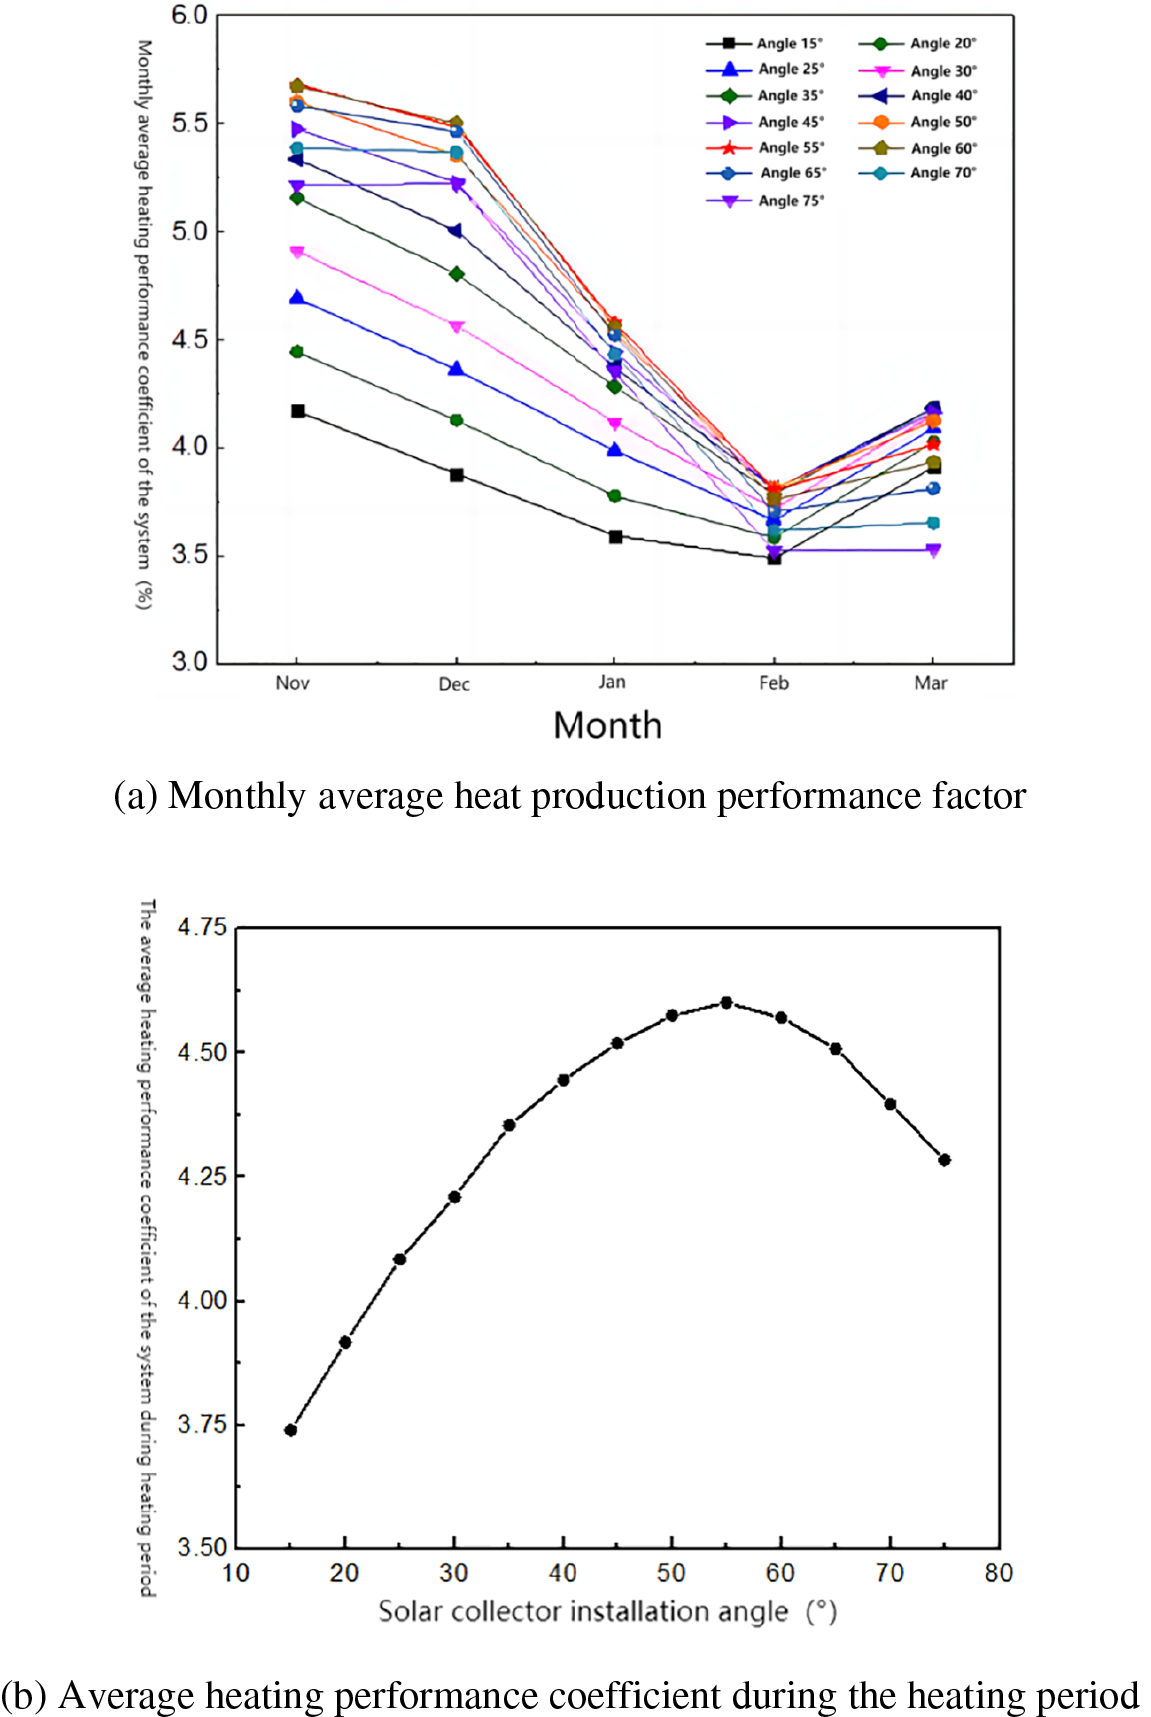
Figure 11: Variation diagram of heating coefficient of performance of the system under different installation angles of solar collectors
4.2 Effect of Solar Collector Area on System Performance
Under a certain system thermal load, the size of solar collector area is directly related to the system solar guarantee rate and also affects the size of the system initial investment, so here we focus on the effect of collector area on the overall system performance. In this paper, different solar collector areas are selected for simulation while keeping the rest of the system equipment design parameters unchanged: 112, 132, 152, 172, 192, 212, 232, and 252 m2, respectively.
Fig. 12 reflects the changes of effective collector heat and heat pump heat production during the heating period with the change of the solar collector area. When comparing the collector area of 252 and 121 m2, the effective collector heat increases by 38340. 61 kWh, and the heat pump heat production decreases by 34314.87 kWh. The heat loss of the system makes it impossible for the two to be exactly equal.
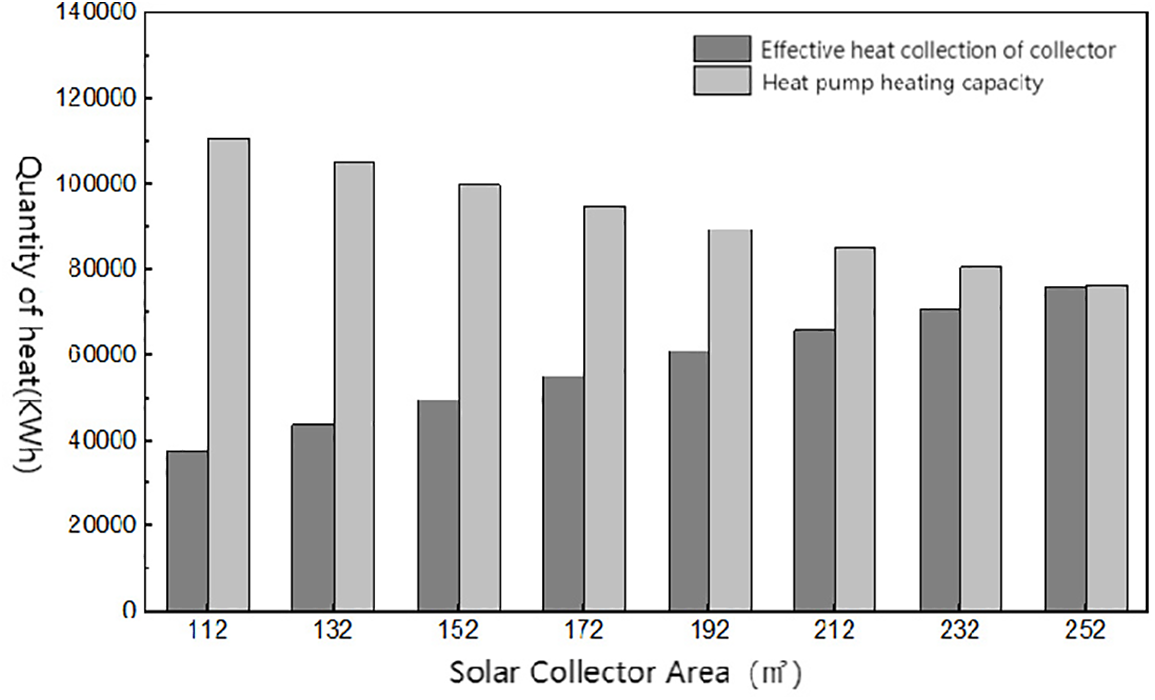
Figure 12: Effective heat collection of solar collector and heating capacity of heat pump in heating period under different solar collector area
Fig. 13 gives the percentage of running hours of each operation mode under different solar collector areas. As can be seen from the figure, with the increase of the collector area, the proportion of hours of heating using the storage tank increases continuously, the proportion of hours of independent operation of the heat pump decreases significantly, and the proportion of hours of heating using the storage tank increases by 15.59% when the area is 252 m2 compared with 112, and the proportion of hours of independent operation of the heat pump decreases by 14.1%, which indicates that the increase of the collector area makes the effective collector heat to provide the required heat for system operation. After the heat is provided, there is a large surplus of collector heat, and all of it is transferred to the water in the storage tank for storage so that if the solar energy is not enough, the tank storage will work first. The hours of independent operation of the solar collectors do not show significant changes, which is because the start and stop of the solar collectors are mainly influenced by the solar irradiation intensity and sunlight hours on the light plane, and have less correlation with the collector area.
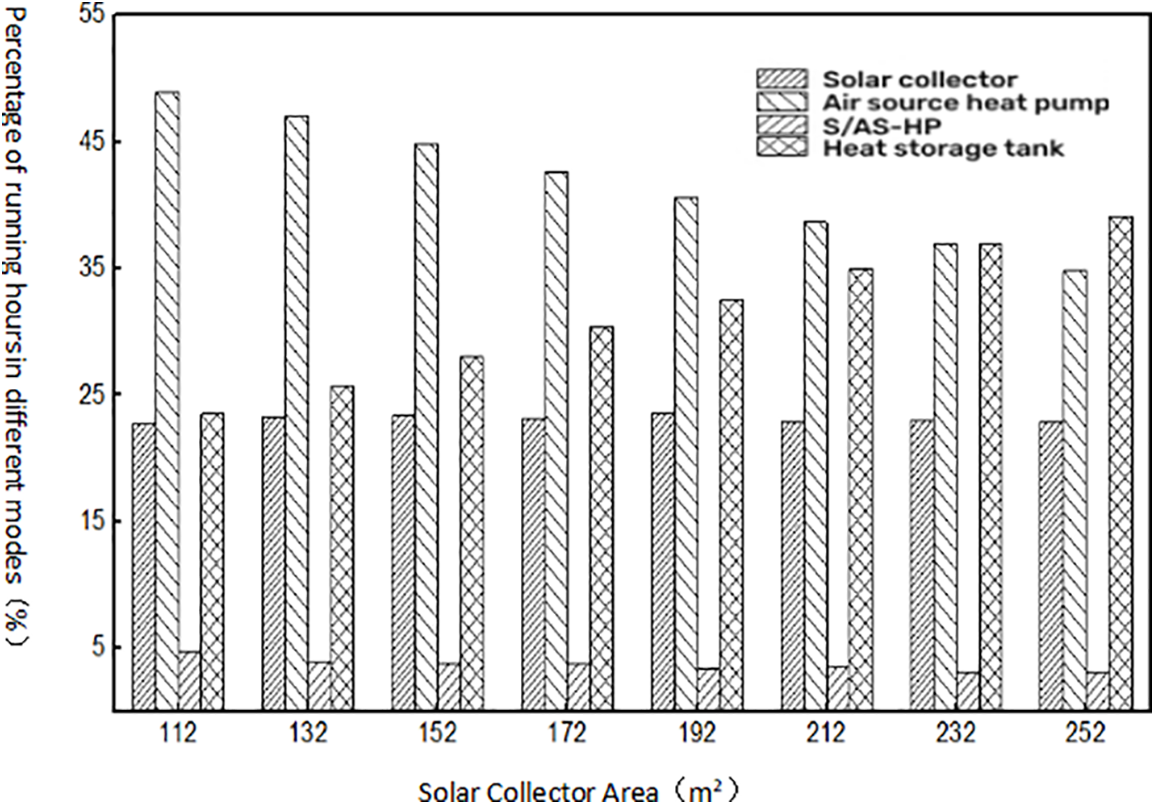
Figure 13: Proportion of operation time of each heating mode under different solar collector area
In the Fig. 14, the solar energy guarantee rate basically increases linearly with the increase of solar collector area, and the increase is large, when the collector area increases from 112 to 252 m2, the solar energy guarantee rate increases from 42.32% to 85.56 %, and the increase is 43.24%, which indicates that the collector area The increase of the collector area can obviously improve the effective heat collection of the collector, which makes its proportion in the total heat supply of the system increase.
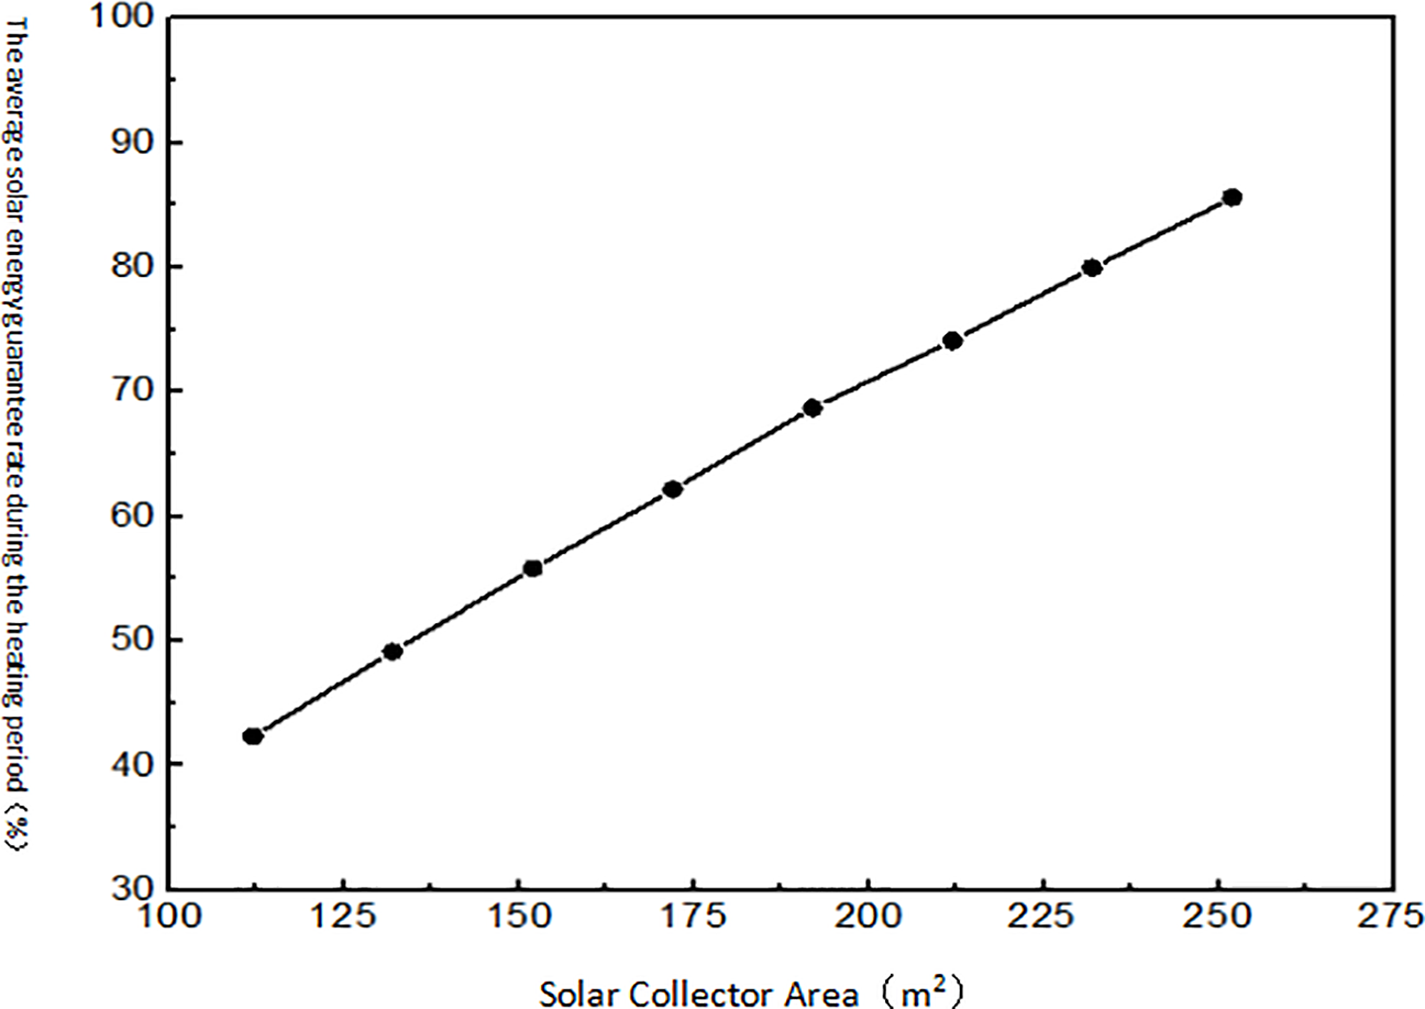
Figure 14: Average solar energy guarantee rate in heating period under different solar collector area
The variation curves of the monthly average system heating performance coefficient
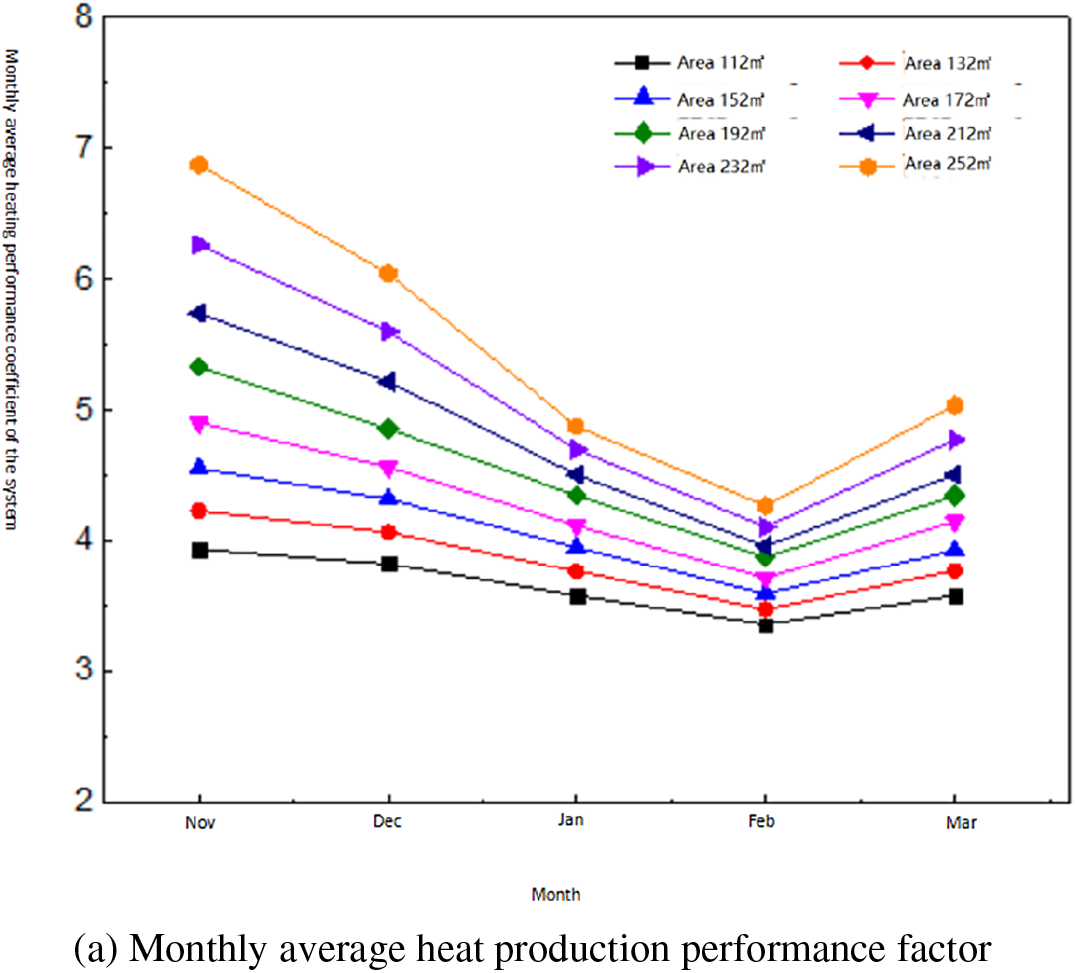
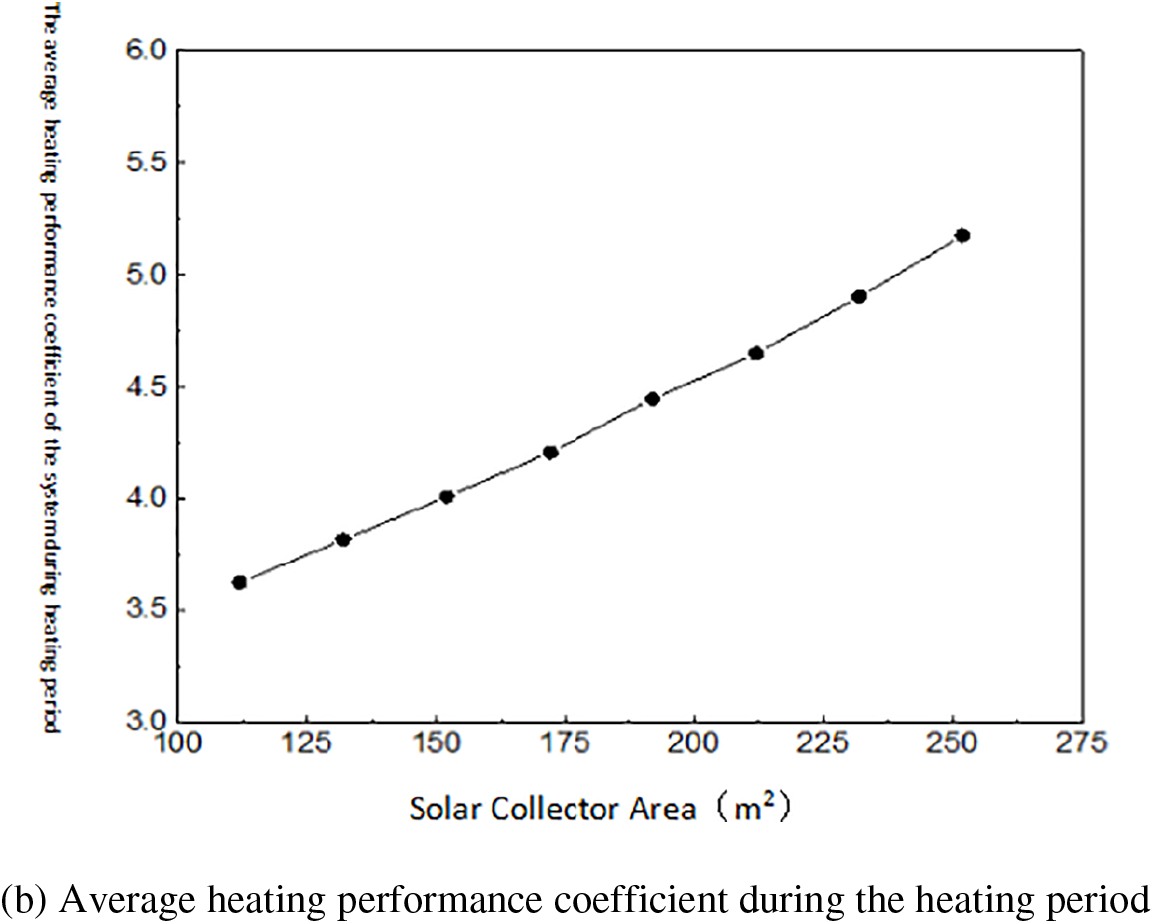
Figure 15: Heating performance coefficient of the system with different solar collector area
Through the TRNOPT module, the GenOpt program is called, the dck file output from the TRNSYS platform is read, and the design variables that need to be optimized are selected, including the area of the solar collector, the installation angle of the solar collector and the volume of the heat storage tank, and the design variables are assigned according to the set initial value, maximum value, minimum value and calculation step size. The annual cost calculation formula edited in the TRNSYS platform Equation is directly selected as the objective function by ‘Use Equation’, and the parameters of the selected optimization algorithm are set. The GenOpt program is run to startthe iterative calculation. When the calculation results meet the convergence requirements, the program will automatically end the operation and output the final optimization results. The target parameters gradually stabilized after 60 calculations. After 138 iterations, the optimization results reached the convergence condition and the calculation ended. After 600 iterations, the particle is basically in a stable state, and the fluctuation curve of each variable is basically a straight line. The results are shown in Table 4. In this paper, particle swarm optimization algorithm and Hooke-Jeeves algorithm are used to optimize.
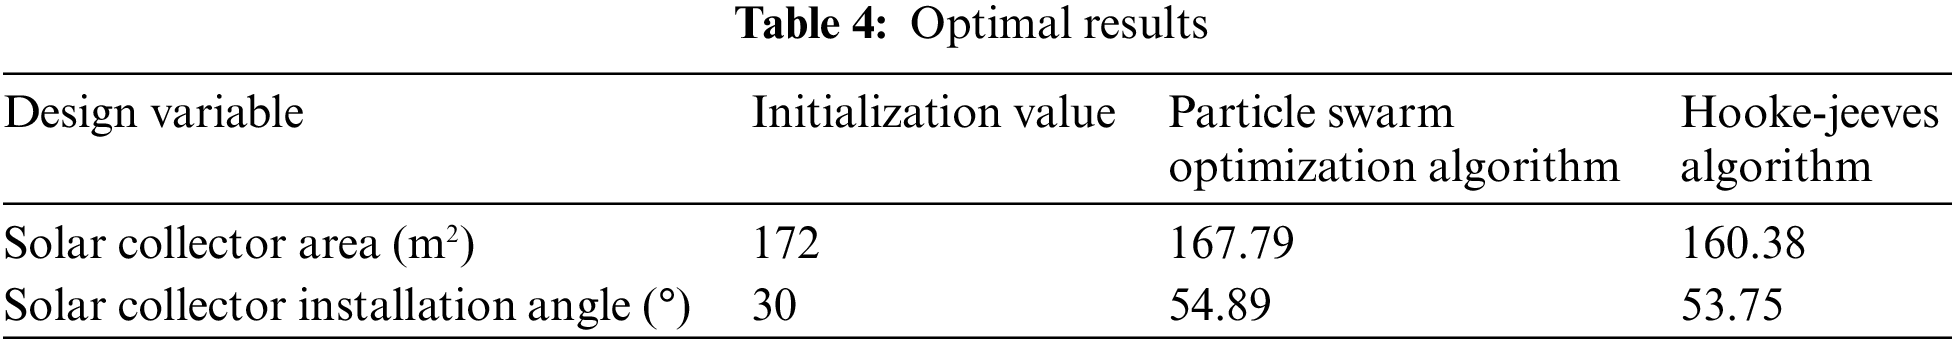
The optimization results of each design variable and objective function after GenOpt optimization are compared with the initial values as shown in Table 4. It can be seen that the relative error of the optimization results of the objective function of the two algorithms is 0.15 %, which is very small. It shows that the results obtained by the two algorithms in the system optimization of this paper are more reasonable. The optimization results of the particle swarm optimization algorithm are more ideal. Therefore, combined with the engineering practice, the optimal design variables of the system are finally determined as follows: solar collector area 168 m2, solar collector installation angle 55°.
In this paper, the Lhasa region of Tibet is selected as a typical cold plateau area, and the solar-air source heat pump combined heating system is simulated and analyzed, and the main influencing factors of the system performance are analyzed.
(1) The fundamental concept of operation and mode of management of the solar-air source heat pump warming system is explained. In conjunction with the findings of the analysis of the changing law of the goal building’s thermal burden, the design calculation of the main equipment of the system solar collector and heat storage tank is carried out.
(2) The temperature of the residential hot water supply fluctuates slightly, however is generally steady at approximately 60°C, which corresponds to the intended value. The heating supply temp for construction is generally stable between 50°C and 55°C, and the temp variance between the supply and return water fluctuates between 5 and 10°C. As a result of the building’s thermal retention capacity, the variation in temperature between supply and return water indicates a time lapse. The analysis shows that the design is reasonable and can meet the needs of users. The entire functioning duration for the solar collection is 776 h, or 26.9% of the entire warming stage. The entire duration of the first mode is 667 h, representing 23.16% of the total. The heating duration of the system in the second mode is 1229 h, or 42.68%; The maximum value of the daily average
(3) Solar collector installation angle has a significant impact on system performance. The average collector efficiency, solar guarantee rate, and
(4) Solar collectors have an impact on system performance and need to be considered comprehensively. The effective collector heat, average solar guarantee rate, and
Acknowledgement: None.
Funding Statement: The authors received no specific funding for this study.
Author Contributions: Each author has made significant contributions, and every aspect of the article is jointly completed by all authors.
Availability of Data and Materials: All data in the article can be obtained by sending an email to the author. At the same time, the vast majority of data has been clearly provided in the article.
Conflicts of Interest: The authors declare that they have no conflicts of interest to report regarding the present study.
References
1. Deng, P. J. (2017). Research on application of ASHP and solar energy combined heating system in new rural community in Northern China (Master Thesis). School of Energy and Power Engineering, Qingdao University of Science and Technology, China. [Google Scholar]
2. Zhou, X., Liu, G. Q., Yan, J. W. (2017). Optimal operation strategy of parallel-connection solar air-source he pump hot-water system. Journal of South China University of Technology, 45(10), 16–25. [Google Scholar]
3. Yang, Y. L. (2018). Operation strategy and evaluation of air source heat pump integrated with solar energy heating system (Master Thesis). College of Energy and Power Engineering, Shandong University, China. [Google Scholar]
4. He, X. (2018). Research of combining parabolic trough collectors and CO2 air-source heat pump heating system in Alpine region (Master Thesis). School of Mechanical and Engineering, Southwest Jiaotong University, China. [Google Scholar]
5. Guo, H. W., Wang, Y., Gao, W. X., Li, Z. Q. (2019). Performance evaluation of solar-air source heat pump hot water system in different climatic zones. Journal of Refrigeration, 40(4), 45–51+100. [Google Scholar]
6. Wu, B., Tian, Q., Dong, X., Gao, Y. J., Wang, Y. T. et al. (2019). Mathematical model construction and analysis of combined solar energy and air-source heat pump hot water unit system. Heating Ventilating and Air Conditioning, 49(11), 131–137. [Google Scholar]
7. Kegel, M., Tamasauskas, J., Sunye, R., Langlois, A. (2012). Assessment of a solar assisted air source and a solar assisted water source heat pump system in a Canadian household. Energy Procedia, 30(1), 654–663. [Google Scholar]
8. Sterling, S. J., Collins, M. R. (2012). Feasibility analysis of an indirect heat pump assisted solar domestic hot water system. Applied Energy, 93(5), 11–17. [Google Scholar]
9. Panaras, G., Mathioulakis, E., Belessiotis, V. (2013). Investigation of the performance of a combined solar thermal heat pump hot water system. Solar Energy, 93(1), 169–182. [Google Scholar]
10. Tan, X., Zhu, Z. J. (2022). Multi-objective optimization of solar-air source heat pump composite heating system based on fuzzy analytic hierarchy process. Journal of Solar Energy, 43(10), 94–103. [Google Scholar]
11. Dong, X., Tian, Q., Li, Z. (2017). Experimental investigation on heating performance of solar integrated air source heat pump. Applied Thermal Engineering, 12(3), 1013–1020. [Google Scholar]
12. Hu, Y., Cheng, Z. J., Cui, L. (2022). Hourly load forecasting of variable frequency solar-air source heat pump system based on LSTM. Renewable Energy, 40(7), 866–873. [Google Scholar]
13. Yu, S. Q. (2022). Research on optimization of operation strategy of solar and air source heat pump combined heating system (Master Thesis). Beijing Jianzhu University, China. [Google Scholar]
14. Zhang, Z. Y. (2022). Research on modular solar energy and air-source heat pump coupled heating source (Master Thesis). College of Municipal and Environmental Engineering, Shenyang Jianzhu University, China. [Google Scholar]
15. Li, Y. D. (2022). Simulation study on temperature and humidity independent control system based on solution dehumidification and solar-geothermal energy composite energy (Master Thesis). School of Mechatronics and Engineering, Nanchang University, China. [Google Scholar]
16. Ministry of Housing and Urban-Rural Development (2012). Design code for heating ventilation and air conditioning of civil buildings. Beijing, China: China Architecture and Building Press. [Google Scholar]
17. Xiao, F., Yu, Z. (2003). The applications of weather simulation in calculation of building energy consumption. Huazhong Architecture, 21(2), 69–71. [Google Scholar]
Cite This Article
 Copyright © 2023 The Author(s). Published by Tech Science Press.
This work is licensed under a Creative Commons Attribution 4.0 International License , which permits unrestricted use, distribution, and reproduction in any medium, provided the original work is properly cited.
 Downloads
 Citation Tools