
 Submit a Paper
 Propose a Special lssue
 Open Access
ARTICLE

Knowledge-Based Efficient N-1 Analysis Calculation Method for Urban Distribution Networks with CIM File Data
1 Digital Grid Research Institute of China Southern Power Grid, China Southern Power Grid Co., Ltd., Guangzhou, 510640, China
2 Software Development Department, Guangzhou Shuimu Qinghua Technology Co., Ltd., Guangzhou, 510640, China
3 College of Electric Power, South China University of Technology, Guangzhou, 510640, China
* Corresponding Author: Xiangyu Zhao. Email:
Energy Engineering 2023, 120(12), 2839-2856. https://doi.org/10.32604/ee.2023.042042
Received 16 May 2023; Accepted 28 July 2023; Issue published 29 November 2023
 View Full Text
 Download PDF
Abstract
The N-1 criterion is a critical factor for ensuring the reliable and resilient operation of electric power distribution networks. However, the increasing complexity of distribution networks and the associated growth in data size have created a significant challenge for distribution network planners. To address this issue, we propose a fast N-1 verification procedure for urban distribution networks that combines CIM file data analysis with MILP-based mathematical modeling. Our proposed method leverages the principles of CIM file analysis for distribution network N-1 analysis. We develop a mathematical model of distribution networks based on CIM data and transfer it into MILP. We also take into account the characteristics of medium voltage distribution networks after a line failure and select the feeder section at the exit of each substation with a high load rate to improve the efficiency of N-1 analysis. We validate our approach through a series of case studies and demonstrate its scalability and superiority over traditional N-1 analysis and heuristic optimization algorithms. By enabling online N-1 analysis, our approach significantly improves the work efficiency of distribution network planners. In summary, our proposed method provides a valuable tool for distribution network planners to enhance the accuracy and efficiency of their N-1 analyses. By leveraging the advantages of CIM file data analysis and MILP-based mathematical modeling, our approach contributes to the development of more resilient and reliable electric power distribution networks.Keywords
The structure of distribution networks constitutes a crucial aspect of urban distribution network planning and renovation. A refined evaluation of transfer capability can accurately reflect the margin and resilience of the grid structure [1,2]. However, urban medium voltage distribution networks are characterized by diverse network structures, numerous connection modes, and complex topologies, especially with the growth of loads, massive new topologies, and data that will emerge in the future [3,4]. Therefore, there is an urgent need for a fast N-1 analysis method that can adapt to various complex topologies to assist planners in carrying out refined planning.
Urban medium voltage distribution networks typically have various connection modes, such as a single ring network, two supply and one backup, and N segmentation and M contact modes. In the event of a line fault, it is necessary to determine whether the line can be resupplied by the feeder from the same substation or by feeders from different substations. However, as the number of lines in distribution networks increases, N-1-based analysis becomes more complex, and the calculation time required for such analysis is longer. Therefore, it is crucial to develop efficient algorithms for parsing distribution network data, developing algorithm interfaces, and calling distribution network N-1 analysis modules to enable fast distribution network analysis.
Existing N-1 verification has been extensively studied in academic research and typical cases. However, there is still limited research on conducting N-1 verification by integrating CIM files exported from the digitalized distribution network system. It is an urgent requirement in practical engineering to abstractly model the CIM files exported from the GIS system and interface them with N-1 verification models for efficient computation.
In the field of practical distribution network planning engineering, the existing N-1 analysis requires identifying and extracting typical connection modes (two supply and one backup, single ring network, N-section M contact, etc.) from complex topologies [5]. Then, whether the feeder can be transferred after the failure of the mainline, outgoing section is analyzed to determine the transfer capability of the feeder. Manual analysis for N-1 is reliable but time-consuming. Clearly, manual analysis is difficult to be applied in large-scale complex networks, especially when the network topology is involved with the coordination of main grid and distribution networks [6]. For complex distribution networks, it is necessary to search in multiple data systems, which leads to a decrease in planning efficiency. In the academic research field, numerous studies have been conducted to construct a detailed N-1 analysis model for distribution networks [7], whose mathematical model is a challenging NP-hard mixed integer programming (MIP) [8].
The solution algorithms for these kinds of problems can be divided into heuristic optimization methods and mathematical planning methods. Heuristic optimization algorithms are easy to apply, but the optimality of their solutions is difficult to guarantee [9,10]. On the other hand, traditional mathematical programming methods such as Branch and Bound, Branch and Cut, Cutting plane method can guarantee the optimality of the model solutions. However, as the problem size increases, the solution time increases exponentially [11–14].
Meanwhile, the academic research field usually lacks considering the logical relationship between the N-1 analysis model and the CIM data derived from digital system [15,16], which makes it difficult to apply the methods proposed by academic research to the practical distribution network planning engineering field and establish a close data connection with the actual distribution network planning system.
The issues of existing literature can be summarized as follows:
(1) Modeling: Difficulty in manual analysis for large-scale complex networks and challenges of the N-1 analysis model for distribution networks.
(2) Algorithm: Limitations of heuristic optimization and traditional mathematical optimization algorithms.
(3) Application: Lack of consideration for the logical relationship between the N-1 analysis model and CIM data.
To overcome the above problems, this paper proposes an N-1 fast analytical calculation method applicable to urban medium voltage distribution networks by combining expert knowledge from actual planning engineering and distribution network analytical transfer model. The main contributions of this paper are summarized as follows:
(1) Key lines and main transformers are selected by N-1 criterion, which greatly improves the calculation efficiency of N-1 criterion in distribution networks and applies to large-scale, complex distribution network topologies that contain multiple wiring patterns and contact relationships.
(2) Based on CIM files, the MILP model is proposed, which can be solved with open-source optimization solver. Therefore, the developed model can be applied directly to a practical planning system.
The remainder of the paper is organized as follows: Section 2 presents the analysis of N-1 criterion of distribution network combined with CIM file. Section 3 describes power transfer model of distribution network. Knowledge-based efficient N-1 analysis calculation process for distribution network is provided in Section 4. Illustrative cases are provided in Section 5. Finally, Conclusion is drawn in Section 6.
2 Analysis of N-1 Criterion of Distribution Network Combined with CIM File
2.1 The Relationship between CIM File Parsing and Distribution Network N-1 Criterion Analysis
The Common Information Model (CIM) is a vital part of the IEC61970 series of standards that provides a standard logical view of the power system [15]. To enable efficient data exchange and “plug-and-play” applications, all power enterprise applications must follow CIM and describe power system objects in a unified standard.
The CIM topology package defines how to connect each device in the distribution network, and the device connection relationship is expressed through the association relationship of “Conducting Equipment-Terminal-Connectivity Node”. Detailed components type and their index in CIM file are listed in Appendix A. The terminal is the endpoint of the device, and a device can have multiple terminals. The linkage point connects the related terminals impedance-free according to the network operation status. With the network hierarchy model library as the middle layer, the CIM model is parsed into the middle layer database, and a real-time synchronized calculation library is generated to achieve automatic modeling of the full physical model of the power grid. Based on the secondary development and packaging of the API interface, an interface layer is established to realize the automatic cycle operation of N-1 criterion analysis of the distribution network, as shown in Fig. 1.
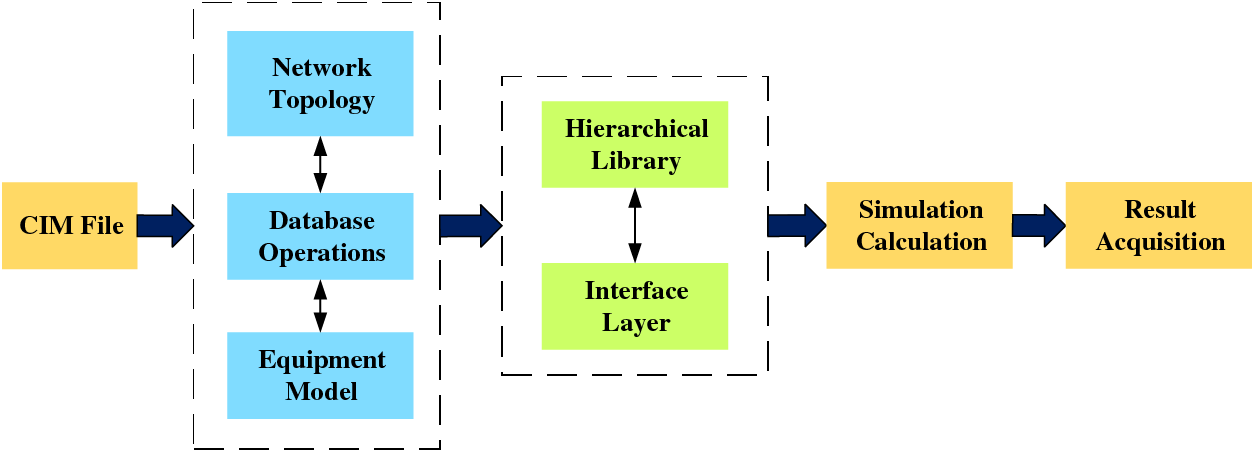
Figure 1: Overall system structure diagram
In real-world distribution network engineering applications, two data files, namely, SVG and XML, can be exported from the distribution network data system for each feeder. The SVG file contains the vectorized image information of the feeder, while the XML file contains information about the equipment, line, and equipment contact relationships of the feeder. By parsing the XML file, CIM element objects can be generated to extract key objects such as busbars, conductors, and distribution substations in distribution network analysis. These objects can then be encapsulated and processed to be saved in a database. Furthermore, they can be combined with the N-1 criterion analysis algorithm of an urban distribution network for simulation and calculation purposes. This facilitates the linkage analysis of distribution network data and algorithms, as depicted in Fig. 2.
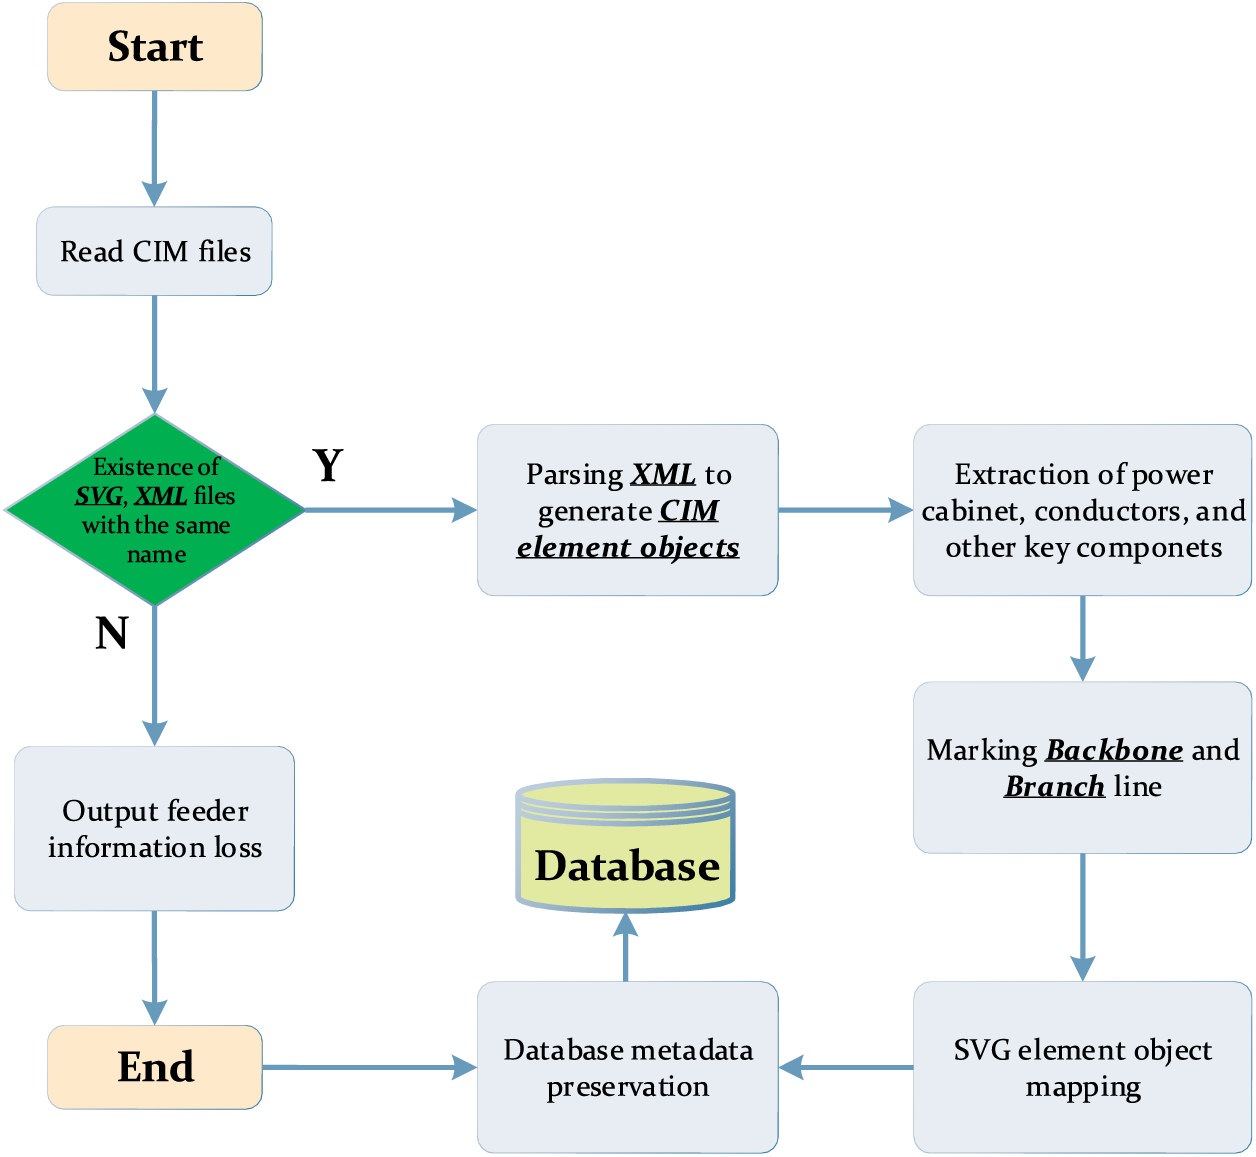
Figure 2: CIM file parsing process
2.2 CIM File Parsing Principles for N-1 Checksum Analysis of Distribution Networks
Different algorithm modules have different data requirements for CIM file parsing, and the relevant principles need to be proposed according to the algorithm model to ensure the stable operation of the algorithm. For distribution network N-1 criterion analysis, the following principles are summarized:
(1) To make the parsed topology match with the input data of the N-1 criterion algorithm for the urban medium voltage distribution network, the nodes need to be numbered in integers starting from the subscript index 0 when numbering, instead of directly introducing a string of unordered codes (such as taking the corresponding GIS code directly from the CIM file, etc.).
(2) To make the parsed topology match with the input data of the N-1 analysis algorithm of the urban medium voltage distribution network, it is also necessary to number the branches with index 0, instead of directly introducing a string of unordered codes.
(3) In the actual parsing, CIM file parsing is object-oriented programming, so when parsing, the model of each component is obtained first, and the component model is the branch model in the algorithm.
(4) Since the N-1 criterion analysis module of the distribution network needs to distinguish between feeder segments exported from substations, lines containing controllable switches, and lines without controllable switches, these three types of lines need to be marked out separately when parsing the CIM file.
(5) Since the CIM file parsing process resolves the line type parameters, area parameters, and length parameters, but does not involve the impedance parameters required for tidal current calculations. To solve this problem, this paper investigates the existence of various types of lines in the current grid. Based on the regression analysis of numerous real data, the following empirical formulas for the unit length resistance r, reactance x, and line section area S are listed:
The parameter have been tested in oceans of power flow calculation scenarios to verify the rationality of the parameters. Based on the above formula, the resistance r and reactance x per unit length can be obtained. Combined with the length of lines, the actual impedance of different lines can be calculated. With these data, N-1 analysis module of the urban medium voltage distribution network can be carried out in the simulation module.
3 Distribution Network Power Transfer Model
The urban medium voltage distribution network has the topological feature of “open-loop operation and closed-loop design”, i.e., each feeder operates independently during normal operation, and each feeder is contacted by a contact switch/contact line in the planning stage. When a fault occurs in the line, the feeders contacting each other can transfer the load through the operation of a contact switch to improve the reliability of the distribution network. The reliability of the power supply in the distribution network is improved.
Compared with the transmission network N-1 analysis, the distribution network N-1 analysis requires a power transfer analysis, which transforms the simple constrained verification calculation into a mixed integer programming (MIP) problem with line and node operation variables. In this section, the mathematical model of the urban medium-voltage distribution network power transfer model, including decision variables, objective functions, and constraints, is presented in detail in conjunction with the abstract distribution network topology obtained from the above analysis [17].
In the distribution network transfer model, binary variables and continuous variables are included.
The binary variables: the load node on-off variable
Continuous variables: nodal active power output
In the event of a line fault, the primary objective of the distribution network transfer calculation is to restore the load in the distribution network to the maximum extent possible through controlled line access, with the following objective function:
When controlling the controlled line pass-through, the tidal balance equation constraint, line voltage drop constraint, line power constraint, node voltage constraint, radial operation constraint, and main transformer power constraint after switching to supply operation need to be satisfied.
(1) Power Flow Balance
For any node i in the set of substation nodes
For any node i in the set
(2) Line voltage drop
For an arbitrary line, the voltage drop constraint needs to be satisfied.
where
(3) Line power constraint
For any line, the active power constraint and the reactive power constraint of the corresponding line type need to be satisfied.
If after the transfer operation, line ij is put into operation, then
(4) Substation node power constraint
For any power node (or substation node) in the distribution network, if the substation is put into operation,
(5) Node voltage constraints
To avoid nonlinear terms in the model and reduce the efficiency of the model solution, in this paper, the square of the node voltage is written as
For any distribution network node, the square node voltage
(6) Radial constraints
To overcome the difficulty of nodes in parsing the CIM file and number each node according to the direction of the power flow, each commissioned line uij can be decomposed into two line vectors
Each node j has at most one parent node, or the power of each node j can only be injected due to one line, as shown in the following equation:
In addition, it is necessary to satisfy that the power node does not have a parent node or that the power node cannot inject power from other lines, as shown in the following equation:
As we can see from Eqs. (3)–(17), the above model is a mixed integer linear programming problem (MILP) with integer variables, which can be solved quickly using a solver. To adapt to the stable operation in the actual system, this project uses pyomo in Python 3.9 to establish the corresponding mathematical model and adopt the open-source solver SCIP, which can support the integration into the actual distribution network operation planning system.
4 Knowledge-Based Efficient N-1 Analysis Calculation Process for Urban Distribution Networks
On the one hand, directly invoking the urban distribution network transfer model for N-1 criterion analysis results in low calculation efficiency. For a complex distribution network with N lines, N times optimization model calculation is required, which has high calculation complexity. On the other hand, urban medium voltage distribution networks have the topological feature of “open-loop operation and closed-loop design,” meaning that each feeder operates independently during normal operation and can be transferred through contact switches in the event of a line fault to improve network reliability.
After conducting a field investigation, it was found that the feeder section located at the exit of the substation is typically in close proximity to the power source. In the event of a failure in this section, it not only results in the loss of the power source associated with the feeder, but it also imposes a significant burden on the neighboring feeders, which are required to bear the entire downstream load of this feeder line. This represents the worst-case scenario for the distribution network.
This paper mainly applies to the field of distribution network planning and design. Inspired by the idea of robust optimization and based on the above analysis, each feeder section at the exit of the substation is extracted for N-1 verification. Post-fault power transfer analysis is carried out separately for these lines. If the power transfer analysis passes, the distribution system satisfies the N-1 verification. To simplify the equivalent value of the distribution system during the transfer analysis, the following specific steps are taken, as shown in Fig. 3.
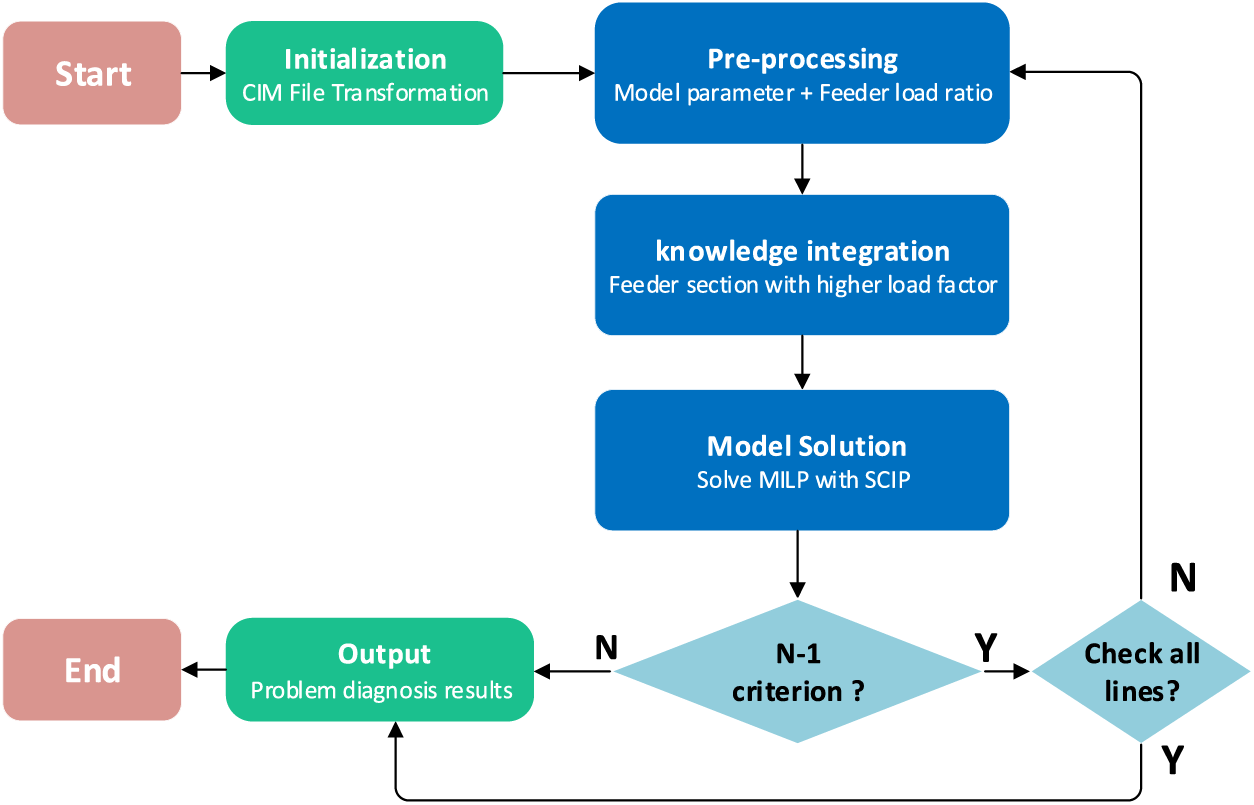
Figure 3: Flow chart of power transfer analysis calculation
1) Initialization: Select the study distribution network area and import the CIM file of the study area.
2) Pre-processing: With the annual peak load of a feeder Ppeak and maximum capacity of a feeder Pmax, the load ratio α of the feeder section at the exit of a substation can be calculated as follows:
3) Expert knowledge fusion: The feeder section at the exit of the substation with a higher load ratio is selected as a priority, and the faults of the feeder section at the exit of the substation are set one by one, and the preprocessed parameters are passed to the distribution network repowering model for solving.
4) Model solving: if a fault occurs at the first end of the line, can it be transferred to the supply, if so, the transfer strategy is given; if it is not possible to restore all loads, the N-1 criterion is not passed.
5) Logic judgment: there are two cases of whether the feeder can be transferred after a fault. If all loads can be restored, the power transfer strategy is given, and go to step 3) to continue the verification. If all loads cannot be restored, the N-1 criterion fails and goes to step 6).
6) Output: If all feeder sections at the exit of the substation pass, the verification N-1 criterion is satisfied; if there is a situation where the supply cannot be transferred, N-1 criterion fails.
As there are many components and complex structures in the distribution network, the proposed transfer analysis calculation method considers the grid structure to ensure that the distribution system satisfies the N-1 criterion with higher calculation efficiency.
To analyse the reasonableness of the method proposed in this paper, this paper is first tested on a simple single ring network and two supply and one standby feeder groups, and then tested in an actual distribution network of 40 nodes in a certain place, and compared with the heuristic optimization algorithm and a traditional N-1 analysis method to verify the effectiveness of the method in this paper. All the simulations are conducted in the Python 3.9 in a 64-bit Windows environment with SCIP solver, on a PC with Core i7-8700 CPU @3.2 GHz processor and 8 GB RAM.
5.1 Comparative Analysis of Different Grid Sizes
(1) Example of calculation
A. Single ring network wiring pattern-6-node distribution system
The 6-node distribution system consists of 2 substation nodes and 4 load nodes. The topology diagram of the 6-node distribution system during normal operation is shown in Fig. 4, where the green circular node indicates the load node that receives power normally, the blue square node indicates the substation node, and the red dashed line indicates the disconnected line. The load demands of the load nodes from left to right are 0.8, 0.6, 1.2, and 1.5 MW, respectively, and the maximum power allowed for the feeders is 3 MW.

Figure 4: 6-node distribution system during normal operation (single ring network wiring mode)
Based on the given information, the load ratios of the two feeders are 46.7% and 90%, respectively. To ensure the reliability of the distribution network, priority is given to the N-1 criterion analysis of the heavily loaded feeder section, as shown in Fig. 5. When a fault occurs at the exit of the second feeder substation, the transfer power model can be invoked to transfer some of the loads to the other feeder. However, not all loads can be transferred, and the N-1 criterion of the distribution network may still not pass. If this happens, at least 1.2 MW of the load (load node 4) will be lost. After the transfer, the load ratio of the feeder will be 96.7%. Further analysis and planning may be required to improve the reliability of the distribution network and prevent future power losses.

Figure 5: 6-node distribution system after a 5-6 fault in the feeder section (single ring network wiring mode)
B. Two supply and one standby wiring pattern-9-node distribution network system
The 9-node distribution network system consists of three substation nodes and six load nodes. The topology diagram of the 9-node distribution system during normal operation is shown in Fig. 6.
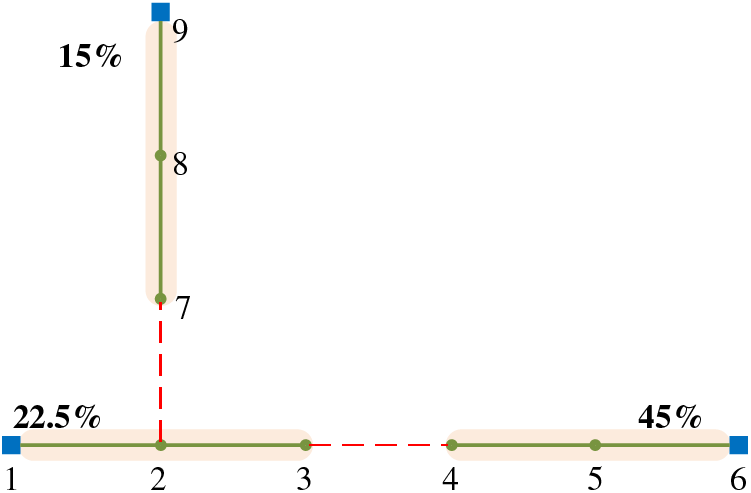
Figure 6: 9-node distribution system during normal operation (two supply and one standby wiring mode, line capacity of 2 MW)
Assuming a maximum power limit of 2 MW for the feeder, the load ratios for the three feeders are 22.5%, 45%, and 15%, respectively. After expanding the distribution network N-1 analysis as shown in Fig. 7, all three feeders can transfer to supply all loads.
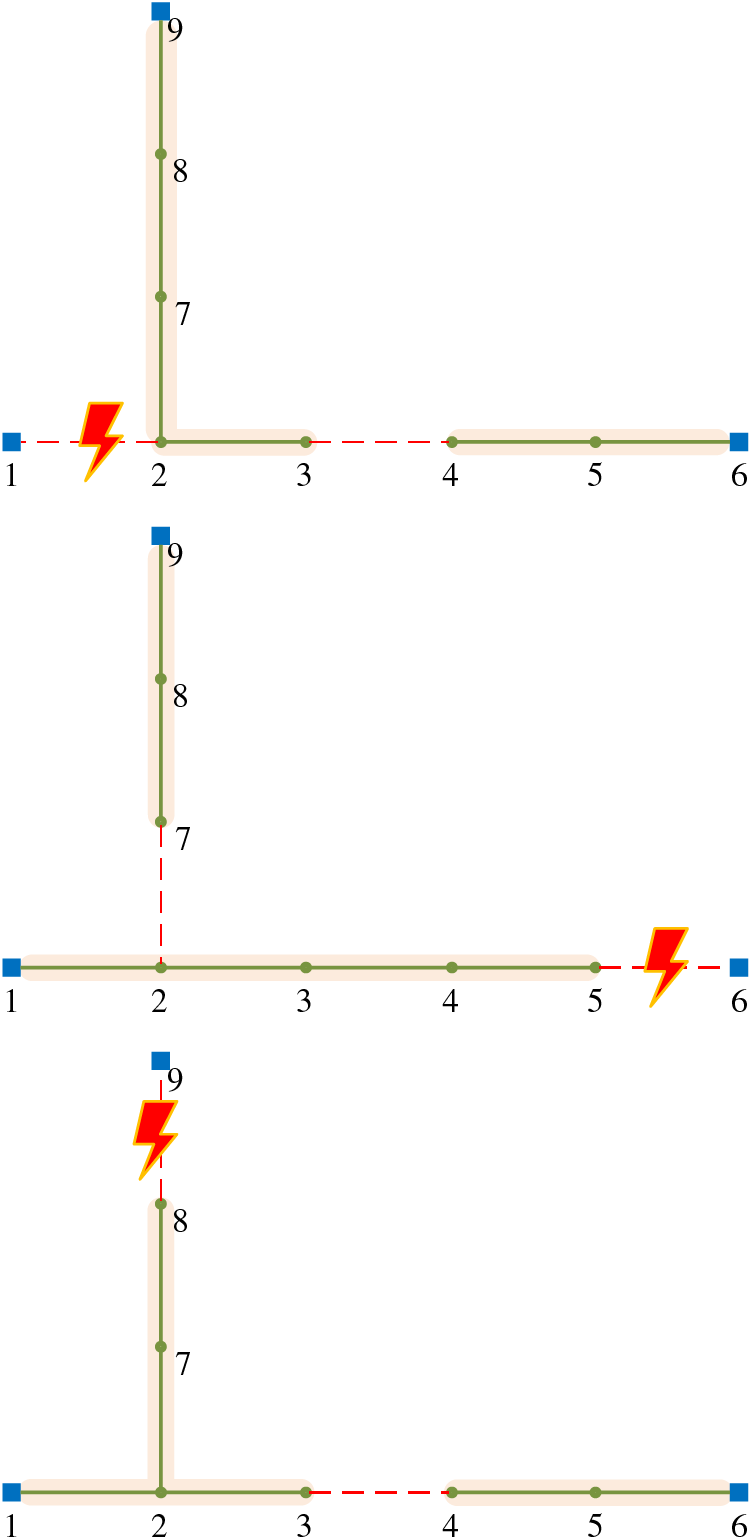
Figure 7: 9-node distribution system at the feeder section N-1 criterion at the exit of the substation (two supply and one standby wiring mode, line capacity of 2 MW)
When the maximum power allowed by the feeder is reduced to 1 MW, the load ratios for the three feeders change to 45%, 90%, and 30%, respectively. According to the method proposed in this paper, priority is given to the higher load, and the analysis is carried out for the feeder with the highest load ratio. This feeder cannot transfer power to all loads and will lose load point 4. As a result, the N-1 criterion of the distribution network will not be met, and at least 0.4 MW of load will be lost. The topology of the feeder after the transfer is shown in Fig. 8.
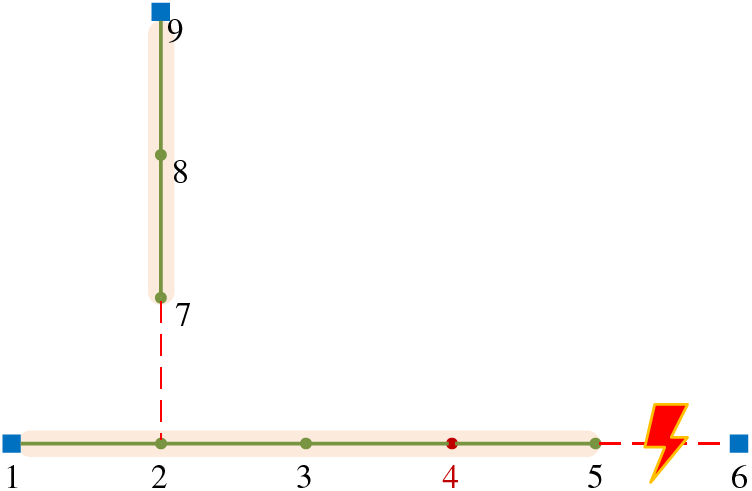
Figure 8: 9-node distribution network system when N-1 criterion of distribution network fails (two supply and one standby wiring mode, line capacity of 1 MW)
By using the proposed method, feeder segments with a greater impact on the system can be quickly identified compared to performing a complete N-1 criterion analysis. This reduces unnecessary computational analysis. The N-1 transfer analysis of the other feeders shows that they can meet the N-1 criterion.
C. Complex actual distribution network topology-40-node distribution system
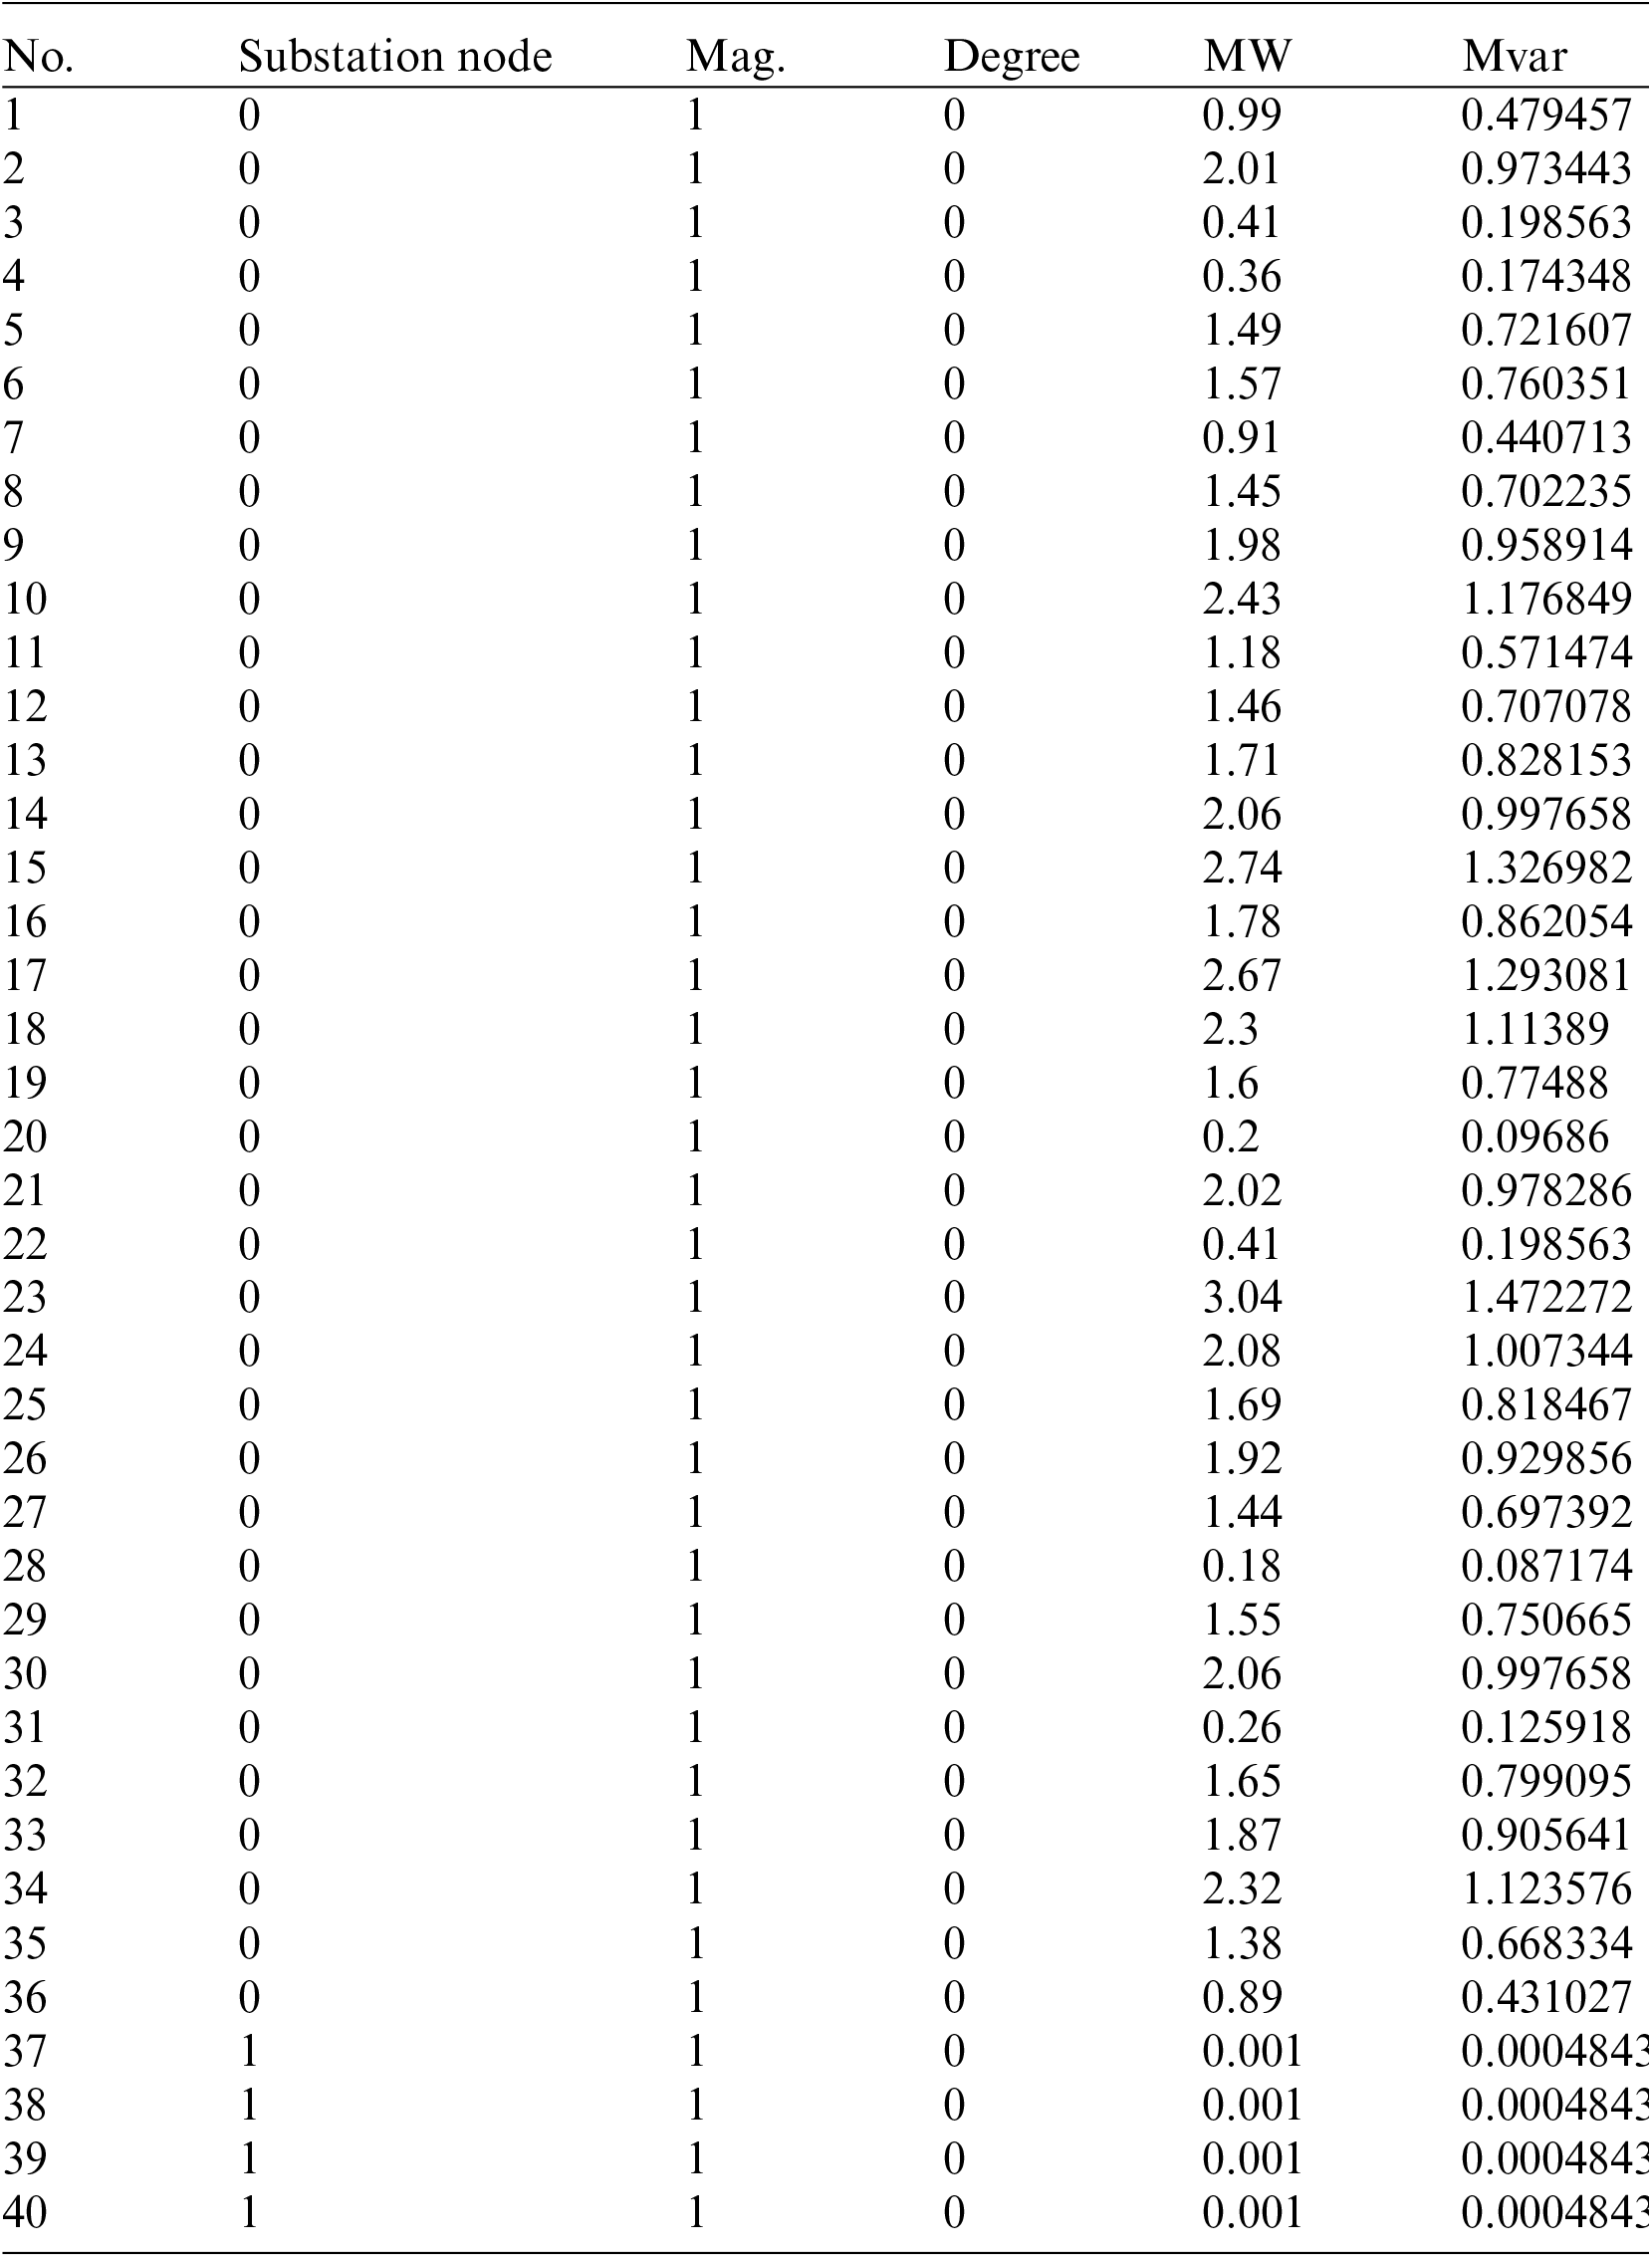
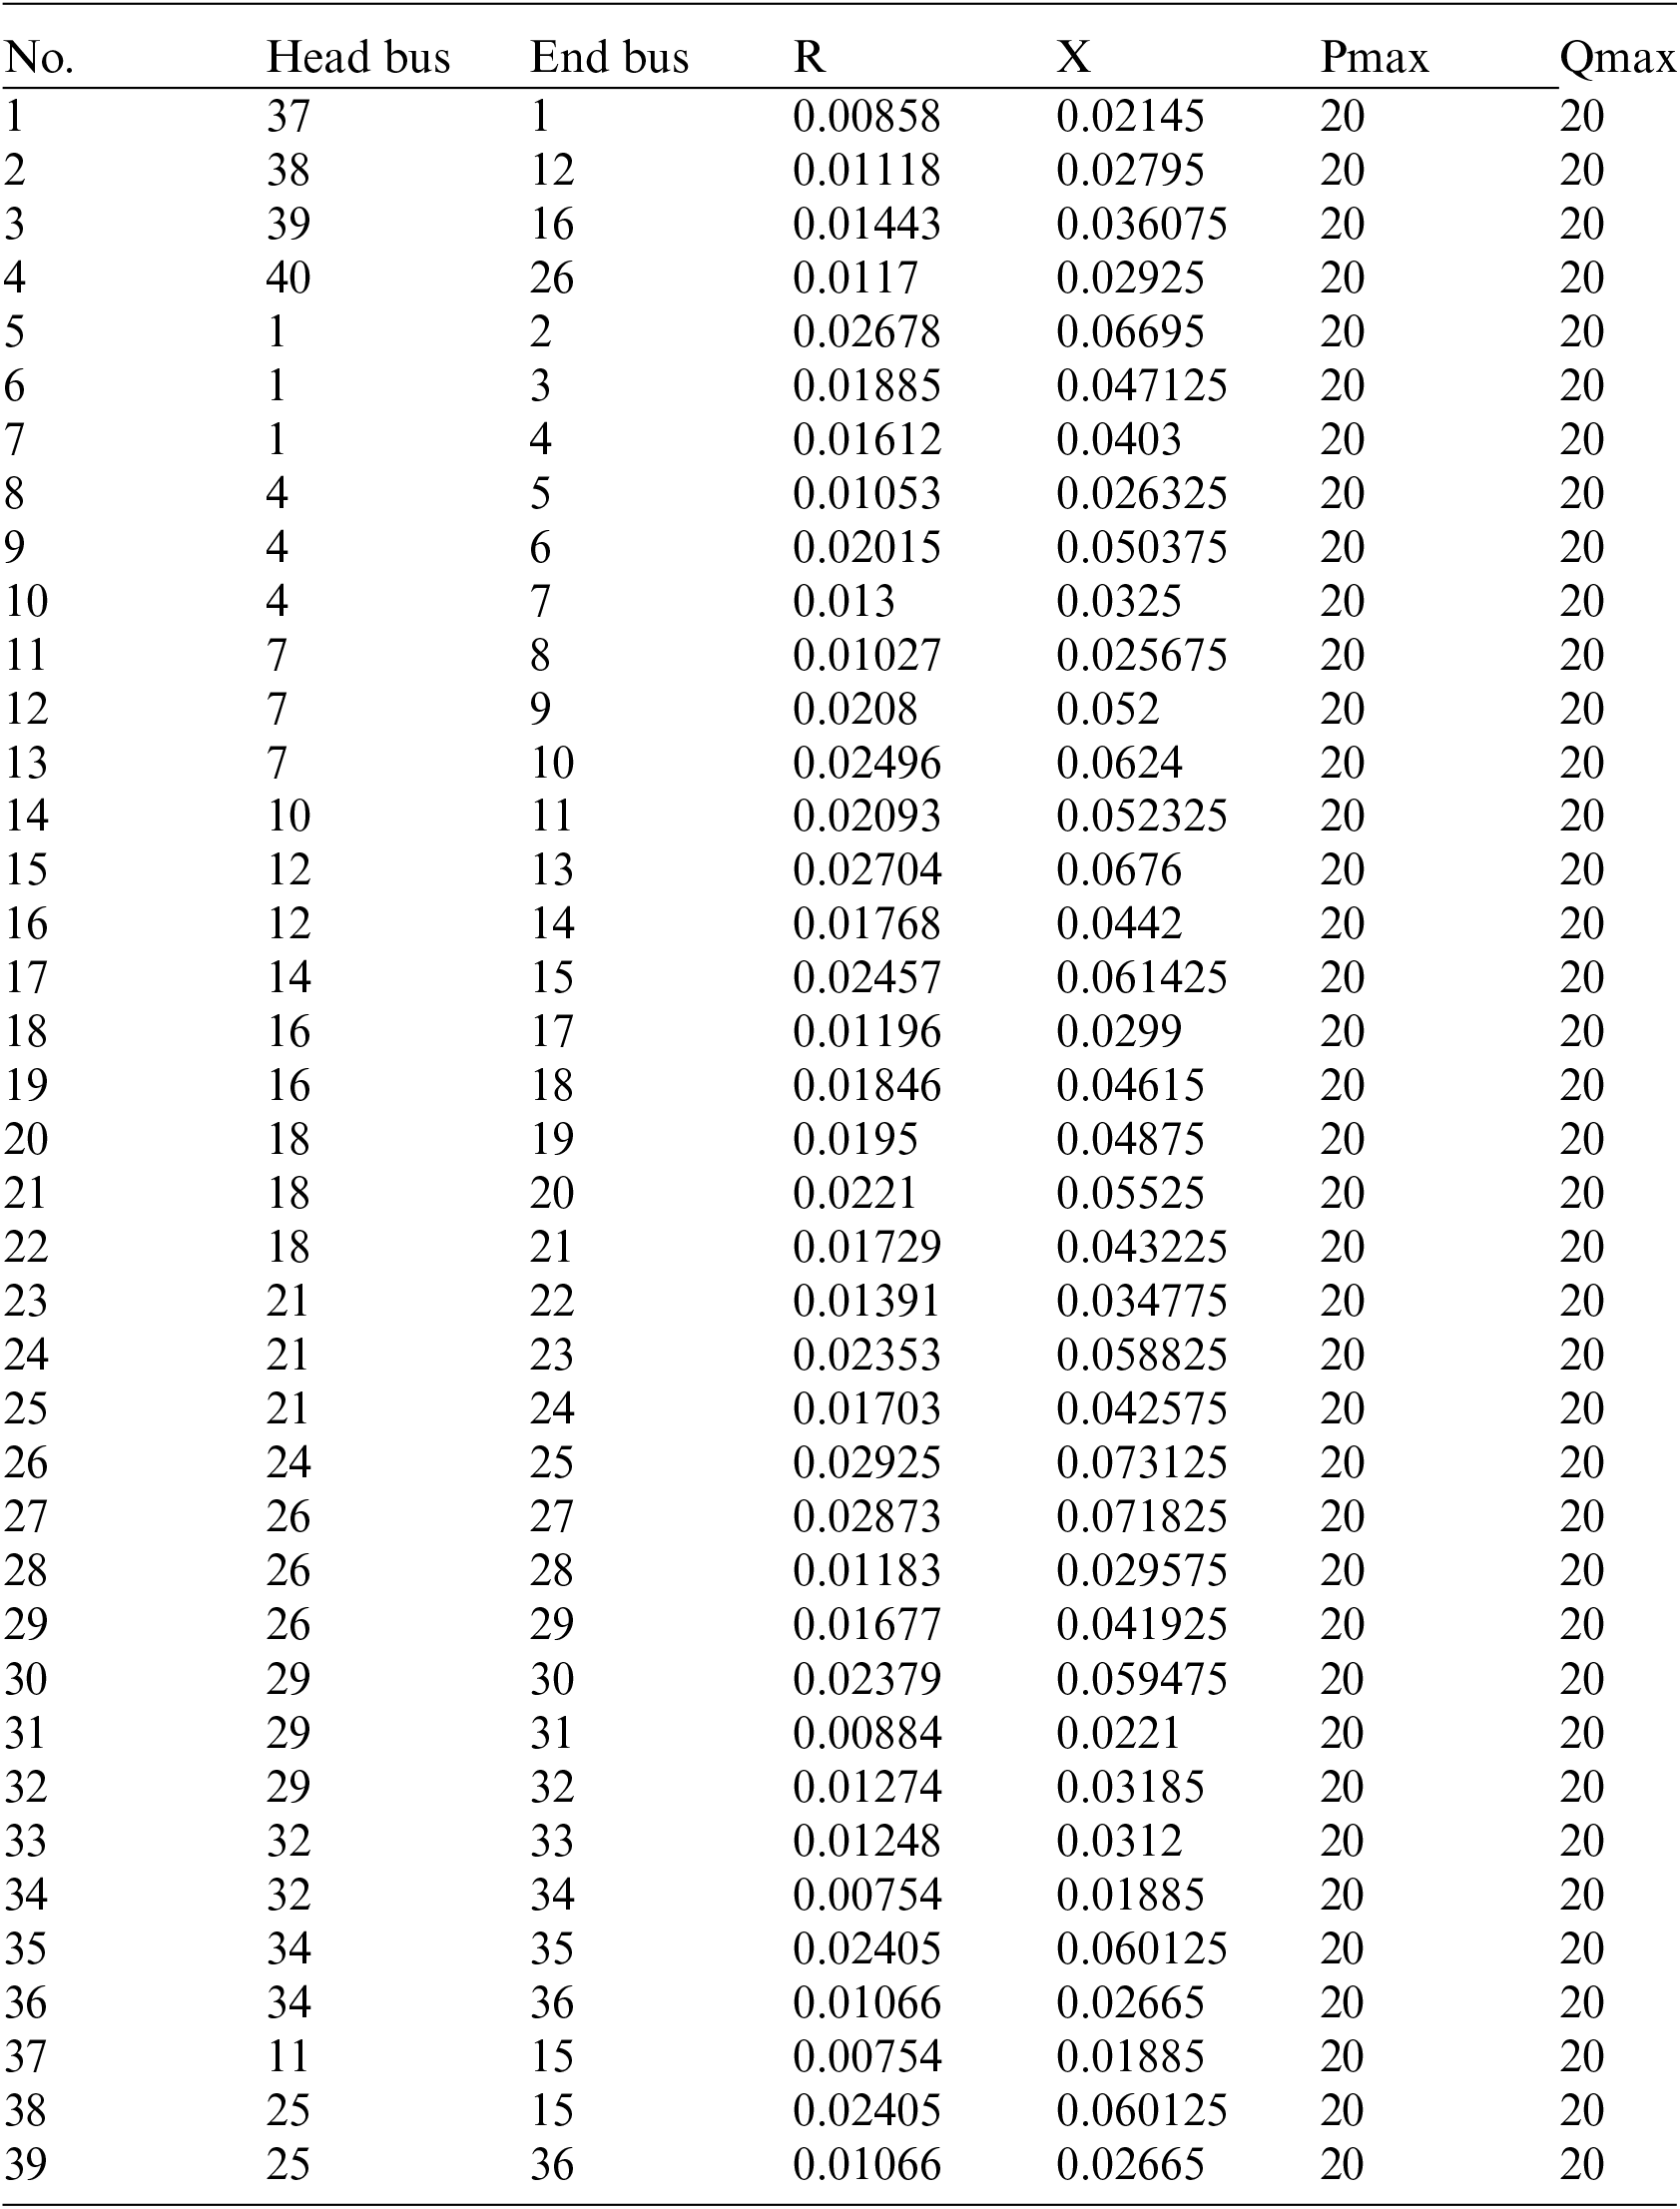
Considering the confidentiality of the CIM file data, the parsed and transformed data format will be used in this paper, as shown in Fig. 9. 40-node distribution system consists of 4 substation nodes and 35 load nodes. The topology of the 40-node distribution system during normal operation, consisting of 4 feeders. Detailed data of the lines and nodes are listed in the Appendix B and C.
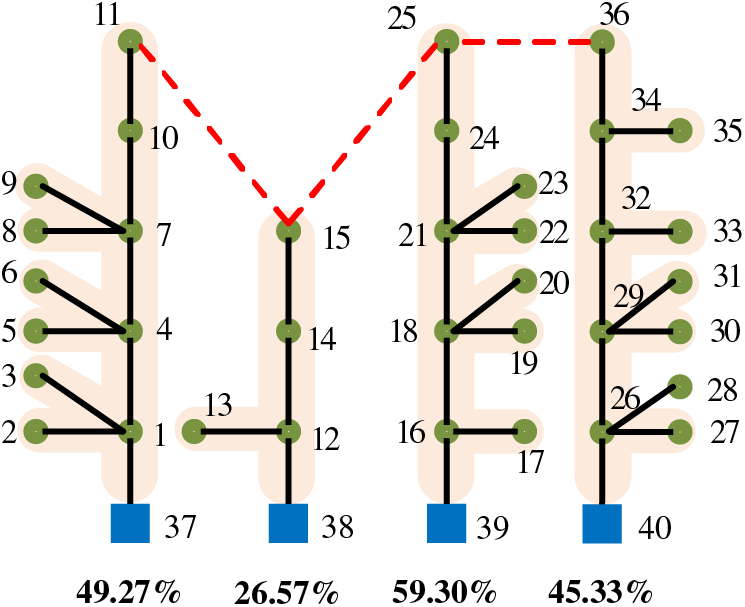
Figure 9: 40-node actual distribution system (complex distribution network topology)
The load ratios of the 40-node system feeders are 49.27%, 26.57%, 59.30%, and 45.33%, respectively. N-1 criterion is carried out for the four feeders, and the results after their transfer are shown in Fig. 10.
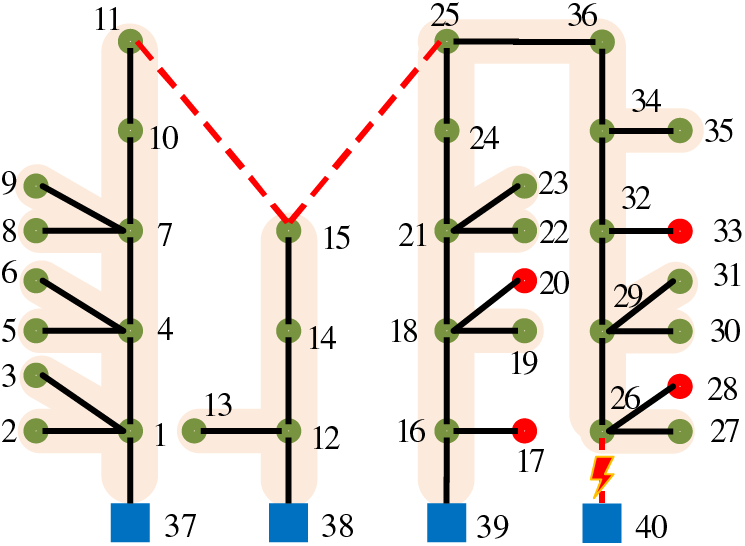
Figure 10: 40-node actual distribution system (complex distribution network topology)
As can be seen from Fig. 10, there is four load point that cannot be transferred to the supply, N-1 verification does not pass, at least the loss of load: 0.331 MW, based on the fast verification method proposed in this paper, only 3 times of verification is needed, and the calculation time is 0.08 s.
5.2 Comparative Analysis of Different Distribution Network N-1 Criterion Methods
To verify the advantages of the algorithm in this paper compared with the traditional transfer supply model in terms of computational efficiency, the proposed method in this paper is compared with the traditional computational method based on a 40-node distribution network system, and the following calculation example is set.
Case(1): N-1 criterion analysis based on Genetic Algorithms (GA) [10]
Case(2): N-1 criterion analysis based on Grey Wolf Optimization (GWO) [18]
Case(3): Traditional complete N-1 checksum analysis
Case(4): The fast N-1 checksum analysis proposed in this paper
The following conclusions can be drawn from Table 1.
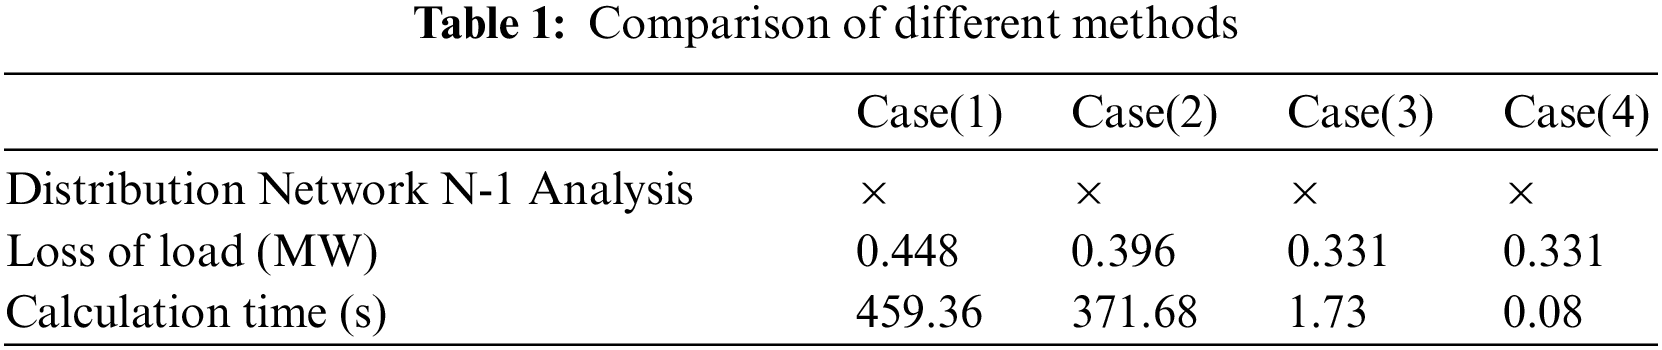
① Convergence speed of the GA performs poorly compared to other algorithms, has the longest computation time compared to other algorithms, and eventually converges to a locally optimal solution. The genetic algorithm can perform crossover, mutation, and inheritance, so the generated solutions are diverse and global, but the required computation time is longer, in addition, the computation results show that it is difficult to obtain the optimal solution in a shorter time.
② GWO has some advantages in convergence performance, especially in convergence speed, and the actual computation time is shorter. The metaheuristic optimization algorithm does not need to adjust too many parameters compared with the traditional heuristic optimization algorithm, and the algorithm is more applicable, however, it is also difficult to guarantee the optimality of the solution.
③ Traditional N-1 analysis and the fast N-1 analysis proposed in this paper have the same calculation results, which verifies the correctness of the method proposed in this paper. However, traditional N-1 analysis requires checking N lines, so the computation time is longer than the method proposed in this paper.
The present paper proposes novel calculation procedure for the fast N-1 criterion of urban distribution networks by combining CIM file data. By integrating CIM file data, N-1 criterion calculations and expert knowledge, this method can enable quick verification of the urban AC distribution network. The conclusion of the paper can be drawn as follows:
(1) In the topology of the urban AC distribution network, the feeder section at the exit of a substation with a high load ratio is given priority for verification. This approach can help discover the distribution network transfer under the most extreme feeder section failure scenario, thereby allowing for rapid completion of the urban AC distribution network N-1 verification analysis.
(2) The feasibility of the proposed method was verified in a 40-node distribution network system, demonstrating millisecond-level computation time. As a result, the method can support N-1 analysis of large-scale distribution networks.
(3) Compared with heuristic optimization algorithm and meta-heuristic algorithms, the proposed transfer supply model can provide an accurate transfer supply strategy while ensuring solution optimality and significantly reducing the computation time. Moreover, compared with the complete N-1 criterion, the proposed method can effectively reduce the number of criterion feeders.
Future research will focus on modeling the transfer supply for new distribution networks with high penetration rates and AC-DC distribution networks, adapting to the development of novel power distribution system.
Acknowledgement: This work was partially supported by 2022 Technical Service Contract for Intelligent Diagnosis and Planning of Typical Network Structure Problems in Medium Voltage Distribution Networks of China Southern Power Grid Digital Research Institute (670000KK52220019).
Funding Statement: This work was jointly supported by the National Natural Science Foundation of China (52207105).
Author Contributions: Lingyu Liang: Conceptualization, Software, Writing-Original Draft, Visualization; Xiangyu Zhao: Supervision, Validation; Wenqi Huang: Supervision, Validation; Liming Sun: Methodology, Resources; Ziyao Wang: Writing-Review & Editing, Supervision; Yaosen Zhan: Writing-Reviewing and Editing.
Availability of Data and Materials: The data used to support the findings of this study are included within the article.
Conflicts of Interest: The authors declare that they have no conflicts of interest to report regarding the present study.
References
1. Qu, Y., Xiao, J., Zu, G. (2023). Security region and power supply capability for distribution system under normal operational state: Definition, model, and application. CSEE Journal of Power and Energy Systems, 1–18. [Google Scholar]
2. Wang, Z. Y., Lin, D., Zeng, G. X., Yu, T. (2020). A practical large-scale distribution network planning model based on elite Ant-Q. IEEE Access, 8, 58912–58922. https://doi.org/10.1109/ACCESS.2020.2981825 [Google Scholar] [CrossRef]
3. Liu, X., Ma, S., Xu, G. (2012). Formation of typical connection mode for distribution network by elementary connection model. Power System Technology, 36(2), 58–63. [Google Scholar]
4. Cai, J., Xie, N., Wang, M., Fan, M. (2019). Digitalized techniques and modeling methodologies for distribution network planning-review of CIRED 2017 on power distribution system planning. Power System Technology, 43, 2171–2178 (In Chinese). [Google Scholar]
5. Xiang, L., Bai, S., Fu, J., Fan, J., Hu, T. T. et al. (2018). GA-Pareto optimization model of mid-voltage distribution network connection mode. Power System Protection and Control, 46(21), 63–68. [Google Scholar]
6. Liu, J., Tang, Z., Zeng, P., Li, Y., Wu, Q. (2022). Region based reconfiguration of distribution network: A post-contingency security solution. Energy Reports, 8(4), 422–428. [Google Scholar]
7. Shen, F., Wu, Q., Xue, Y. (2020). Review of service restoration for distribution networks. Journal of Modern Power Systems and Clean Energy, 8(1), 1–14. https://doi.org/10.35833/MPCE.2018.000782 [Google Scholar] [CrossRef]
8. Lin, Z., Hu, Z., Song, Y. (2019). Distribution network expansion planning considering N-1 criterion. IEEE Transactions on Power Systems, 34(3), 2476–2478. https://doi.org/10.1109/TPWRS.2019.2896841 [Google Scholar] [CrossRef]
9. Zheng, L., Bie, Z., Wang, X. (2004). A fast heuristic service restoration method for distribution network. Electric Power Automation Equipment, 24(2), 16–19. [Google Scholar]
10. Jakus, D., Aenovi, R., Vasilj, J. (2020). Optimal reconfiguration of distribution networks using hybrid heuristic-genetic algorithm. Energies, 13(7), 1544. https://doi.org/10.3390/en13071544 [Google Scholar] [CrossRef]
11. Wang, G., Lei, X., Wu, H., Sun, K., Wang, L. et al. (2021). A comprehensive network restoration model for active distribution network considering forecast uncertainty. IEEE Access, 9, 130997–131005. https://doi.org/10.1109/ACCESS.2021.3109071 [Google Scholar] [CrossRef]
12. Amjad, B., Al-Ja’Afreh, M., Mokryani, G. (2021). Active distribution networks planning considering multi-DG configurations and contingency analysis. Energies, 14(14), 4361. https://doi.org/10.3390/en14144361 [Google Scholar] [CrossRef]
13. Xiao, J., Wang, C., She, B., Li, F., Bao, Z. et al. (2021). Total supply and accommodation capability curves for active distribution networks: Concept and model. International Journal of Electrical Power & Energy Systems, 133(1), 107279. https://doi.org/10.1016/j.ijepes.2021.107279 [Google Scholar] [CrossRef]
14. Xiao, J., Cai, Z., Liang, Z., She, B. (2022). Mathematical model and mechanism of TSC curve for distribution networks. International Journal of Electrical Power & Energy Systems, 137(3), 107812. https://doi.org/10.1016/j.ijepes.2021.107812 [Google Scholar] [CrossRef]
15. Shahid, K., Nainar, K., Olsen, R., Iov, F., Lyhne, M. et al. (2021). On the use of common information model for smart grid applications—a conceptual approach. IEEE Transactions on Smart Grid, 12(6), 5060–5072. https://doi.org/10.1109/TSG.2021.3095896 [Google Scholar] [CrossRef]
16. Pradeep, Y., Seshuraju, P., Khaparde, S. A., Joshi, R. K. (2011). CIM-based connectivity model for bus-branch topology extraction and exchange. IEEE Transactions on Smart Grid, 2(2), 244–253. https://doi.org/10.1109/TSG.2011.2109016 [Google Scholar] [CrossRef]
17. Shayesteh, E., Hamon, C., Amelin, M., Söder, L. (2014). REI method for multi-area modeling of power systems. International Journal of Electrical Power & Energy Systems, 60, 283–292. https://doi.org/10.1016/j.ijepes.2014.03.002 [Google Scholar] [CrossRef]
18. Reddy, A., Reddy, M., Reddy, M. (2017). Network reconfiguration of primary distribution system using GWO algorithm. International Journal of Electrical and Computer Engineering (IJECE), 7(6), 3226–3234. https://doi.org/10.11591/ijece.v7i6.pp3226-3234 [Google Scholar] [CrossRef]
The components type and their index in CIM file
100: Power plant 110: Substation
140: Circuit breaker inside the substation 141: Load switch inside the substation
300: Distribution line 310: Distribution overhead line segment 311: Distribution cable section 312: Distribution electrical connection line
330: Distribution Switchyard 331: Outdoor distribution switch box 332: Distribution cable junction box 333: Distribution Station 334: Distribution box transformer 335: Distribution substation 337: Reactive power compensation on distribution pillars 338: Distribution physical tower 339: Distribution column circuit breaker 340: Load switch on distribution column 342: Isolation switch on distribution column 343: Distribution drop type fuse 344: Fault indicator on the distribution column 346: Distribution cable intermediate joint 349: Lightning arrester on distribution column 352: Distribution column automation terminal 360: Distribution operation tower 370: High voltage motor on the distribution column 398: Cable terminal in distribution station 399: Distribution cable terminal head
400: Distribution busbar 411: Cable inside the distribution station 431: Distribution Transformer 433: Circuit Breakers in Distribution Stations 434: Load switch inside the distribution station 435: Isolation switch inside the distribution station 436: Grounding isolation switch in the distribution station 437: Fuse in the distribution station 439: Lightning arrester inside the distribution station 440: Reactor in distribution station 441: Capacitors in distribution stations 442: Voltage transformer in distribution station 445: Fault indicator inside the distribution station 447: High voltage motors in the distribution station 453: Automation terminal in distribution station
In N-1 verification model, substation nodes contain 100, 110, normal nodes contain 330-335, branches contain 300, 310-312. After parsing and modelling these components into corresponding nodes and branches, they can seamlessly connect with the model
Node data of 39-node distribution system
Line data of 39-node distribution system
Cite This Article
 Copyright © 2023 The Author(s). Published by Tech Science Press.
This work is licensed under a Creative Commons Attribution 4.0 International License , which permits unrestricted use, distribution, and reproduction in any medium, provided the original work is properly cited.
 Downloads
 Citation Tools