
 Submit a Paper
 Propose a Special lssue
 Open Access
ARTICLE

An Experimental Study on the Interaction between Hydrate Formation and Wax Precipitation in Waxy Oil-in-Water Emulsions
1 School of Mechatronic Engineering, Southwest Petroleum University, Chengdu, 610500, China
2 School of Intelligent Manufacturing, Chengdu Technological University, Chengdu, 611730, China
3 State Key Laboratory of Oil and Gas Reservoir Geology and Exploitation, Southwest Petroleum University, Chengdu, 610500, China
4 Oil and Gas Equipment Technology, Sharing and Service Platform of Sichuan Province, Chengdu, 610500, China
* Corresponding Author: Lin Wang. Email:
(This article belongs to the Special Issue: Multiphase Flow Theory in Oil and Gas Gathering and Transportation Process)
Energy Engineering 2023, 120(8), 1837-1852. https://doi.org/10.32604/ee.2023.027637
Received 07 November 2022; Accepted 05 January 2023; Issue published 05 June 2023
 View Full Text
 Download PDF
Abstract
The coupled formation of wax crystals and hydrates is a critical issue for the safety of deep-sea oil and gas exploration and subsea transport pipeline flow. Therefore, this paper conducts an experimental study on the characteristics of methane hydrate formation in a water-in-oil (W/O) system with different wax crystal contents and explores the influence of different initial experimental pressures on the induction period and maximum rate of hydrate formation. The wavelet function was introduced to process the reaction rate and calculate the maximum speed of hydrate formation. Notably, the higher the pressure, the smaller the maximum rate of hydrate formation. We observed that wax crystal precipitation increases the viscosity of the emulsion, which limits the diffusion of gas in the liquid phase during hydrate nucleation and thus delays the hydrate nucleation. The methane gas precipitation also affects the remaining fraction’s wax content and therefore affects the wax precipitation. Secondary hydrate formation was observed several times during the experiment, increasing the risk of pipeline blockage. Overall, this work provides insights into the effect of wax crystal precipitation on hydrate behaviour that could facilitate flow assurance applications in subsea multiphase pipelines and inform the safe transportation of oil and gas pipelines.Keywords
Nomenclature
| The volume fraction of hydrate, % | |
| Mg | Molar mass of methane, kg/mol |
| Nhyd | Hydration number of hydrate, Nhyd = 5.85 |
| Density of hydrate | |
| Density of water | |
| Mw | Molar mass of water, kg/mol |
| VL | Initial volume of the liquid phase, m3 |
| r(t) | Average gas consumption rate, mol/s |
| Δn | Cumulative gas consumption, mol |
| Δt | Sampling interval |
| R | The universal gas constant, 8.314 J/(mol · K) |
| Z | Gas compression factor |
| V0 | Initial gas phase volume |
| Vt | Volume of the gas phase at time t |
Deepwater oil and gas resources are recognized as an important source of future global hydrocarbon resources essential for the depletion of onshore fossil energy sources [1]. For high-pressure multiphase flow production pipelines, hydrate formation and wax crystal preformation may co-occur at low temperatures [2–4]. Consequently, multiple solid phase deposition may lead to a higher risk of pipeline blockage than single solid phase deposition, thus posing a threat to the safe and efficient transportation of deepwater multiphase flow pipelines [5,6]. Therefore, there is an urgent need to investigate the formation of hydrates under different wax content conditions.
Natural gas hydrates (NGHs) are solid compounds assembled by tiny molecules of water and natural gas that effortlessly combine with wax crystals to form pipeline blockages in the low-temperature, high-pressure transit environment beneath the sea [5,6]. Notably, the thermodynamic behaviour of one solid phase may influence the behaviour of another [7]. Instead of a straightforward fusion of hydrate and wax deposition research results alone, the problem of solid phase deposition induced by the presence of hydrates and waxes is complicated. Scholars from domestic and international universities have researched the interaction between methane hydrate formation and wax crystals. Early analyses of the linked creation of wax crystals and hydrates were thermodynamic primarily in nature, and Mahabdian et al. incorporated a wax-hydrate thermodynamic model where hydrate formation would impact the wax crystal phase boundary, content, and composition [8]. However, Zhou et al. discovered that wax crystals promoted hydrate nucleation at 1°C and 3.5 MPa, which was attributed to the increased content of light components caused by wax crystal precipitation, and the wax crystal could provide nucleation sites for hydrate formation [9]. Meanwhile, many scholars found that wax crystals prolonged the induction period, and the inhibition effect increased with increased wax content [10–13]. Notably, scholars have given two main explanations. On the one hand, water droplets tend to approach and adsorb to wax crystals before nucleation and even form hydrate shells, thus inhibiting the formation of hydrate cages [14,15]. On the other hand, the viscosity of the emulsion increases as the wax content increases, thus limiting the gas transfer to the oil-water interface [16–19]. Additionally, Liu et al. noted that once hydrates began to form, the transport capacity of the pipeline was catastrophically reduced [20]. Therefore, wax crystals alter hydrate deposits’ morphology and growth pattern [20–23] and contribute to the precipitation and deposition of hydrate particles and wax crystals. Furthermore, Yegya Raman et al. showed that the wax appearance temperature (WAT) increases significantly as wax crystal solubility in the oil phase decreases following hydrate dissociation [24]. Simultaneously, the presence of wax crystals reduces the effectiveness of the surfactant and increases the risk of pipe blockage [25,26]. Although most experimental studies have shown that waxes inhibit hydrate nucleation, further studies on the inhibition mechanism and quantitative characterisation are needed.
Based on this, the kinetics of wax-containing methane hydrate formation in the oil-in-water system was studied experimentally using an autoclave. The effects of different wax contents and initial pressures on its formation characteristics were also analysed. Furthermore, valid data on the nucleation and growth of hydrates in wax-containing oil-in-water were obtained. Therefore, this study’s main objective is to better understand hydrate formation in wax-bearing oil-in-water emulsions. Notably, these results may contribute to the safe operation and flow assurance of actual subsea pipelines.
The experimental equipment used to study the kinetics of wax-containing methane hydrate formation in oil-in-water systems is shown in Fig. 1. The experimental setup consists of a 304 stainless steel autoclave, a gas flow meter, a temperature control system, a pressure control device and a stirring device. The autoclave used for this experiment was 23 cm high with an internal diameter of 12 cm and a design pressure of 10 MPa. A constant temperature water bath was used to control the temperature of the reactor, with a temperature range of −10°C to 100°C and continuous temperature accuracy of ±0.01°C. The stirring device consists of a magnetic stirring paddle and a torque speed sensor ZH07-X. The maximum speed of the stirring paddle is 6000 r/min, and the torque-speed sensor has a measuring range of 0~2 N · m with an accuracy of 0.0001 N · m. It was installed as a whole with the end cover of the reactor. The data acquisition system records the reactor’s temperature, pressure, and torque values every 10 s.
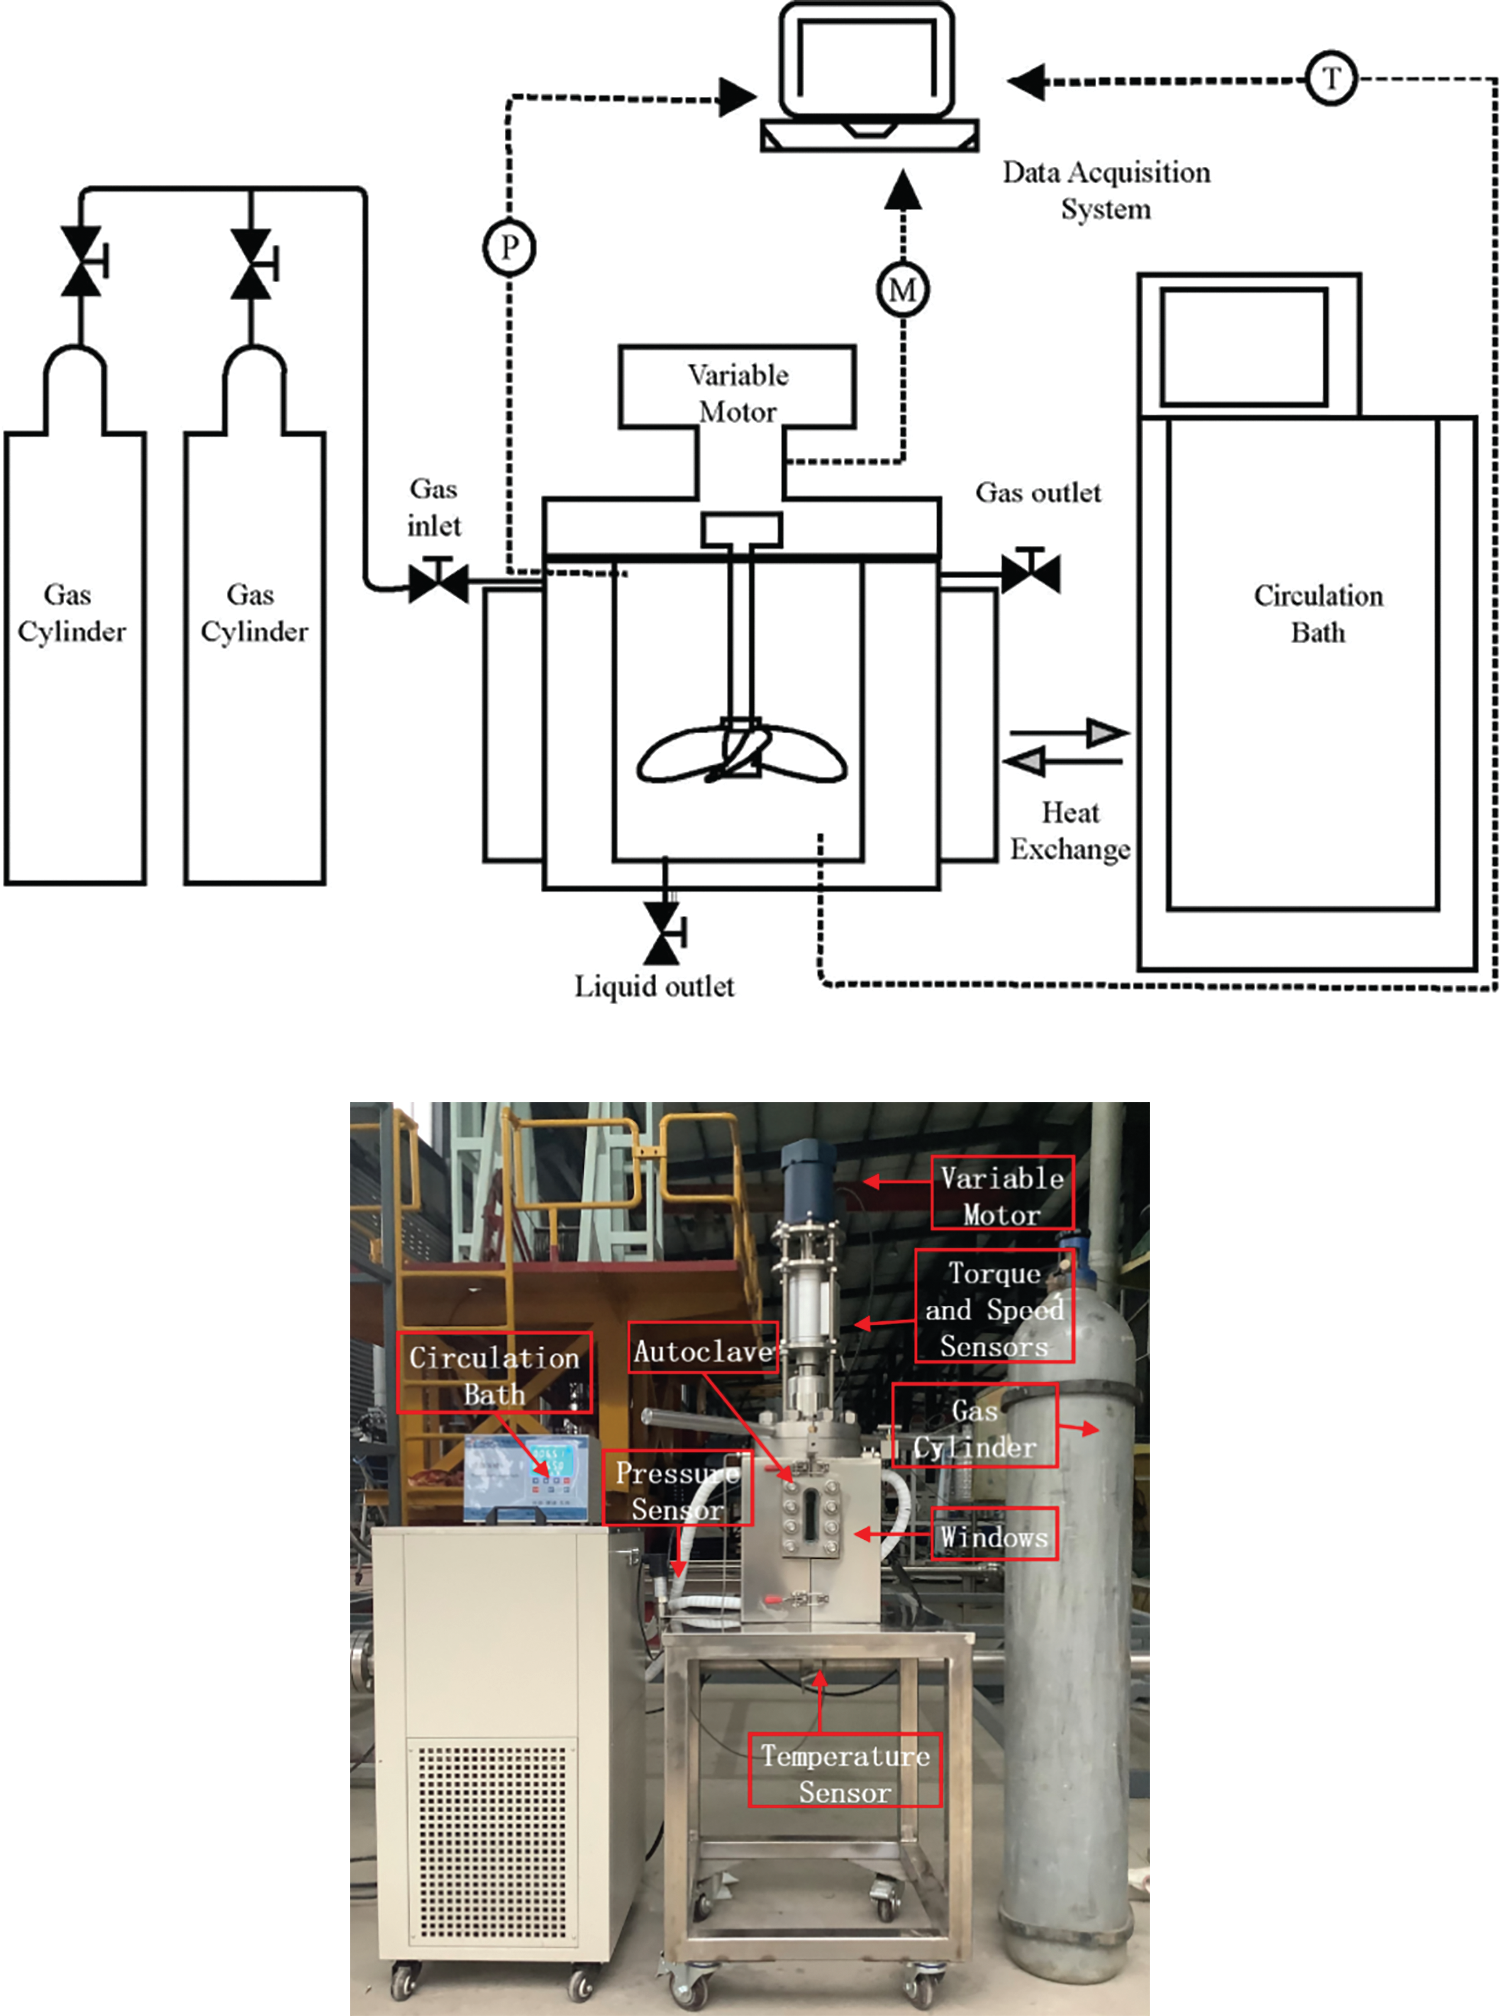
Figure 1: Schematic diagram of experiment device
All groups of working conditions were carried out with methane gas of 99.99% purity. The water used during the experiments was first-class ultrapure water, and the oil used for the experiments was 0# diesel. Furthermore, the wax used for the experiments was 80# microcrystalline paraffin. Take 300 ml diesel oil and weigh it according to the wax content listed in Table 1. Add it into diesel oil and stir to dissolve, then add it into pure water at 25°C and stir at 800 rpm for 2 h. The prepared sample was placed at room temperature while maintaining a stirring speed of 500 rpm, and it was observed that the emulsion clearly separated within 12 h. Before starting the hydrate formation experiments, the emulsion oil droplets need to be confirmed the size distribution, and its micrograph is shown in Fig. 2. Comparing the microscopic pictures before and after adding paraffin, the droplet diameter distribution is more uniform after adding paraffin.

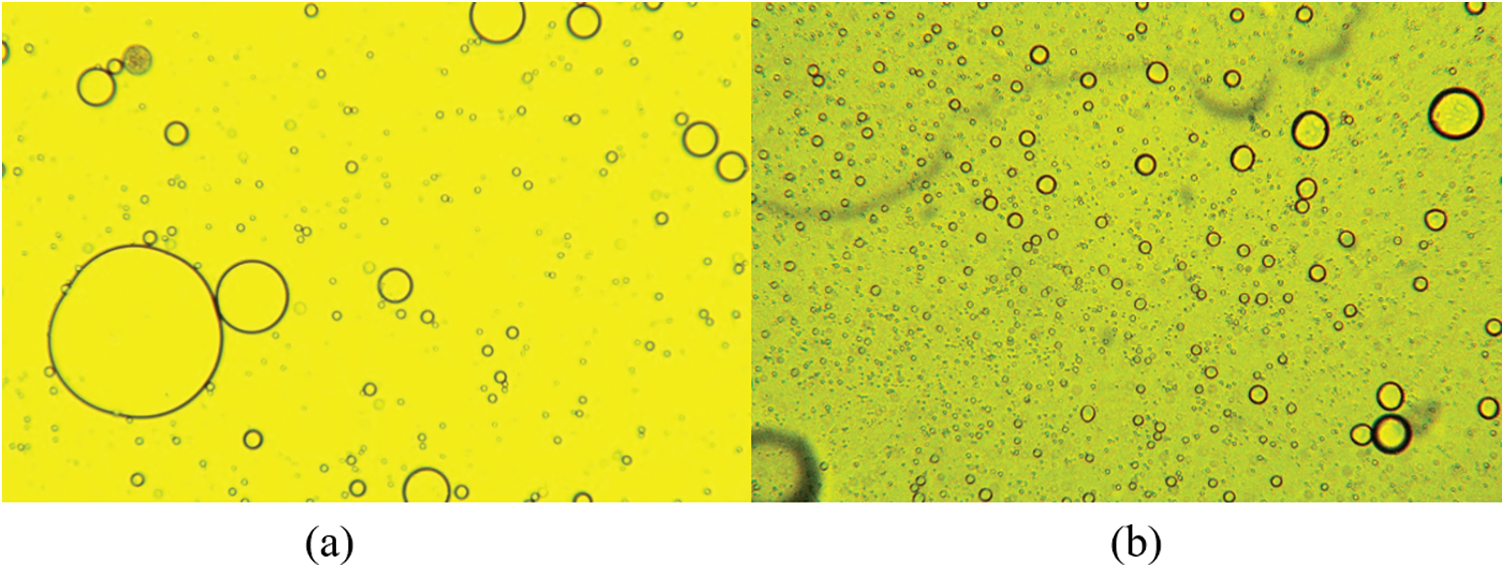
Figure 2: Microscopic images of emulsions (a) without waxy (b) 4 wt% waxy
To investigate the precipitation of wax crystals and the effect on hydrate formation, 1000 ml of diesel and 40 g of paraffin wax were added to the reactor to observe the change in torque as it dissolved and precipitated. The dissolution of the wax crystal particles in the reactor is shown in Fig. 3a, in which we adjusted the temperature of the water bath to raise the reactor temperature from 20°C to 45°C. Torque decreased by 0.006 N · m from 0.024 to 0.0180 N · m. Additionally, the torque variation of the wax crystal particles precipitated in the reactor at a temperature of 32.2°C at t = 1.2 h. Subsequently, the torque started to rise from 0.018 to 0.021 N · m, as shown in Fig. 3b. The effect of wax dissolution and precipitation on torque was pronounced. The precipitation temperature of wax crystals in diesel was 32.2°C, much higher than the formation temperature of hydrates.
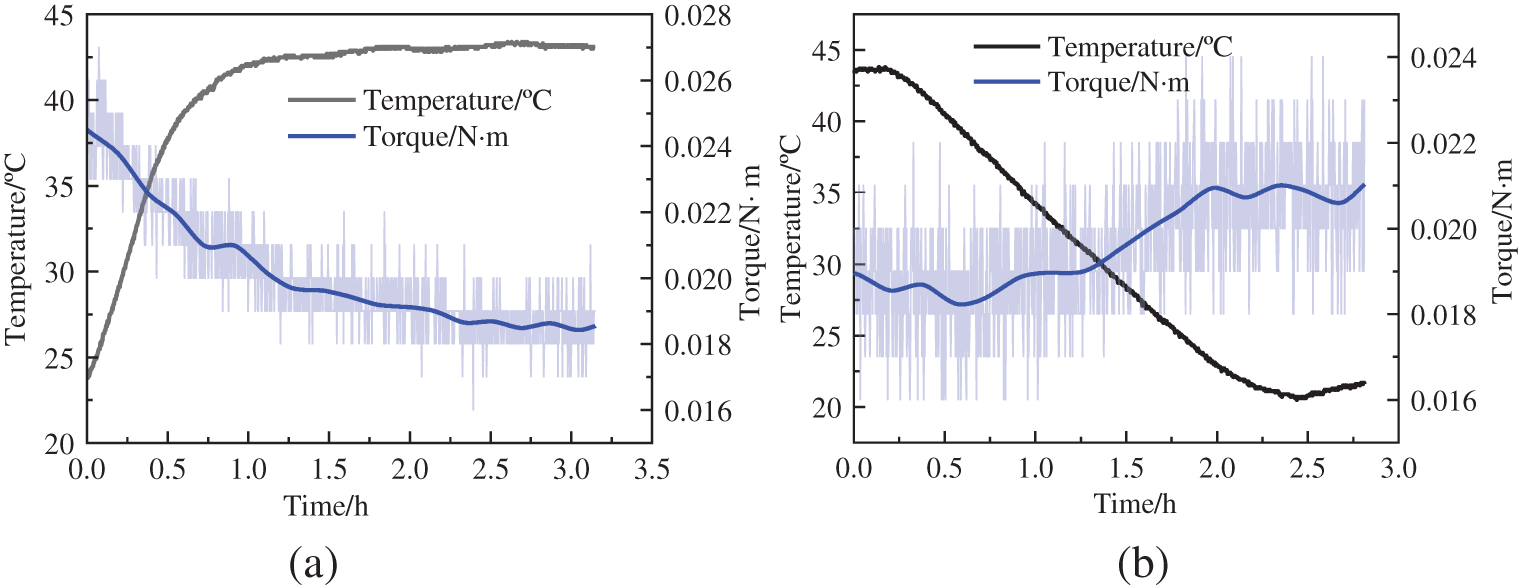
Figure 3: Torque change of wax crystal dissolved in the reactor (a) wax crystals dissolve (b) precipitation of wax crystals
The cooling method used for the experimental study of the kinetics of the production of wax methane hydrate out of oil-in-water systems containing waxes is shown in Table 1. We weighed 0# diesel and crystal wax into a beaker according to the experimental protocol and stirred at 500 r/min using a laboratory shear emulsifier until the crystal wax was completely dissolved. Afterward, ultra-pure water was added and mixed for 6 h to form an emulsion. We then checked that the experimental setup valve was open and closed and added the emulsion to the reactor, turned on the stirring, set the speed to 500 r/min, and evacuated to remove the gas. The water bath was adjusted to the experimental temperature of −4°C to remove the hydrate’s thermal effects during its formation. When the temperature of the reactor is 30°C, fill in CH4 gas and lower the temperature of the reactor. Inject methane gas at a reactor temperature of 30°C. Adjust the water bath temperature to −4°C when the pressure of the charged gas reaches the experimental requirement. When the temperature in the reaction kettle is 25°C, record the pressure at this point as the initial pressure. Hydrate formation was considered complete when the reactor pressure no longer dropped after hydrate formation. The temperature then started to rise. Because the temperature of the reactor is 6°C~7°C higher than the temperature of the water bath, because the decomposition of hydrate is an endothermic reaction, when the temperature difference between the reactor and the water bath reaches 7°C, increase the temperature of the water bath by 2°C. Data collection ends when the hydrate decomposition coincides with or is parallel to the generation of the P-T diagram. A combination of graphical and observational methods was used to calculate the phase equilibrium point of hydrates. The data collected during the experiments were derived and further calculated to obtain parameters such as cumulative gas consumption and average reaction rates.
The pressure, temperature, and torque variation curves during methane hydrate formation at a content of 1 wt% wax are shown in Fig. 4. From the experimental start time range of 0−2.1 h, the temperature and pressure decreased mainly because of the constant temperature water bath effect, at which point the torque stabilises at 0.025 N · m; at t = 2.1 h, the temperature dropped to 13°C, the wax crystals began to precipitate, and the torque increased to 0.028 N · m. Additionally, the torque rose to 0.028 N · m. From Bavoh’s [27] study, the temperature and pressure changes during the hydrate formation and decomposition during the experiment were drawn as a P-T diagram (Fig. 5), and the intersection point was the phase equilibrium point of hydrate formation. The period from phase equilibrium point to hydrate formation is called induction time (Stage II). When the slope of the hydrate decomposition stage (Stage V) in the inner P-T diagram is parallel to or coincides with the cooling process (Stage I), it can be judged that the hydrate decomposition is basically over at this time. This gave the hydrate phase equilibrium time point of t = 2.33 h in the waxed oil-in-water system when the methane hydrate formation mass transfer began, and the hydrate formation induction phase was entered. When the time reached 3.65 h, the hydrate started forming in large quantities in this system; the methane gas was consumed, the heat was given off, the temperature increased, the pressure decreased, and the torque started to increase. At the end of the rapid hydrate formation phase (3.65–5.6 h), the wax crystals and hydrate rapidly solidified and agglomerated as no anti-aggregating agent was added to the emulsion during the experiment (Fig. 6), and the torque reached a maximum of around 0.078 N · m with significant fluctuations. After a sustained period, the water bath temperature was adjusted at t = 8.3 h to increase the temperature of the reactor (the rate of temperature rise was below 0.15 K/h), the methane hydrate in the reactor decomposed, released methane gas, the pressure rose, and the torque began to fall.
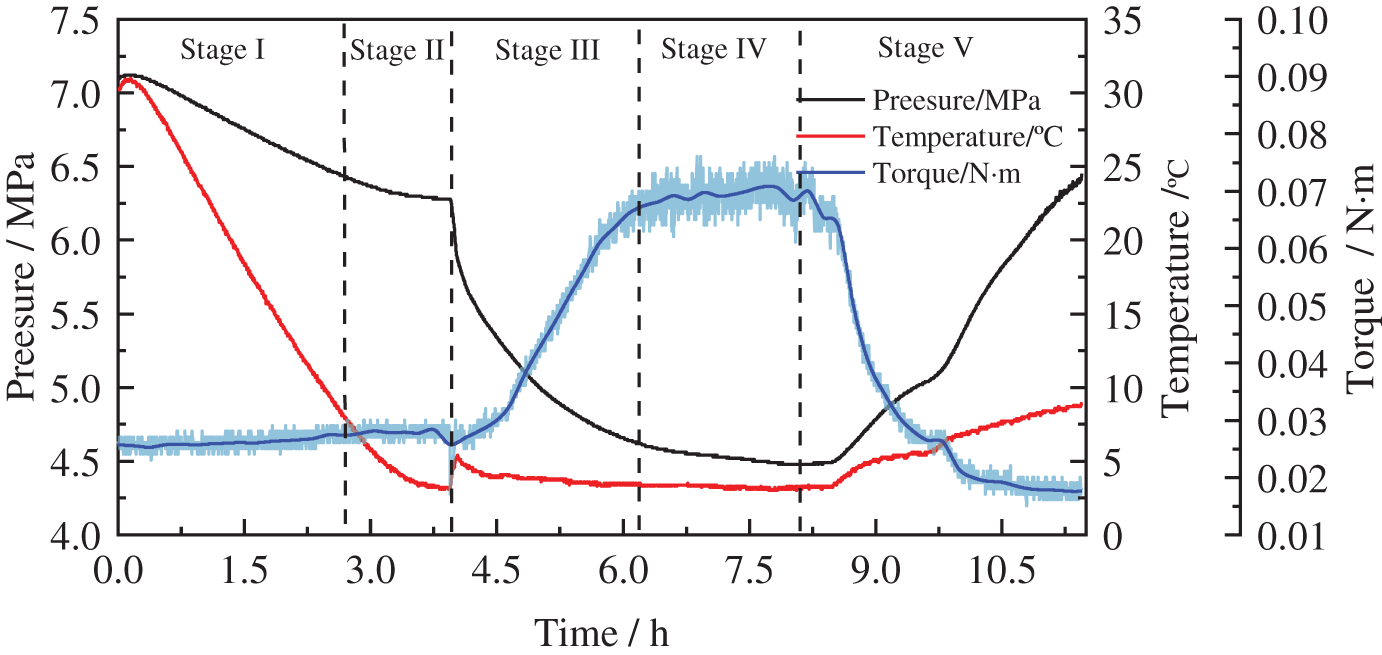
Figure 4: Pressure, temperature, and torque vs. during the hydrate formation process
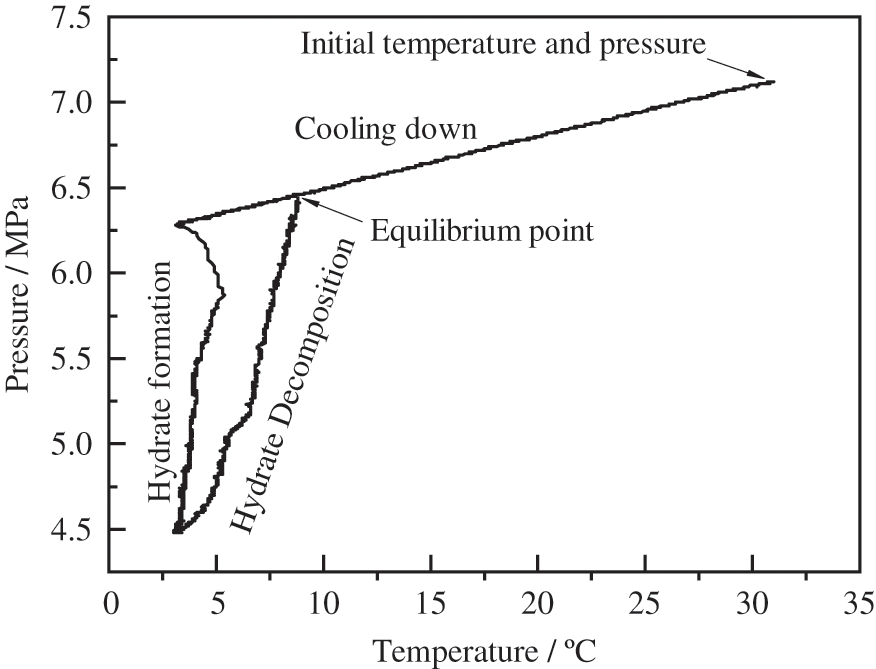
Figure 5: Pressure vs. temperature diagram formed by a T-cycle experiment [27]
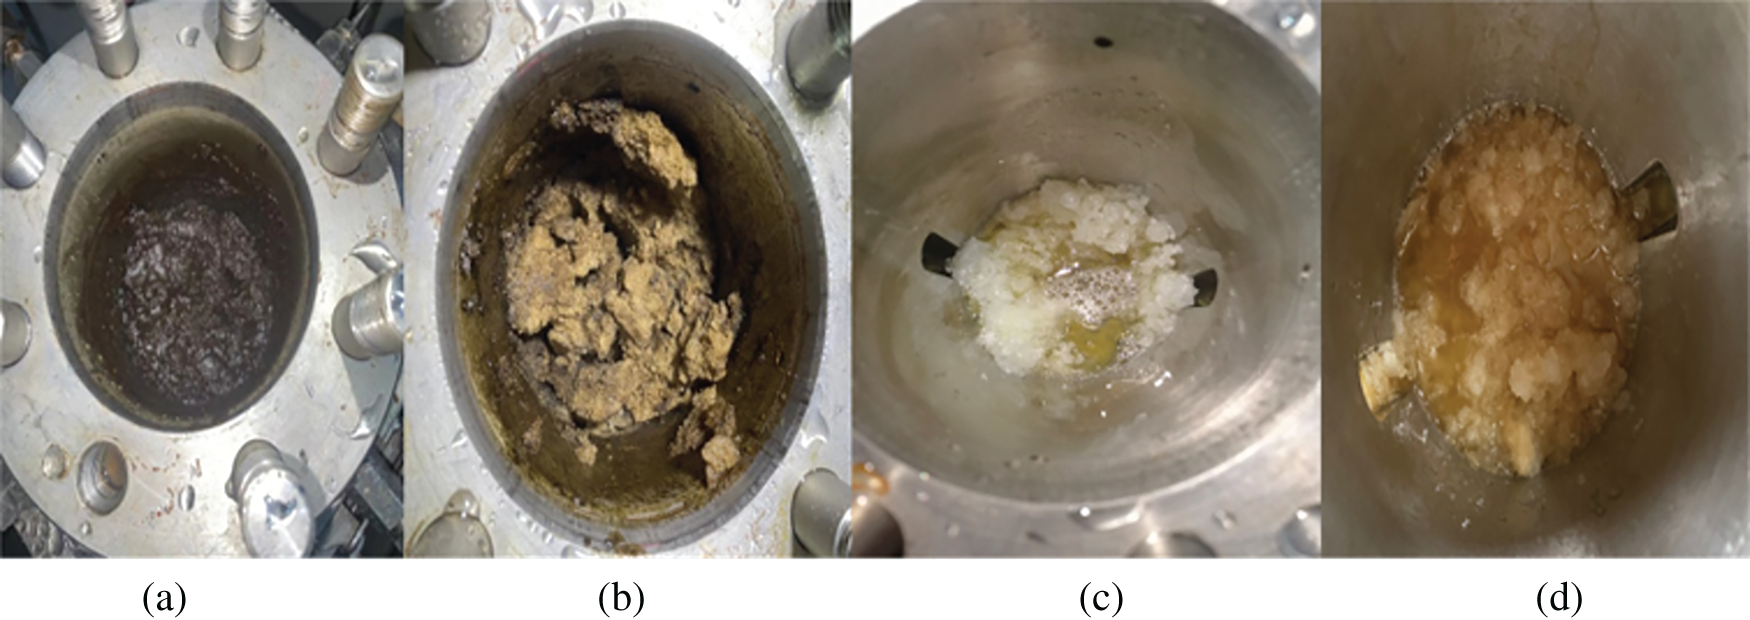
Figure 6: Hydrate formation in different systems (a) Crude oil system hydrate is not formed (b) crude oil system hydrate is formed (c) wax-free diesel system hydrate is formed (d) wax-containing diesel system hydrate is formed
4 Effect of Wax Crystals on Hydrate Formation Properties
At an initial pressure of 7.7 MPa, the temperature change of wax crystal precipitation in the oil-in-water system with different wax contents is shown in Fig. 7. As can be seen from the figure, three different wax content experimental conditions were repeated three times, and the maximum relative error of repeated experiments was less than 12%. When the wax content was 1 wt%, the wax crystal precipitation temperature was about 13.1°C; when the wax content was 3 wt%, the wax crystal precipitation temperature was about 19.3°C; when the wax content was 4 wt%, the wax crystal precipitation temperature was about 19°C. It was observed that the wax crystal precipitation temperature changed when the wax crystal content varied. The torque in the reactor rose as the wax crystals precipitated, and the gas release was calculated to be approximately 0.004 mol at this point, with an increase in the concentration of the wax component in the remaining components leading to wax crystal precipitation. Furthermore, the higher the wax precipitation temperature in the experimental group with high wax content, the formation of hydrates significantly changed the phase boundary of the wax [28,29].
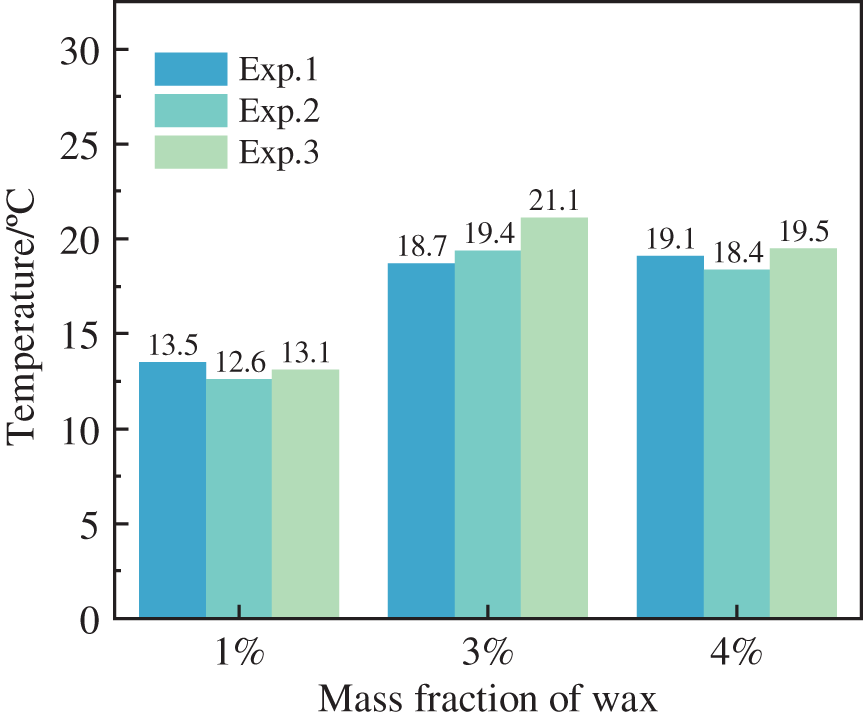
Figure 7: Wax crystal precipitation temperature in oil-in-water systems with different wax contents
The phase equilibrium curves of hydrates in the wax-in-oil system under different experimental conditions are shown in Fig. 8. As shown, the phase equilibrium point of hydrate for additional wax content experimental conditions agrees well with the calculated hydrate phase equilibrium prediction model of Sloan [30], with a maximum deviation of about 7.3% (Fig. 9).
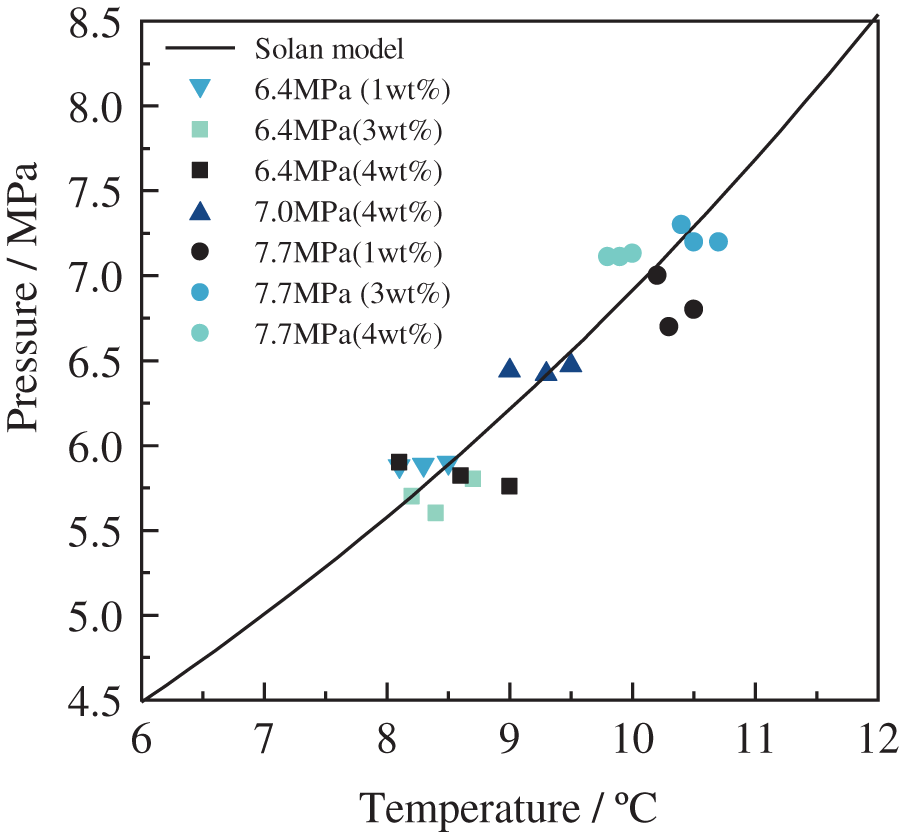
Figure 8: Phase equilibrium curve of hydrate formation
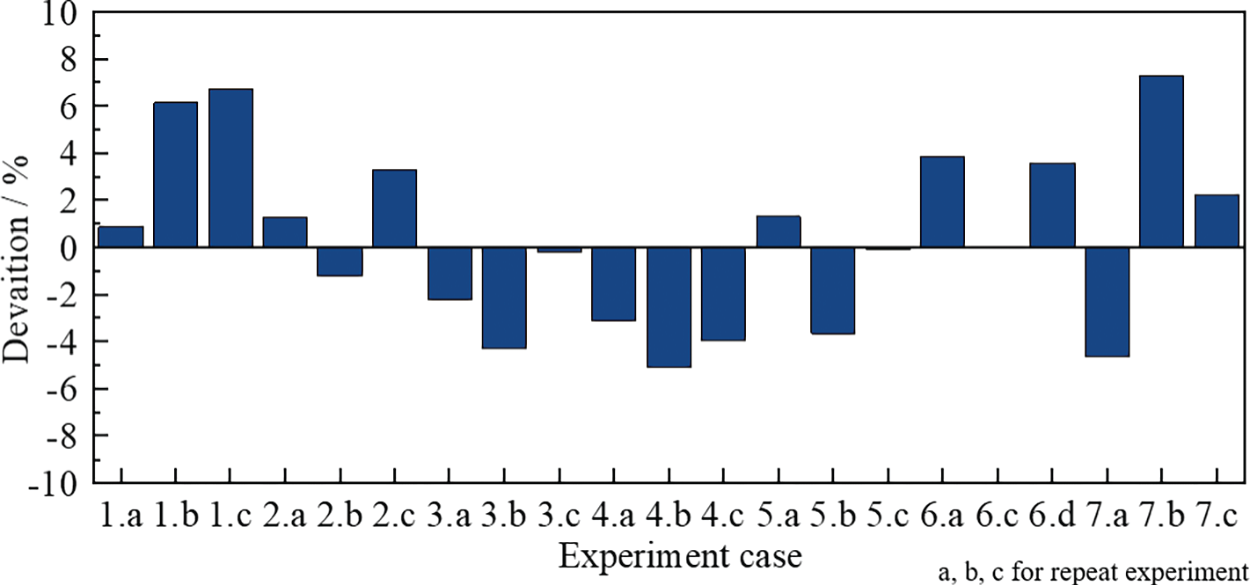
Figure 9: Analysis of errors in hydrate phase equilibrium curves
Based on the hydrate phase equilibrium conditions of the wax-containing oil-in-water system, the induction period of hydrate formation was calculated for different experimental conditions, as shown in Fig. 10. As seen in Fig. 10a, the induction period time increased significantly with increasing wax crystal content at an initial pressure of 6.4 MPa. It can also be seen that the high range of wax crystals had a significant inhibitory effect on hydrate formation. As seen in Fig. 10b, the induction period increased with increasing wax crystal content at an initial pressure of 7.7 MPa, but the change was minor. It can also be seen that the inhibition of hydrate formation by wax crystals decreased when the pressure increased. This result is not consistent with the hypothesis that the precipitation of wax crystals provides nucleation sites for hydrate formation. The reason for this analysis is that wax crystals at the oil-water interface hinder the migration of methane molecules in the oil phase to water. Still, the high pressure and agitation weaken the hindrance at the oil-water interface, which is conducive to promoting the induction of hydrate formation.
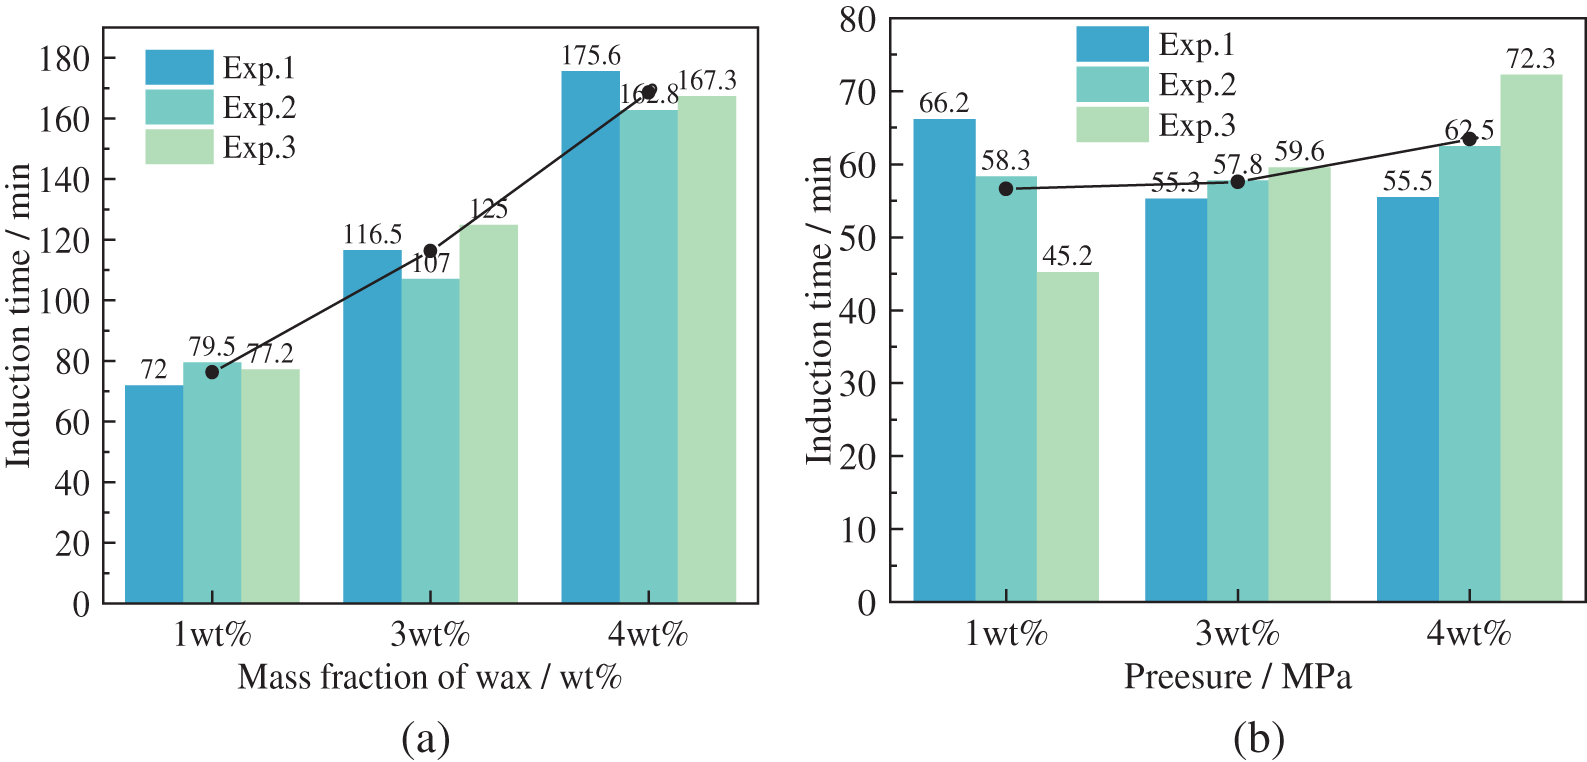
Figure 10: Induction time at the pressure of 6.4 and 7.7 MPa in a 20% oil-in-water emulsion, at 500 rpm (a) 6.4 MPa (b) 7.7 MPa
4.2 Effect of Wax Crystals on the Rate of Hydrate Formation
Gas consumption needs to be calculated to study the rate of hydrate formation in wax-in-oil systems. The gas consumption of methane gas in the reactor can be calculated from the gas equation of state as follows:
where,
The equation for the rate of consumption of methane gas is as follows:
where,
From the experimental data collected for the hydrate formation rate calculation of the wax-containing system, the hydrate formation rate values from Eqs. (1) and (2) were found to fluctuate due to a dynamic equilibrium between precipitation and dissolution of methane gas during the cooling of the experimental water bath. Therefore, in this paper, the wavelet transforms using the Biorthogonal basis function [31] were used to remove the low-frequency part of the time series, and the hydrate formation temperature variation curves for different initial pressure conditions are shown in Fig. 11. From Fig. 11a, it can be seen that when the initial pressure was 7.7 MPa, the average reaction rate of gas at the beginning of hydrate formation was as high as 7 × 10⁻³ mol/s, after which the formation rate decreased rapidly. When the hydrate was formed twice, the average reaction rate increased again, after which the formation rate was maintained at a low range. As seen from Fig. 11b, the average gas reaction rate at the start of hydrate formation was as high as 6.7 × 10⁻³ mol/s at an initial pressure of 6.4 MPa, after which the rate decreased rapidly. Furthermore, when the hydrate formed twice, the average reaction rate rose again, after which the rate remained low.

Figure 11: Temperature variation of hydrate formation under different waxy content conditions (a) 7.7 MPa (b) 6.4 MPa
The maximum rate of methane hydrate formation in the waxed oil-in-water system under different experimental conditions is shown in Fig. 12. The rate of hydrate formation in the wax-in-water emulsion at an initial pressure of 7.7 MPa was slightly lower than that in the experimental group at an initial pressure of 6.4 MPa. It tended to decrease with increasing wax content. The maximum rate of hydrate formation was 5.4 × 10⁻³ mol/s in all groups, probably because hydrate formation did not provide nucleation sites for hydrate formation. Instead, the presence of wax crystals affected the mass transfer process and, thus the maximum rate of hydrate formation.
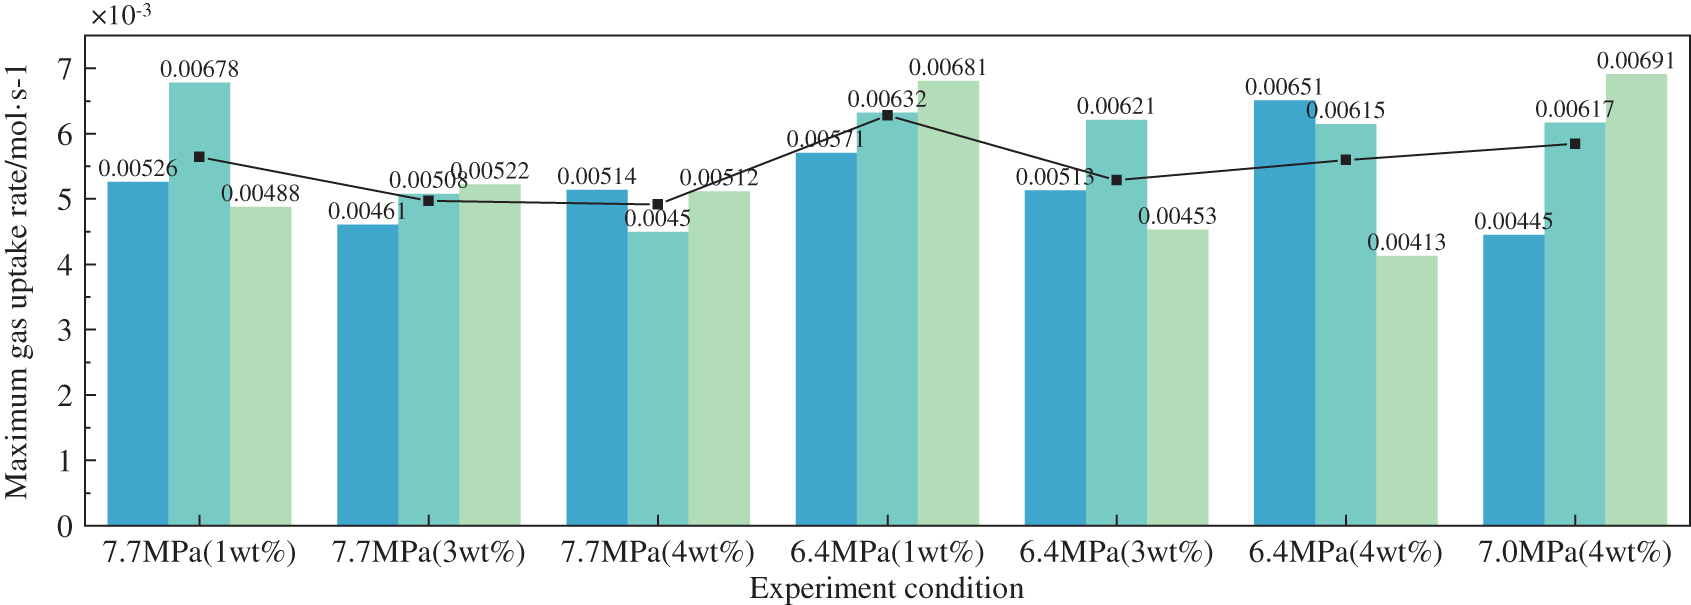
Figure 12: Maximum gas uptake rate in the system at the temperature of 3°C in an 80% oil-in-water emulsion at 500 rpm
At the end of the induction period, the hydrate enters a rapid growth phase and a large amount of hydrate is formed to occupy the reactor. The amount of hydrate production can be calculated by the following equation [29]:
where, ϕ is the volume fraction of hydrate; Mg is the molar mass of methane; Nhyd is the hydration number of hydrate; Mw is the molar mass of water;
The variation curve of hydrate formation for the wax-in-oil system at different experimental conditions is shown in Fig. 13. From Fig. 13a, it can be seen that when the initial pressure level of the experiment was 7.7 MPa, there was a large and rapid formation of hydrate during the first hour of hydrate formation, followed by the slow growth of hydrate. As the wax crystal content increased, a greater amount of hydrate was produced. As can be seen from Fig. 13b, when the initial pressure level of the experiment was 6.4 MPa, a large amount of hydrate was formed rapidly within half an hour of hydrate formation, followed by relatively slow hydrate growth. Furthermore, as the wax crystal content increased, a more significant amount of hydrate was formed.
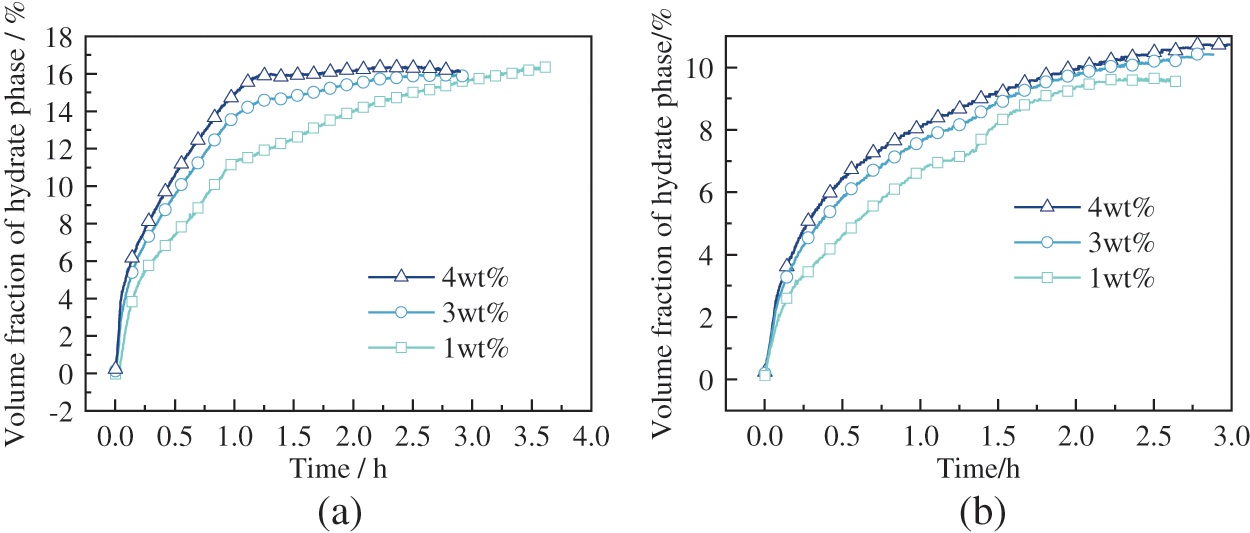
Figure 13: The volume fraction of hydrate phase variation at different waxy content (a) 7.7 MPa (b) 6.4 MPa
4.3 Effect of Pressure on the Formation Characteristics of Wax-Containing Hydrates
To investigate the effect of initial experimental pressure on the hydrate formation characteristics in wax-containing oil-in-water systems, experimental studies were carried out at 7.7, 7.0, and 6.4 MPa pressure conditions at 4 wt% wax content. The variation of the induction time for forming wax-containing hydrates at different pressure conditions is shown in Fig. 14. As seen from the graph, as the initial experimental pressure increased, the hydrate induction time decreased. The variation pattern was similar to that in the pure water system, where high pressure can effectively promote hydrate formation in wax-containing systems.
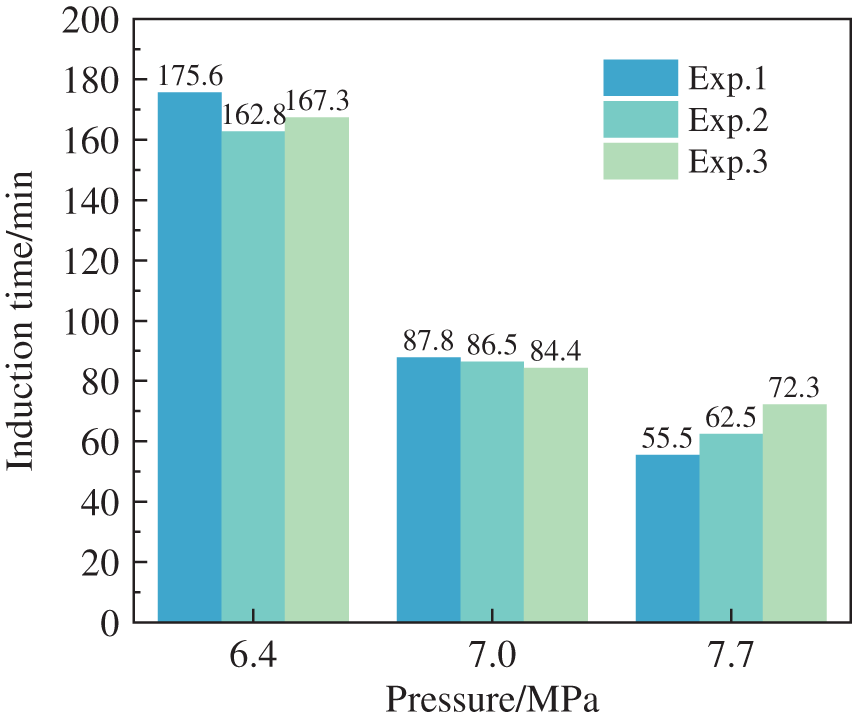
Figure 14: Induction time in different pressure at the temperature of 3°C in an 80% oil-in-water emulsion at 500 rpm
The temperature profile for wax hydrate formation at different pressure conditions is shown in Fig. 15. Of note, hydrate formation becomes an exothermic reaction. There was a corresponding increase in pressure and a longer temperature rise, indicating a more extended period of rapid hydrate growth as soon as the hydrate formation gave off a lot of heat, and the temperature in the reactor rose. Likewise, there was a steep rise and fall in temperature in the experimental group at an initial pressure of 7.7 MPa. At that point, the hydrate phase rapidly occupied the reactor, as shown in Fig. 16. In the initial pressure of 7.0 and 6.4 MPa experimental groups, the hydrate formation was accompanied by a steep increase in temperature, which slowly decreased as the experiment progressed. The hydrate phase was lower in the fast growth interval than in the high-pressure experimental group, after which the hydrate remained in slow growth. Moreso, the final hydrate phase volume fraction increased with increasing pressure. No hydrate formation was found for over 11.5 h when repeated experiments were carried out at an initial pressure of 6.4 MPa. These findings may be due to the higher driving force required for hydrate formation after the precipitation of wax crystals.
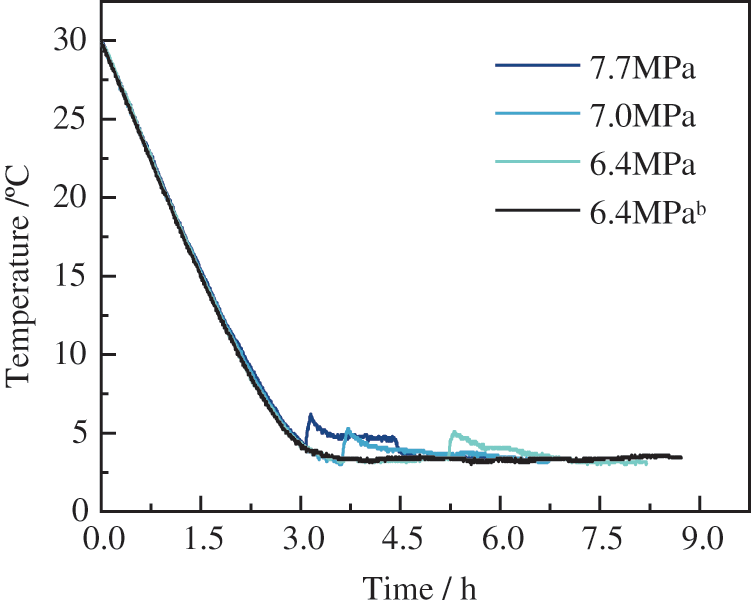
Figure 15: Temperature variation during the hydrate formation process with 4 wt% of wax present at different pressure
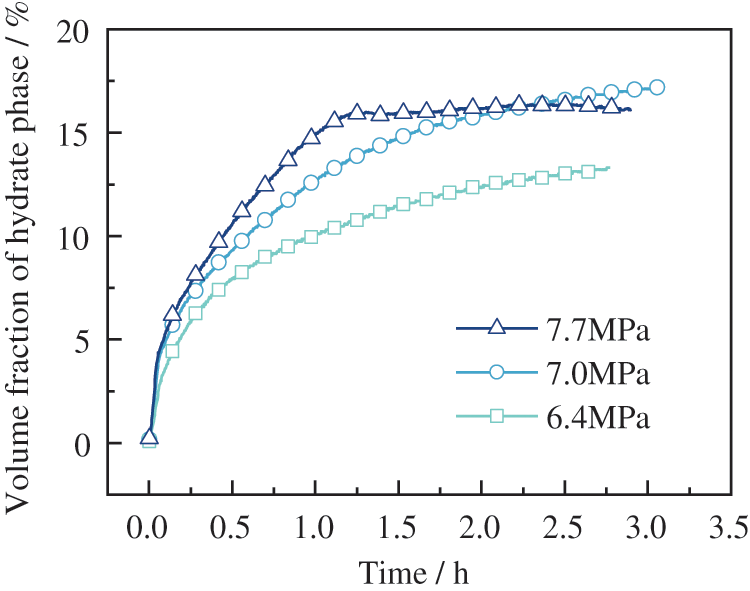
Figure 16: Variation of phase volume fraction in oil-in-water emulsion with wax content of 4 wt% under different pressure conditions
An experimental study of the properties of wax crystals on methane hydrate formation in oil-in-water systems has led to the following conclusions:
1. Both the formation of hydrate and the precipitation of wax crystals can lead to changes in torque in the reactor, with wax crystals precipitating before hydrate formation well above the hydrate formation temperature. Graphical and observational methods determined the phase equilibrium curves for hydrate formation, and it was found that wax crystals do not affect the phase boundaries of hydrates. Wax crystals tend to inhibit hydrate formation, diminishing the inhibitory effect at high pressures and rotational speeds.
2. Based on the temperature and pressure variation data collected during the experiment, the average gas consumption rate of hydrate is calculated using the thermodynamic equation of state, and the Biorthogonal basis function is introduced to reduce noise. The maximum rate of hydrate formation at high initial experimental pressure was slightly lower than that at low initial practical pressure, with the average value of the maximum rate of gas consumption for hydrate formation in each group being about 5.4 × 10⁻³ mol/s. The gas consumption rate stabilises at a low range after the rapid hydrate growth phase ends. Furthermore, the amount of hydrate formation increases with wax crystal content and pressure.
3. Secondary hydrate formation was observed several times during the experimental process, raising the risk of pipeline blockage. Hydrate formation was difficult at a wax content of 4 wt% at a pressure of 6.4 MPa, and the required driving force for hydrate formation was higher in wax-containing conditions.
Funding Statement: This work was supported by National Natural Science Foundation of China (Major Program No. U19B200052), Science and Technology Innovation Seedling Project of Sichuan Province, China (No. 2021079), National Natural Science Foundation Young Scientists Fund of China (No. 51904259) and School-Level Key Program of Chengdu Technological University, China (Nos. 2021ZR006; 2022ZR019).
Conflicts of Interest: The authors declare that they have no conflicts of interest to report regarding the present study.
References
1. Englezos, P. (2002). Clathrate hydrates. Industrial & Engineering Chemistry Research, 32(7), 1251–1274. https://doi.org/10.1021/ie00019a001 [Google Scholar] [CrossRef]
2. Song, G., Li, Y., Wang, W., Liu, S., Wang, X. et al. (2019). Experimental investigation on the microprocess of hydrate particle agglomeration using a high-speed camera. Fuel, 237(5), 475–485. https://doi.org/10.1016/j.fuel.2018.09.155 [Google Scholar] [CrossRef]
3. Wang, Y., Koh, C. A., Dapena, J. A., Zerpa, L. E. (2018). A transient simulation model to predict hydrate formation rate in both oil- and water-dominated systems in pipelines. Journal of Natural Gas Science and Engineering, 58, 126–134. https://doi.org/10.1016/j.jngse.2018.08.010 [Google Scholar] [CrossRef]
4. Wang, Z., Bai, Y., Zhang, H., Liu, Y. (2019). Investigation on gelation nucleation kinetics of waxy crude oil emulsions by their thermal behavior. Journal of Petroleum Science and Engineering, 181(7), 106230. https://doi.org/10.1016/j.petrol.2019.106230 [Google Scholar] [CrossRef]
5. Dendy Sloan Jr, E. (2003). Fundamental principles and applications of natural gas hydrates. Nature, 426(6964), 353–363. 10.1038/nature02135 [Google Scholar] [PubMed]
6. Zhang, J., Wang, Z., Liu, S., Zhang, W., Yu, J. et al. (2019). Prediction of hydrate deposition in pipelines to improve gas transportation efficiency and safety. Applied Energy, 253(5), 113521. https://doi.org/10.1016/j.apenergy.2019.113521 [Google Scholar] [CrossRef]
7. Gao, S. (2008). Investigation of interactions between gas hydrates and several other flow assurance elements. Energy & Fuels, 22(5), 3150–3153. https://doi.org/10.1021/ef800189k [Google Scholar] [CrossRef]
8. Mahabadian, M. A., Chapoy, A., Burgass, R., Tohidi, B. (2016). Mutual effects of paraffin waxes and clathrate hydrates: A multiphase integrated thermodynamic model and experimental measurements. Fluid Phase Equilibria, 427, 438–459. https://doi.org/10.1016/j.fluid.2016.08.006 [Google Scholar] [CrossRef]
9. Zhou, S. D., Yu, X. W., Jiang, K. (2018). Effect of wax crystal precipitation on the kinetic characteristics of hydrate formation. Natural Gas Industry, 38, 103–109. [Google Scholar]
10. Mu, L., Li, S., Ma, Q. L., Zhang, K., Sun, C. Y. et al. (2014). Experimental and modeling investigation of kinetics of methane gas hydrate formation in water-in-oil emulsion. Fluid Phase Equilibria, 362, 28–34. https://doi.org/10.1016/j.fluid.2013.08.028 [Google Scholar] [CrossRef]
11. Wang, W., Huang, Q. Y., Zheng, H. M., Wang, Q. C., Zhang, D. X. et al. (2020). Effect of wax on hydrate formation in water-in-oil emulsions. Journal of Dispersion Science and Technology, 41(12), 1821–1830. [Google Scholar]
12. Zhang, D., Huang, Q., Wang, W., Li, H., Zheng, H. et al. (2021). Effects of waxes and asphaltenes on CO2 hydrate nucleation and decomposition in oil-dominated systems. Journal of Natural Gas Science and Engineering, 88(44), 103799. [Google Scholar]
13. Zheng, H., Huang, Q., Wang, W., Long, Z., Kusalik, P. G. (2017). Induction time of hydrate formation in water-in-oil emulsions. Industrial & Engineering Chemistry Research, 56(29), 8330–8339. [Google Scholar]
14. Wang, W., Huang, Q., Zheng, H., Wang, Q., Zhang, D. et al. (2019). Effect of wax on hydrate formation in water-in-oil emulsions. Journal of Dispersion Science and Technology, 41(12), 1821–1830. [Google Scholar]
15. Zhang, D. X., Huang, Q. Y., Zheng, H. M., Wang, W., Cheng, X. W. et al. (2019). Effect of wax crystals on nucleation during gas hydrate formation. Energy & Fuels, 33(6), 5081–5090. [Google Scholar]
16. Liao, Q., Shi, B., Song, S., Duan, X., Yang, F. et al. (2022). Molecular insights into methane hydrate growth in the presence of wax molecules. Fuel, 324(9), 124743. https://doi.org/10.1016/j.fuel.2022.124743 [Google Scholar] [CrossRef]
17. Branco, V. A. M., Mansoori, G. A., de Almeida Xavier, L. C., Park, S. J., Manafi, H. (2001). Asphaltene flocculation and collapse from petroleum fluids. Journal of Petroleum Science and Engineering, 32(2–4), 217–230. https://doi.org/10.1016/S0920-4105(01)00163-2 [Google Scholar] [CrossRef]
18. Ji, H. (2005). Thermodynamic modelling of wax and integrated wax-hydrate (Ph.D. Thesis). Heriot-Watt University, Edinburgh, UK. [Google Scholar]
19. Wolden, M., Lund, A., Oza, N., Makogon, T., Argo, C. B. et al. (2005). Cold flow black oil slurry transport of suspended hydrate and wax solids. Fifth International Conference on Gas Hydrates (ICGH 5), Trondheim, Norway. [Google Scholar]
20. Liu, Y., Shi, B., Ding, L., Ma, Q., Chen, Y. et al. (2019). Study of hydrate formation in water-in-waxy oil emulsions considering heat transfer and mass transfer. Fuel, 244(7), 282–295. https://doi.org/10.1016/j.fuel.2019.02.014 [Google Scholar] [CrossRef]
21. Guo, P., Song, G., Ning, Y., Li, Y., Wang, W. (2021). Investigation on hydrate growth at oil-water interface: In the presence of wax. Energy & Fuels, 35(15), 11884–11895. https://doi.org/10.1021/acs.energyfuels.1c01173 [Google Scholar] [CrossRef]
22. Prasad, S. K., Sangwai, J. S. (2022). Rheology of cyclopentane sII hydrate slurry in water-in-model oil emulsions: Effect of surfactant concentration and water droplet size relevant for flow assurance. Energy & Fuels, 36(12), 6069–6082. https://doi.org/10.1021/acs.energyfuels.2c00473 [Google Scholar] [CrossRef]
23. Liu, Y., Lv, X. F., Ma, Q. L., Zhou, S. D., Shi, B. H. et al. (2022). Investigation on synergistic deposition of wax and hydrates in waxy water-in-oil (W/O) flow systems. Petroleum Science, 19(4), 1840–1852. https://doi.org/10.1016/j.petsci.2022.04.004 [Google Scholar] [CrossRef]
24. Yegya Raman, A. K., Aichele, C. P. (2017). Effect of particle hydrophobicity on hydrate formation in water-in-oil emulsions in the presence of wax. Energy & Fuels, 31(5), 4817–4825. https://doi.org/10.1021/acs.energyfuels.7b00092 [Google Scholar] [CrossRef]
25. Song, G., Ning, Y., Li, Y., Wang, W. (2020). Investigation on hydrate growth at the oil-water interface: In the presence of wax and kinetic hydrate inhibitor. Langmuir, 36(48), 14881–14891. https://doi.org/10.1021/acs.langmuir.0c02976 [Google Scholar] [PubMed] [CrossRef]
26. Almashwali, A. A., Bavoh, C. B., Lal, B., Khor, S. F., Jin, Q. C. et al. (2022). Gas hydrate in oil-dominant systems: A review. ACS Omega, 7(31), 27021–27037. https://doi.org/10.1021/acsomega.2c02278 [Google Scholar] [PubMed] [CrossRef]
27. Bavoh, C. B., Nashed, O., Khan, M. S., Partoon, B., Lal, B. et al. (2018). The impact of amino acids on methane hydrate phase boundary and formation kinetics. The Journal of Chemical Thermodynamics, 117, 48–53. https://doi.org/10.1016/j.jct.2017.09.001 [Google Scholar] [CrossRef]
28. Tabatabaei, A. R., Danesh, A., Tohidi, B., Todd, A. C. (2006). A consistent thermodynamic model for predicting combined wax-hydrate in petroleum reservoir fluids. Annals of the New York Academy of Sciences, 912(1), 392–402. https://doi.org/10.1111/(ISSN)1749-6632 [Google Scholar] [CrossRef]
29. Liu, Y., Shi, B., Ding, L., Yong, Y., Zhang, Y. et al. (2018). Investigation of hydrate agglomeration and plugging mechanism in low-wax-content water-in-oil emulsion systems. Energy & Fuels, 32(9), 8986–9000. https://doi.org/10.1021/acs.energyfuels.8b01323 [Google Scholar] [CrossRef]
30. Koh, C. A., Sum, A. K., Sloan, E. D. (2012). State of the art: Natural gas hydrates as a natural resource. Journal of Natural Gas Science and Engineering, 8, 132–138. https://doi.org/10.1016/j.jngse.2012.01.005 [Google Scholar] [CrossRef]
31. Krishna, S., Kumar, D., Dwivedi, V. K. (2022). Biorthogonal wavelets for multiresolution image compression. 2022 2nd International Conference on Power Electronics & IoT Applications in Renewable Energy and its Control (PARC), pp. 1–7. India, IEEE. [Google Scholar]
Cite This Article
 Copyright © 2023 The Author(s). Published by Tech Science Press.
This work is licensed under a Creative Commons Attribution 4.0 International License , which permits unrestricted use, distribution, and reproduction in any medium, provided the original work is properly cited.
 Downloads
 Citation Tools