
 Submit a Paper
 Propose a Special lssue
 Open Access
ARTICLE

Flexible Load Participation in Peaking Shaving and Valley Filling Based on Dynamic Price Incentives
1 Nanjing Power Supply Company, Nanjing, 210019, China
2 State Grid Jiangsu Electric Power Co., Ltd., Nanjing, 211103, China
* Corresponding Author: Jing Yu. Email:
Energy Engineering 2024, 121(2), 523-540. https://doi.org/10.32604/ee.2023.041881
Received 10 May 2023; Accepted 05 September 2023; Issue published 25 January 2024
 View Full Text
 Download PDF
Abstract
Considering the widening of the peak-valley difference in the power grid and the difficulty of the existing fixed time-of-use electricity price mechanism in meeting the energy demand of heterogeneous users at various moments or motivating users, the design of a reasonable dynamic pricing mechanism to actively engage users in demand response becomes imperative for power grid companies. For this purpose, a power grid-flexible load bilevel model is constructed based on dynamic pricing, where the leader is the dispatching center and the lower-level flexible load acts as the follower. Initially, an upper-level day-ahead dispatching model for the power grid is established, considering the lowest power grid dispatching cost as the objective function and incorporating the power grid-side constraints. Then, the lower level comprehensively considers the load characteristics of industrial load, energy storage, and data centers, and then establishes a lower-level flexible load operation model with the lowest user power-consuming cost as the objective function. Finally, the proposed method is validated using the IEEE-118 system, and the findings indicate that the dynamic pricing mechanism for peaking shaving and valley filling can effectively guide users to respond actively, thereby reducing the peak-valley difference and decreasing users’ purchasing costs.Keywords
Nomenclature
| Indices | |
| i, j | Indices of all nodes |
| v | Indices of all generators |
| t | Indices of periods |
| d | Index of electricity demands |
| N | Index of different kinds of load |
| L | Index of industrial load |
| C | Index of storage stations |
| D | Index of data centers |
| Variables and Functions | |
| The active generation of generator | |
| The transmission capacity of the line between node | |
| Voltage angle of node | |
| The variation of load | |
| The unit electricity consumption cost of load | |
| The interactive data allocated to data center d at time t | |
| The batch processing data allocated to data center d at time | |
| The data storage capacity of the data center | |
| The total batch processing data processed by data center d at time | |
| Refrigerating active power of data center d at time t | |
| IT power consumption of data centers d at time t | |
| The consumption of electricity demand | |
| Parameters and Constants | |
| The feed-in tariff of generator | |
| The susceptance of the line between node | |
| The maximum transmission capacity of line allowed between node | |
| The maximum active generation of generator | |
| The ramping coefficient of generators | |
| The average load at various times of a day | |
| The target of the power grid’s peaking shaving and valley filling | |
| m | The penalty considering the comfort level of industrial users |
| The cost coefficient of energy storage station charge and discharge amount | |
| The upper and lower adjustable limit of the load | |
| The charging and discharging velocity limit coefficient of the energy storage station | |
| The maximum capacity of the energy storage station | |
| The total interactive data demand generated by users at time | |
| The total batch processing data demand generated by users at time | |
| The transmission bandwidth from front-end serves to data center d | |
| The maximum data storage capacity of data center d | |
| The correlation coefficient of batch processing data processing capacity limit of data center | |
| The conversion coefficient between the processing amount of data and electricity consumption | |
| The thermal resistance of data center | |
| The indoor and outdoor temperatures of the data center | |
| The upper and lower limits of the data center’s indoor temperature | |
In November 2021, a document on “Guiding Opinions on Accelerating the Construction of a National Unified Electricity Market System” was considered and adopted by the 22nd Meeting of the Central Committee for Comprehensively Deepening Reform. The importance of actively promoting the establishment and improvement of the electricity price system and guiding user participation in demand-side response through reasonable pricing to reduce the peak-valley difference is strongly emphasized in the document. As society advances, there is an increase in electricity demand, and the widening of the peak-valley difference in the power grid is observed. Meanwhile, the increasing proportion of renewable energy sources such as wind and photovoltaic power year by year contributes to further widening the uncertainty in the peak-valley difference in the power grid [1–5]. However, an excessive widening of this difference could result in stress on the power supply during peak hours and a decrease in power supply reliability. Given the inability to store electricity on a large scale, conventional power grids address power supply stress by increasing investment in infrastructure equipment to ensure real-time power balance. Nevertheless, this approach generally results in overinvestment and inefficient utilization of social resources.
The reliability of microgrids can be enhanced by wind-solar hybrid power generation. Apart from this, to address this issue, ensure power system stability, enhance the renewable energy accommodation capability of the power grid, reduce the peak-valley difference in the power system, and delay constructive investment of the power grid, the concept of demand-side management (DSM) was introduced. The concept of electrical DSM was proposed by the American Electric Power Research Institute in the 1980s [6], and it has gained increased significance in enhancing system reliability [7].
Users responding to price signals or incentive mechanisms to alter their conventional electricity consumption methods constitute a demand-side response [8]. This behavior has found extensive application in the electric power market, particularly with the widespread integration of intelligent facilities such as smart electrical equipment and advanced metering infrastructure. These technologies enable independent system operators to achieve more detailed and accurate demand-side responses [9]. Demand-side response encompasses two primary types: incentive-based and price-based demand-side responses [10,11], with time-of-use (TOU) electricity price serving as a crucial approach to achieving demand-side response. Most existing literature concentrates on TOU electricity prices. For instance, in reference [12], a mixed optimization strategy involving a genetic algorithm and mixed integer linear programming is proposed. By comparing the results of optimized and unoptimized cases, the study confirms that the TOU electricity price not only reflects the value of electricity but also has positive guiding effects on user behavior. In reference [13], power demand price elasticity is employed to assess changes in users’ electricity consumption due to fluctuating electricity prices. This establishes a model for users’ response to TOU electricity prices, and the impact of demand response under optimized TOU electricity prices is analyzed using a soluble ideal of a genetic algorithm. The implementation mechanism of peak electricity prices is theoretically explored in reference [14] using a price elasticity matrix to measure users’ responses to peak electricity prices. The study analyzes optimal implementation strategies for peak electricity prices and validates the effectiveness of the method through simulation examples.
Users’ behavior of electricity consumption can be effectively guided by a reasonable peak-valley TOU price. Important research gaps have been identified despite the substantial body of existing literature. First, since the implementation of TOU in some regions, the setting of time intervals and TOU prices have remained unchanged for several years. The energy demand of diverse users at different times or the motivation of users cannot be addressed by the existing fixed TOU electricity price mechanism. With the rapid development of smart grid construction, the interactive response ability of users is advancing; therefore, the establishment of a dynamic adjustment mechanism for the division of time intervals and TOU prices becomes necessary. Relevant research has been conducted by scholars in this regard. In reference [15], a qualitative econometric model of large user response to TOU was proposed but without a quantitative description. Second, the load model constructed in the existing literature is too simple and does not consider more load types. For instance, reference [16] proposed a double-layer optimization model for peak-valley TOU price by electricity-selling enterprises and verified that the obtained peak-valley TOU pricing package could guarantee the interests of both parties and effectively guide industrial users toward reasonable electricity use that cut peak and fill valleys. However, the load model type is single, necessitating the incorporation of more types of loads to simulate real market conditions. A method of demand modeling for the electricity market involving the application of day-ahead real-time pricing is proposed in reference [17]. However, the demand model failed to consider the various market entities in our daily lives. In reference [18], a parametrized meta-strategy for dynamic pricing was proposed, and suitable strategies for given scenarios were identified through offline optimization using a population model. Nevertheless, the reliance on accurately obtaining suitable parameters based on the population and job distribution makes this model challenging. In reference [19], an approach based on elasticity transfer and reinforcement learning was proposed, but this model is difficult to solve by existing commercial/free solvers. Reference [20] investigated real-time pricing problems based on switched Markov chain models and welfare maximization, but with the assumption that the utility parameter is constant. However, the utility parameter for each consumer may be private, potentially rendering the method challenging to apply in practical situations. Reference [21] investigated the contribution of real-time pricing to the effects of charging electric cars but failed to investigate the impacts of load demand with high price elasticity.
In this study, a power grid-flexible load bi-level operation model based on dynamic price is constructed to enhance the activity of the demand side, reduce the peak-valley difference, and enhance the security of the power grid. The optimization objective of the upper layer model is the lowest dispatching cost of the power grid, and the constraints of power grid operation security are considered. The optimization objective of the lower model is the lowest power purchase cost for users. In the lower model, various flexible loads (such as industrial loads, energy storage, and data centers) are considered in the simulation of actual scheduling, and various users are considered in the subsequent example analysis. The dynamic price is investigated to motivate the demand side and quantify the day-head dispatchable potential of the demand side. The pseudocode algorithm was employed to iteratively solve the two-layer model, and the findings demonstrate that the TOU tariff mechanism can ensure the interests of both parties and effectively guide the users’ electricity consumption behavior.
2 Power Grid-Flexible Load Bi-Level Operation Model Based on Dynamic Price
2.1 Analysis of Bi-Level Model Framework
In the actual power grid operation process, the load curve is obtained by the dispatching center through the capacity reported by power generators and the historical electricity consumption data of users. Subsequently, the electricity price is determined through market clearing and is then released to users. This electricity price can guide users’ purchasing behavior and optimize the load curve. Under the dynamic price mechanism, the load can provide real-time feedback regarding the actual load quantity to the dispatching center. After getting this real-time and accurate load information, the dispatching center can once again obtain a new TOU electricity price through market clearing. The new TOU electricity price can effectively guide customers to use electricity more orderly and make decisions to maximize social welfare. As shown in Fig. 1.

Figure 1: Schematic diagram of bi-level optimization
Bi-level planning is an approach that simultaneously represents upper and lower levels [22–25]. The concept of bi-level optimization has been adopted by numerous existing research. For instance, in reference [26], the dynamic pricing problem in both the electricity and natural gas retail markets is investigated under existing network constraints by establishing a “dual leader multi-follower” bi-level model. The researchers transformed the original model into an equilibrium problem with equilibrium constraints, and the effectiveness of the approach is verified by testing the results of the simulations. In reference [27], a coordination and optimization method for energy storage and electricity price is developed, enhancing the local consumption capacity of renewable energy through the construction of a source-load-storage bi-level optimization model. In the context of an electricity market environment, reference [28] developed a microgrid bi-level economic dispatching optimization model, demonstrating that microgrids can achieve improved economic benefits under the electricity market competition using this model. Furthermore, in reference [29], a bi-level optimal low-carbon economic operation model for the regional integrated energy system was proposed, and the numerical results demonstrate that the optimal operating model with the proposed carbon pricing method can effectively reduce carbon emissions.
The price of commercial electricity is no longer fixed for flexible load and load aggregators. Under the demand response mechanism, the marginal cost of flexible load and load aggregator will vary at different times. The cost of load energy consumption is high at the peak of load demand, whereas the cost of load energy consumption is low at the valley of load demand. Leveraging the flexible and adjustable characteristics of load to respond to demand can reduce the energy consumption cost of users and reduce the peak-valley difference in the grid.
In single-level optimization, private information of generators and consumers must be transmitted to the dispatch center, leading to significant privacy information leakage. To address this issue, this study adopts a two-layer optimization model that only necessitates the transfer of the lower-level demand, thereby alleviating privacy concerns.
2.2 Upper-Level Day-Ahead Dispatching Model for Power Grid
In the upper-level optimization model, the aim is to minimize the power grid dispatching cost, as defined in Eq. (1).
Here, the composition of the dispatching cost only includes the generation cost, while the start-up and shut-down costs of the unit are not considered, and the unit cost of electricity generation is assumed to be fixed.
Eq. (2) represents the transmission power balance constraints for various lines. Eq. (3) represents the linearized power flow constraints for various lines. Eq. (4) limits the transmission power balance across different lines. Eq. (5) establishes the lower and upper limits on the active production of each generator. Eq. (6) limits the ramping rate of each generator. Eq. (7) represents the target constraints for the power grid’s peaking shaving and valley filling.
2.3 Lower-Level Flexible Load Operation Model
The performance of demand response projects is significantly influenced by participant rates, consumers’ response characteristics, and their abilities [30]. In this study, a lower-level flexible load operation model is constructed to simulate the actual operation scenarios. In the case of day-ahead scheduling, a specific amount of translation occurs in each task period. In the lower level, the aim is to minimize the users’ purchasing cost while considering the comfort level penalty, as illustrated in Eq. (8).
The accuracy of the experimental results is determined by the accuracy of the lower-level load model and constraints.
Industrial load, often characterized as a continuous production load, has the following advantages when participating in demand response:
1) large load capacity, which can provide a substantial dispatchable demand response capacity;
2) stable load demand, which has a high controllable degree;
3) centralized load distribution, which can be managed centrally.
Eq. (9) represents the quantity of shiftable load in a single time, while Eq. (10) represents the total day-ahead consumption of electricity demand.
Here,
As the peak-valley difference in the power grid gradually increases, meeting the requirements of the secure and economical operation of the power grid only through the original generation-side active power regulation method becomes challenging. As modern electric power technology and materials science continue to advance, energy storage battery technology has gradually emerged as a crucial method for active power regulation of the power grid. This method can effectively achieve DSM, mitigate peak-valley load differences, and enhance the utilization and economic benefits of the power system.
Eq. (11) represents the charging and discharging velocity of energy storage station d at time
A data center is an entity comprising computer sites, infrastructure, software and hardware information resources of information systems, etc. Recently, the growth of the digital economy has led to continuous expansion in both the individual scale and the number of data centers. However, as the “major energy consumer,” the electricity consumption of data centers currently constitutes approximately 3% of global electricity consumption, and it is growing rapidly at the rate of over 10% yearly. Based on users’ different time limit requirements for data processing, data can be categorized into two types: batch processing data and interactive data, where interactive data has a low delayed tolerance and must be processed timely, whereas batch processing data has a high delayed tolerance and can be postponed. Furthermore, data can be transferred between various data centers, facilitating transfer from areas with power supply shortages to areas with surplus power supply. Due to the spatial-temporal adjustable characteristics of data centers, they can be seen as a crucial load participating in demand response. Reference [31] introduced the energy consumption structure and the basic model of energy consumption cost optimization of data centers. Reference [32] summarized the implementation approaches and scope of TOU at home and abroad, discussed the limitations of the TOU system, and proposed suggestions and ideas for developing TOU.
The following assumptions were made so that the final model is linear: the differences in server power consumption in complex multi-working conditions and server power consumption in standby conditions are not considered. Instead, the IT power consumption of the server changes linearly with the amount of data processed. A detailed model is desirable but would result in model intractability. Our selection achieves a balance between model accuracy and solvability.
The model of a data center can be constructed as follows:
The distribution of interactive data and batch processing data at time
The power consumption for calculating within the data center is associated with the amount of data effectively processed by the data center, which can be formulated as follows:
In summary, a two-layer model power grid-flexible load bi-level operation model based on dynamic price was proposed. The upper level encompasses the day-ahead dispatching model for the power grid, incorporating Eqs. (1)–(7). The lower level comprises a flexible load operation model, encompassing Eqs. (8)–(24).
In the proposed framework, even though the upper- and lower-levels involve different decision variables (electricity price and electricity consumption), they are interrelated. The flexible load in the lower-level adjusts its electricity consumption behavior based on the TOU electricity price released by the upper-level power grid dispatching to achieve the lowest electricity purchase cost. The goal is to determine an optimal TOU price that balances and optimizes the dispatching cost of the upper-level grid and the purchasing cost of the lower-level flexible load. Under this equilibrium, no system operators can identify a unilateral deviation to reduce self-operating costs. In this study, the bi-level model is solved by iteratively updating variables (TOU price, and the subsequent change in lower-level users’ electricity consumption) to obtain the operation equilibrium, the optimal TOU price, and actual users’ electricity consumption information. It is important to note that this problem is convex and can be solved efficiently.
As shown in Table 1. Algorithm 1 presents the pseudocode for solving the proposed model. In line 1, the algorithm has two inputs:
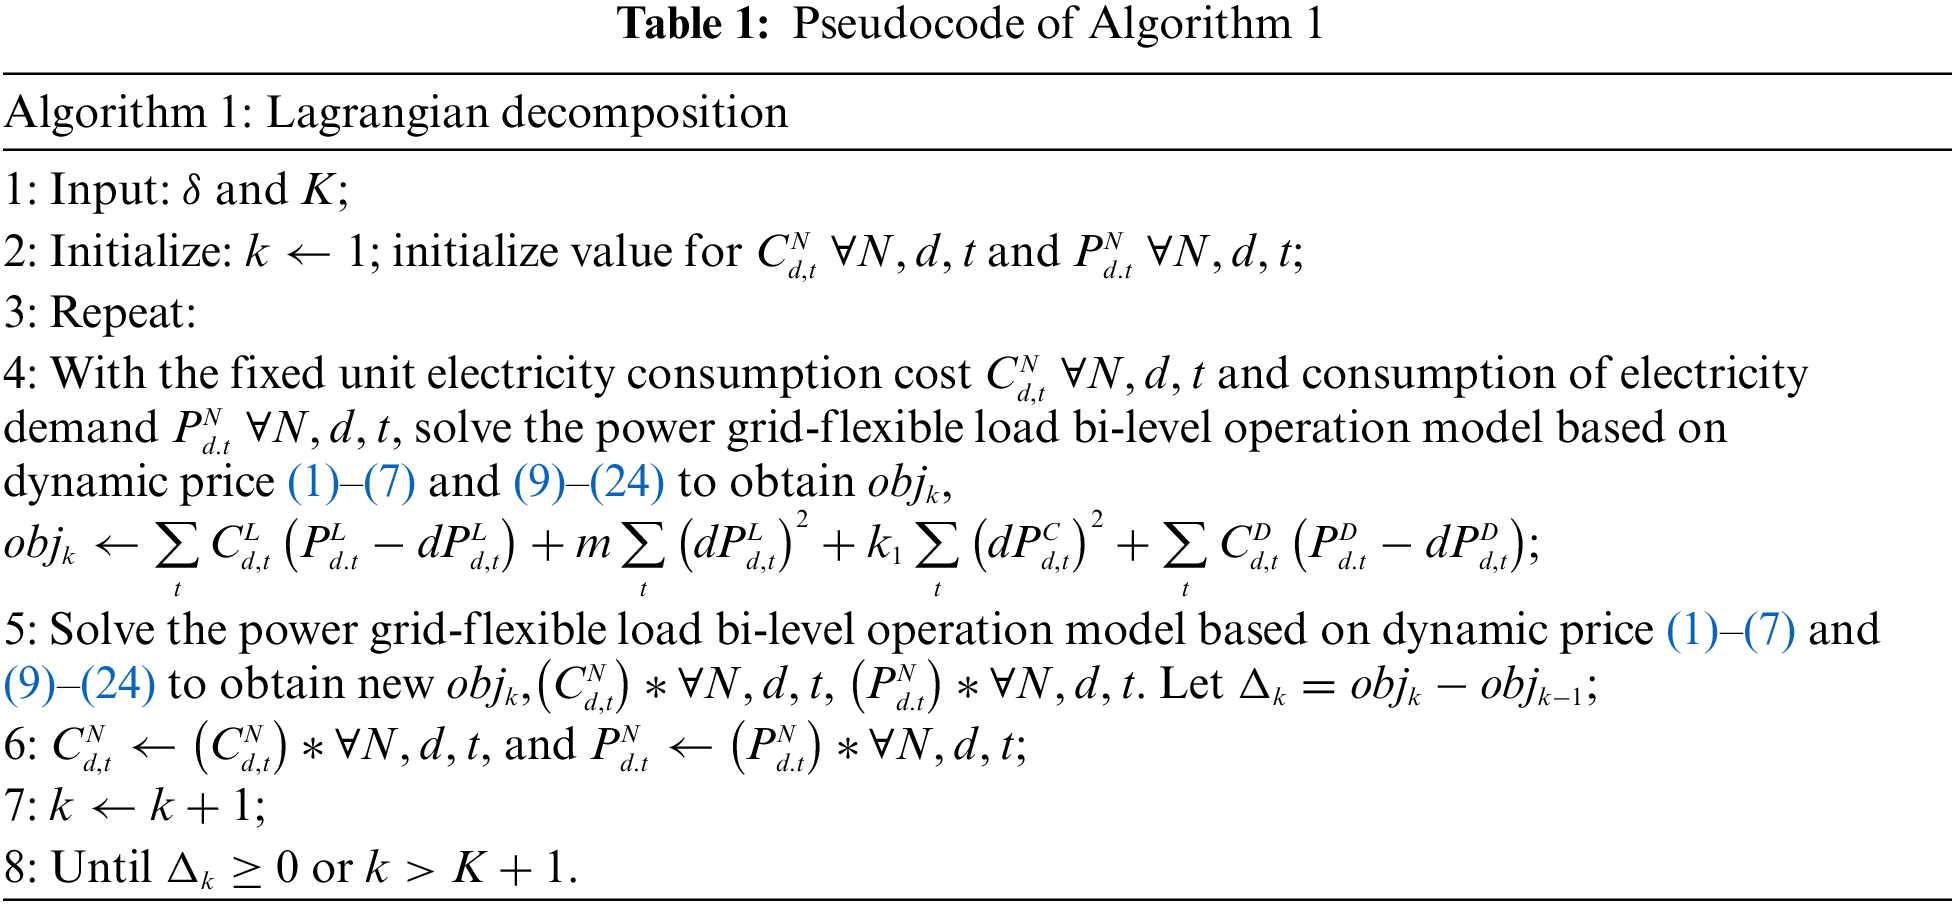
Finally, it is worth noting that the convergence of this Lagrangian algorithm has been analyzed in [33].
This study uses the IEEE-18 system, and data are sourced from matpower, employing the CONOPT solver in GAMS for simulation. The hardware environment of the testing system was AMD-5600H Radeon R5 3.30 GHz and its memory was 16 GB. Fig. 2 illustrates the topology of the test system.

Figure 2: Topology of the IEEE 118-bus test system
4.1 Interactive Peak-Shaving Effect Analysis under Dynamic Price
First, a comparison is made between the results regulated by dynamic price and those regulated by fixed price. Here, the fixed TOU electricity price employs Tianjin TOU electricity price data, and the comparison result is illustrated in Fig. 3.

Figure 3: Comparison of TOU and dynamic electricity prices
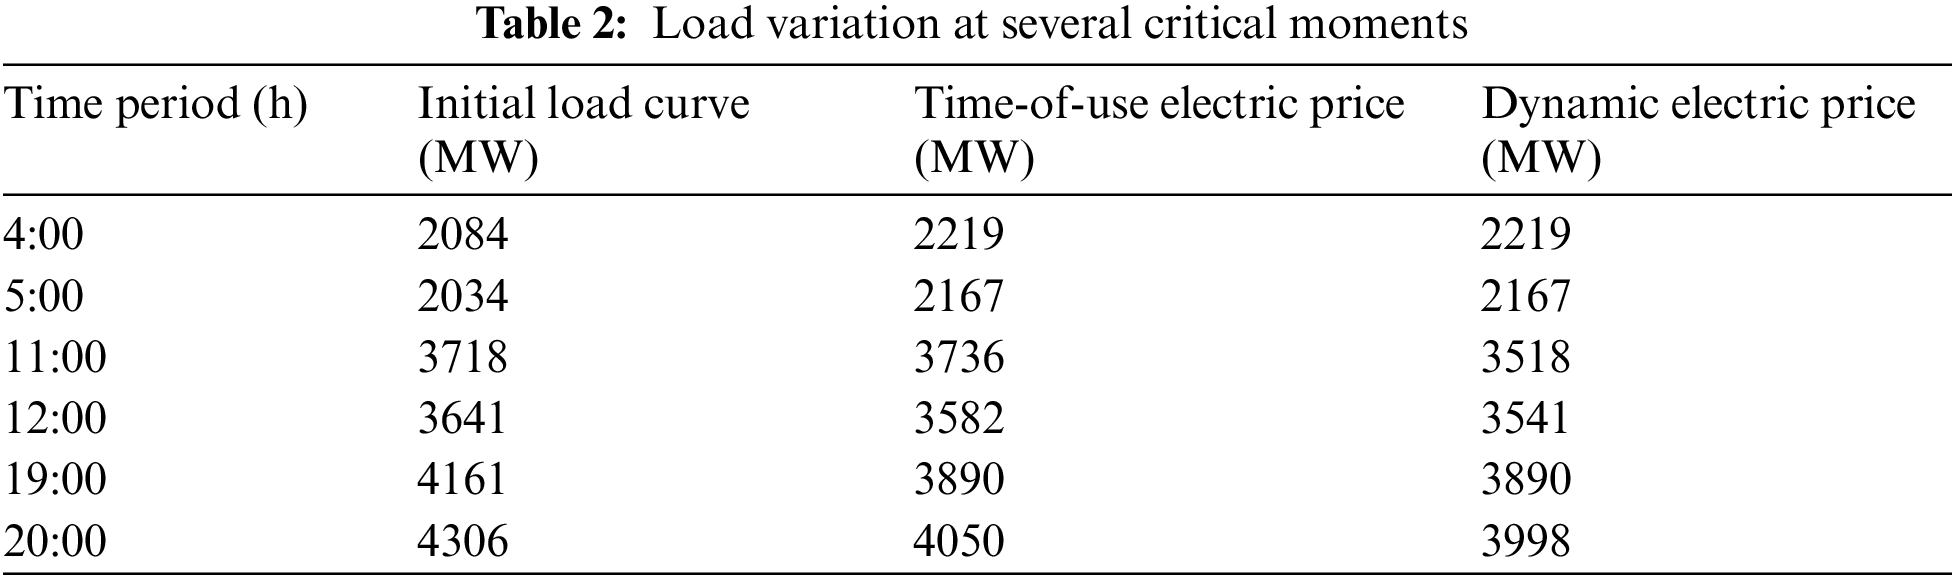
The variation of the load curve under the two pricing schemes is illustrated in Fig. 4, and the detailed peak shaving and valley filling at the crucial moment are summarized in Table 2.

Figure 4: Variation of load curve in different scenarios
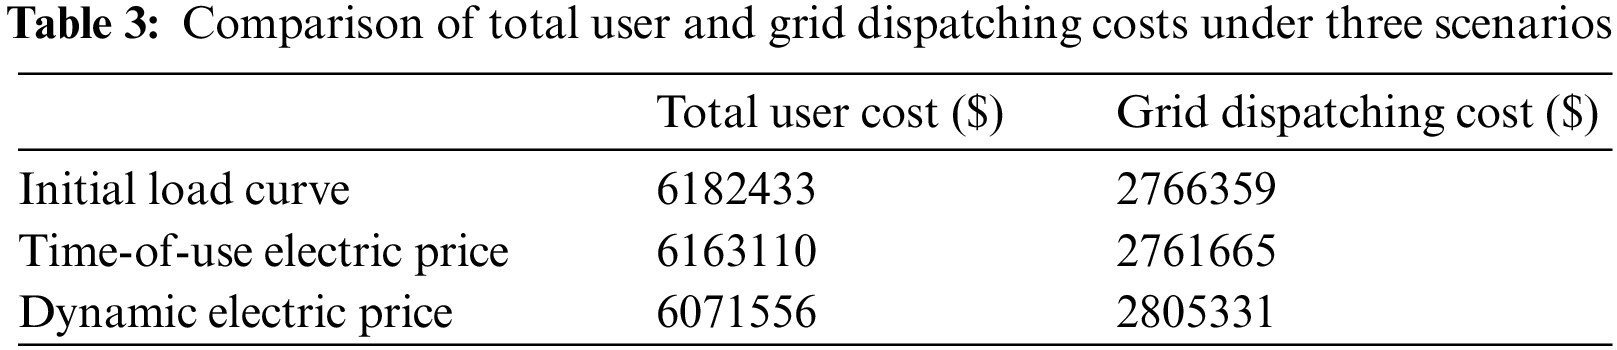
The users’ electricity purchasing and power grid dispatching costs under three different situations are shown in Table 3.
Mitigating the peak-valley difference can alleviate the power supply pressure, enhance power supply reliability, and improve the efficiency of power resource use. Meanwhile, excessive peak-valley differences can impact the formulation of TOU. Thus, this study employs the peak-valley difference as the evaluation criterion.
Based on the above findings, it can be observed that the peak-valley difference under the dynamic pricing mechanism reduces by 1.31% compared with that under the fixed pricing mechanism. Furthermore, users’ electricity purchasing costs reduce by 1.48%. Here, the peak-valley difference refers to the difference between the peak load consumption and valley load consumption in a complete period, specifically a day.
4.2 Analysis of Impact Caused by Load Comfort Level Penalty
When consumers participate in demand response, they might decrease electricity consumption at peak times and increase it at bottom times, thereby impacting users’ comfort levels. In this regard, a comfort level penalty is incorporated into users’ electricity purchasing costs, and the impacts of different comfort level penalties on regulation results are discussed below.
The load curve under three comfort level penalties is illustrated in Fig. 5.

Figure 5: Variation of load curve under different load comfort level penalty
Fig. 6 shows the users’ electricity purchasing costs under different penalty coefficients.

Figure 6: Cost of purchasing electricity under different penalty coefficients
As the load comfort level penalty coefficient increases, users’ willingness to participate in demand response decreases. Compared to the case when m = 1, the peak-valley difference in the power grid when m = 5 reduces by 1.31%; while that when m = 20 reduces by 0.82%. With an increase in m, users’ electricity purchasing costs also experience an initial increase. With a further increase in m, users’ electricity purchasing cost might decrease because users’ willingness to participate in demand response and comfort level penalty are both decreasing.
4.3 Impact of Demand Level on Dynamic Price
The results are subsequently tested under various types of load curves that consider heterogeneous users and their different electricity consumption behavior.
4.3.1 20% Reduced Level of Demands
This subsection analyzes the situation where the load is reduced by 20%, and the findings are illustrated in Fig. 7.

Figure 7: Comparison of TOU and dynamic electricity prices
As shown in Fig. 8, Tables 4 and 5, it was discovered that the peak-valley difference under the dynamic price mechanism decreases by 1.07% compared with that under the fixed TOU electricity price mechanism, and users’ electricity purchasing cost also reduces by 1.21%. The decreasing proportion of the peak-valley difference between the power grid and users’ electricity purchasing costs are both lower than that in the base case when the load reduces by 20%. Thus, the dynamic price mechanism proposed in this study exhibits more obvious effects on peak shaving and valley filling when the power grid is overloaded.
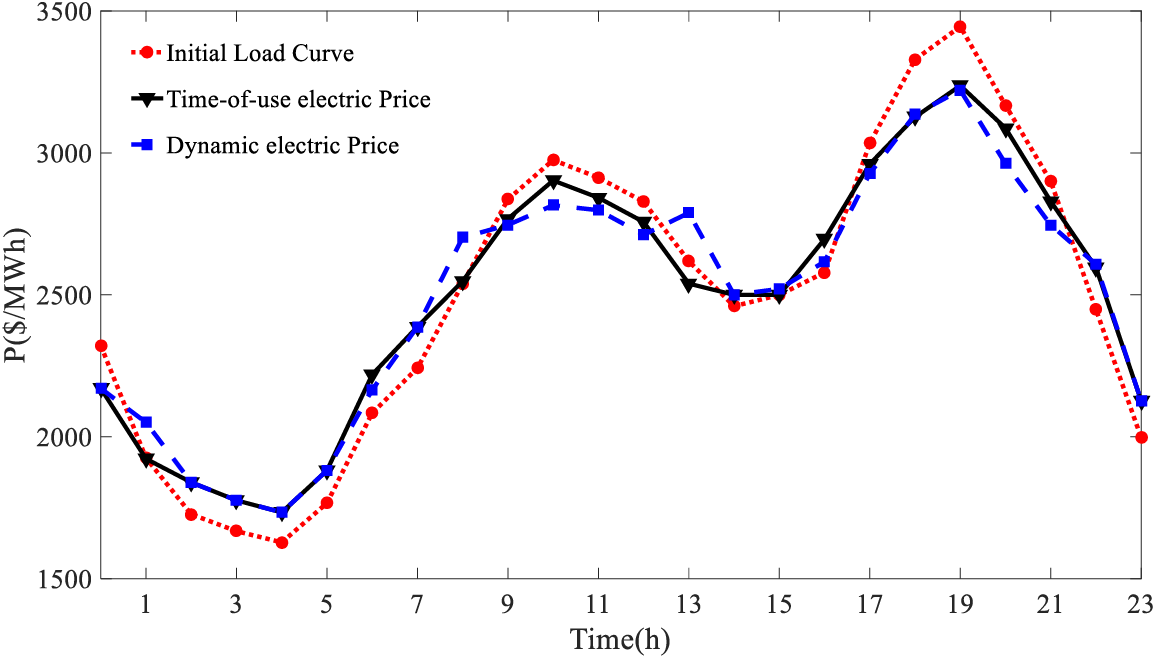
Figure 8: Variation of load curve in different scenarios


4.3.2 Special Load Curve in Summer
Unlike the common double peak and valley daily load curve, the typical weekday load curve in summer exhibits a distinct triple peak and valley. Here, the fixed TOU electricity price employs Guangdong Province TOU electricity price data and introduces the concept of a critical peak price in summer. The price at the critical peak moment of the load curve increases by 25% compared with the peak price. The findings are illustrated in Fig. 9.

Figure 9: Comparison of TOU and dynamic electricity price
The concrete data after adjustment are illustrated as follows:
As shown in Fig. 10, Tables 6 and 7, it was discovered that the peak-valley difference under the dynamic price mechanism decreases by 1.44% compared with that under the fixed TOU electricity price mechanism, and users’ electricity purchasing cost also reduces by 2.76%.

Figure 10: Variation of load curve in different scenarios


As electricity demand increases and the proportion of renewable energy expands, the widening of the peak-valley difference in a power grid becomes evident. To address this problem, a power grid-flexible load bilevel model based on dynamic prices is proposed in this study. The upper-level day-ahead dispatching model is designed to reduce the power grid dispatching costs, while the lower-level flexible load operation model considers the operation characteristics of the industrial loads, data centers, and power storage. The conclusions obtained from the simulation are summarized as follows:
(1) A power grid-flexible load bilevel model based on dynamic price is constructed in this study while considering the influence of peaking shaving and valley filling on the load-side comfort level. The optimal dispatch is achieved considering load-side peak shaving and valley filling incentive subsidy-comfort level economic penalties.
(2) A dynamic price incentive mechanism for peak shaving and valley filling is proposed in this study. The dynamic price mechanism can thoroughly explore the potential of the flexible load in participating in peak shaving and valley filling compared with the conventional fixed price mechanism.
(3) Based on the findings, the power grid-flexible load bi-level operation model based on the dynamic price proposed in this study can reduce the dispatching cost of the power grid and save energy costs for users. This model is conducive to achieving a mutually beneficial interaction between the power grid and users.
In future research, the flexibility of multi-energy demands and mobile energy storage could be considered. In addition, the market power exercised by various market entities will be considered.
Acknowledgement: This work was supported in part by Technology Project of State Grid Jiangsu Electric Power Co., Ltd., China. The authors would like to thank Dr. Sheng Chen from Hohai University for his support.
Funding Statement: This work was supported in part by Technology Project of State Grid Jiangsu Electric Power Co., Ltd., China, under Grant J2022011.
Author Contributions: WJ: methodology, software, validation, formal analysis, writing-original draft, and visualization. LW: investigation, conceptualization, methodology, and writing-review editing. JY: conceptualization, resources, and supervision.
Availability of Data and Materials: The original contributions presented in the study are included in the article materials, further inquiries can be directed to the corresponding author.
Conflicts of Interest: The authors declare that the research was conducted in the absence of any commercial or financial relationships that could be construed as a potential conflict of interest.
References
1. Hassan, M. A. S., Assad, U., Farooq, U., Kabir, A., Khan, M. Z. et al. (2022). Dynamic price-based demand response through linear regression for microgrids with renewable energy resources. Energies, 15(4), 1385. [Google Scholar]
2. Wang, B., Deng, K., He, L., Sun, Z. (2021). Behaviors of multi-stakeholders under China’s renewable portfolio standards: A game theory-based analysis. Energy Engineering: Journal of the Association of Energy Engineering, 118(5), 1333–1351. [Google Scholar]
3. Fu, X. (2022). Statistical machine learning model for capacitor planning considering uncertainties in photovoltaic power. Protection and Control of Modern Power Systems, 7(1), 5. [Google Scholar]
4. Huang, S., Wu, Q., Shahidehpour, M. (2019). Dynamic power tariff for congestion management in distribution networks. IEEE Transactions on Smart Grid, 10(2), 2148–2157. [Google Scholar]
5. Lu, Y., Xiang, Y., Huang, Y., Yu, B., Weng, L. et al. (2023). Deep reinforcement learning based optimal scheduling of active distribution system considering distributed generation, energy storage and flexible load. Energy, 271, 127087. [Google Scholar]
6. Gellings, C. W. (1996). Then and now: The perspective of the man who coined the term ‘DSM’. Energy Policy, 24(4), 285–288. [Google Scholar]
7. Cheng, L., Zang, H., Wei, Z., Sun, G. (2022). Secure multi-party household load scheduling framework for real-time demand-side management. IEEE Transactions on Sustainable Energy, 14(1), 602–612. [Google Scholar]
8. Kirschen, D. S. (2003). Demand-side view of electricity markets. IEEE Transactions on Power Systems, 18(2), 520–527. [Google Scholar]
9. Talari, S., Shafie-Khah, M., Siano, P., Loia, V., Tommasetti, A. et al. (2017). A review of smart cities based on the internet of things concept. Energies, 10(4), 421. [Google Scholar]
10. Aalami, H. A., Moghaddam, M. P., Yousefi, G. R. (2010). Modeling and prioritizing demand response programs in power markets. Electric Power Systems Research, 80(4), 426–435. [Google Scholar]
11. Miranbeigi, M., Iman-Eini, H. (2016). Hybrid modulation technique for grid-connected cascaded photovoltaic systems. IEEE Transactions on Industrial Electronics, 63(12), 7843–7853. [Google Scholar]
12. Lin, L. (2016). Method of setting TOU price for large power users. Beijing, China: North China Electric Power University (In Chinese). [Google Scholar]
13. Jia, L., Tong, L. (2016). Dynamic pricing and distributed energy management for demand response. IEEE Transactions on Smart Grid, 7(2), 1–9. [Google Scholar]
14. Moghaddam, M. P., Abdollahi, A., Rashidinejad, M. (2011). Flexible demand response programs modeling in competitive electricity markets. Applied Energy, 88(9), 3257–3269. [Google Scholar]
15. Zhang, C., Wang, Q., Wang, J. (2017). Real-time procurement strategies of a proactive distribution company with aggregator-based demand response. 2017 IEEE Power & Energy Society General Meeting, pp. 766–776. Chicago, IL, USA. [Google Scholar]
16. Talari, S., Shafie-khah, M., Wang, F., Aghaei, J., Catalão, J. P. S. (2019). Optimal scheduling of demand response in pre-emptive markets based on stochastic bilevel programming method. IEEE Transactions on Industrial Electronics, 66(2), 1453–1464. [Google Scholar]
17. Ma, Q., Zeng, X. J. (2015). Demand modelling in electricity market with day-ahead dynamic pricing. IEEE International Conference on Smart Grid Communications (SmartGridComm), pp. 97–102. Miami, USA. [Google Scholar]
18. Höning, N., La Poutré, H. (2013). Reducing electricity consumption peaks with parametrised dynamic pricing strategies given maximal unit prices. 24th International Workshop on Database and Expert Systems Applications, pp. 171–175. Los Alamitos, USA. [Google Scholar]
19. Kong, D., Kong, X., Xiao, J., Zhang, J., Li, S. et al. (2019). Dynamic pricing of demand response based on elasticity transfer and reinforcement learning. 22nd International Conference on Electrical Machines and Systems (ICEMS), pp. 1–5. Harbin, China. [Google Scholar]
20. Kobayashi, K. (2016). Optimal real-time pricing of electricity based on switched markov chain models and welfare maximization. 4th International Conference on Cyber-Physical Systems, Networks, and Applications (CPSNA), pp. 35–39. Nagoya, Japan. [Google Scholar]
21. Skolthanarat, S., Somsiri, P., Tungpimolrut, K. (2019). Contribution of real-time pricing to impacts of electric cars on distribution network. Industry Applications Society Annual Meeting, pp. 1–5. Baltimore, USA. [Google Scholar]
22. Carrión, M., Arroyo, J. M., Conejo, A. J. (2009). A bilevel stochastic programming approach for retailer futures market trading. IEEE Transactions on Power Systems, 24(3), 1446–1456. [Google Scholar]
23. Kardakos, E. G., Simoglou, C. K., Bakirtzis, A. G. (2015). Optimal offering strategy of a virtual power plant: A stochastic bi-level approach. IEEE Transactions on Smart Grid, 7(2), 794–806. [Google Scholar]
24. Bakirtzis, A. G., Ziogos, N. P., Tellidou, A. C., Bakirtzis, G. A. (2007). Electricity producer offering strategies in day-ahead energy market with step-wise offers. IEEE Transactions on Power Systems, 22(4), 1804–1818. [Google Scholar]
25. Taheri, I., Rashidinejad, M., Badri, A., Rahimi-Kian, A. (2014). Analytical approach in computing nash equilibrium for oligopolistic competition of transmission-constrained GENCOs. IEEE Systems Journal, 9(4), 1452–1462. [Google Scholar]
26. Chen, S., Sun, G., Wei, Z., Wang, D. (2020). Dynamic pricing in electricity and natural gas distribution networks: An EPEC model. Energy, 207, 118138. [Google Scholar]
27. Jiang, X. B., Tang, B., Yu, G. Z. (2021). Coordination and optimization method of park energy storage and electricity price for local consumption of renewable energy. Automation of Electric Power Systems, 46(5), 51–64 (In Chinese). [Google Scholar]
28. Xie, J. D., Lu, W. Q., Lv, Z. W. (2020). Optimization model of bi-level economic operation of microgrid in electricity market environment. Modern Electric Power, 37(4), 433–440 (In Chinese). [Google Scholar]
29. Xiong, Z., Luo, S., Wang, L., Jiang, C., Zhou, S. et al. (2022). Bi-level optimal low-carbon economic operation of regional integrated energy system in electricity and natural gas markets. Frontiers in Energy Research, 10, 959201. [Google Scholar]
30. Talari, S., Shafie-Khah, M., Wang, F., Aghaei, J., Catalao, J. P. (2017). Optimal scheduling of demand response in pre-emptive markets based on stochastic bilevel programming method. IEEE Transactions on Industrial Electronics, 66(2), 1453–1464. [Google Scholar]
31. Dayarathna, M., Wen, Y., Fan, R. (2015). Data center energy consumption modeling: A survey. IEEE Communications Surveys & Tutorials, 18(1), 732–794. [Google Scholar]
32. Alabdulwahab, A., Abusorrah, A., Zhang, X., Shahidehpour, M. (2015). Coordination of interdependent natural gas and electricity infrastructures for firming the variability of wind energy in stochastic day-ahead scheduling. IEEE Transitions on Sustainable Energy, 6(2), 606–615. [Google Scholar]
33. Zhang, H., Yang, Y. J., Zhao, X. Q. (2021). Two-level optimal dispatching strategy of regional integrated energy system considering demand response. Electric Power, 54(4), 141–150 (In Chinese). [Google Scholar]
Cite This Article
 Copyright © 2024 The Author(s). Published by Tech Science Press.
This work is licensed under a Creative Commons Attribution 4.0 International License , which permits unrestricted use, distribution, and reproduction in any medium, provided the original work is properly cited.
 Downloads
 Citation Tools