
 Submit a Paper
 Propose a Special lssue
 Open Access
ARTICLE

Investigating Periodic Dependencies to Improve Short-Term Load Forecasting
1 State Grid Zhejiang Jiaxing Electric Power Co., Ltd., Jiaxing, 314000, China
2 State Grid Zhejiang Electric Power Co., Ltd., Hangzhou, 310000, China
* Corresponding Author: Jialin Yu. Email:
Energy Engineering 2024, 121(3), 789-806. https://doi.org/10.32604/ee.2023.043299
Received 28 June 2023; Accepted 09 October 2023; Issue published 27 February 2024
 View Full Text
 Download PDF
Abstract
With a further increase in energy flexibility for customers, short-term load forecasting is essential to provide benchmarks for economic dispatch and real-time alerts in power grids. The electrical load series exhibit periodic patterns and share high associations with metrological data. However, current studies have merely focused on point-wise models and failed to sufficiently investigate the periodic patterns of load series, which hinders the further improvement of short-term load forecasting accuracy. Therefore, this paper improved Autoformer to extract the periodic patterns of load series and learn a representative feature from deep decomposition and reconstruction. In addition, a novel multi-factor attention mechanism was proposed to handle multi-source metrological and numerical weather prediction data and thus correct the forecasted electrical load. The paper also compared the proposed model with various competitive models. As the experimental results reveal, the proposed model outperforms the benchmark models and maintains stability on various types of load consumers.Keywords
The growth of the capacity of renewable energy offers a new opportunity to address the approaching energy crisis and increasing demand for electricity consumption [1,2]. The growing uses of electricity have prompted multiple agencies to implement a variety of strategies for maximizing its efficiency [3], the intelligent switching of domestic load consumption in the distribution networks, reducing auxiliary power consumption, continuously monitoring the reduction of power loss in transmission and distribution systems [4], utilizing energy-efficient equipment, and educating power grids for better load optimization [5]. Considering the practical uses, the horizons of load forecasting cover ultra-short-term (within 0.5 h), short-term (1–6 h), intra-day (within 24 h) and day-ahead (over 24 h) horizons. Among these scenarios, short-term load forecasting is particularly essential to educate economic dispatch and real-time alerts, which have a wide range of application prospects in power systems.
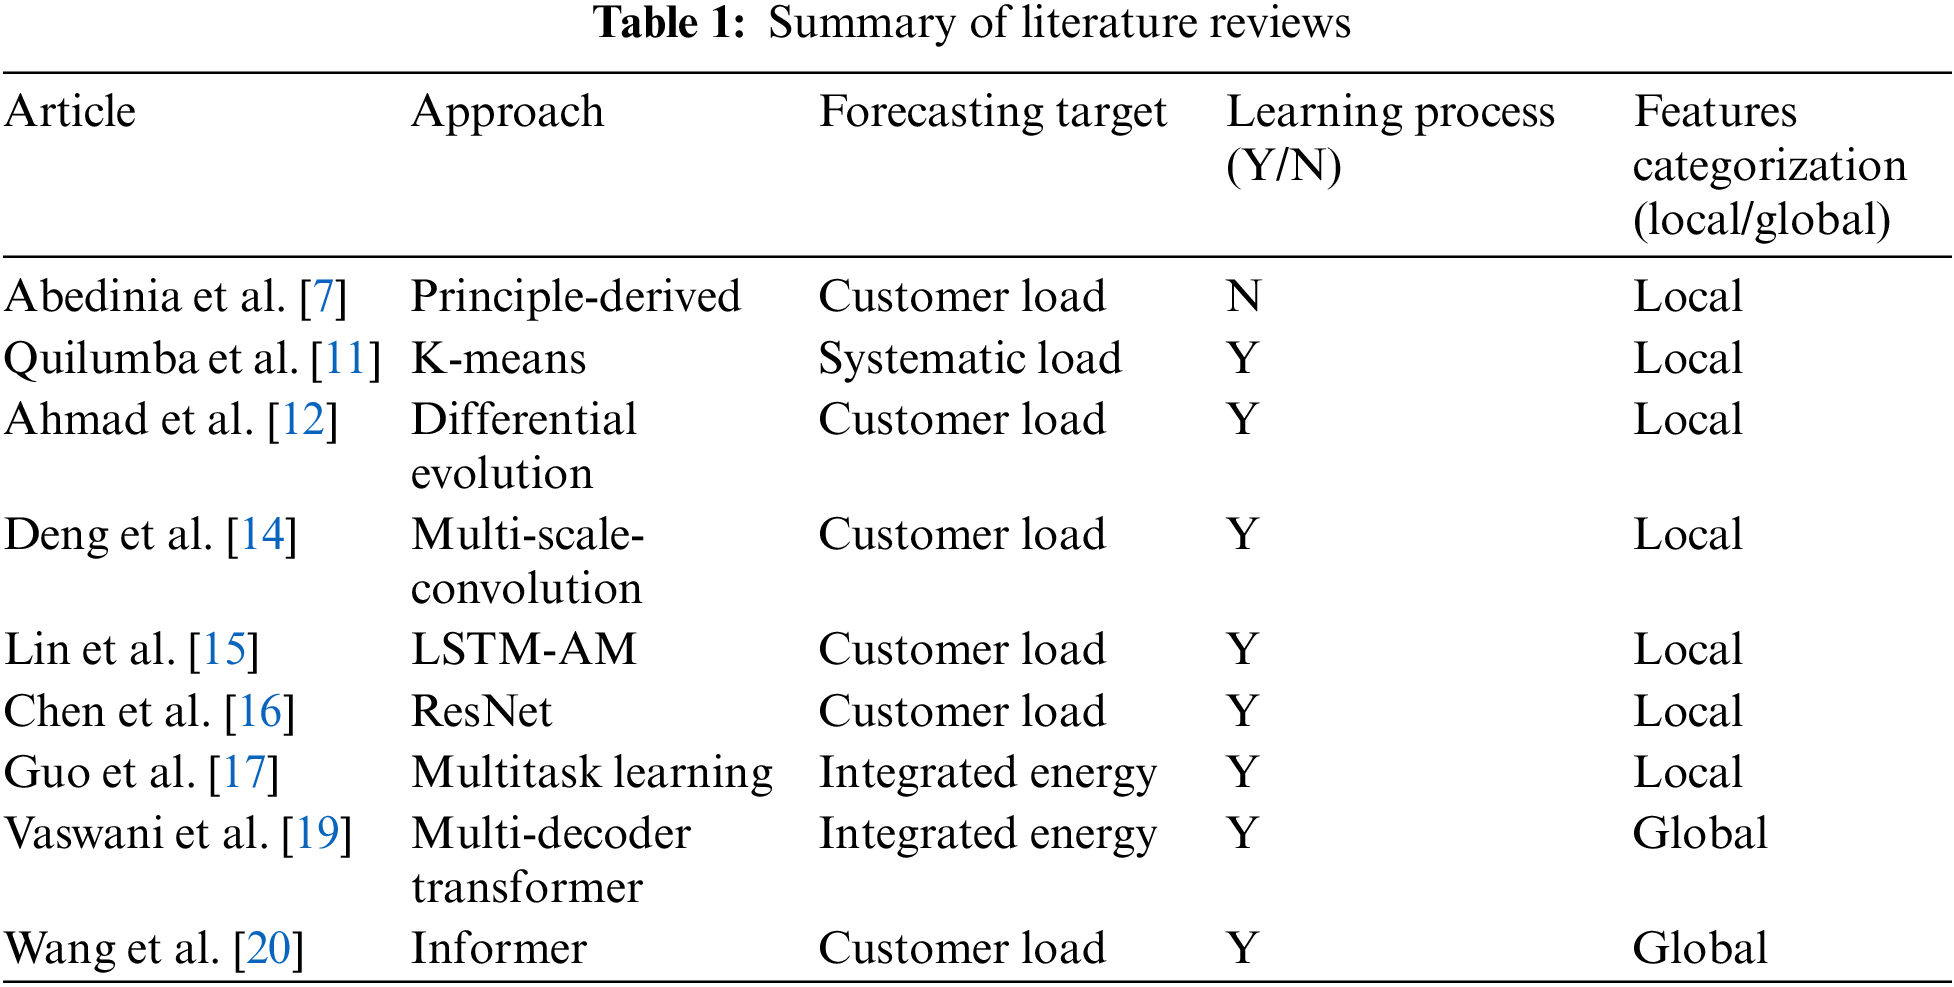
Based on the current literature, the short-term load forecasting models can be briefly divided into three categories: mathematical-physical, statistical, and hybrid models [6]. The large-computation-based models have achieved excellent prediction results in long-term load forecasting. Abedinia et al. [7] proposed a principle-derived mathematical model to convert metrological data to load forecasting results. These methods do not require a training process and thus enable high efficiency of calculation. However, the obstacles of capturing real-time data still hinder its wide applications. Also, with the continuous growth of the flexibility and randomness of load consumption, simple mathematical-physical models are not capable of adapting to the new situations of electrical load forecasting.
Statistical models aim to learn a reasonable representative trend of electrical load to provide multi-step-ahead forecasting results. Compared with the linear regression models which struggle to handle sequential data, the typical time series model considering the periodic characteristics of time series is widely applied [8]. DF (Decision Free) [9], SVM (Support Vector Machine) [7], ANNs (Artificial Neural Networks) [10], and other machine learning methods are widely used for load forecasting. Quilumba et al. [11] used K-means clustering to recognize the consumption patterns of diverse consumers, while load forecasting results on the systematic level are aggregated from each cluster of consumers. Ahmad et al. [12] proposed an enhanced differential evolution algorithm to optimize the errors between the calculated and observed samples, which leads to a distinctive improvement of 52.78% than conventional optimization methods. Although these models are convenient and guarantee satisfying outperformance, the performance of a statistical model highly depends on data characteristics and generally exhibits insufficient generalization [13].
Improved from the obstacles of the aforementioned models, the hybrid models integrating multiple algorithms were designed to combine the superiority of the included models. Deng et al. [14] proposed a multi-scale-convolution-based hybrid model, where the accuracy of short-term load forecasting can be improved by capturing features from various temporal scales. The hybrid model effectively balanced load forecasting performance between ultra-short and short-term. Also, Lin et al. [15] integrated the advantages of LSTM (long-short-term memory) and attention mechanism (AM) to investigate the correlations between load series and metrological factors. Chen et al. [16] improved ResNet to extract temporal correlations at multiple scales from reconstructed load series, which effectively handled multi-source data and significantly prevented gradient vanishing. Guo et al. [17] developed a bidirectional-LSTM-based multitask framework while considering the coupling relationships between integrated energy. Although the aforementioned hybrid models achieved excellent outperformance in terms of short-term load forecasting, the LSTM and convolution-based models can merely model the local features [18], which limits the further improvement of forecasting accuracy. Therefore, modeling global patterns of load series is still a challenging task. Taking advantage of Transformer [19], Wang et al. [20] proposed a Transformer-based multi-decoder framework to conduct short-term forecasting of integrated energy load, which was confirmed to outperform those models merely focusing on local features. Instead of implementing full attention, Gong et al. [21] developed a sparse attention mechanism to distinguish dominant features from raw load series. Furthermore, the model efficiency and forecasting accuracy can be jointly enhanced by neglecting unnecessary features. As the experimental results reveal, the Transformer can effectively improve the feature extraction process in the encoder module and ensure forecasting stability in terms of multi-step forecasting. As a summary of the aforementioned literature review, the basic information and categorizations of these reviewed articles are presented in Table 1.
1.3 Research Gaps and Contributions
Although the aforementioned methods effectively improve the accuracy of short-term load forecasting, these methods merely focus on establishing the point-wise mapping from historical to future points of electrical load series. The motivations of these methods are to seek correlations between the target points with the historical ones. However, a key element tends to be ignored the electrical load series exhibits apparent periodic patterns [16]. The main difference between the point-wise and series-wise methods is presented in Fig. 1. Intuitively, the forecasting of future electrical load should be inferred from previous load series. Therefore, developing series-wise methods to sufficiently investigate the periodic characteristics of electrical load series can be a feasible option [22]. Distinguishing from conventional time-series modeling methods (e.g., LSTM [17], Informer [21]), Autoformer especially caters to the scenarios that the investigated time-series is broadly periodic, which is especially suitable for electrical load forecasting tasks.
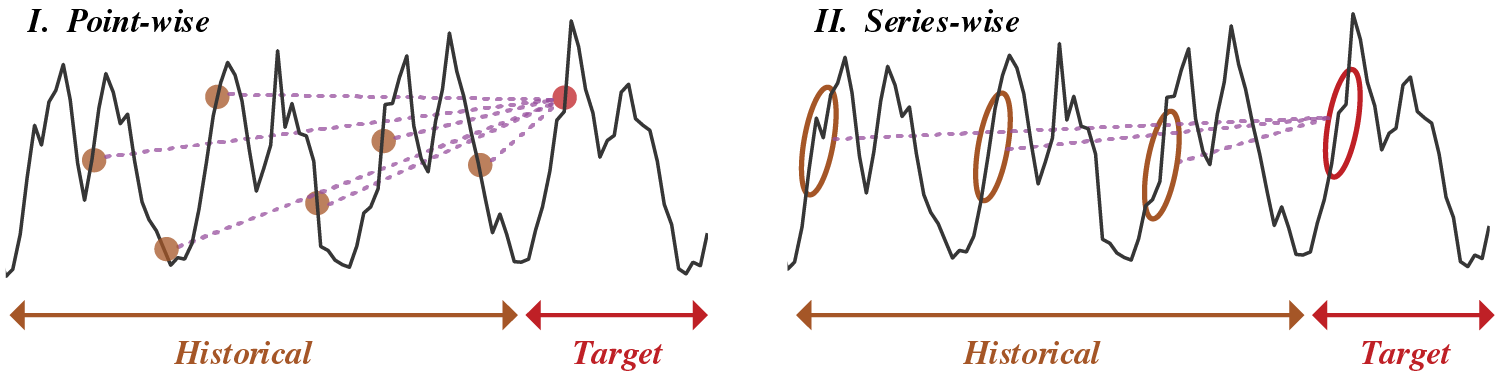
Figure 1: Comparisons of point-wise and series-wise methods
Besides, conventional feature selection methods mainly rely on prior knowledge or statistical methods. The commonality lies in that the feature selection cannot change dynamically, which neglects that the dominant metrological features affecting electrical load can vary with time.
To bridge the research gap, we proposed an Autoformer-based model to improve short-term load forecasting by investigating periodic patterns of load series [23]. Also, considering that external metrological data can greatly affect the consumption patterns of electrical load, a multi-factor AM was proposed to seek the correlations between the load series and metrological factors [17]. The contributions of this study are listed as follows:
• Inherited from Autoformer which has the advantage of extracting series-wise features, Autoformer was improved to investigate the periodic dependencies of electrical load. Within Autoformer, series decomposition was used to decompose raw load series into trend and seasonal parts. Auto-correlation was improved to enhance the periodic dependencies.
• A multi-factor AM with continuous adaptive weights was proposed to handle multi-source metrological factors. A scoring mechanism in multi-factor AM to select dominant metrological data, while corresponding NWP can be used as a benchmark to correct the forecasted electrical load.
• An end-to-end short-term load forecasting model was established. The proposed model was sufficiently validated and compared with various competitive models, which further confirms the effectiveness and stability of the proposed model.
The rest of the paper is organized as follows. Section 2 formulates the overall process of the proposed model. Section 3 details the process of Autoformer. Section 4 introduces the multi-factor AM. Section 5 presents the numerical results. Section 6 draws the conclusion.
The proposed short-term load forecasting model can be described as an optimization process. The proposed receives historical load series
where
The Autoformer [23] is designed to investigate load series by using an efficient encoder-decoder structure. Autoformer covers two modules: series decomposition and Auto-Correlation. Series decomposition was designed to decompose raw series into a pair of seasonal and trend parts, while Auto-Correlation was developed to enhance the periodic dependencies of seasonal parts.
To learn about the complex temporal patterns in a long-term load forecasting context without feature elimination, the idea of decomposition was taken to separate the series into trend and seasonal parts. However, directly decomposing is impractical because the distributions of load in the future are unknown. Therefore, the series decomposition block was designed to extract long-term stationary trends from the raw load series. Concretely, the moving average was adopted to smooth out periodic fluctuations and highlight long-term trends. The decomposition process can be formulated as:
where
3.2 Auto-Correlation Mechanism
Auto-Correlation can discover the period-based dependencies by calculating the series autocorrelation and aggregates similar load sub-series by time delay aggregation [23]. For a given load series
where
To sufficiently model the temporal dependencies of the load series, the most
where
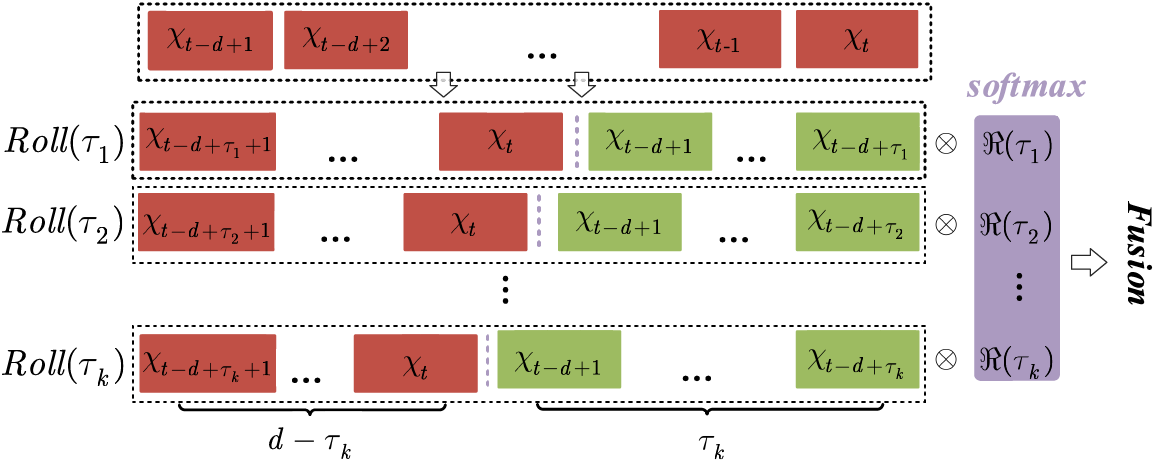
Figure 2: The principles of time-delay aggregation
However, merely relying on Softmax can cause
where
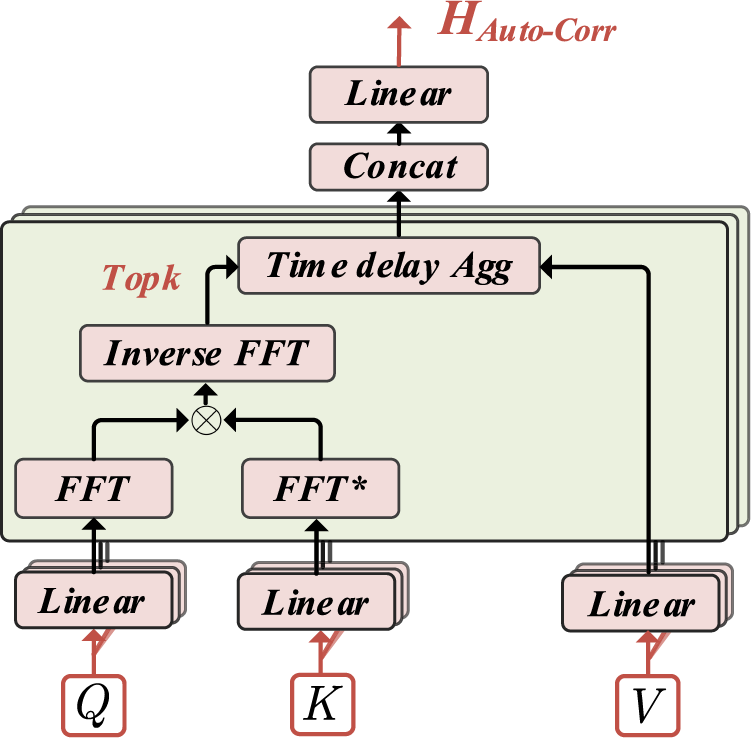
Figure 3: The principles of auto-correlation mechanism
4 Proposed Hybrid Model for Short-Term Load Forecasting
In this section, the principles of multi-factor AM were first introduced. In addition, the detailed architecture of the proposed model was illustrated.
4.1 Multi-Factor Attention Mechanism
Besides the individual electrical consumption behaviors, the metrological information has a significant influence on load curves, which can be reflected by unexpected ramp events within load curves. The metrological associated with the electrical load series, the metrological data was collected for feature richness. The collected metrological data covers temperature (
To handle the multi-source metrological data and electrical load series, a novel multi-factor AM was proposed to correct the load forecasting results. First, a novel scoring mechanism based on cross-attention was proposed to investigate the correlations between historical load series
where
where
4.2 Overall Proposed Short-Term Load Forecasting Model
Based on the aforementioned methodologies, the proposed load forecasting model can be established, which is presented in Fig. 4. Considering a separated two-stage network can cause target loss and feature elimination, the proposed method combined Autoformer and multi-factor AM to enable end-to-end learning.
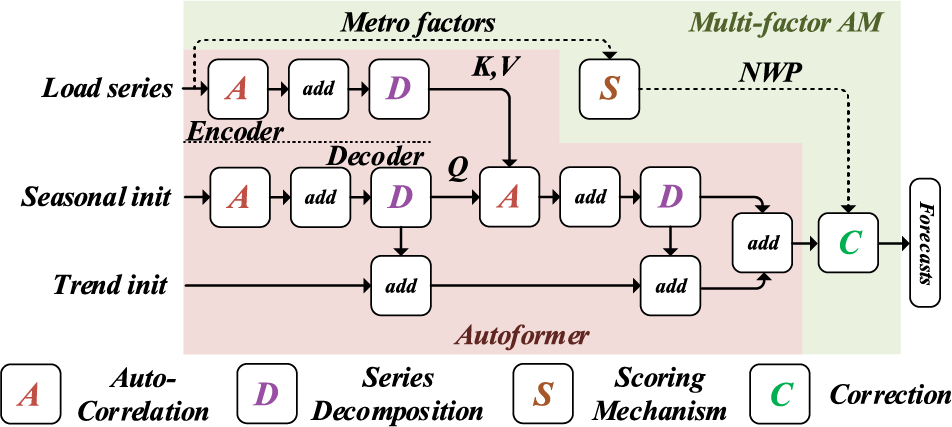
Figure 4: Overall proposed short-term load forecasting model
In the Autoformer stage, the encoder learns a representative seasonal feature from the raw load series, while the decoder gradually exploits trend characteristics from the raw load series to form a distinguishing pair of seasonal and trend parts. The output of Autoformer is a distinctive feature symbolizing a highly-refined periodic pattern, acting as the input of multi-factor AM. The principle of improved Autoformer can be formulated as follows:
where
Multi-factor AM stage covers two modules. Inherited from historical data, scoring mechanism measures the effects of metrological factors on load series. It is assumed the dominant metrological features affecting electrical load cannot severely change in the short term. Therefore, the correction module combines the dynamic scores and NWP data to correct load forecasting results. The proposed model ensures end-to-end dynamic weight adjustment without the assistance of prior knowledge. The process of the multi-factor AM stage can also be formulated as follows:
where
where
In this section, the performance and superiority of the proposed model were validated in detail. Based on a comprehensive dataset, various competitive models were adopted for comparisons from different aspects. Furthermore, the strengths and drawbacks of the proposed model were further discussed.
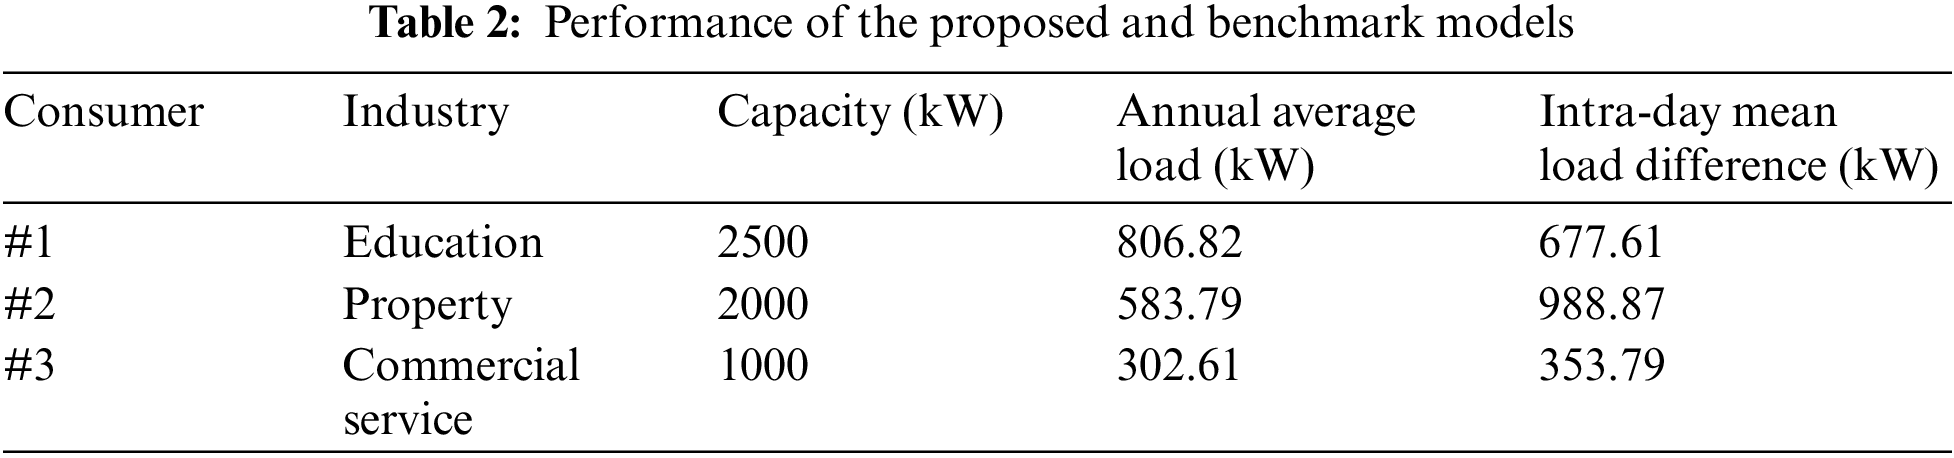
The data used in this case study were collected from various consumers in Jiangsu, China, including the educational, property, and commercial service industry, etc. All the consumers are located in the climate zone of temperature climate. For all the consumers, the metrological data was collected at the same standard in their nearest metrological measurements. The original time granularity of electrical load and metrological data is 15 min and 1 h, respectively. Furthermore, intra-day NWP was used to provide future weather conditions, which were obtained by a weather report service provider. To validate the generalization of the proposed model, three representative consumers with distinguishing patterns were selected from three industries for comparisons. The basic information of the three consumers is presented in Table 2. The load characteristics of property and commercial service exhibit higher fluctuations. In general, the dataset is split into training (80%), validation (10%), and testing sets (10%).
In this study, three widely accepted metrics were used to validate the performance of the proposed and benchmark models, including root mean square error (RMSE), mean absolute error (MAE), and determination coefficient (R2):
where
5.3 Benchmark Models and Configurations
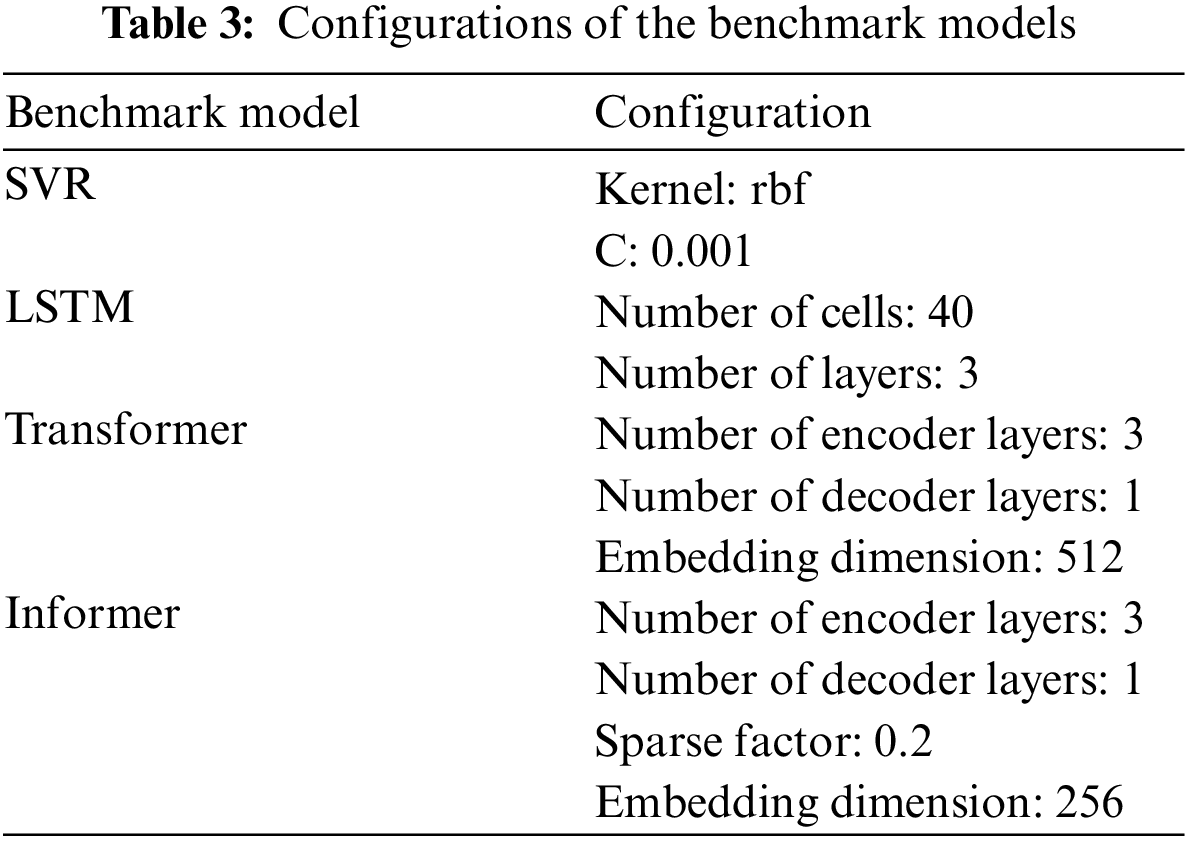
To validate the effectiveness of the proposed model for short-term load forecasting, several competitive methods in state-of-the-art literatures were adopted for comparisons, including SVR [25], LSTM [26], Transformer [20], and Informer [21,27]. Concretely, SVR adopts the soft constraints for regression. LSTM uses the internal sequential structure of LSTM for time-series modeling, while AM is used for feature aggregation. Furthermore, the Transformer ensures a highly robust feature extraction process by stacking multi-headed attention [23]. As an upgraded version of Transformer, Informer adopts sparse attention as a substitute for full attention to consider the effect of distinguishing points in load series for forecasting [21]. The detailed configurations of the benchmark models are presented in Table 3.
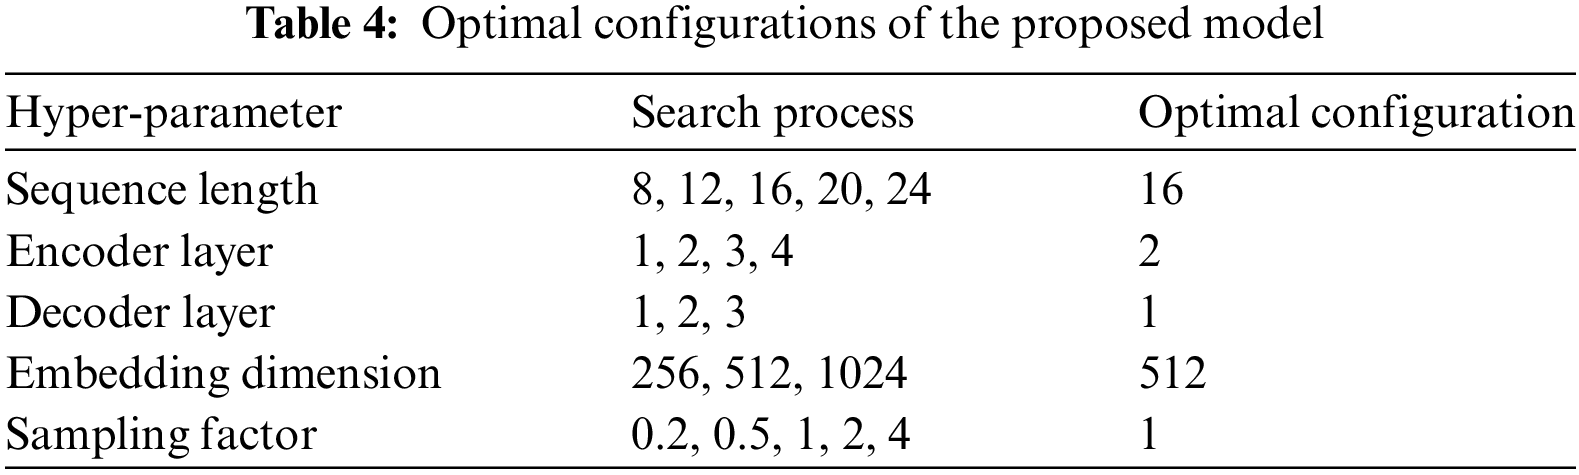
Furthermore, after numerical pre-experiments, the optimal configurations of the proposed model can also be obtained. Based on the optimal configurations, the accuracy of the proposed model can be improved by around 2.3% over the suboptimal one indicated by R2. The configurations of the proposed model are presented in Table 4.
5.4 Comparisons of the Proposed and Benchmark Models
To comprehensively compare the proposed model with the benchmark models, detailed analysis regarding different categories of consumers was implemented from the following four aspects: performance indicators, forecasting curves, error distributions, and statistical significance test.
5.4.1 Comparisons on Performance Indicators
Based on the model configurations, 1-step-ahead (1-h-ahead) electrical load forecasting tasks were conducted. The performance of the proposed and benchmark models is provided in Table 5. In terms of error analysis, the Transformer-based models outperform the conventional models (SVR, LSTM), which is partially owing to the robust feature extraction capacity. Among the Transformer-based models, the Informer exhibits superior performance in terms of consumer #1 and #3 than the Transformer. However, these point-wise models are still lagging behind the series-wise model (proposed). The proposed model has a 1.65%–1.08%–0.33% higher R2 than the suboptimal results on consumers #1, #2 and #3, respectively. Therefore, with consideration of the inherent periodic properties of electrical load, investigating the periodic attribute to improve the forecasting accuracy of electrical load is of great necessity.

5.4.2 Comparisons on Forecasting Curves
Besides error analysis, the fitting curves of various models are presented in Fig. 5. In terms of the fitting curves on consumers #1 and #3 which exhibit apparent periodic characteristics, the proposed and benchmark models can fit the majority of periodic fluctuations. In addition, the proposed model can effectively fit unexpected fluctuations. Especially when load curves are less periodic, the forecasting of electrical load focuses more on the correction of metrological elements. Thus, SVR and LSTM exhibit poor performance on #2, with RMSE and MAE higher than other models. The local enlargement of the pinnacle, trough, and ramp events of electrical load curves are also plotted. Major models can effectively fit the ramp events since the fluctuation cases in ramp events are relatively rare. When comes to pinnacle and trough events, merely Informer and the proposed method can generally fit the overall trends and values. Compared with Informer, the proposed method exhibits higher robustness and stability. Referring to the fitting curves, the proposed method can always fit different periodic patterns, which further proves the strengths of Autoformer.
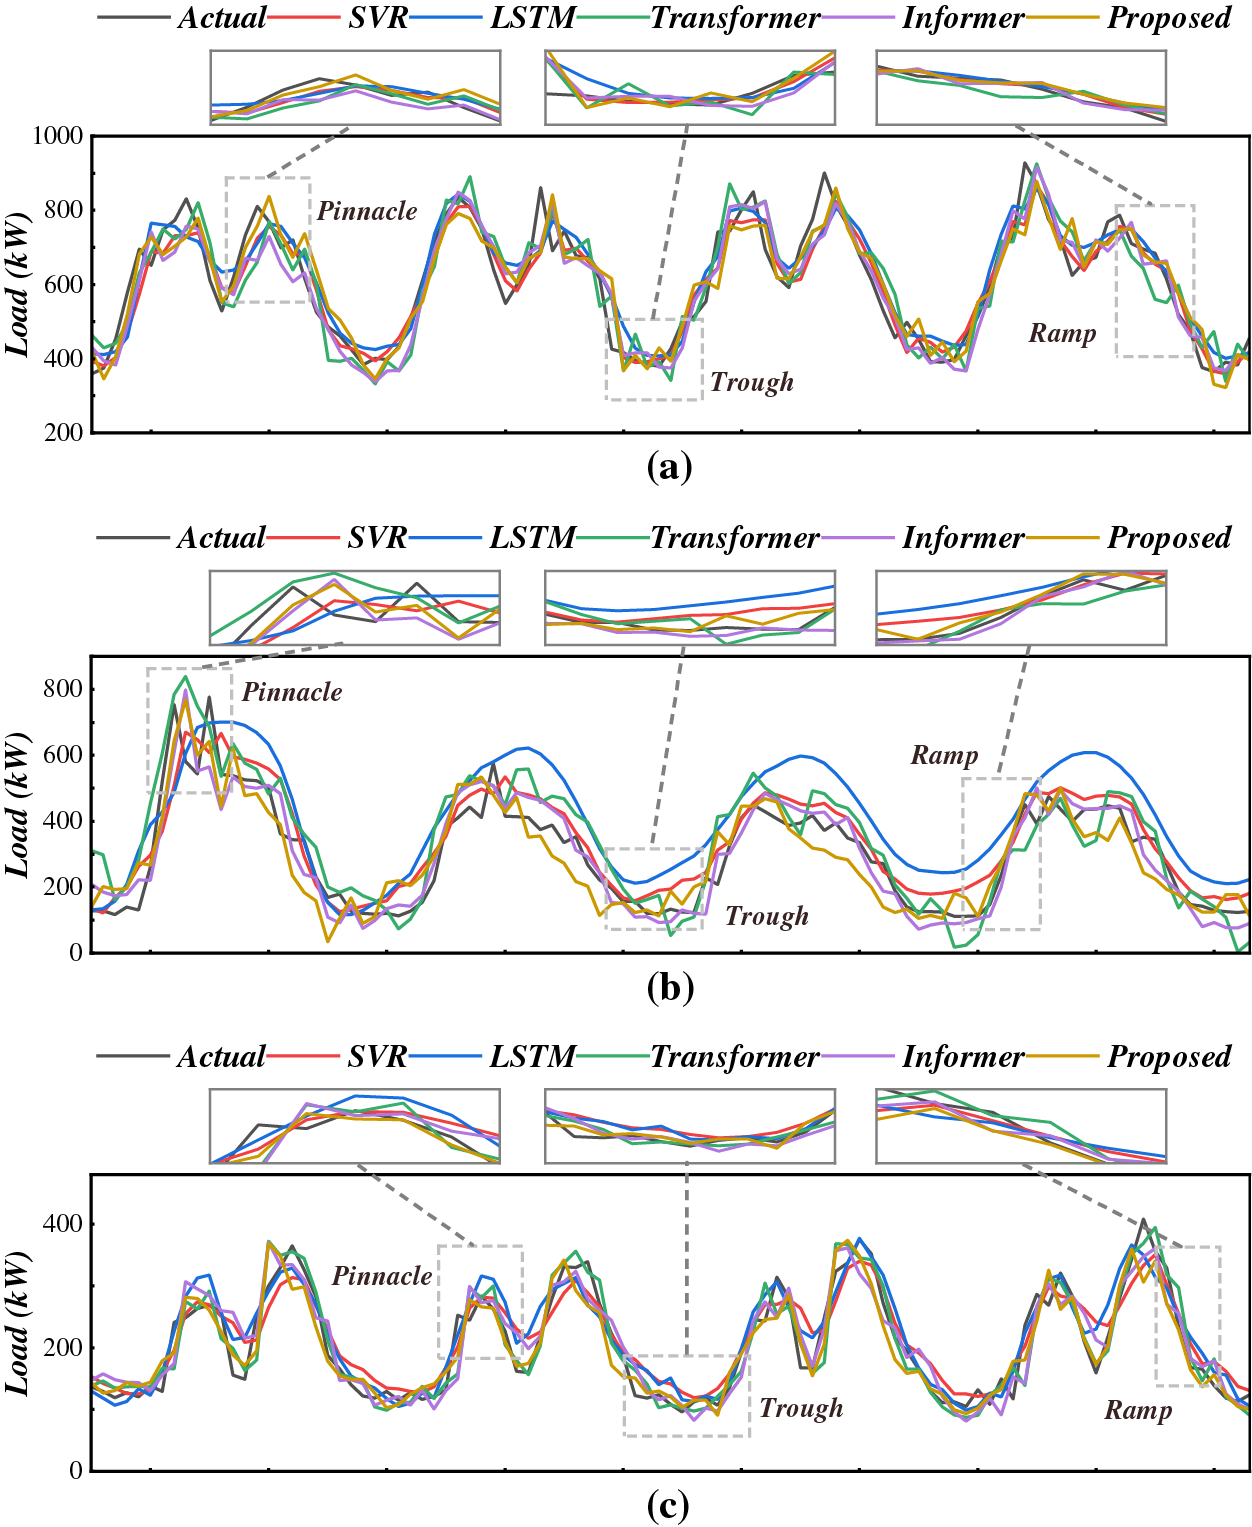
Figure 5: Fitting curves of the proposed and benchmark models (a) consumer 1 (b) consumer 2 (c) consumer 3
5.4.3 Comparisons on Error Distributions
Furthermore, the forecasting error box plots are presented in Fig. 6. Although the error distributions vary between different consumers, the forecasting errors of the proposed model exhibit the narrowest distribution, with the average values closest to zero. In brief, compared with other competitive models, the proposed model confirms its highest capacity of learning a representative periodic pattern, and also can fit unexpected load fluctuations.
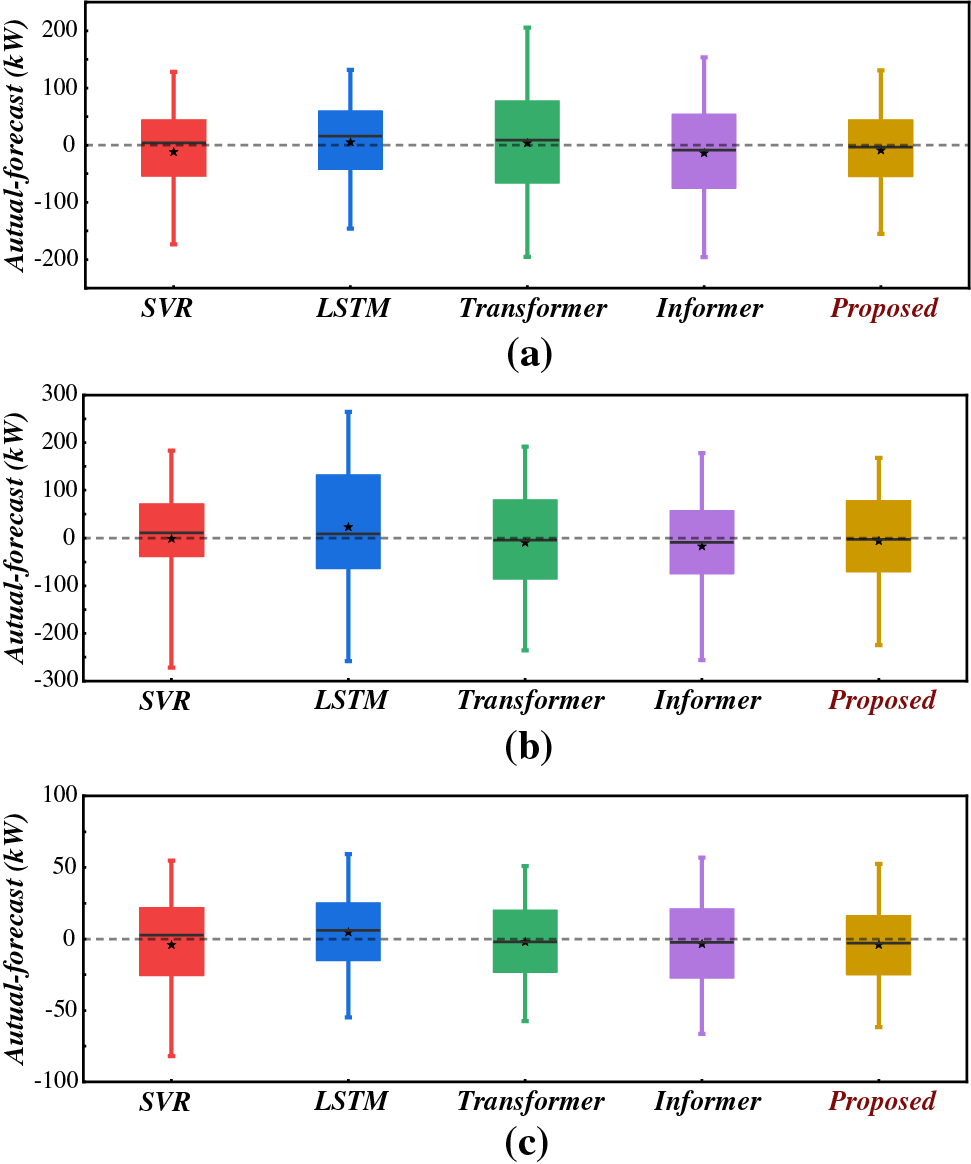
Figure 6: Forecasting error box-plots of the proposed and benchmark models
5.4.4 Comparisons on Statistical Significance Test
The aforementioned validation methods all verify the high performance of the proposed model by general performance. A statistical significance test, Diebold-Mariano (DM) test, was also used for validation. The DM test can distinguish whether two time-series data are undifferentiable. The comparisons of the proposed and benchmark models are displayed in Table 6. Referring to the statistical results, the proposed model overwhelmingly outperforms LSTM and SVR statistically. Although the performance of the proposed method is indifferentiable with the Transformer in customer #3 and the Informer in customer #2, the proposed method can ensure superiority in other scenarios, which further verifies its effectiveness from statistical views.

5.5 Discussions of the Proposed Model
Besides the analysis of the performance indicators and forecasting curves, the strengths and drawbacks of the proposed model are further analyzed in the following aspects, including convergence analysis, sensitivity analysis, multi-step performance, effectiveness of multi-factor AM, current limitations, and future works.
Conducting convergence analysis was essential to validate the stability and efficiency of deep learning models. Since the loss function of the proposed model was built based on MSE, the converging training loss based on MSE was displayed in Fig. 7. Referring to the converging results, the proposed model can quickly converge to an acceptable stage at around 4 epochs. Based on the early-stopping strategy (patience = 3), the proposed model finally converged at the 10th epoch, with a converged training loss as 0.0591.
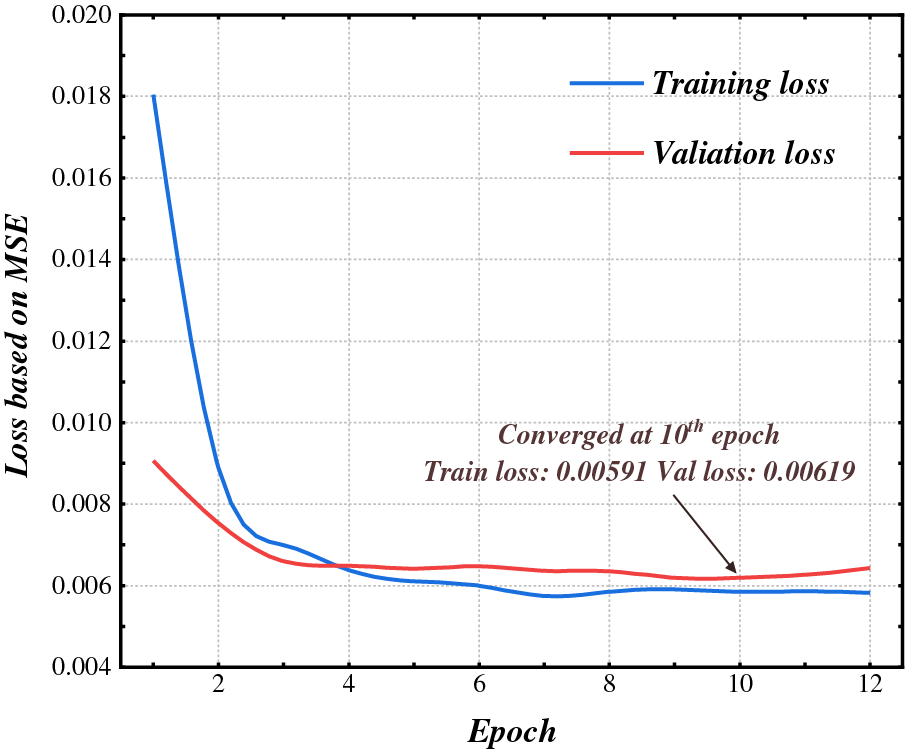
Figure 7: Convergence analysis of the proposed model
The sensitivity analysis is a fundamental approach to validate the stability of the deep learning models. According to the principles of sensitivity analysis, the model performance under different configurations is displayed in Fig. 8. Referring to the results, the performance of the proposed model is highly sensitive towards the hyper-parameter configurations except number of heads, especially the number of decoder layers. Therefore, it is of great necessity to implement hyper-parameter tuning. Based on the optimal configuration, the performance of the proposed model can improve by 2.82% and 3.73% than the suboptimal model based on MAE and RMSE, respectively.
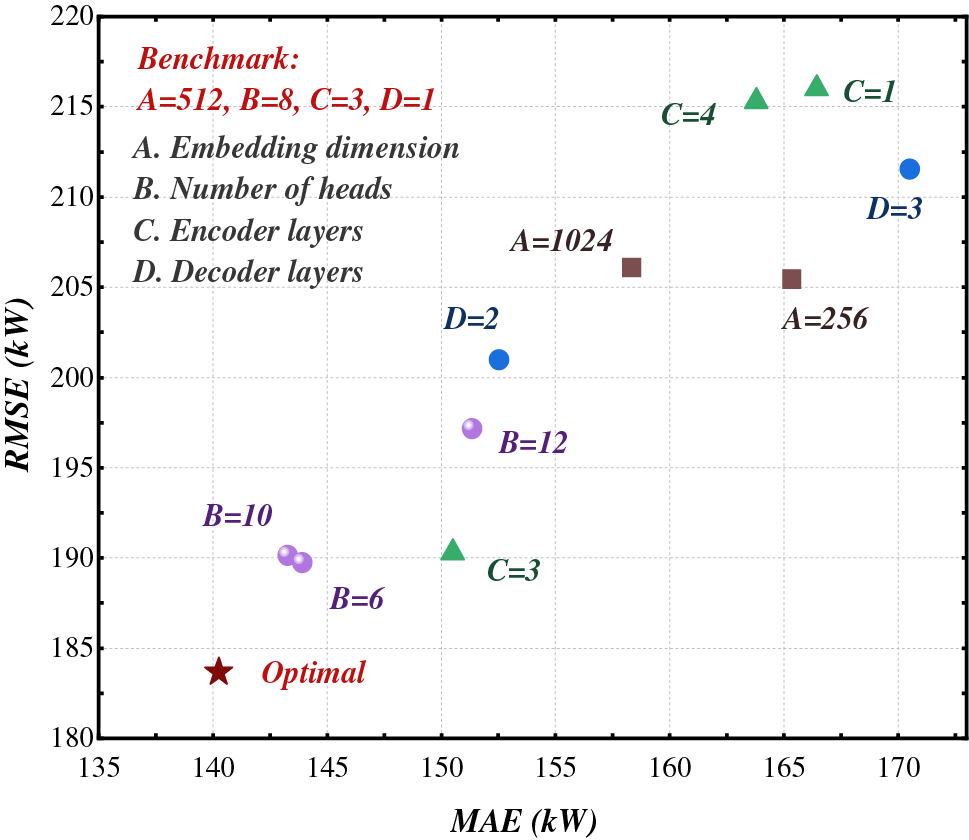
Figure 8: Sensitivity analysis of the proposed model
5.5.3 Multi-Step Forecasting Performance
To validate the effectiveness of the proposed model as the forecast horizon extends, the performance of 1-to-6-step (1 to 6 h) forecasting results were sufficiently validated and displayed in Fig. 9. Referring to the results, there is no apparent performance degradation observed as forecast horizon within 4 h. When the forecast horizon is over 5 h, several errors can be observed at the pinnacles of the forecasted load curves. This phenomenon was due to the fact that the pinnacles of the forecasted curves are of greater uncertainty and higher sensitivity to the accuracy of NWP data, which naturally leads to more difficulties in accurate forecasting. Therefore, the proposed model was verified to be effective within 4 h.
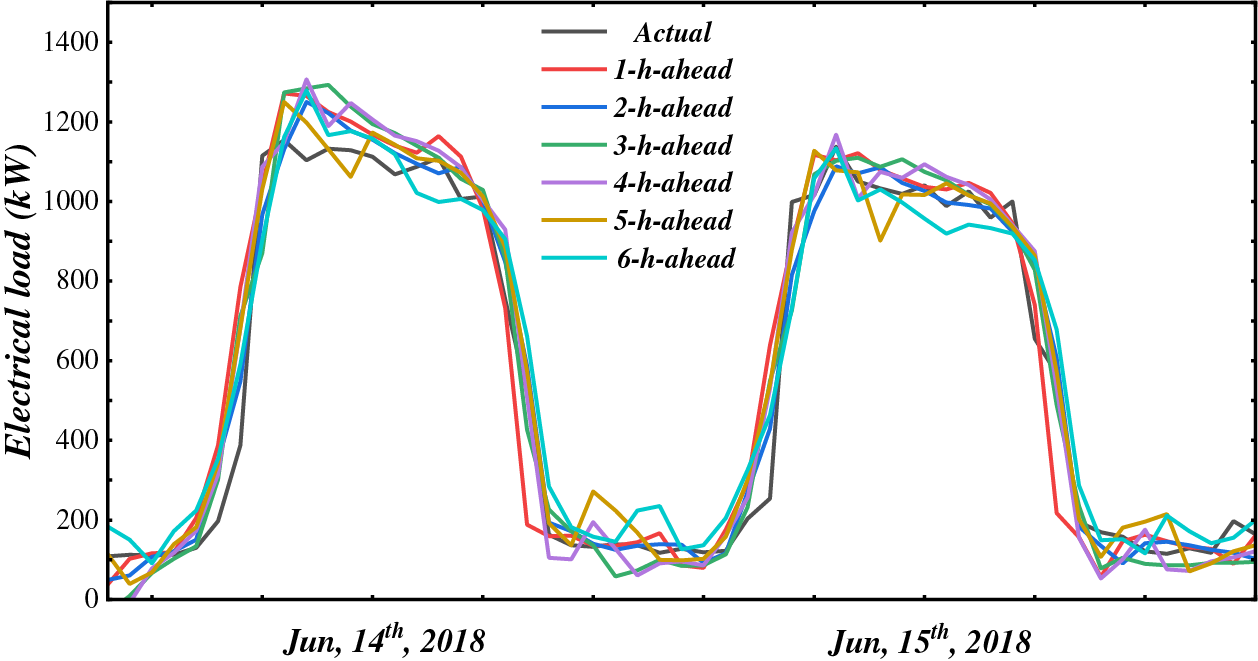
Figure 9: Multi-step performance of the proposed model
5.5.4 Effectiveness of Multi-Factor AM
In this paper, the design of the multi-factor AM is an essential approach to aggregate multi-source metrological data and electrical load. To validate the effectiveness of multi-factor AM, an ablation study was implemented. The forecasting curves of electrical load ablated with multi-factor AM were displayed in Fig. 10. To intuitively measure the improvement brought by multi-factor AM, error reduction based on MAE was also displayed. When multi-factor was ablated, its performance lags behind that of the proposed model in major timesteps, because the uncertainty of electrical load can not be inferred from historical sequence but relies on the involvement of metrological data. As numerical results indicate, the proposed multi-factor AM was essential to improve the forecasting accuracy.
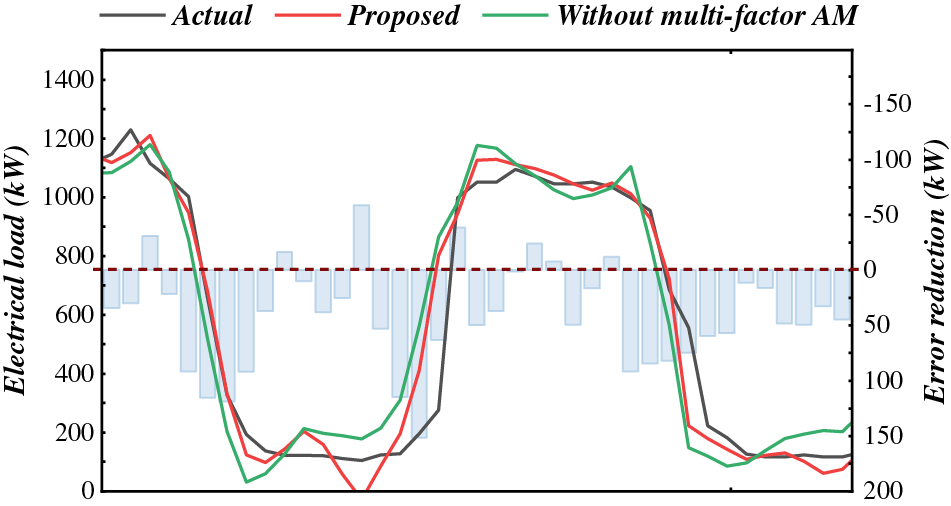
Figure 10: Validation of the effectiveness of multi-factor AM
5.5.5 Model Stability towards Erroneous Data
To validate the model stability more comprehensively, the possible scenarios of missing values were taken into consideration. The proposed method was validated in those cases to verify whether the proposed method can still capture periodic features for forecasting when some timesteps were missed. In simulation works, the proposed method was attended to bad data where the missing timesteps were randomly masked. The performance of the proposed model towards missing data is presented in Table 7. When missing data was involved, the model performance degraded slowly with a missing rate below 10%. However, the performance degraded sharply if more than 10% of data is missing. The stability analysis validated the reliability of the proposed method with a missing rate below 10%.

5.5.6 Current Limitations and Future Works
Although this paper effectively investigated the periodic dependencies to improve electrical load forecasting, there are still some obstacles that need to be overcome. First, more social information such as vocational calendar and electrical consumption behaviors should be considered, where consumer classification should be implemented in a more detailed way. Second, due to computational limitations, it is impossible to validate all the candidates of hyper-parameters with grid search, which means that the model performance has to sacrifice for computational limits. As for future work, considering the diverse consumer classes and voltage levels, validating and improving the generalization of the proposed model is essential. Furthermore, instead of transmitting raw data for forecasting, investigating data encryption or federated learning to improve the security of data sharing is also a focal point.
As the load capacity and the complexity of the topology complementary relationship grows, accurate load forecasting greatly benefits the dispatch and management of power systems. Previous literature mainly focuses on point-wise time-series modeling models, which may neglect the inherent periodic patterns of electrical load. Therefore, this paper proposed an Autoformer-based model to investigate the periodic dependencies for short-term load forecasting. A multi-factor AM was proposed to handle metrological data to correct the target electrical load. Furthermore, the comparisons with other competitive models indicate that the proposed ensures the highest forecasting accuracy and stability on various types of load consumers. The proposed model can be deployed to distribution and microgrid systems for situational awareness and real-time management. However, there are still some obstacles to be solved. The significant difference in consumption patterns on and off holiday has not been considered in load forecasting. Moreover, since it is impractical to search for all the hyper-parameter candidates. The model performance has to sacrifice for the computational limits. Future works may attend to behind-the-meter load forecasting. Also, investigating data encryption to improve the security of data sharing is a focal point.
Acknowledgement: The authors would like to thank the support of Science and Technology Project of State Grid Zhejiang Corporation of China “Research on State Estimation and Risk Assessment Technology for New Power Distribution Networks for Widely Connected Distributed Energy”.
Funding Statement: This work was supported by Science and Technology Project of State Grid Zhejiang Corporation of China “Research on State Estimation and Risk Assessment Technology for New Power Distribution Networks for Widely Connected Distributed Energy” (5211JX22002D).
Author Contributions: The authors confirm contribution to the paper as follows: study conception and design: Jialin Yu; data collection: Jialin Yu, Xiaodi Zhang, Qi Zhong; analysis and interpretation of results: Jialin Yu, Xiaodi Zhang, Qi Zhong, Jian Feng; draft manuscript preparation: Jialin Yu, Xiaodi Zhang, Jian Feng. All authors reviewed the results and approved the final version of the manuscript.
Availability of Data and Materials: The data employed in case study is available if request.
Conflicts of Interest: The authors declare that they have no conflicts of interest to report regarding the present study.
References
1. Zhang, Y., Cao, R., Dong, D., Peng, S., Du, R. et al. (2022). Deep learning network for energy storage scheduling in power market environment short-term load forecasting model. Energy Engineering, 119, 1829–1841. [Google Scholar]
2. Zhu, J., Dong, H., Zheng, W., Li, S., Huang, Y. et al. (2022). Review and prospect of data-driven techniques for load forecasting in integrated energy systems. Applied Energy, 321, 119269. [Google Scholar]
3. Liu, J., Zang, H., Ding, T., Cheng, L., Wei, Z. et al. (2023). Harvesting spatiotemporal correlation from sky image sequence to improve ultra-short-term solar irradiance forecasting. Renewable Energy, 209, 619–631. [Google Scholar]
4. Ranaweera, D. K., Karady, G. G., Farmer, R. G. (2017). Economic impact analysis of load forecasting. IEEE Transactions on Power System, 12, 1388–1392. [Google Scholar]
5. Dewangan, F., Abdelaziz, A. Y., Biswal, M. (2023). Load forecasting models in smart grid using smart meter information: A review. Energies, 16, 1404. [Google Scholar]
6. Wang, J., Gao, J., Wei, D. (2022). Electric load prediction based on a novel combined interval forecasting system. Applied Energy, 322, 119420. [Google Scholar]
7. Abedinia, O., Amjady, N., Zareipour, H. (2017). A new feature selection technique for load and price forecast of electrical power systems. IEEE Transactions on Power Systems, 32, 62–74. [Google Scholar]
8. Zang, H., Xu, R., Cheng, L., Ding, T., Liu, L. et al. (2021). Residential load forecasting based on LSTM fusing self-attention mechanism with pooling. Energy, 229, 120682. [Google Scholar]
9. Zang, H., Cheng, L., Ding, T., Cheung, K. W., Wang, M. et al. (2022). Application of functional deep belief network for estimating daily global solar radiation: A case study in China. Energy, 191, 116502. [Google Scholar]
10. Cao, D., Zhao, J., Hu, W., Zhang, Y., Liao, Q. et al. (2022). Robust deep gaussian process-based probabilistic electrical load forecasting against anomalous events. IEEE Transactions on Industrial Informatics, 18, 1142–1153. [Google Scholar]
11. Quilumba, F. L., Lee, W. J., Huang, H., Wang, D. Y., Szabados, R. L. (2022). Using smart meter data to improve the accuracy of intraday load forecasting considering customer behavior similarities. IEEE Transactions on Smart Grid, 6, 911–918. [Google Scholar]
12. Ahmad, A., Javaid, N., Guizani, M., Alrajeh, N., Khan, Z. A. (2017). An accurate and fast converging short-term load forecasting model for industrial applications in a smart grid. IEEE Transactions on Industrial Informatics, 13, 2587–2596. [Google Scholar]
13. Fernández, J. D., Menci, S. P., Lee, C. M., Rieger, A., Fridgen, G. (2022). Privacy-preserving federated learning for residential short-term load forecasting. Applied Energy, 326, 119915. [Google Scholar]
14. Deng, Z., Wang, B., Xu, Y., Xu, T., Liu, C. et al. (2019). Multi-scale convolutional neural network with time-cognition for multi-step short-term load forecasting. IEEE Access, 7, 88058–88071. [Google Scholar]
15. Lin, J., Ma, J., Zhu, J., Cui, Y. (2022). Short-term load forecasting based on LSTM networks considering attention mechanism. International Journal of Electrical Power & Energy Systems, 137, 107818. [Google Scholar]
16. Chen, K., Chen, K., Wang, Q., He, Z., Hu, J. et al. (2019). Short-term load forecasting with deep residual networks. IEEE Transactions on Smart Grid, 10, 3943–3952. [Google Scholar]
17. Guo, Y., Li, Y., Qiao, X., Zhang, Z., Zhou, W. et al. (2022). BiLSTM multitask learning-based combined load forecasting considering the loads coupling relationship for multienergy system. IEEE Transactions on Smart Grid, 13, 3481–3492. [Google Scholar]
18. Liu, J., Zang, H., Cheng, L., Ding, T., Wei, Z. et al. (2023). A transformer-based multimodal-learning framework using sky images for ultra-short-term solar irradiance forecasting. Applied Energy, 342, 121160. [Google Scholar]
19. Vaswani, A., Shazeer, N., Parmar, N., Uszkoreit, J., Jones, L. et al. (2017). Attention is all you need. In: Advances in neural information processing systems 30 (NIPS 2017). [Google Scholar]
20. Wang, C., Wang, Y., Ding, Z., Zheng, T., Hu, J. et al. (2022). A transformer-based method of multienergy load forecasting in integrated energy system. IEEE Transactions on Smart Grid, 13, 2703–2714. [Google Scholar]
21. Gong, M., Zhao, Y., Sun, J., Han, C., Sun, G. et al. (2022). Load forecasting of district heating system based on Informer. Energy, 253, 124179. [Google Scholar]
22. Chen, B., Zhu, Z., Wang, X., Zhang, C. (2021). A weighted combination forecasting model for power load based on forecasting model selection and fuzzy scale joint evaluation. Energy Engineering, 118, 1499–1514. [Google Scholar]
23. Wu, H., Xu, J., Wang, J., Long, M. (2022). Autoformer: Decomposition transformers with auto-correlation for long-term. Series Forecasting, 34, 22419–22430. [Google Scholar]
24. Dong, H., Zhu, J., Li, S., Wu, W., Zhu, H. et al. (2023). Short-term residential household reactive power forecasting considering active power demand via deep Transformer sequence-to-sequence networks. Applied Energy, 329, 120281. [Google Scholar]
25. Chung, W. H., Gu, Y. H., Yoo, S. J. (2022). District heater load forecasting based on machine learning and parallel CNN-LSTM attention. Energy, 246, 123350. [Google Scholar]
26. Li, K., Huang, W., Hu, G., Li, J. (2023). Ultra-short term power load forecasting based on CEEMDAN-SE and LSTM neural network. Energy and Buildings, 279, 112666. [Google Scholar]
27. Zhou, H., Zhang, S., Peng, J., Zhang, S., Li, J. et al. (2021). Informer: Beyond efficient transformer for long sequence time-series forecasting. Proceedings of the AAAI Conference on Artificial Intelligence, vol. 35, no. 12, pp. 11106–11115. [Google Scholar]
Cite This Article
 Copyright © 2024 The Author(s). Published by Tech Science Press.
This work is licensed under a Creative Commons Attribution 4.0 International License , which permits unrestricted use, distribution, and reproduction in any medium, provided the original work is properly cited.
 Downloads
 Citation Tools