
 Submit a Paper
 Propose a Special lssue
 Open Access
ARTICLE

Comprehensive Evaluation of Distributed PV Grid-Connected Based on Combined Weighting Weights and TOPSIS-RSR Method
1 Key Laboratory of Modern Power System Simulation and Control & Renewable Energy Technology, Ministry of Education (Northeast Electric Power University), Jilin, 132012, China
2 Siping Suburban Power Supply Company, State Grid Jilin Electric Power Co., Ltd., Siping, 136000, China
* Corresponding Author: Long Cheng. Email:
Energy Engineering 2024, 121(3), 703-728. https://doi.org/10.32604/ee.2023.044721
Received 07 August 2023; Accepted 03 November 2023; Issue published 27 February 2024
 View Full Text
 Download PDF
Abstract
To effectively quantify the impact of distributed photovoltaic (PV) access on the distribution network, this paper proposes a comprehensive evaluation method of distributed PV grid connection combining subjective and objective combination of assignment and technique for order preference by similarity to an ideal solution (TOPSIS)—rank sum ratio (RSR) (TOPSIS-RSR) method. Based on the traditional distribution network evaluation system, a comprehensive evaluation system has been constructed. It fully considers the new development requirements of distributed PV access on the environmental friendliness and absorptive capacity of the distribution grid and comprehensively reflects the impact of distributed PV grid connection. The analytic hierarchy process (AHP) was used to determine the subjective weights of the primary indicators, and the Spearman consistency test was combined to determine the weights of the secondary indicators based on three objective assignment methods. The subjective and objective combination weights of each assessment indicator were calculated through the principle of minimum entropy. Calculate the distance between the indicators to be evaluated and the positive and negative ideal solutions, the relative closeness ranking, and qualitative binning by TOPSIS-RSR method to obtain the comprehensive evaluation results of different scenarios. By setting up different PV grid-connected scenarios and utilizing the IEEE33 node simulation algorithm, the correctness and effectiveness of the proposed subject-object combination assignment and integrated assessment method are verified.Keywords
In recent years, distributed renewable energy generation technology has developed rapidly and the installed capacity has continued to rise [1]. Compared with centralized new energy power plants, distributed generation has obvious advantages in terms of flexibility, power transmission cost and utilization rate [2], and is widely used in rooftop photovoltaic power generation and multi-energy ships. However, the access of large-scale distributed PV will change the source-load structure and operation mode of the distribution network [3], which will have different degrees of impact on network currents and system losses [4], and the differentiation of its access location, access capacity and layout and other configuration schemes will lead to significant differences in the operational safety, reliability, power supply quality and PV absorptive capacity of the distribution network [5]. In order to effectively quantify the impact of large-scale distributed photovoltaic access, it provides necessary support and reference for the planning and construction of new distribution grids, operation decision-making, and design of control and protection strategies [6]. Constructing a scientific, systematic, and complete comprehensive assessment system and proposing correct and practical assessment methods is necessary.
For the traditional distribution network condition assessment problem, scholars mostly construct the indicator system with a single item or a few items of voltage quality, reliability, and economy [5,7]. In contrast, with the high penetration of distributed PV connected to the grid, the traditional assessment system and indicators need to be extended and updated as necessary to ensure the comprehensiveness and comprehensiveness of the indicators. In this regard, the impact of distributed energy access on distribution network reliability was studied and quantified in reference [8]. The distributed PV access to the distribution network is quantitatively evaluated from the operating cost perspective [9]. In reference [10], the distribution network’s ability to consume distributed energy is assessed. However, the focus is only on the absorptive of the distribution network and no other aspects are considered. In reference [11], indicators such as power quality and security were selected to assess the impact of distributed PV grid integration on the distribution network. Constructing indicators only from factors reflecting the state of the traditional distribution network has some limitations, and it is necessary to consider the state indicators of the distribution network when a high percentage of distributed PV is connected to the grid. The indicator system studied in the above paper only considers part of the impact brought by the grid connection of distributed power sources, while the comprehensive assessment indicator system needs to be improved.
In addition, the reasonable assignment of weights to different levels and dimensions of evaluation indicators can effectively ensure the scientific nature of the evaluation results. AHP was applied to determine the comprehensive weights of evaluation indicators [12]. A triangular fuzzy multi-attribute decision method is proposed, and a comprehensive evaluation model is established in combination with fuzzy AHP [13], while the weight calculation results of these methods are highly subjective; In the objective assignment method, the entropy weighting method is applied to assign weights to the evaluation model to make a comprehensive assessment of different evaluation schemes [14]. In reference [15], the entropy weighting method was used to calculate the weights of each indicator, and then the distribution coefficients were determined based on gray correlation analysis, which strengthened the variability among the indicators. The coefficient of variation method was used to assign the indicator weights in reference [16].
However, a single subjective and objective weighting method cannot fully characterize the importance of the evaluation indicators. Using a combination of subjective and objective weighting can consider both advantages and improve the scientific nature of the indicator weighting results. In reference [17], an improved AHP-CRITIC evaluation strategy was established. Although the method has certain advantages in some application scenarios, it is highly subjective and may lead to the evaluation results being influenced by individual bias. In reference [18], a combined assignment method based on G1-anti-entropy weights was proposed as a comprehensive evaluation model to determine the weights of indicators from both subjective and objective perspectives. The method relies too much on the stability or certainty of the indicators, which may neglect or underestimate other key evaluation indicators with high differences or variability, leading to an imbalance in the allocation of weights.
In terms of evaluation methods, the fuzzy TOPSIS method was used in reference [19] to rank and evaluate the solutions, and its main idea is based on the fact that the optimal solution should have the farthest distance from the negative ideal solution and the shortest distance from the positive ideal solution, but its indicator assignment method is relatively single [20]. In reference [21], a new model for determining the weight coefficients of the site selection criteria of solar PV projects based on the logarithmic additive assessment of the weight coefficients (LAAW) was proposed, but the model is more arbitrary in its correction of subjective assignments and the evaluation results are easily influenced by expert preferences. In reference [22], an energy efficiency assessment method based on a system weighted directed graph equivalence model was proposed. In reference [23], an effective assessment of distribution network operation economy was achieved by constructing a multi-level expandable assessment model. It is worth noting that most of the studies use only subjective evaluation methods and do not consider the qualitative grading of the evaluation scheme.
In order to more comprehensively assess the impact of distributed PV grid integration on the distribution network, this paper strategically integrates two innovative evaluation indicators. Meanwhile, considering the accuracy of the evaluation results, a new combination assignment strategy is proposed. A comprehensive TOPSIS-RSR evaluation method is adopted, which quantitatively analyzes the grid-connected scheme’s multidimensional performance and further implements a comparative qualitative and quantitative study.
The main contributions of the paper can be summarized as follows:
1) To solve the problem of an imperfect comprehensive evaluation indicator system of distribution network, this paper introduces environmental friendliness and absorptive capacity indicators based on voltage quality, reliability, and economic indicators included in the traditional distribution network evaluation system, establishes a more comprehensive secondary distributed PV grid-connected complete evaluation indicator system, and proposes the quantification method of each indicator.
2) Aiming at the limitations of the subjective and objective assignment method, this paper adopts AHP method to calculate the subjective weights of the primary indicators. Combining entropy weight method, coefficient of variation method and CRITIC method, the objective weight results of the secondary indicators are obtained through a consistency test. According to the principle of entropy weight minimization, the subjective weights of the primary indicators and the accurate importance of the secondary indicators are weighted and averaged to calculate the comprehensive subjective and objective consequences of the evaluation indicators.
3) In this paper, a comprehensive evaluation system for distribution networks based on the TOPSIS-RSR method is proposed. The TOPSIS method is utilized to calculate the distance between the indicators to be evaluated and the positive and negative ideal schemes, as well as the relative proximity ranking. The idea of the RSR method is utilized for qualitative and hierarchical analysis to derive the comprehensive evaluation results of different grid-connected schemes.
The structure of the paper is organized as follows: Section 2 systematically presents the comprehensive evaluation indicator system and describes its calculation method; Section 3 delves into the connotation and application of the subjective-objective combinatorial empowerment technique and TOPSIS-RSR method; Section 4 demonstrates and verifies the scientificity and reasonableness of the evaluation method proposed in this study with the help of empirical analysis; Section 5 proposes the conclusion.
2 Distributed PV Grid-Connected Comprehensive Assessment Indicator System
According to the principle that the construction of an indicator system should satisfy comprehensiveness, rationality and independence, the evaluation indicator system of the distribution network constructed in this paper is shown in Fig. 1.
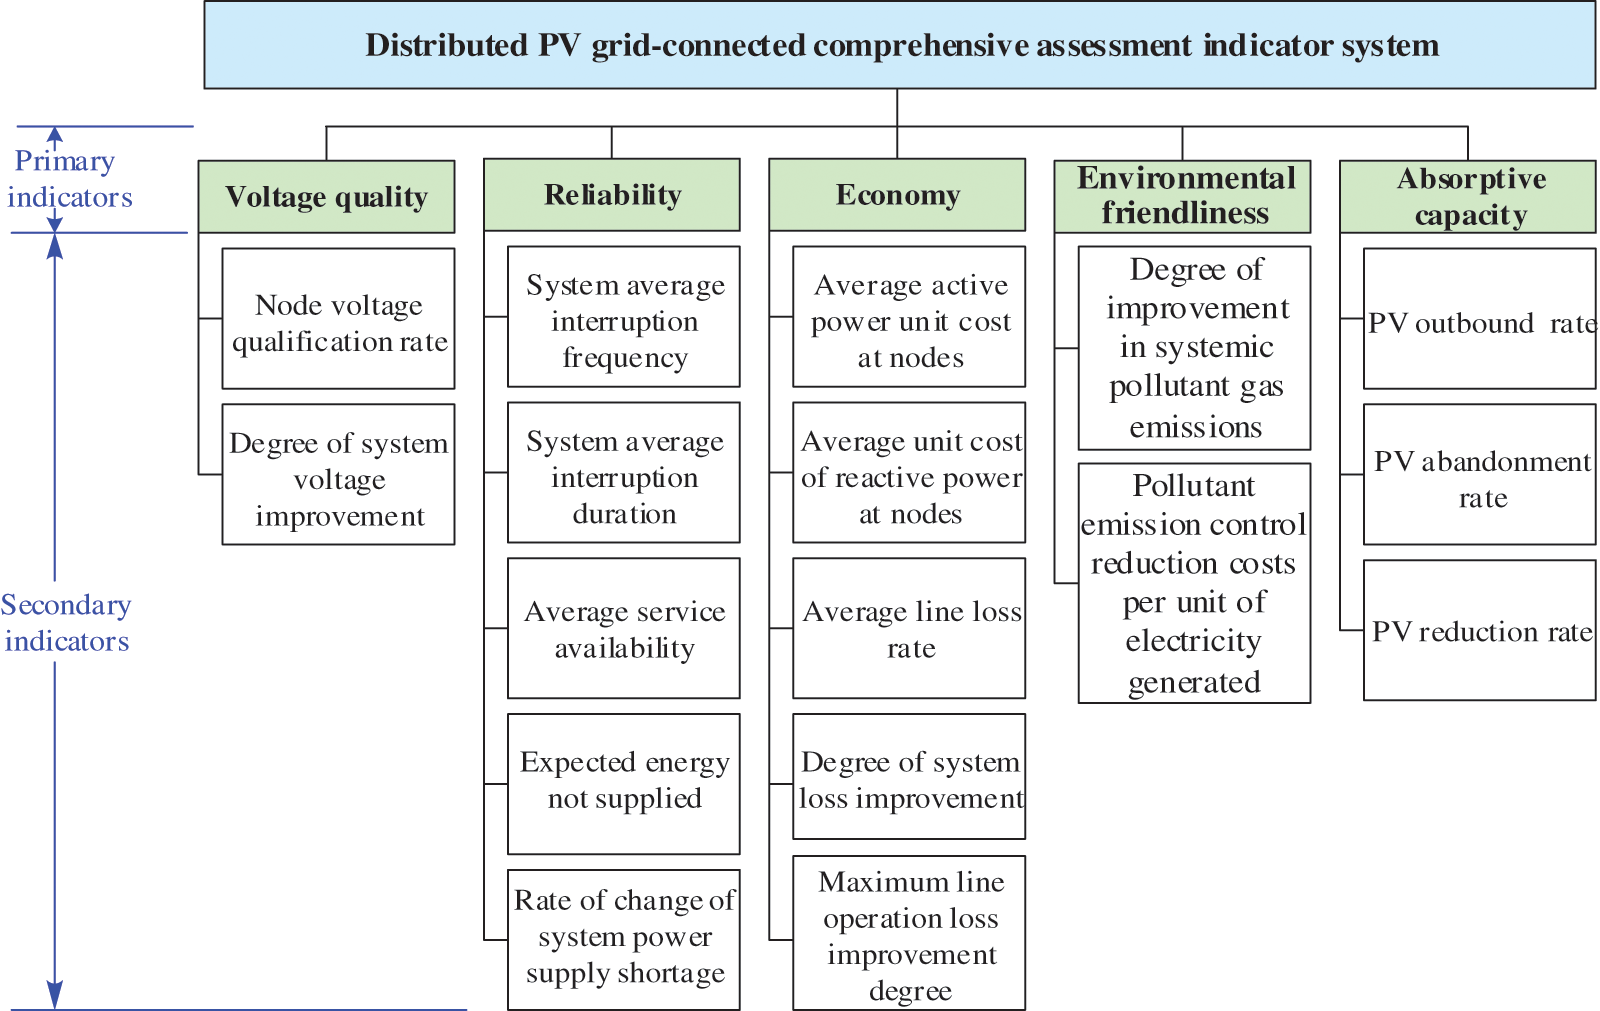
Figure 1: PV grid-connected comprehensive evaluation indicator system
Reliability, voltage quality, and economy are the basic requirements for grid power supply and the primary indicators for evaluating whether PV grid connection is reasonable. Considering the contribution of the PV power generation process to reducing pollutant gas emissions [10] and the practical absorptive problem, the environmental friendliness and absorptive capacity indicators are introduced into the traditional distribution network evaluation system. In contrast, a total of 17 secondary indicators are set up. The specific indicator symbols and calculation methods are shown in Eqs. (1)–(21).
Distributed PV access will change the tidal distribution of the distribution network and affect the node voltage. In order to quantitatively analyze the impact of distributed PV access on the voltage quality of the distribution network, two indicators, node voltage qualification rate and degree of system voltage improvement, are selected to characterize the degree of impact.
1) Node voltage qualification rate refers to the ratio of the number of nodes within the allowed voltage deviation to the total number of nodes after the distributed PV is connected, and the larger the result, the better the voltage quality, that is:
where,
2) Degree of system voltage improvement is determined by the ratio of system voltage amplitude
In this paper, the reliability analysis of the distribution network with distributed PV is carried out by the minimum path method. The Markov stochastic process is used to represent the transition process from the fault state to the normal operation state [24], and the load that can be restored by the distributed PV forming an island when a fault occurs under a particular scheme is determined by the breadth-first search [25]. The specific algorithm flowchart is shown in Fig. 2.
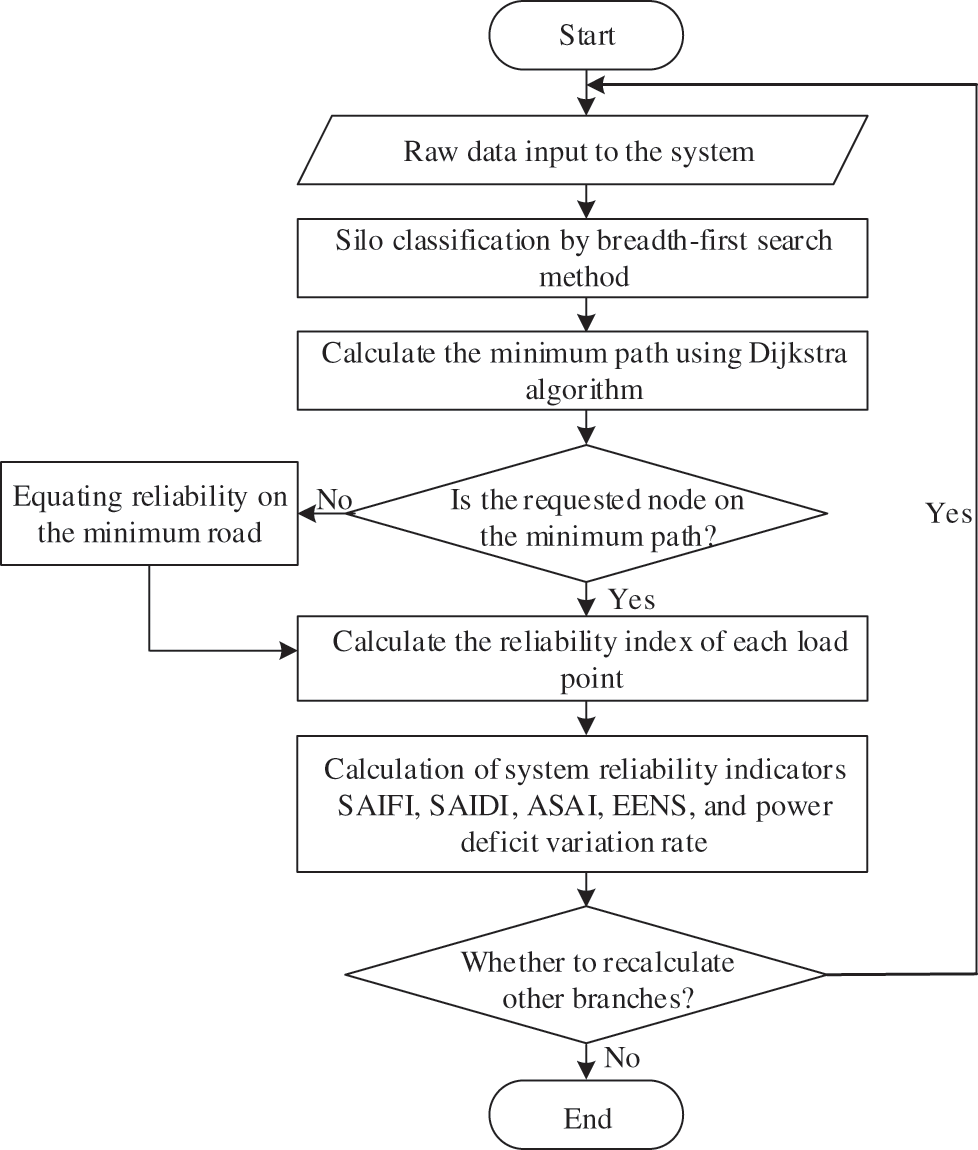
Figure 2: Flow chart for calculating the reliability indicator of the minimum road method
According to the above reliability calculation method, the following indicators are selected to characterize the system reliability of distributed PV after grid connection.
1) System average interruption frequency indicator (SAIFI) (times/user-years) and system average interruption duration indicator (SAIDI) (hours/user-years) are as follows:
where,
2) Average service availability (ASAI) is:
where,
3) Expected energy not supplied (EENS) is:
where,
4) Rate of change of system power supply shortage can be expressed as:
where,
The widespread access to distributed PV changes the traditional distribution network’s power structure and tidal distribution. The system operation status and network losses differ significantly from those before PV access. It can also effectively reduce the intensity of existing distribution equipment in the distribution network, shorten the investment cycle of new equipment, and reduce the cost of the distribution network [26]. Therefore, the following economic evaluation indicators are proposed in this paper in combination with relevant economic parameters.
1) System operating cost caused by the active and reactive power fluctuations at node i are as follows:
where,
Then the average value of active and reactive power unit cost of node i is:
2) Average line loss rate can be expressed as:
where,
3) Degree of system loss improvement can be expressed as:
where,
4) Maximum line operation loss improvement degree can be expressed as:
where,
2.4 Environmentally Friendliness Indicator
Compared with conventional energy generation, PV power generation has significantly lower emissions of pollutants such as CO2, CO, sulfide and nitrogen compounds, effectively improving the environmental friendliness benefits in the energy absorptive processes [27]. Therefore, this paper adopts degree of improvement in systemic pollutant gas emissions and pollutant emission control reduction costs per unit of electricity generated as its environmental friendliness assessment indicator.
1) Degree of improvement in systemic pollutant gas emissions can be expressed as:
where,
where,
The total gas emissions
where, K is the total pollutant gas class;
2) Pollutant emission control reduction costs per unit of electricity generated can be expressed as:
where,
2.5 Absorptive Capacity Indicator
Due to the limitation of the distribution grid structure, the grid-connected absorptive of distributed PV with a high penetration rate is facing significant challenges. In this paper, we consider the coordination relationship between local absorptive and outgoing transmission of distributed PV after grid connection and evaluate the PV absorptive capacity that the system is capable of with three indicators: PV outgoing rate, PV abandonment rate, and PV reduction rate.
1) PV outfeed rate refers to the maximum percentage of PV outfeed power to its total generated power in a certain time. Its equation is:
where,
2) PV abandonment rate refers to the maximum percentage of abandoned power to the total PV power generated in a certain time. Its formula is:
where,
3) PV reduction rate refers to the maximum percentage of total system operating losses over a certain period of time for PV local absorptive and outgoing power, that is:
In calculating the PV inherent in-situ absorptive power
3 Comprehensive Evaluation of Distributed PV Grid-Connected Based on Combined Empowerment and TOPSIS-RSR Method
3.1 Calculation of Subjective Weights for the Primary Indicators
AHP is a systematic evaluation and decision-making method that combines qualitative and quantitative analysis. By establishing a hierarchical model, the subjective judgment of each indicator is transformed into weight analysis to solve complex problems. In this paper, AHP is used to calculate the subjective weights of 5 primary indicators in Fig. 1.
According to the reciprocal inverse theory [29], the indicators are compared two by two using the relative 1–9 scaling method, the indicator judgment matrix
where, RI denotes the random consistency indicator, which is determined by checking the table; C is the number of indicators. At this point, the subjective weight
3.2 Calculation of Objective Weights for the Secondary Indicators
3.2.1 Indicator Pre-Processing
For b PV grid-connected scenarios to be assessed, let there be a total of q secondary indicators under any primary indicator, and construct a matrix X of eigenvalues of the secondary indicator values
To avoid meaningless arithmetic data, certain eigenvalues in matrix X need to be taken as positive, i.e., the larger the value of the more optimal forward indicator
After the transformation, the positive and negative indicators are equalized into positive indicators to obtain the normalization matrix
3.2.2 Calculation of Objective Weights for Different Methods
1) Entropy weight method
The entropy weight method is based on objective indicator data through the calculation of the entropy value of the indicator to find out the weight of each indicator. It can effectively avoid the human subjective factors in determining the weights by the Delphi method, hierarchical analysis method, and other methods [14]. The process of determining the weights of each secondary indicator in Fig. 1 using the entropy weighting method is as follows.
First, the weight of the ith evaluation object indicator eigenvalue
The element
Then, calculate the entropy value
In turn, the weight
where,
2) CRITIC method
The objective weighting method of CRITIC is to calculate the objective weights of indicators based on the contrast between PV grid connection schemes and the conflict information between indicators. The larger the value of the standard deviation indicates that the greater the difference in the calculation results of the indicators under each program, the higher the weight of the indicators. And the conflict information between indicators is expressed by the correlation coefficient, the closer the correlation coefficient is to 1, the smaller the conflict between two indicators, the lower the weight of the indicator [30]. The standard deviation of indicators under each scheme and the correlation coefficients between indicators can be expressed as:
where,
Let the amount of information contained in each secondary indicator
where,
And its weight
3) Coefficient of variation method
The coefficient of variation method is used to assign weights by directly using the information contained in the indicators and by calculating the coefficient of variation of each indicator to the target value [16]. The coefficient of variation of the indicator is:
Further, the coefficient of variation
3.2.3 Consistency Test of Weighting Results
For the same sample set, in order to reduce the influence of weight variability on the evaluation results, the consistency test should be conducted on the indicator weights obtained by different methods before the combination of weights. In this paper, Spearman’s correlation coefficient is chosen to achieve quantitative evaluation of the degree of correlation between the results of different weights, and its formula is as follows:
where,
3.3 Calculation of Subject-Objective Combination Weights
When the consistency test shows that the three assignment methods have a significant positive correlation, the final objective combination weight
3.4 Distributed PV Grid-Connected Evaluation Based on TOPSIS-RSR Method
After determining the weights of each evaluation indicator of the distribution network, the TOPSIS-RSR method is used to evaluate each PV grid-connection scheme comprehensively. A high-dimensional space is formed geometrically if the indicators are considered variables in a coordinate system. Geometrically, each PV grid-connected scheme is a point determined by the values of multiple indicators reflecting it in that space, and the comprehensive evaluation problem becomes the ranking and evaluation of these spatial points.
TOPSIS is used for multi-objective decision analysis to determine the advantages and disadvantages of the scheme by the relative proximity
Step 1: The eigenvalue matrix X of all secondary indicators is constructed and normalized according to Eqs. (24) and (25).
Step 2: To improve the objectivity of PV grid-connected evaluation, the indicator weights determined by the combined assignment method are taken into account in the normalization matrix
Step 3: Since the indicators have been positive, the maximum value
Step 4: Let the Euclidean distances of the ith PV grid-connected scheme to be evaluated to the positive and negative ideal solutions be
Step 5: Calculate the relative posting schedule of the PV grid-connected scheme to be evaluated
Step 6: The relative closeness
Step 7: With the probability unit value Probit as the independent variable and the relative posting schedule
In summary, the comprehensive evaluation process of distributed PV grid-connected based on the combined assignment and TOPSIS-RSR method proposed in this paper is shown in Fig. 3.
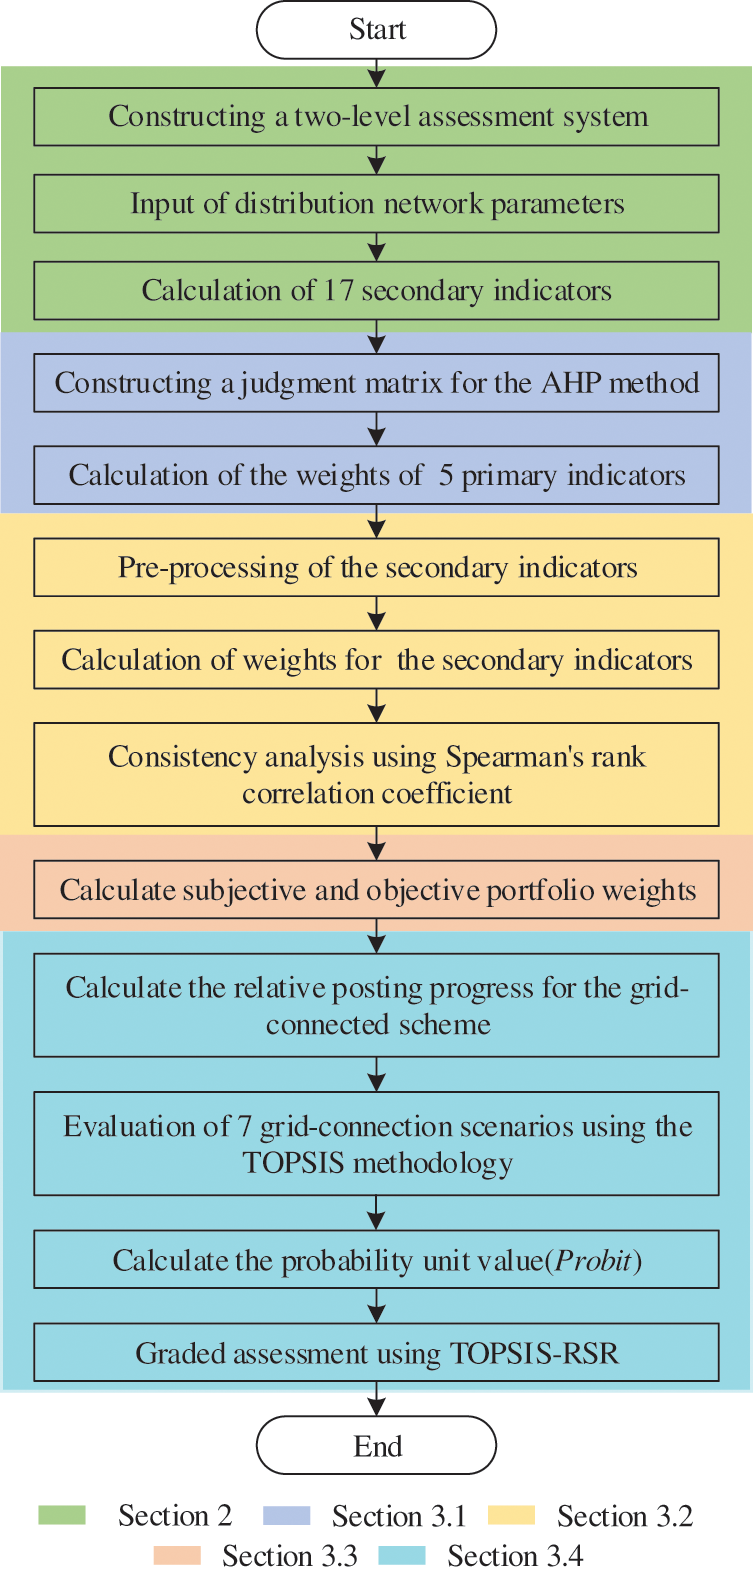
Figure 3: PV grid-connected comprehensive evaluation flow chart
On the basis of the comprehensive evaluation indicator system of distributed PV grid connection established in the previous paper, the IEEE 33 node test system example based on MATLAB 2018 b platform is established to verify the correctness and effectiveness of the combination of assignment and evaluation method proposed in this paper, and its structure is shown in Fig. 4. Node 1 in the example system is a node connected to the higher power grid, and the spacing between any two adjacent nodes is the same, and a total of four branch lines are included, setting the length of the longest branch line (nodes 1–18) as 10 km; The rated voltage of the system is 10 kV. The failure rates of the line and distributed PV power supply are taken as 0.05 times/(km-year) and 5 times/(unit-year), respectively. The corresponding average repair time is taken as 4.0 h/time and 50 h/time, respectively; Various pollutant emission data are selected according to the paper [34]; The load reference value is taken as 3.715 MW, and the PV power reference value is taken as PV output peak 0.47 MW; The load parameters of the standard IEEE 33 node test system are used for each node load, and the user load is calculated according to 4 kW/household; The load variation of each node of the system and the base The distributed PV power output is shown in Fig. 5.
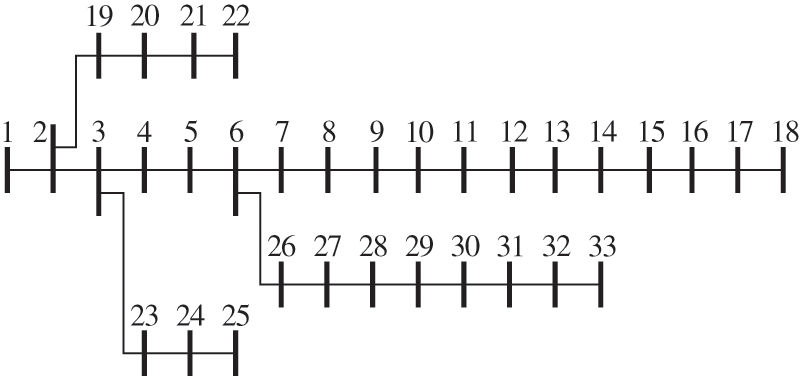
Figure 4: IEEE 33 node test system
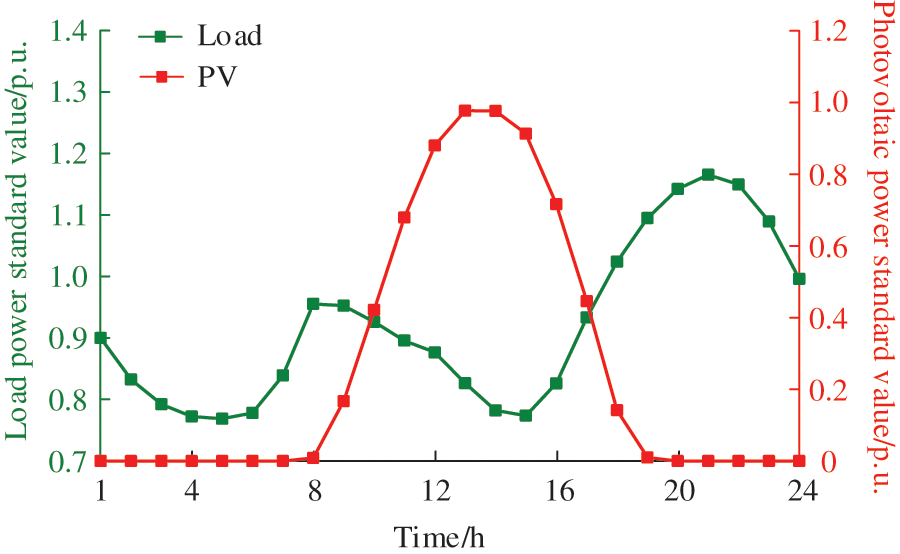
Figure 5: Load and PV power variation curve
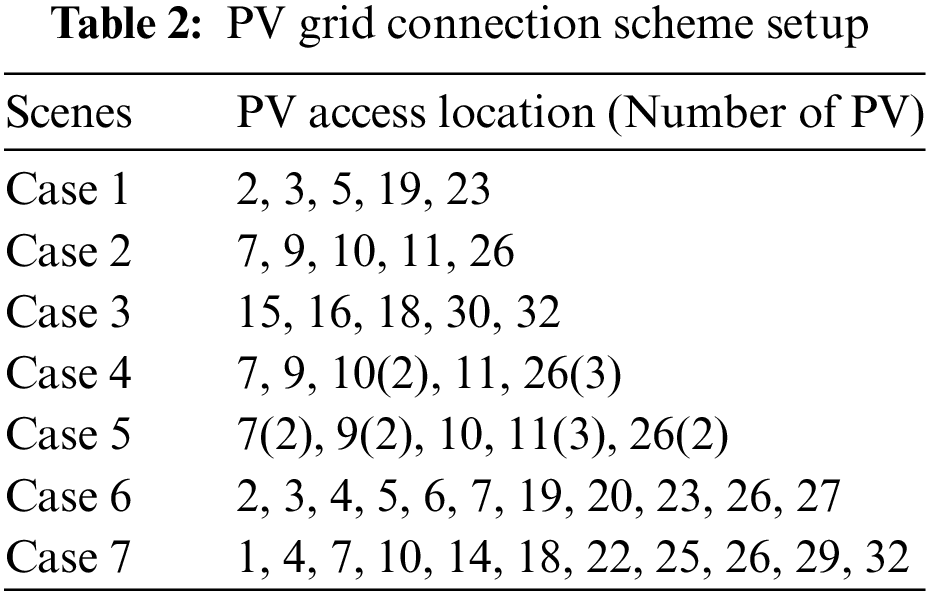
The location and capacity of PV are set to simulate different access scenarios of PV in the distribution grid. The access location, access power, and layout of distributed PV have a certain degree of influence on each indicator of the distribution grid, so this paper sets up 7 scenarios of PV access to the distribution grid, as shown in Table 2. In Case 1, five equal-capacity PV units are connected to the front end of the distribution network, which is used to study the impact of the access location on the distribution network indicators. Case 2 to Case 3 keep the same capacity as Case1 but change the access location to the middle and the end, respectively; Case 4 to Case 5 have the exact access location as Case 2 but adjust the capacity; Case 6 and Case 7 use centralized and decentralized layout strategies, respectively, with the same capacity.
According to the analysis in Section 2.5 of this paper, the Monte Carlo sampling scatter plots under different PV power access quantities, access point distributions, and grid-connected power conditions are shown in Fig. 6. The upper limit of the scatter set under the 1.05 p.u. limitation constraint determines the inherent power absorptive of the distribution network
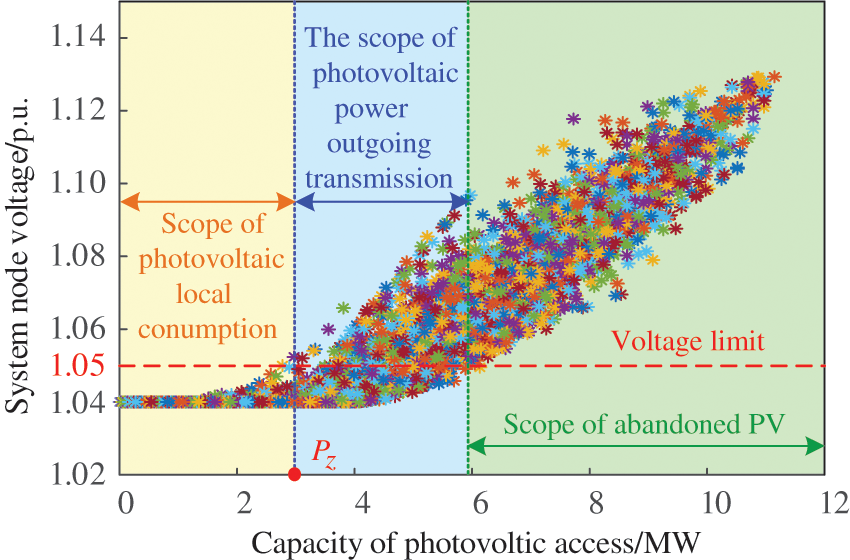
Figure 6: Scatterplot of random scene sampling for PV access
4.2 Analysis of Calculation Results of Evaluation Indicators
The comprehensive evaluation indicator system of distributed PV grid connection established in this paper can reflect the impact of distributed PV access on the distribution network from different dimensions, and the specific degree of impact will change with the location, access power, and layout of distributed PV access. According to the set IEEE 33 node example, the calculation results of each evaluation indicator under seven distributed PV grid connection scenarios are shown in Table 3.
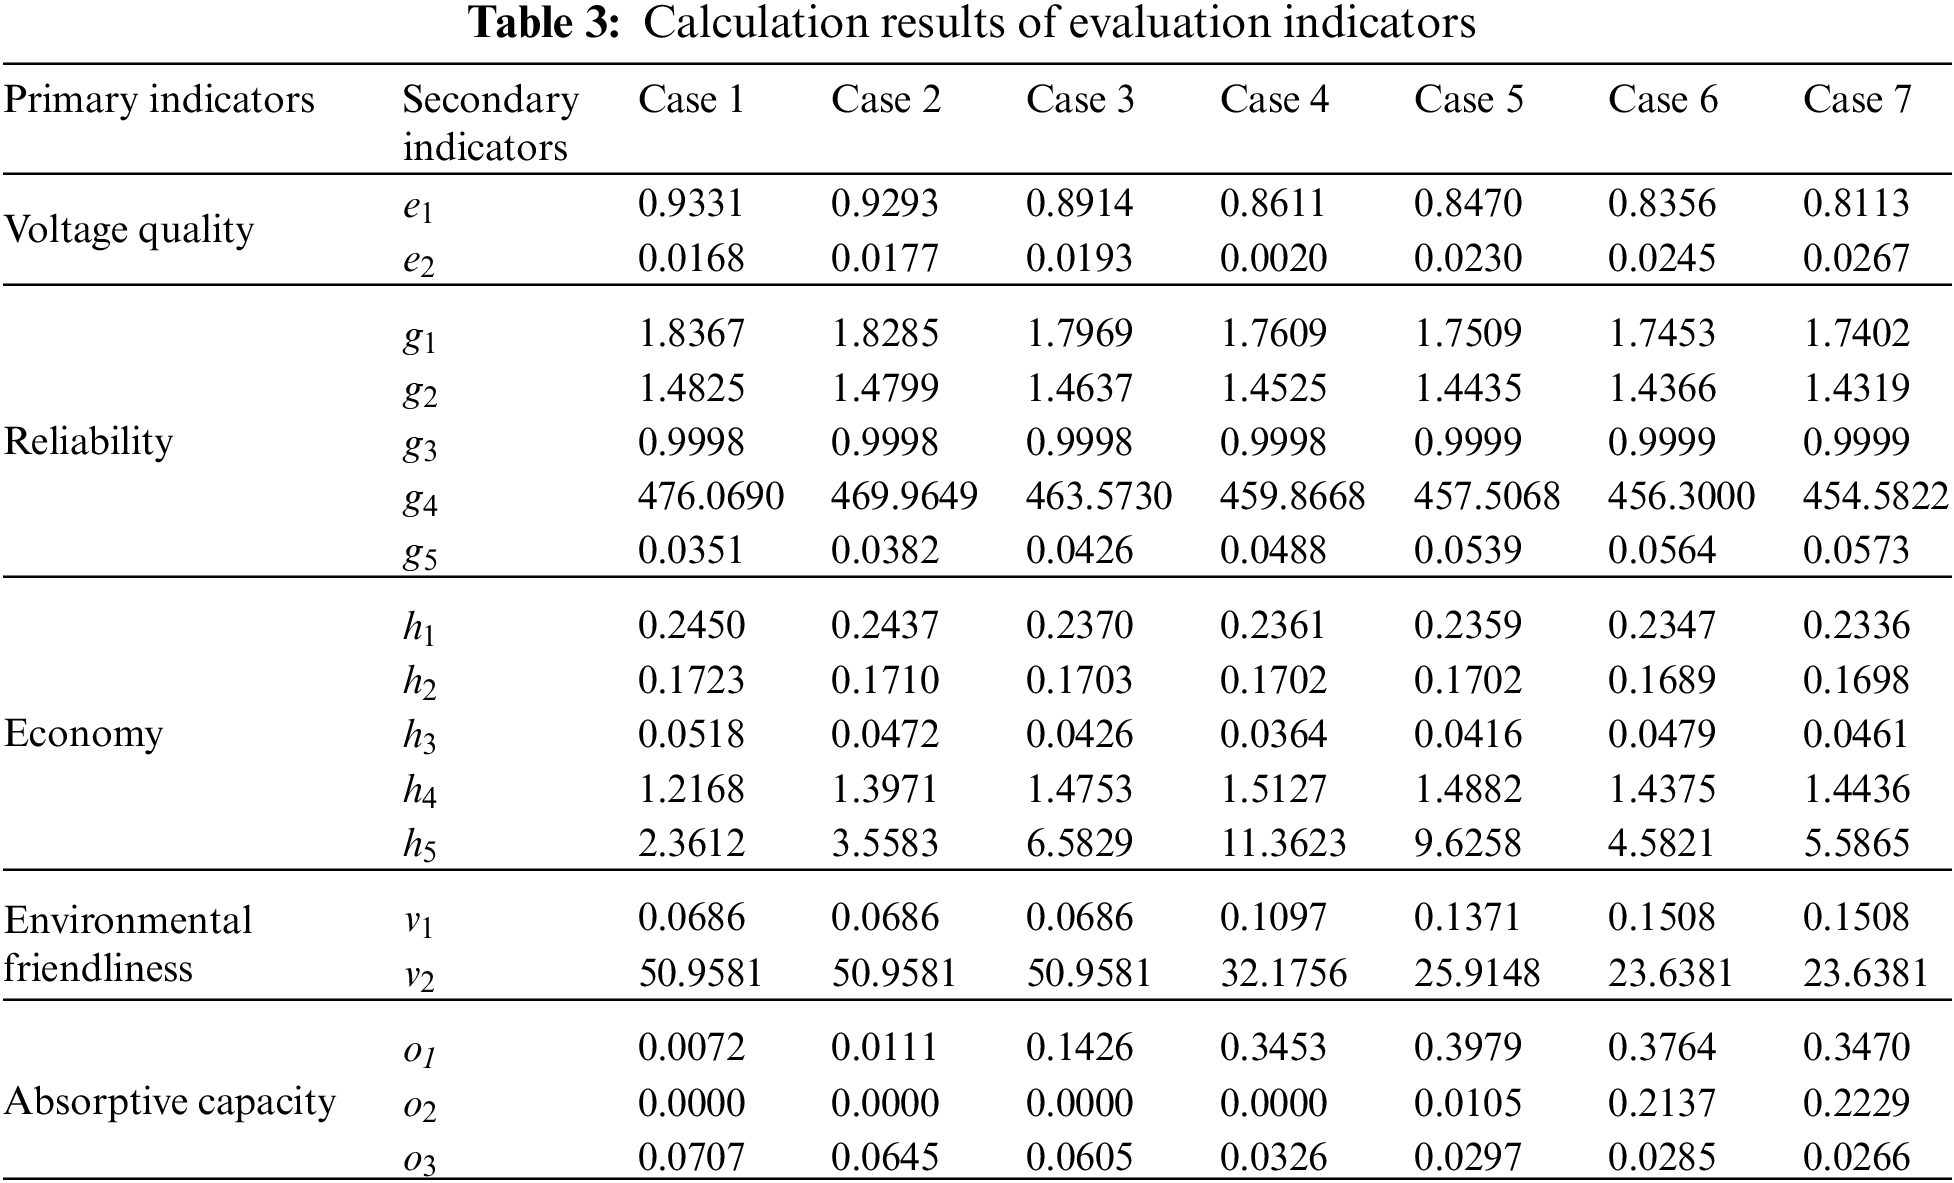
The data in Table 3 show that the system voltage quality has changed significantly after the PV multi-points are connected to the distribution network. Compared with Case 1 and Case 2, Case 3, whose grid connection location is concentrated at the end of the distribution network, node voltage qualification rate is reduced by 4.68% and 4.25%, respectively, and the degree of voltage improvement is improved to a certain extent. Case 5 has a 25% increase in the PV access power compared with Case 4, which produces a specific reduction in the node voltage qualification rate, and the degree of voltage improvement is improved by 15%. Compared with Case 6, Case 7 has more decentralized PV access locations and achieves better voltage improvement.
The distributed PV access has a positive effect on the power supply reliability, as the PV access power increases, SAIFI and SAIDI decrease significantly, so the duration of continuous reliable power supply to the load also increases, the ASAI indicator calculation result increases significantly, which in turn makes the total power supply to the distribution network increase, the EENS indicator result decreases accordingly, and the power supply reliability improves significantly. In Case 5, compared with Case 4, SAIFI, SAIDI, and EENS are reduced by 0.57%, 0.62%, and 0.51%, respectively, and the change rate of system power shortage is improved by 10.45%. In Case 1, Case 2, and Case 3, the reliability improvement is more apparent when PVs are connected from the end of the distribution network, and Case 7, where PVs are connected in a decentralized manner, has a more significant effect on the reliability of the power supply than Case 6, where PVs are connected in a centralized manner.
In terms of economy, from Case 1 to Case 3, the results of all economic indicators are significantly improved. The reason for this is that the lines between some nodes and power points in the distribution network are longer, and the number of power equipment used is higher, and when the PV access location is close to the end, the intensity of the use of power equipment in this part of the node is reduced. The closer the access location is to the end, the more pronounced the magnitude of line loss reduction. And as the PV access power gradually increases, when it is significantly higher than the load demand, the distribution line loss increases instead of decreasing, in which the line loss of Case 4 is at the lowest level. Compared with it, the average line loss rate of Case 5 increases by 12.5%, and the PV access power of Case 6 and Case 7 continues to increase, and the line loss of both further increases.
As a green energy source, distributed PV, with the increase of its grid-connected power, dramatically reduces the emission of polluting gases during power generation, and plays a significant role in improving the indicators related to the environmental friendliness of the distribution network.
Distributed PV with high penetration rate is connected, and when its grid-connected power reaches the local absorptive limit of distribution network, the surplus PV power is considered to be sent out. At this time, the PV outfeed rate of Case 5 has reached its peak, and there is a certain proportion of abandoned light. From Case 5 to Case 7, the abandonment rate gradually increases and the PV outfeed rate significantly decreases.
4.3 Analysis of Weight Calculation Results
4.3.1 Calculation of Subjective Weighting Indicators
The judgment matrix
The maximum eigenvalue
4.3.2 Calculation of Objective Weighting Indicators
The results of calculating the objective weights of the secondary indicators based on the entropy weight method, coefficient of variation method and CRITIC method are shown in Fig. 7. Among them, the entropy weight method and the coefficient of variation method are characterized by EVM and COV, respectively.
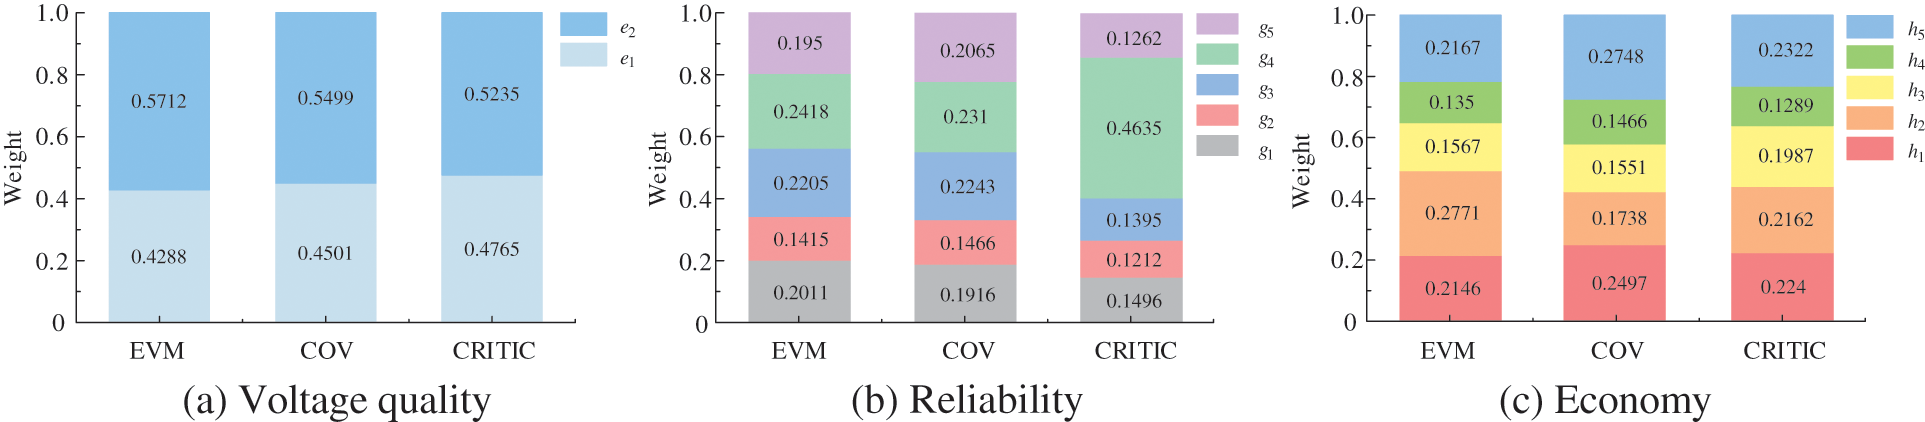
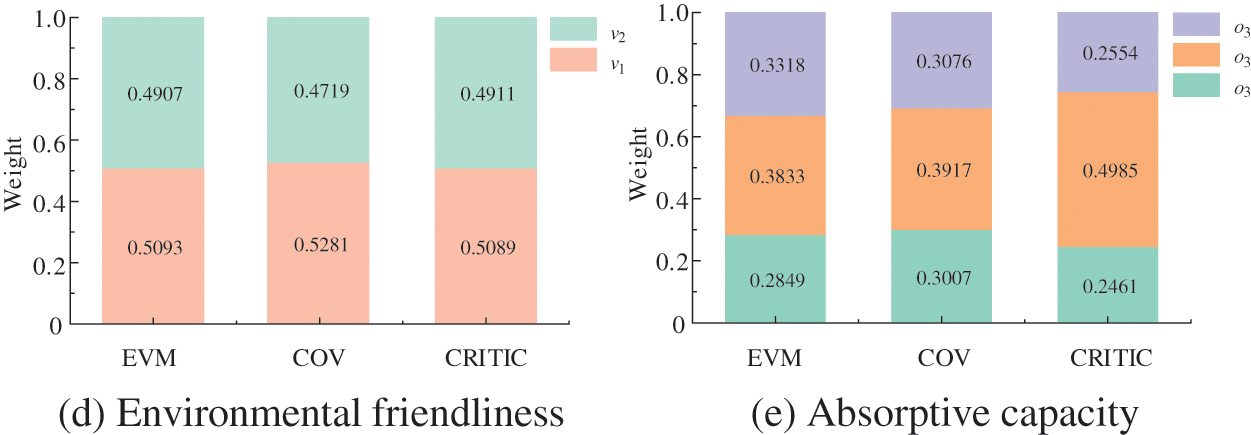
Figure 7: Calculation results of indicator weights by objective weighting method
The results in Fig. 7 show that in terms of voltage quality, the indicator of the degree of system voltage improvement has the highest weight value, indicating that different PV grid-connection schemes have a significant impact on this indicator; In terms of economy, the indicator of the average unit cost of reactive power at nodes calculated by the entropy weight method has the highest weight value, and the indicator of the maximum line operation loss improvement degree calculated by the coefficient of variation method and the CRITIC method has the highest weight value; The degree of improvement of the systemic pollutant gas emissions and PV abandonment rate are the highest weighted indicators for environmental friendliness and absorptive capacity.
From the above analysis, it can be seen that there are some differences in the objective weight calculation results of the three assignment methods, for example, for the expected amount of power shortage in the reliability indicator, the weight calculated by the CRITIC method is nearly twice as much as that of the entropy weight method. Since the weights of each secondary indicator in the primary indicator are a collection of the results calculated by a single assignment method, it is necessary to use Spearman’s correlation coefficient to check the consistency of the three assignment results. The correlation coefficients of voltage quality, environmental friendliness, and absorptive capacity indicators under different assignment methods are calculated to be 1.0, so only the Spearman correlation coefficients of reliability and economy indicators are given, as shown in Fig. 8. The correlation coefficients of the indicators under different assignment methods are all ≥0.7, and there is a significant strong positive correlation, which can prove that the three objective assignment methods have high consistency and meet the requirements of compatibility and consistency of the evaluation method set for the combination of assignment.
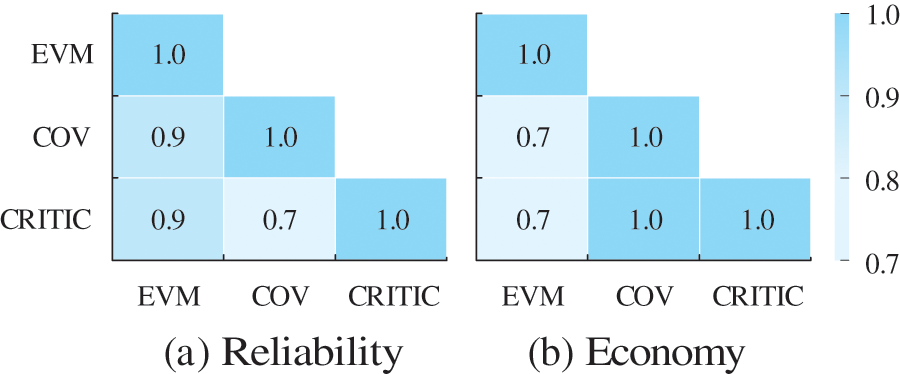
Figure 8: Spearman correlation coefficient calculation results
4.3.3 Subject-Objective Combination of Empowerment Results
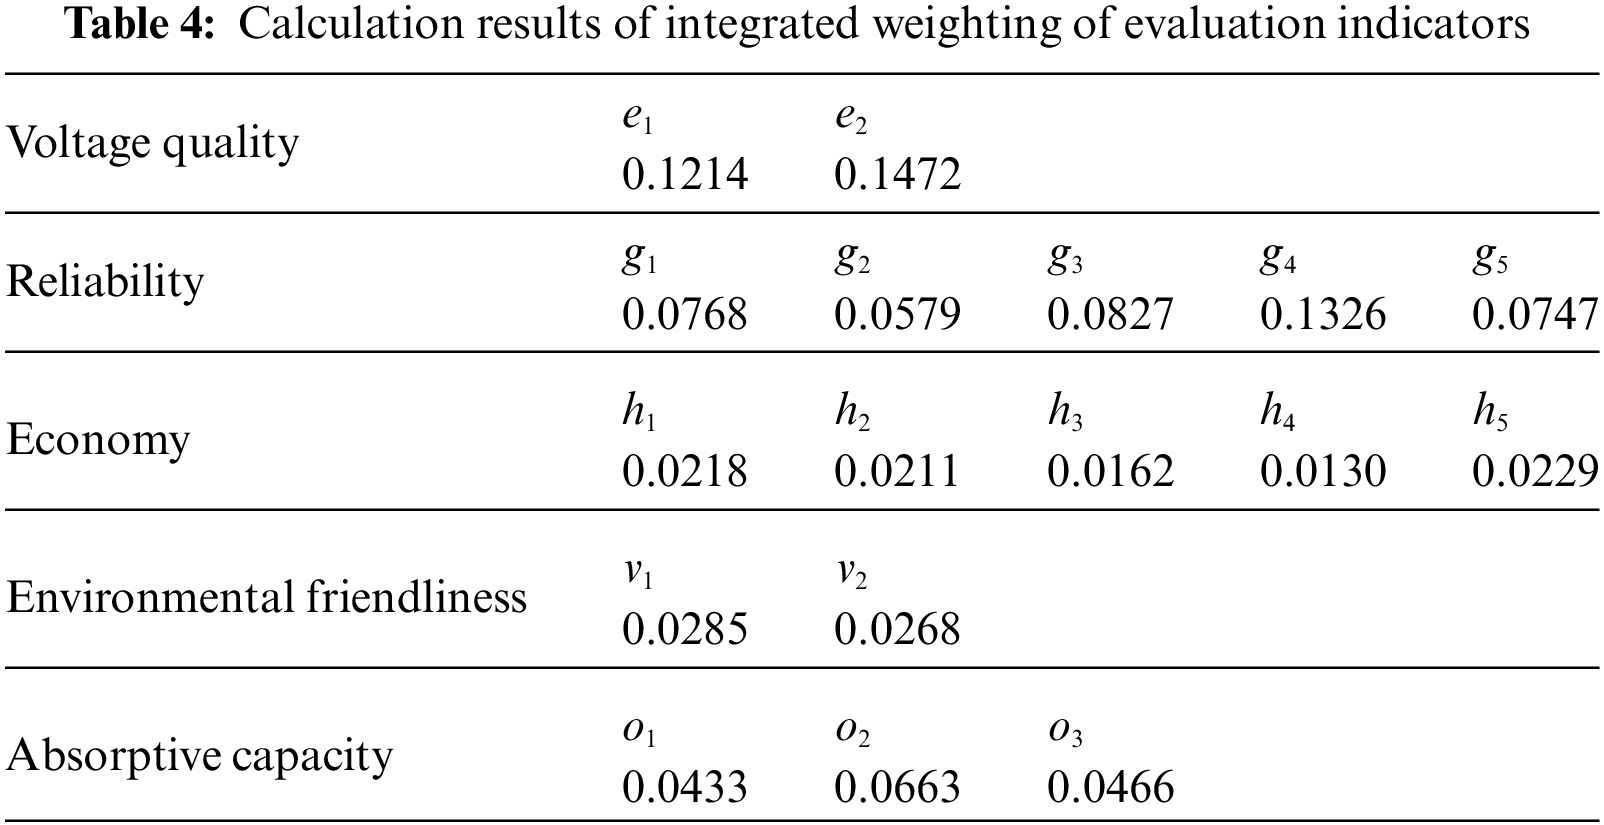
By combining the subjective weights with the average values of the objective weights determined by the three assignment methods of entropy weight method, coefficient of variation method and CRITIC method, the assignment results of the subjective and objective combinations of each secondary indicator are calculated according to Eq. (38), as shown in Table 4. Influenced by the subjective weight of the primary indicator AHP, the combination weight values of the secondary indicators under the voltage quality and reliability indicators are degree of system voltage improvement, expected energy not supplied, node voltage qualification rate and system power supply reliability rate have the largest weights of 0.1472, 0.1326, 0.1214 and 0.0827, respectively, while the degree of system loss improvement under the economic indicator has the smallest weight of 0.0130.
4.3.4 Comparative Analysis with Other Existing Empowerment Methods
The comparison of the assignment results between the method in this paper and the methods proposed in references [16] and [17] are shown in Fig. 9.
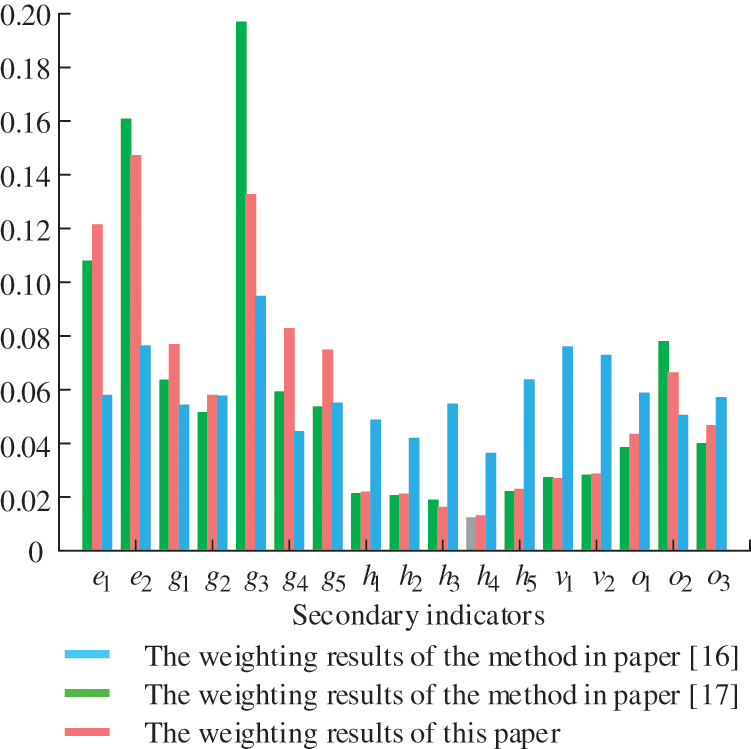
Figure 9: Comparison of the weight calculation results of the proposed method with other methods
Reference [16] used the coefficient of variation method to solve the weight of each indicator. It only uses a single objective assignment method for weight calculation, which can not take into account the advantages of subjective and objective assignment, and its weight calculation results differ significantly from those of reference [17] and the weight calculation results of the combination of subjective and objective assignment method proposed in this paper. The overall trend of the weight values of the indicators in reference [17] and this paper is closer, and the confidence level is higher. However, in this paper, in the dimension of reliability, the weights of most of the secondary indicators are generally higher than those in reference [17], which is in line with the higher requirements for reliability of modernized distribution grids under China’s national conditions; In addition, in the two dimensions of absorptive capacity and economy, most of the secondary indicators in this paper are similarly weighted higher than those in reference [17], which is in line with the main development direction of the distribution network in the new era under China’s national conditions: to improve the distribution network’s ability to consume distributed power sources and to reduce the operating costs of the distribution network [35]. This shows the rationality and correctness of the combination assignment method proposed in this paper.
4.4 Analysis of Weight Calculation Results
Based on the comprehensive weights of the indicators shown in Table 4, the results of the comparison of the comprehensive scores of the seven distributed PV grid-connected schemes set in this paper under the five primary indicator dimensions are calculated by the TOPSIS method as shown in Fig. 10. The Euclidean distance
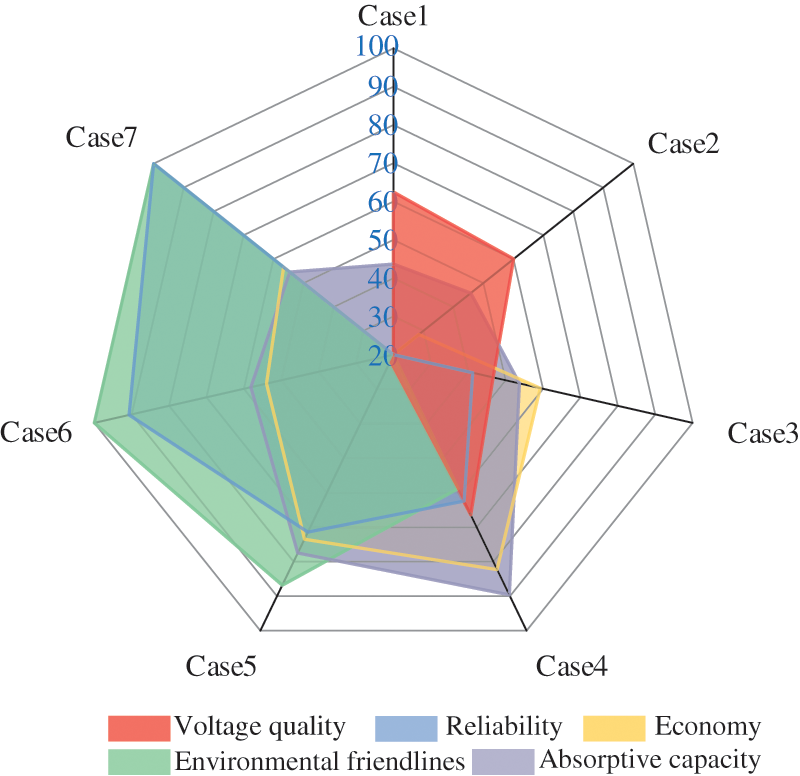
Figure 10: Comparison chart of different dimensional scores
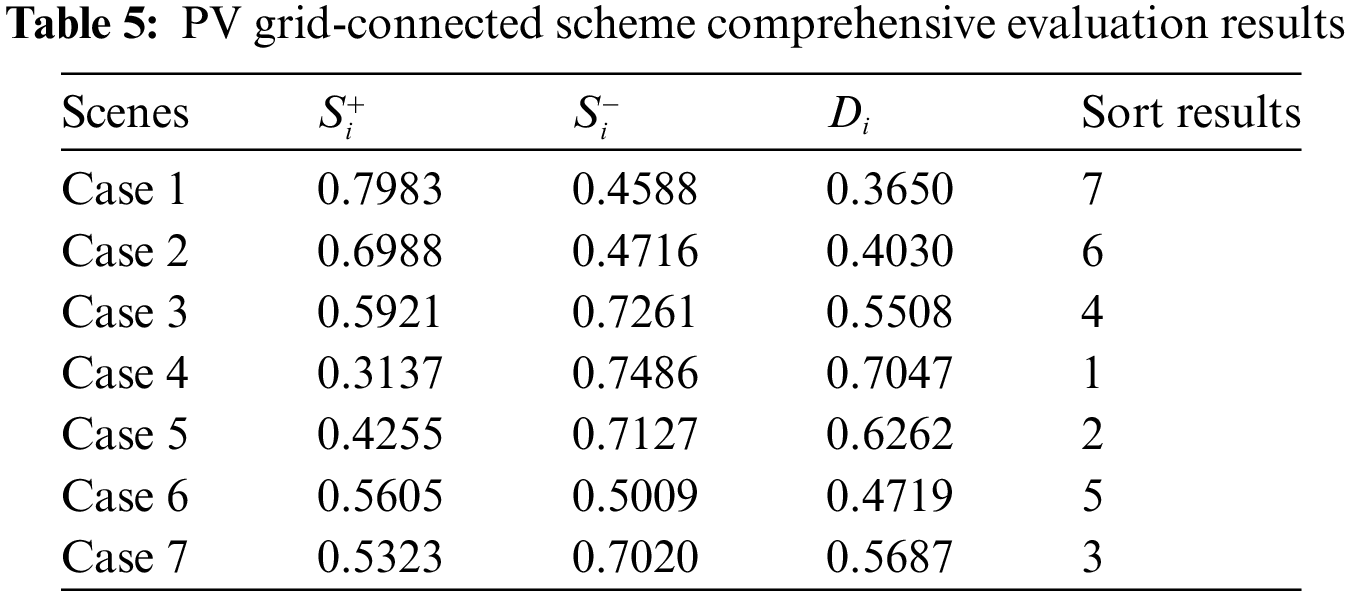
From the results shown in Table 5 and Fig. 10, it can be seen that Case 4 has the highest ranking, with excellent scores in all the primary indicators and the best overall effect on the distribution network after grid connection; Compared with Case 4, the PV grid connection power of Case 5 is improved by 25%, which is more outstanding in terms of environmental friendliness and reliability, but needs to be improved in terms of voltage quality, and is ranked 2nd in the overall ranking. While Case 1 and Case 1 and Case 2 only have higher scores in voltage quality, and the other level indicators are at the bottom, so they are ranked lower in the overall ranking. Case 6 and Case 7 have higher scores in terms of environmental friendliness and reliability, but because the access location of distributed PV in Case 7 is relatively dispersed, it has a certain effect on voltage quality and reliability, so the overall ranking is higher than that of Case 6. Compared with Case 1 and Case 2, the access location of PV in Case 3 is at the end of the distribution network, so there is a certain improvement in all indicators, but its PV grid-connected power is much lower than that of Case 4–Case 7 has a lower score in reliability and environmental friendliness, and is ranked 4th in the overall ranking.
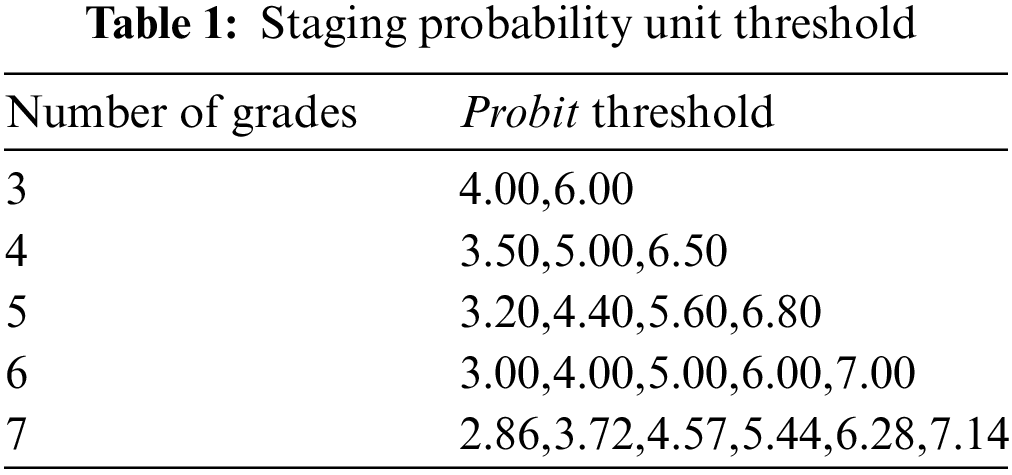
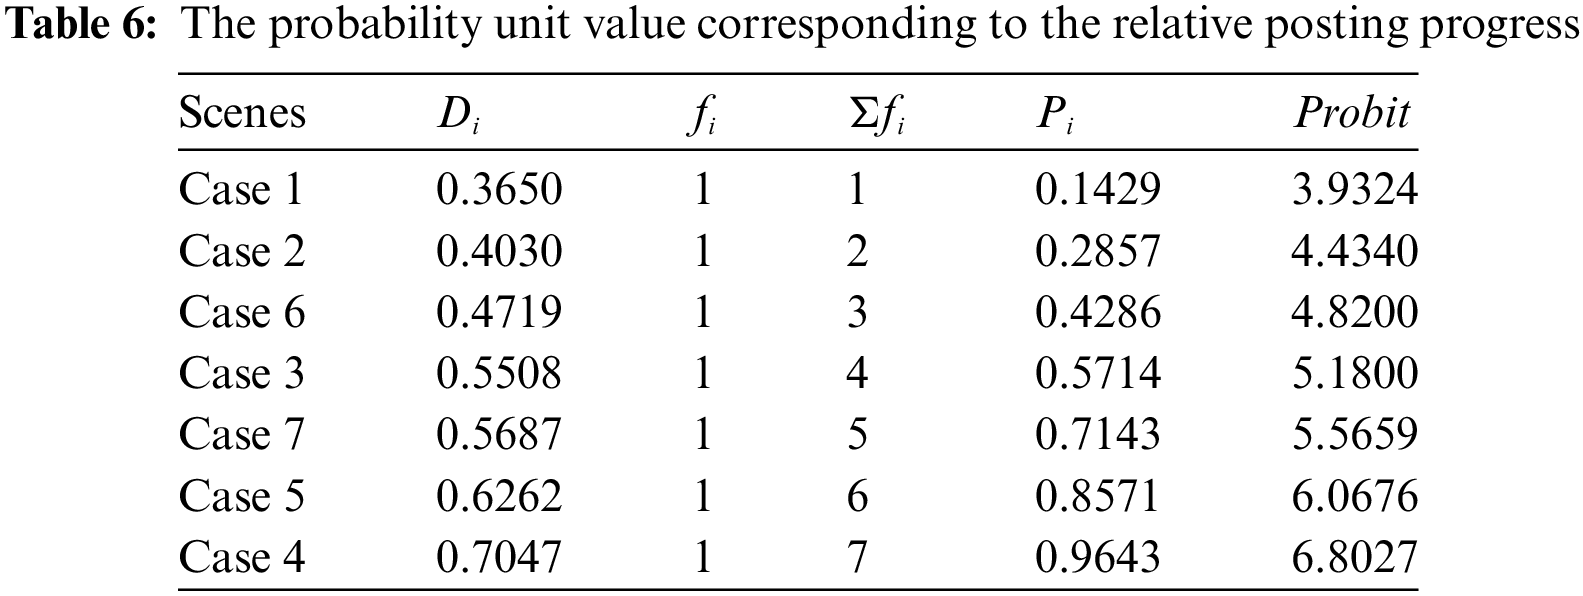
The qualitative graded evaluation of TOPSIS evaluation results using the RSR method, ranked the relative posting progress from smallest to largest, and obtained the corresponding probability unit value (Probit) as shown in Table 6. With the probability unit value Probit as the dependent variable and the relative posting progress as the independent variable, the linear regression equation was fitted using MATLAB as
As shown in Table 7, in order to avoid too little grading leads to the inability to effectively distinguish the advantages and disadvantages of PV grid-connected schemes and too much grading leading to the loss of the significance of grading evaluation, this paper divides the grid-connected schemes into four grades: good, fair, qualified, and poor, and conducts a qualitative evaluation of each grid-connected scheme. According to the Probit critical values (3.50, 5.00, 6.50) selected in Table 1 and the critical relative closeness calculated by the linear regression equation, the seven grid-connected schemes are categorized into different grades. The grading result of Case 4 is “good,” which indicates that the PV grid-connected scheme in Case 4 has the most positive effect on the distribution network.

The composite scores of each evaluation object are obtained by directly multiplying the row vectors composed of subjective and objective combination weights with the normalization matrix
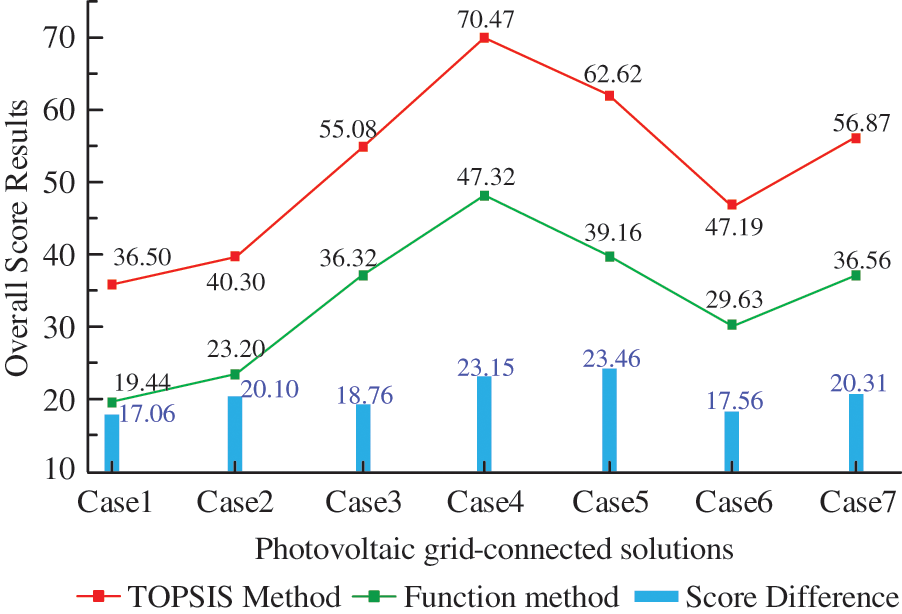
Figure 11: Comparison of composite scoring results of different methods
This paper provides an in-depth discussion of the impact of distributed PV access on distribution networks and establishes an evaluation system for distribution networks that considers distributed PV access. The main conclusions include:
1) Based on the traditional assessment system, this paper innovatively integrates environmental friendliness and absorptive capacity assessment indicators. It constructs a two-level assessment indicator framework, which provides a more rigorous and comprehensive theoretical structure for assessing distribution networks.
2) The AHP method combined with the objective assignment strategy is used to calculate the comprehensive weights of the indicators to ensure the objectivity and empirical reliability of the assessment, and the introduction of Spearman correlation provides a scientific and reasonable verification for the weight configuration.
3) Compared with other TOPSIS improvement methods, the TOPSIS-RSR comprehensive assessment model constructed in this paper carries out statistical grading and uses relative posting progress to replace RSR values for qualitative grading, which further extends the evaluation results of TOPSIS and makes the qualitative evaluation results easier to present objectively. This method suits situations where the indicator information is more random and many programs are to be graded, making the evaluation results more reasonable and credible.
By corresponding and analyzing different distributed PV grid-connected schemes, the research work in this paper provides a powerful reference for the operation, planning, management, and decision-making of new distribution grids, both in terms of making judgments for the overall scheme and in terms of revealing the impacts of the internal factors of each scheme on the assessment results.
Acknowledgement: We would like to thank all those who have reviewed and contributed to this paper for their valuable assistance.
Funding Statement: The authors gratefully acknowledge the support of the project “State Grid Corporation Headquarters Science and Technology Program (5108-202299258A-1-0-ZB)”.
Author Contributions: The authors confirm contribution to the paper as follows: study conception and design: Yue Yang, Jiarui Zheng, Long Cheng; data collection: Yongnan Zhu, Hao Wu; analysis and interpretation of results: Yue Yang, Jiarui Zheng, Long Cheng; draft manuscript preparation: Jiarui Zheng, Long Cheng. All authors reviewed the results and approved the final version of the manuscript.
Availability of Data and Materials: Data supporting this study are included within the article.
Conflicts of Interest: The authors declare that they have no conflicts of interest to report regarding the present study.
References
1. Oda, E. S., Hamed, A. M. A. E., Ali, A., Elbaset, A. A., Sattar, M. A. E. et al. (2021). Stochastic optimal planning of distribution system considering integrated photovoltaic-based DG and DSTATCOM under uncertainties of loads and solar irradiance. IEEE Access, 9, 26541–26555. [Google Scholar]
2. Bawazir, R. O., Cetin, N. S. (2020). Comprehensive overview of optimizing PV-DG allocation in power system and solar energy resource potential assessments. Energy Reports, 6, 173–208. [Google Scholar]
3. Fu, X., Guo, Q., Sun, H. (2020). Statistical machine learning model for stochastic optimal planning of distribution networks considering a dynamic correlation and dimension reduction. IEEE Transactions on Smart Grid, 11(4), 2904–2917. [Google Scholar]
4. Wang, L., Yuan, M., Zhang, F., Wang, X., Dai, L. et al. (2019). Risk assessment of distribution networks integrating large-scale distributed photovoltaics. IEEE Access, 7, 59653–59664. [Google Scholar]
5. Ray, P., Ray, P. K., Dash, S. K. (2022). Power quality enhancement and power flow analysis of a PV integrated UPQC system in a distribution network. IEEE Transactions on Industry Applications, 58(1), 201–211. [Google Scholar]
6. Li, Z., Xu, Y. (2019). Temporally-coordinated optimal operation of a multi-energy microgrid under diverse uncertainties. Applied Energy, 240, 719–729. [Google Scholar]
7. Zeng, Z., Luo, F., Zhang, T., Liu, Y., Liang, M. et al. (2018). Cuckoos-search based hosting capacity calculation for distributed grid-connected photovoltaic generation considering economic cost. 2018 2nd IEEE Conference on Energy Internet and Energy System Integration (EI2), pp. 1–5. Beijing, China. [Google Scholar]
8. Adefarati, T., Bansal, R. C. (2017). Reliability assessment of distribution system with the integration of renewable distributed generation. Applied Energy, 185, 158–171. [Google Scholar]
9. Nyholm, E., Odenberger, M., Johnsson, F. (2017). An economic assessment of distributed solar PV generation in Sweden from a consumer perspective—The impact of demand response. Renewable Energy, 108, 169–178. [Google Scholar]
10. Li, J., Jing, T., Wang, J., Wang, K., Wang, L. (2019). Study on the limit penetration level evaluation method of distributed photovoltaics based on large sample generation-load data. Energies, 12(18), 3544. [Google Scholar]
11. Lv, Z., Li, Q., Huang, R. W., Liu, H. M., Liu, D. (2016). Fuzzy comprehensive evaluation for grid-connected performance of integrated distributed PV-ES systems. IOP Conference Series: Earth and Environmental Science, 40(1), 012033. [Google Scholar]
12. Taylan, O., Alamoudi, R., Kabli, M., AlJifri, A., Ramzi, F. et al. (2020). Assessment of energy systems using extended Fuzzy AHP, Fuzzy VIKOR, and TOPSIS approaches to manage non-cooperative opinions. Sustainability, 12(7), 2745. [Google Scholar]
13. Ge, T., Chen, Y., Wang, Y. (2018). Evaluation of distribution network investment effectiveness based on triangular fuzzy multi-attribute decision making. Power Grid and Clean Energy, 34(10), 12–20. [Google Scholar]
14. Sun, R., Zhang, C., Chen, B., Liao, X., Sun, G. et al. (2021). Comprehensive evaluation of receiving end grid peak shaving modes under background of large-scale new energy. Electric Power Automation Equipment, 41(6), 149–155+163+156–157 (In Chinese). [Google Scholar]
15. Fu, Y., Zheng, Y., Hao, S., Miao, Y. (2021). Research on comprehensive decision-making of distribution automation equipment testing results based on entropy weight method combined with grey correlation analysis. Journal of Physics: Conference Series, 2005, 012220. [Google Scholar]
16. Zheng, H., Xue, M., Han, Y., Zhang, W. (2014). Application of the variation coefficient method to comprehensive evaluation of wind farms. Applied Mechanics and Materials, 488–489, 1447–1453. [Google Scholar]
17. Tang, M., Zhang, K., Xu, X. (2020). Service restoration strategy of a distribution network based on heuristic rules and the AHP-CRITIC algorithm. Power System Protection and Control, 48(14), 1–9. [Google Scholar]
18. Zhao, Q., Yu, C., Liu, J., Zhu, Y., Yang, L. et al. (2021). The techno-economic evaluation of school integrated energy system based on G1-anti-entropy weight-TOPSIS method. IOP Conference Series: Earth and Environmental Science, 675(1), 012157. [Google Scholar]
19. Wu, J., Wang, H., Yao, L., Kang, Z., Zhang, Q. (2019). Comprehensive evaluation of voltage stability based on EW-AHP and Fuzzy-TOPSIS. Heliyon, 5, e02410. [Google Scholar] [PubMed]
20. Li, Y., Li, Y., Li, G., Zhao, D., Chen, C. (2018). Two-stage multi-objective OPF for AC/DC grids with VSC-HVDC: Incorporating decisions analysis into optimization process. Energy, 147, 286–296. [Google Scholar]
21. Deveci, M., Cali, U., Pamucar, D. (2021). Evaluation of criteria for site selection of solar photovoltaic (PV) projects using fuzzy logarithmic additive estimation of weight coefficients. Energy Reports, 7, 8805–8824. [Google Scholar]
22. Tian, L., Cheng, L., Li, R., Sun, S., Shi, C. et al. (2019). A multi-scenario energy efficiency evaluation method for district multi-energy systems based on weighted directed graph. Proceedings of the CSEE, 39(22), 6471–6483 (In Chinese). [Google Scholar]
23. Chen, Y., Wang, L., Huang, Y., Tang, Q., Xu, Y. et al. (2016). Economic benefit evaluation model of distribution network planning based on multi-level extension evaluation method. China Electric Power, 49(10), 159–164. [Google Scholar]
24. Dhople, S. V., Dominguez-Garcia, A. D. (2012). A parametric uncertainty analysis method for Markov reliability and reward models. IEEE Transactions on Reliability, 61(3), 634–648. [Google Scholar]
25. Li, W., Wang, P., Li, Z., Liu, Y. (2004). Reliability evaluation of complex radial distribution systems considering restoration sequence and network constraints. IEEE Transactions on Power Delivery, 19(2), 753–758. [Google Scholar]
26. Li, F., Padhy, N. P., Wang, J., Kuri, B. (2008). Cost-benefit reflective distribution charging methodology. IEEE Transactions on Power Systems, 23(1), 58–64. [Google Scholar]
27. Sinha, P., Wade, A. (2020). Assessing the life cycle cost of decoupling electricity generation from greenhouse gas emissions. 2020 47th IEEE Photovoltaic Specialists Conference (PVSC), pp. 1254–1257. Calgary, Canada. [Google Scholar]
28. Shahidirad, N., Niroomand, M., Hooshmand, R. A. (2018). Investigation of PV power plant structures based on Monte Carlo reliability and economic analysis. IEEE Journal of Photovoltaics, 8(3), 825–833. [Google Scholar]
29. Ali Sadat, S., Vakilalroaya Fini, M., Hashemi-Dezaki, H., Nazififard, M. (2021). Barrier analysis of solar PV energy development in the context of Iran using fuzzy AHP-TOPSIS method. Sustainable Energy Technologies and Assessments, 47, 101549. [Google Scholar]
30. Thakkar, N., Paliwal, P., Ghole, M. S. (2021). Selection of power generation technology using a combination of CRITIC and TOPSIS. 2021 IEEE 2nd International Conference on Electrical Power and Energy Systems (ICEPES), pp. 1–5. Bhopal, India. [Google Scholar]
31. Deng, Y., Jiao, F., Zhang, J., Li, Z. (2020). A short-term power output forecasting model based on correlation analysis and ELM-LSTM for distributed PV system. Journal of Electrical and Computer Engineering, 2020, 2051232. [Google Scholar]
32. Wu, S., Ma, Y., Jiang, H., Liu, T., Zuo, J. et al. (2021). Smart grid terminal security assessment method based on subjective and objective comprehensive weighting. 2021 IEEE Sixth International Conference on Data Science in Cyberspace (DSC), pp. 640–647. Shenzhen, China. [Google Scholar]
33. Chen, F., Wang, J., Deng, Y. (2015). Road safety risk evaluation by means of improved entropy TOPSIS-RSR. Safety Science, 79, 39–54. [Google Scholar]
34. Zheng, Z., Ai, Q., Gu, C., Jiang, C. (2009). Multi-objective allocation of distributed generation considering environmental factor. Proceedings of the CSEE, 29(13), 23–28 (In Chinese). [Google Scholar]
35. Zhu, R., Chai, Y., Wang, C., Zhang, X., Lu, Z. et al. (2022). Research on the development and index system of smart distribution network in China in the future. Proceedings of the International Conference on Information Economy, Data Modeling and Cloud Computing, Qingdao, China. [Google Scholar]
Cite This Article
 Copyright © 2024 The Author(s). Published by Tech Science Press.
This work is licensed under a Creative Commons Attribution 4.0 International License , which permits unrestricted use, distribution, and reproduction in any medium, provided the original work is properly cited.
 Downloads
 Citation Tools