
 Submit a Paper
 Propose a Special lssue
 Open Access
ARTICLE

The Effects of Thickness and Location of PCM on the Building’s Passive Temperature-Control–A Numerical Study
1 College of Energy and Mechanical Engineering, Shanghai University of Electric Power, Shanghai, 201306, China
2 Research and Development Center, Heatmate New Energy Technology Co., Ltd., Shanghai, 200090, China
3 Shanghai Non-Carbon Energy Conversion and Utilization Institute, Shanghai Jiao Tong University, Shanghai, 200240, China
* Corresponding Authors: Tao Zhang. Email: ; Yanming Shen. Email:
Energy Engineering 2024, 121(3), 681-702. https://doi.org/10.32604/ee.2023.045238
Received 21 August 2023; Accepted 18 October 2023; Issue published 27 February 2024
 View Full Text
 Download PDF
Abstract
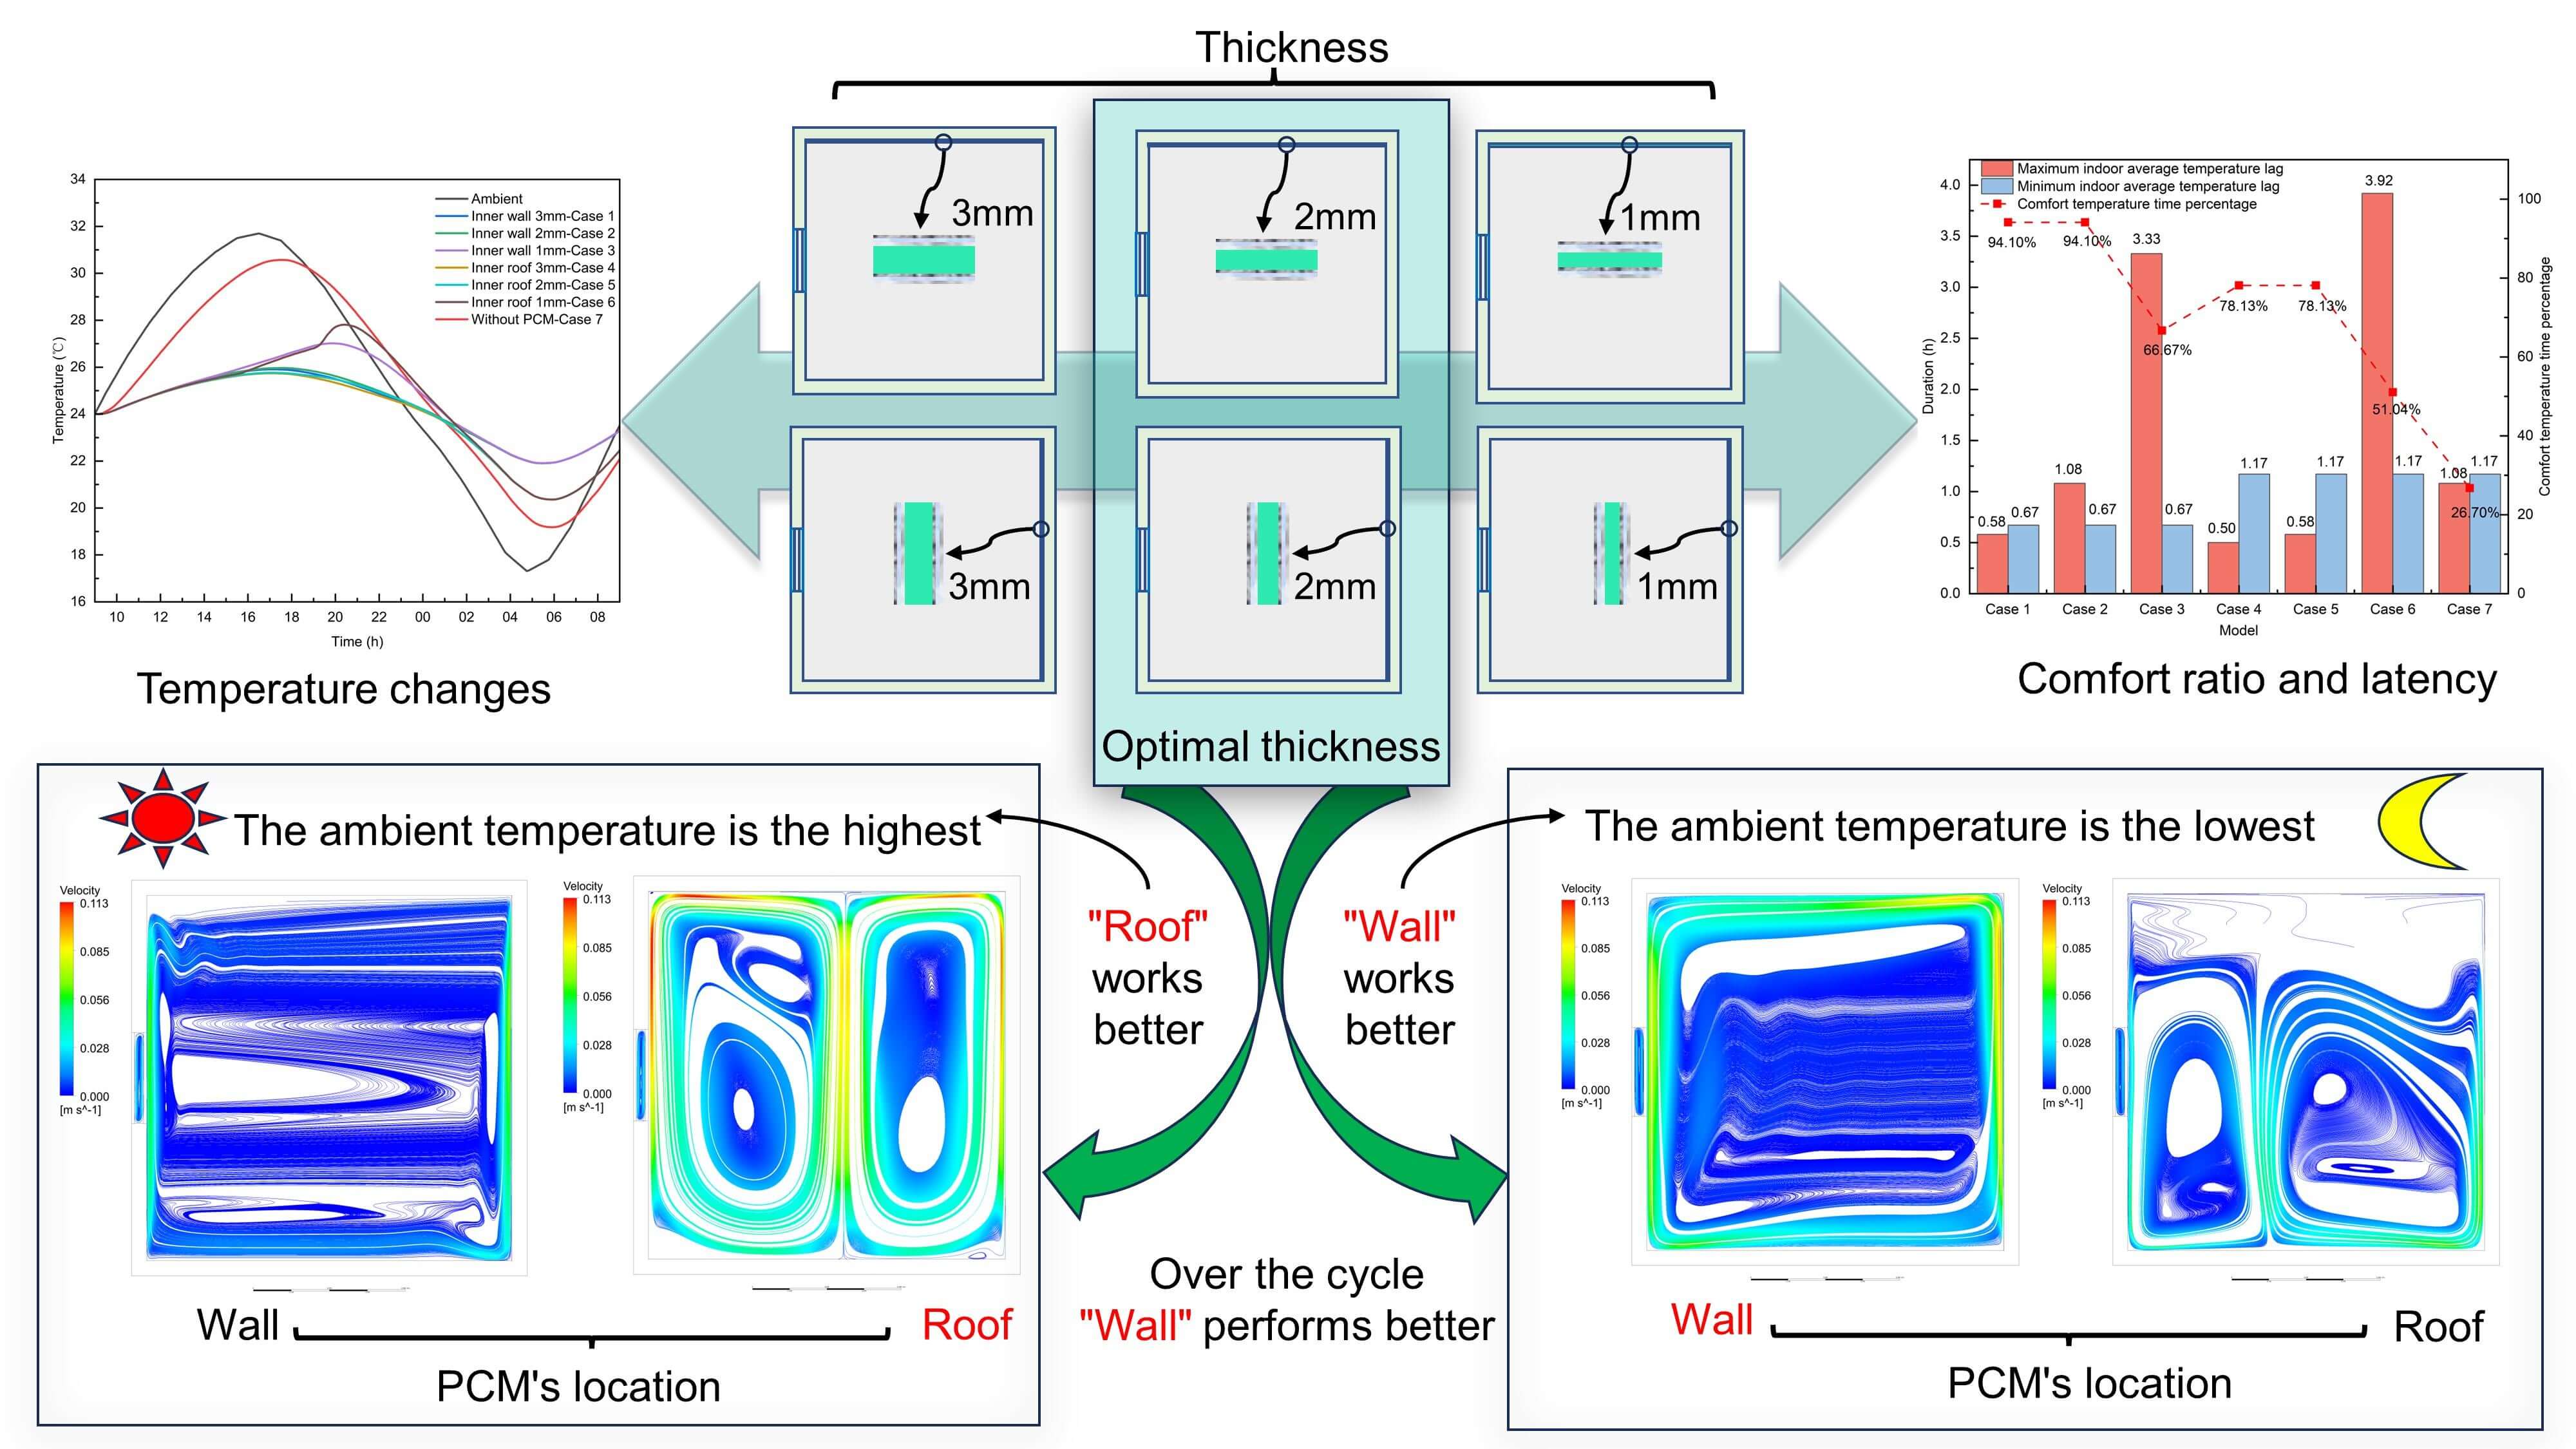
Building energy consumption and building carbon emissions both account for more than 20% of their total national values in China. Building employing phase change material (PCM) for passive temperature control shows a promising prospect in meeting the comfort demand and reducing energy consumption simultaneously. However, there is a lack of more detailed research on the interaction between the location and thickness of PCM and indoor natural convection, as well as indoor temperature distribution. In this study, the numerical model of a passive temperature-controlled building integrating the developed PCM module is established with the help of ANSYS. In which, the actual weather condition of Beijing city is set as the boundary conditions and the indoor natural convection is simulated with the consideration of radiation model. The effects of PCM’s thickness and location on the internal temperature field are analyzed and discussed. The results show that the room could maintain within the human comfort temperature range with the longest ratio of 94.10% and the shortest ratio of 51.04% as integrating PCM. In comparison, the value is only 26.70% without PCM. The room’s maximum temperature fluctuation can also be improved; it could be lowered by 64.4% compared to the normal condition. When the quantity of PCM is sufficient, further increasing the PCM amount results in a temperature fluctuation reduction of less than 0.1°C and does not increase the comfort time. Placing PCM on the wall induces an apparent variation in indoor temperature along the vertical direction. Conversely, placing PCM on the roof can lead to a heat transfer rate difference of up to seven times. The optimal placement of PCM depends on the difference between the environmental and phase change temperatures. If the difference is positive, placing PCM on the roof is more effective; conversely, the opposite holds. According to the results over the entire cycle, PCM application on vertical walls yields better performance. The significant difference in natural convection caused by the same thickness of PCM but different application positions, coupled with the influence of air movement on the melting and solidification of PCM, further impacts indoor temperature fluctuations and comfort. This study can provide guidance for the application location and thickness of PCM, especially for scenarios where temperature regulation is required at a specific time.Graphic Abstract
Keywords
According to data statistics in 2020, the total energy consumption of the housing and construction department was 2.2 billion tons of standard coal, accounting for 45.5% of the total national energy consumption. The energy consumption during the building operation was 1.06 billion tons of standard coal, accounting for 21.9% of the national energy consumption. Carbon emission during the building operation was 2.16 billion tons, accounting for 21.7% of the national yearly carbon emission [1]. Energy consumption during building operation concentrates on the building’s heating and cooling. It is estimated that the energy consumption for cooling will increase by 150% by 2050, and the value will increase by 300% to 600% in developing countries [2]; In addition, due to global climate change, the traditional building envelope fails to cope with the complex external environment [3], which necessitates energy-saving and emission-reduction actions in the building. Thickening the envelope can boost the thermal inertia of the building and further reduce the energy demand; however, in practice, the thickness of the envelope cannot be consistently increased [4]. Phase change materials (PCMs) with sizeable latent heat during the phase change process are considered a meaningful way to improve a house’s thermal inertia and quality [5,6].
It is reported that incorporating PCMs into concrete or brick can enhance the thermal inertia of the wall and further significantly diminish indoor temperature fluctuation [7–9]. Numerical heat transfer analysis of hollow and porous bricks shows that incorporating PCM gives the bricks a more extraordinary ability to delay temperature change [10–12]. Maleki et al. [13] and Kusama et al. [14] incorporated PCM into gypsum board or sheeting as an envelope to study its influence on indoor temperature change. Guardia et al. [15] added different masses of microencapsulated PCM into cement-lime mortars and found that the enthalpy of mortar and the overall thermal conductivity of cement-lime both increased. However, the above integrations accompany obvious drawbacks in practical applications, such as PCM leakage after multiple phase change cycles, low strength of the maintenance structure materials, and so on [9,16]. Encapsulating PCM in the envelope could simultaneously avoid material leakage and enhance the heat transfer area with the environment [17–19]. Meng et al. [20] encapsulated PCM in a rectangular plate and arranged it on the inner surface of the wall; Rathore et al. [21] encapsulated PCM in a tube and conducted experiments by setting it as the middle layer of the wall. Their results indicated that indoor temperature fluctuations were reduced.
Until now, researchers have carried out a lot of experimental and simulation works in integrating PCMs with buildings; the leading software used in numerical simulations are ANSYS, ENERGYPLUS, FEM, MATLAB, and TRNSYS [22]. Saafi et al. [23] showed that applying PCM to the outside of the wall achieved the best temperature performance based on Tunisian climate conditions; however, they also revealed that the integration of PCM with the wall was not economical based on a 30-year cost analysis. Based on ENERGYPLUS, Lei et al. [24] obtained the same conclusion. Zwanzig et al. [25] modeled the thermal properties of a PCM-based multilayer wall by one-dimensional transient equations, and the results indicated that there existed an optimal PCM location related to the thermal resistances of the PCM and the outer envelope. However, for the optimal location of PCM, there is no consensus in academia; many studies reported that the PCM layer should be closer to the heat source [26], while some studies suggested that the intermediate location was better [27]. Abd El-Raheim et al. [28] investigated the effect of microencapsulated PCM on indoor comfort through experiments and simulations.
Typically, the effect of applying PCM is more often assessed from the building scale [29–31]. Auzeby et al. [32] pointed out that inserting PCM as a certain layer of the building’s envelope could lower the indoor temperature fluctuation and lengthen the indoor temperature delay time. Ventilation and human activity in the room also affect the PCM’s performance. The introduction of nighttime ventilation which aims to increase the PCM’s solidification at night and thus better complete the heat absorption during the day is receiving more and more attention. However, the research on passive temperature regulation based on PCM still needs to be improved.
As seen from the above, current research on integrating PCMs with buildings focuses either on the PCM’s structural components or the indoor temperature fluctuation with ventilation based on the whole building scale. It lacks research on the effects of PCM on the indoor air temperature and flow field for passive temperature regulation. In addition, the uniformity of indoor temperature also affects human comfort, but it has often been neglected in previous studies. In this study, the numerical model of a building integrating PCM for passive temperature control is established. The optimal location and thickness of the PCM and its corresponding melting and solidification ratios are revealed and investigated. At the same time, the natural convection induced by the PCM in the room is studied and analyzed, and the position distribution and flow speed of the indoor airflow are presented and invited to reveal and explore the uniformity of the indoor temperature. We also discuss the effect of introducing PCM on the duration of temperature comfort, the effect of reducing temperature fluctuations, and the effect on the maximum and minimum indoor temperatures. This study provides a reference for the practical application of PCM, and provides a data basis for subsequent studies to improve the application effect.
The PCM used in this study is inorganic-eutectic, its phase change temperature is 24°C. As shown in Fig. 1, the enthalpy during phase change is measured by DSC [33], and its value is 125 kJ/kg. In addition, its thermophysical properties are listed in Table 1. Particularly, the PCM is macro-encapsulated and then attached to the wall surface to avoid material leakage [34]. Of which, The PCM was developed by Heatmate New Energy Technology Co., Ltd., is specially fabricated. It will transform into a gel state rather than a liquid state during the melting process. Meanwhile, the encapsulated PCM cannot flow during the phase change process. Therefore the heat transfer between the PCM and the encapsulated materials is dominated by heat conduction. The package layer of the PCM module is shown in Fig. 2. It consists of pure aluminum, nylon, and glass fiber from the inside to the outside. The effective application of PCMs requires not only considering the PCM itself, but also the thermophysical properties such as thermal conductivity and specific heat capacity of the encapsulating material [35]. The equivalent thermal conductivity of the encapsulating material is 180 W/(m·K).

Figure 1: DSC of PCM
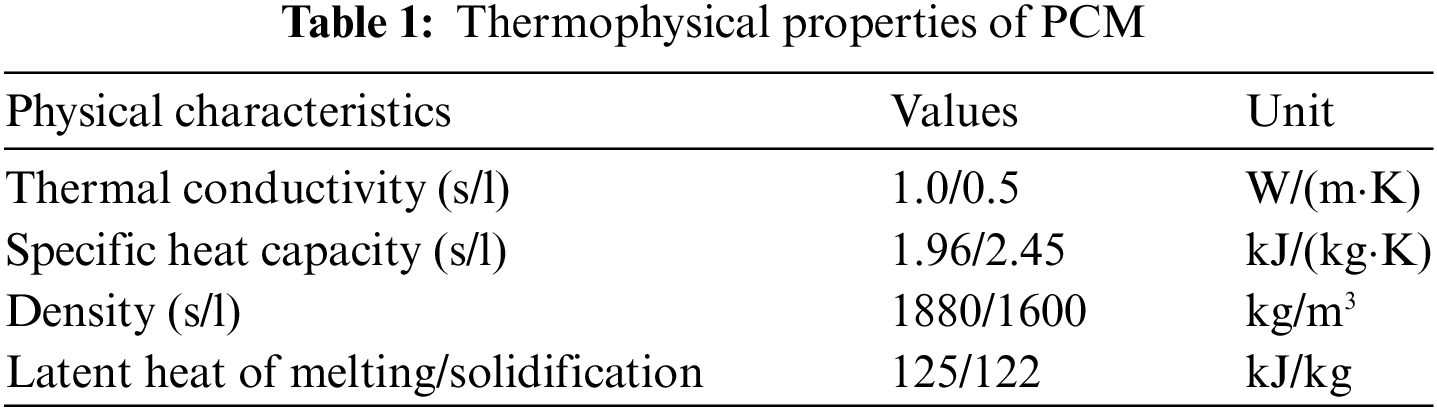

Figure 2: Structure diagram of the building and the PCM module
3 Model Establishment and Validation
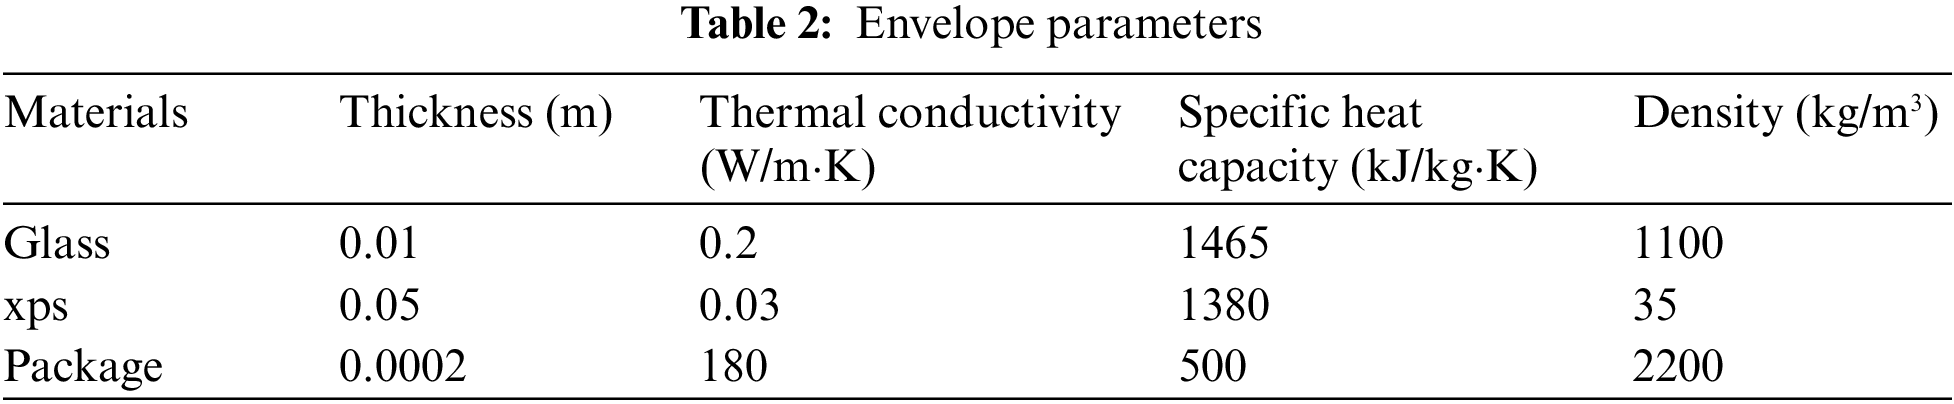
Considering the order of magnitude difference between the required PCM thickness and the dimensions of the building, a large number of meshes, as well as a large number of computational resources, are required to build a 3D model; meanwhile, considering that the building is symmetrical. Therefore, a 2D model is built in this study. The structure of the building is shown in Fig. 2. The wall thickness is 50 mm; a double-glazed window with an air interlayer is set on the southern wall, and the thicknesses of the glass and air layer are 10 and 30 mm, respectively; the height of the window is 300 mm; the material of the wall is extruded polystyrene, which has excellent insulation properties and widespread application [36]. In the simulation, the PCM’s thickness is respectively set at 3, 2, and 1 mm, and the location is on the vertical wall and the roof. The time step is 5 min, and the simulation lasts 24 h. The model includes six temperature monitoring points. Points 1, 2, and 3 correspond to a height of 1.75 meters in a 3-meter-high room, which is the approximate height of the human body. Points 4, 5, and 6 correspond to a height of 0.6 meters in a 3-meter-high room, which is the approximate height of a bed. The human body will normally experience more pronounced temperature changes at these two heights. The dimensions and thermophysical properties of the materials used in the model are listed in Table 2.
Taking into account the melting and solidification of the PCM, the following simplifications and assumptions are made to establish the building’s model with PCM attached:
1. The air flows in the window sandwich and the interior of the building are two-dimensional and no other heat sources are placed in the room;
2. The solid materials are isotropic and homogeneous, and their thermophysical properties do not vary with temperature;
3. Only heat conduction occurs within the PCM module, which is in accord with its inherent characteristics;
4. For the air, the boussinesq assumption is employed for its density, while the other thermophysical properties do not vary with temperature;
5. For initialization, the initial temperature is the same and the PCM is fully solid.
Based on the above assumptions, the mass conservation equation, momentum equation, and energy equation for the air inside the building can be expressed as follows:
where
The energy equation for the solid materials at the wall and window is as follows:
where
where
The energy equation for the PCM during melting and solidification processes can be expressed as:
of which,
where
where
3.3 Initialization and Boundary Conditions
The temperature of the whole model is initialized to 23.9999°C, which is slightly lower than the phase change temperature to ensure that the PCM is fully solid at the initial time. The ambient temperature of a particular day in Beijing city is selected as the input condition. The boundary conditions of the external surfaces of the building are set as the second type [37]. As mentioned before, the external envelope used in this study is extruded polystyrene. In practice, it is wrapped by a thin metal shell on the outside; the heat gains or dissipates with the extruded polystyrene through the thin metal shell. However, due to the very small thickness, the presence of this metal layer is not considered when simplifying the model. Therefore, the first boundary condition is set to reflect the heat gain or heat loss in the presence of this thin metal layer. In addition, the boundary condition between the building and the ground is often set as adiabatic in the reported works. However, there is heat exchange between the bottom wall and the ground in reality. Thus, in this study, the boundary condition of the bottom wall is also set as the first type. As soil is more thermally inert than the air, its temperature fluctuation is comparatively smaller as the ambient temperature and solar irradiation change. The ambient and ground temperatures generated by combining the influences of solar irradiation and the outdoor dry bulb temperature are displayed in Fig. 3.

Figure 3: Temperature boundary conditions on the side wall and the bottom wall
The model in this study is meshed by quadrilaterals and the simulation is completed by ANSYS 2022R1. Firstly, calculating the Reynolds number of the model shows that the airflow within the model is turbulent. Therefore, the Realizable k-ε model is chosen. Using the equivalent comprehensive temperature that includes solar radiation as the boundary condition, the radiation heat transfer between the various wall surfaces inside the room is also calculated when calculating the indoor temperature change. Meanwhile, the energy equation residuals are controlled below 10−6 for convergence requirements. The comparison results of the liquid fraction of a specific application scenario (PCM thickness: 2 mm, location: vertical wall) under three different numbers of meshes (67684, 98645, and 124572 meshes for Num 1, Num 2, and Num 3, respectively) are shown in Fig. 4a. The results show that the difference between the Num 1, Num 2, and Num 3 is within 1%; of which, the difference between Num 2 and Num 3 is within 0.1%. Simultaneously taking the calculation accuracy and the computation time into account, the mesh number of Num 2 is selected.

Figure 4: (a) Liquid fractions of PCM under different mesh quantities; (b) Model validation with Fioretti et al. [38]
A refrigerated container enveloped with PCM is selected to validate the proposed model. As shown in Fig. 4b, the results generated by the present model under the same initial conditions and materials are compared with the results reported by Fioretti et al. [38] using the COMSOL Multiphysics software. Firstly, the wall used in this application is very similar to the enclosure structure in this study. Secondly, although the literature used second-type boundary condition which is differ from the first-type boundary condition in this study, the equivalent comprehensive temperature for each surface is calculated based on its weather data, solar radiation data, convective coefficient, and surface absorption coefficient. The replacement is reasonable. The comparison results indicate that the average error between the two models is only 1.3%, and the maximum deviation is just 2.1%, the proposed model in this study is applicable.
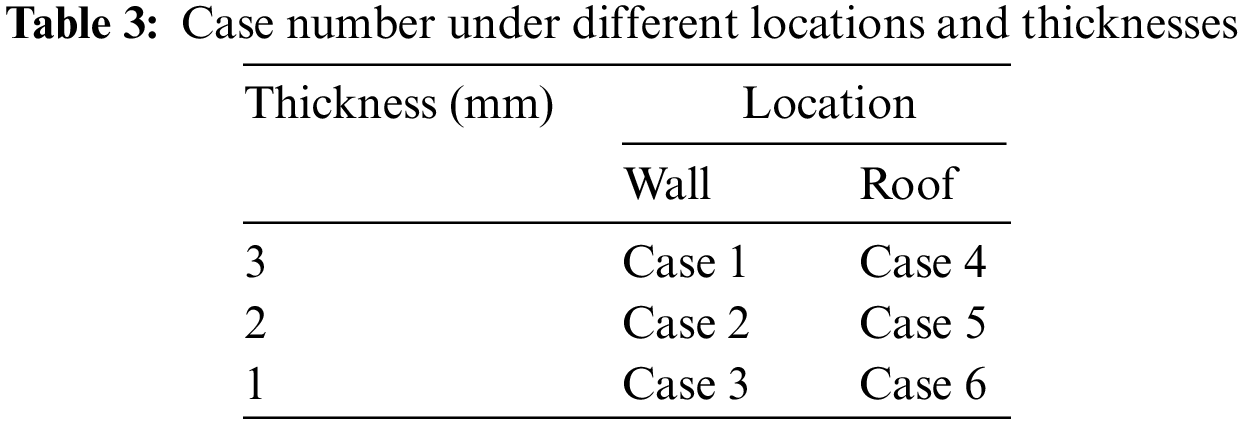
This study involves different thicknesses (1, 2, 3 mm) and different locations (vertical wall and roof) to reveal and optimize the passive temperature-control effect of PCM. Meanwhile, the results without PCM are also presented for comparison. For convenience, according to Table 3, the different conditions are referred to as Case 1 to Case 6; while the condition without PCM is Case 7.
The international standard specifies that the human comfort temperature ranges between 22°C–26°C. This study employs the volume-averaged temperature that could reflect the room’s overall hot and cold conditions to reveal the deviation between the actual temperature and the appreciate value. The variations of the volume-averaged temperature of the seven scenarios are shown in Fig. 5. As can be seen from Fig. 5, without integrating PCM, the room reaches its maximum and minimum temperatures 65 and 70 min later than that of the ambient, respectively; of which, the average room temperature above 26°C lasts 11.33 h the maximum value is 30.57°C; the average temperature below 22°C lasts 6.25 h, the minimum value is 19.18°C. The average room temperature within the human comfort range only occupies 26.74% of the whole day, and the overall room temperature fluctuation reduces by only 20.8% compared to the ambient temperature.

Figure 5: Variations of ambient temperature and average indoor temperature under different cases
As integrating PCM, as shown in Fig. 5, when the ambient temperature was higher than the PCM’s phase change temperature, Case 1, Case 2, Case 4, and Case 5 could regulate the room temperature within the human comfort range. The best one is achieved by Case 4, its average room temperature is only 25.74°C at the highest. The highest average room temperature can be reduced by 4.83°C, which is higher than the achievements of Zhu et al. [39], Mahdaoui et al. [10], and Jamil et al. [40] but lower than that of Saafi et al. [23]. The temperature in the above four published works could be lowered up to 3.28°C, 3.5°C, 1.1°C, and 5.35°C, respectively. Followed by Case 5, its average room temperature is 25.76°C at the highest. For Case 1 and Case 2, their average room temperatures reach the maximum values of 25.91°C and 25.97°C, respectively, slightly below 26°C. It could be concluded that PCM arranged on the roof performs better than on the wall. Case 3’s average room temperature exceeds 26°C after approximately 7 h, indicating that the small thickness of PCM fails to supply sufficient latent heat to manage the average room temperature within 26°C. For Case 3, the average room temperature exceeds 26°C for 6.67 h, with a maximum value of 27.02°C, while for Case 6, the average room temperature exceeds 26°C for 6.5 h, with a maximum value of 27.81°C. Case 6 even shows an average temperature exceeding 27°C for 2.58 h.
When the ambient temperature is lower than the phase change temperature, the location of the PCM shows a significant ability in regulating the room temperature. However, the PCM’s thickness, especially at the same location, fails to get the expected result. For the PCM on the vertical wall, the average room temperatures under different thicknesses are the same, their value below 22°C last for about 1.42 h and the lowest value is only 0.095°C lower than 22°C. In these cases, they can still be considered effective. While the PCM is arranged on the roof, the average indoor temperature below 22°C lasts for about 5.25 h; of which, the value below 21°C lasts for 3.08 h; meanwhile, the lowest value falls to 20.36°C.
In addition, the simulation results indicate that when the PCM’s thickness meets the temperature control requirements, thickening PCM is meaningless in room temperature management; Fig. 5 proves the above conclusion that the average room temperature curves are largely coincide in different scenarios. However, when PCM is insufficient, the sensible heat absorption of the PCM leads to a rapid rise in room temperature, and a significant temperature difference is reflected.
Fig. 6 also shows that integrating PCM delays the occurrence times of the highest and lowest average room temperatures compared with the ambient temperature. As shown in Fig. 6, When the ambient temperature is higher than the phase change temperature, the occurrence times of the highest temperature of Case 1 and Case 4 could be delayed 0.58 and 0.50 h, respectively, but 0.50 and 0.58 h earlier than Case 7; that of Case 2 and Case 5 delay 1.08 and 0.58 h, respectively; that of Case 3 and Case 6 delay 3.33 and 3.92 h, respectively. These delays are less than the performance, which was four hours in the study by Mahdaoui et al. [10]. The reason for the long delay of Case 3 and Case 6 is that the PCM becomes a normal envelope after it completely melts; the heat entering the room keeps on raising the temperatures of PCM and air, which puts off the occurrence time of the maximum temperature. When the ambient temperature is lower than the phase change temperature, the occurrence times of the lowest temperature of Case 1, Case 2, and Case 3 are all delayed by 0.67 h, while that of Case 4, Case 5, and Case 6 are all delayed by 1.17 h. A larger thickness could produce more delay time when the PCM is absorbing heat but does not produce more delay time when the PCM is releasing heat.

Figure 6: Variations of the latency time and comfort time percentage under different cases
Integrating PCM can also lengthen the duration of comfort hours. As shown in Fig. 7, the average indoor temperature can be maintained between 22°C and 26°C for 94.10% of the whole day in Case 1 and Case 2, whereas it is only 66.67% in Case 3%, and 78.13% in both Case 4 and Case 5, and only 51.04% in Case 6. By implementing PCM, the comfort ratios in Case 1 and Case 2 increase by 67.36%, approximately twice the performance which was the 34% observed in the study of Jamil et al. [40]. Meanwhile, integrating PCM can also lower the maximum average temperature and raise the minimum average temperature. To highlight the difference in effect, the reduction in maximum average room temperature and the increase in minimum average room temperature is compared to Case 7. As shown in Fig. 7, the temperature fluctuations of Case 1, Case 2, and Case 3 are only 35.1%, 35.6%, and 44.8% of that in Case 7, respectively, and the values of Case 4, Case 5, and Case 6 are 47.2%, 47.4%, and 65.4%, respectively. Compared to roof cases, integrating PCM on the wall achieves smaller temperature fluctuations throughout the day, despite the average room temperature increasing very small under conditions of Case 4 and Case 5; when the ambient temperature is higher than the phase change temperature, it decreases more when the ambient temperature is lower than the phase change temperature. These two scenarios work barely satisfactorily to regulate the room temperature under the temperature-varying environment during the complete period. In Case 3 and Case 6, the latent heat of PCM is insufficient to absorb the superfluous heat, which results in a rapid temperature rise. Therefore, taking the amount of PCM and the temperature fluctuation into account in the room, Case 2 is the best solution.

Figure 7: Tempering effect of different models
Human comfort is not only influenced by the average room temperature but also by the minimum and maximum room temperatures at certain times of the day. Meanwhile, the minimum and maximum room temperatures also reflect, to some extent, PCM’s ability to regulate the temperature change. The seven scenarios’ maximum and minimum room temperatures are shown in Figs. 8a and 8b. As can be seen from Fig. 8, the room’s temperature rise rate is more significant when the ambient temperature rises; meanwhile, the reached temperature is higher when PCM is placed on the wall. Excluding the 1 mm PCM scenarios, when PCM is placed on the wall, it could lower the maximum room temperature up to 3°C compared to the conditions placed on the roof. Likewise, placing PCM on the wall also achieves a better effect on regulating the minimum room temperature; as seen from Fig. 8, it could lift the minimum room temperature 1.6°C higher than that placed on the roof.


Figure 8: Variation of room temperature under different conditions; (a) Maximum indoor temperature; (b) Minimum indoor temperature; (c) Temperature at point 2; (d) Temperature at point 5
Figs. 8c and 8d show the variations of the average temperature at point 2 and point 5 under seven conditions. As can be seen from Figs. 8c and 8d, excluding the 1 mm PCM scenarios, when the ambient temperature is higher than the phase change temperature, the temperatures at point 2 and point 5 both do not exceed 26°C, but the temperature difference between point 2 and point 5 is smaller when PCM is installed on the roof. However, when the ambient temperature is lower than the phase change temperature, the temperature changes at point 2 and point 5 are both similar to the average temperature change in the room. Placing PCM on the wall achieves better performance, it could lift the room temperature 2°C higher than that on the roof. For the conditions with 1 mm PCM, the temperatures at point 2 share a similar temperature trend and exceed 26°C; however, the temperatures at point 5 do not exceed 26°C when PCM is placed on the wall.
4.2 Room Temperature Uniformity
It is worth noting that when the amount of PCM is sufficient, the average room temperature can be maintained in the comfortable range. However, the room temperature is uneven. Fig. 9 shows the temperature distributions in Case 2 and Case 5 when the ambient temperature is at the highest and the lowest. As seen from Fig. 9, in Case 5, the temperatures of the six points are almost the same; In contrast, in Case 2, temperatures of the above three points are significantly higher than that of the bottom three points when the ambient temperature is at its highest value, the maximum temperature difference is greater than 1°C; when the ambient temperature is at its lowest value, there is also temperature difference between the measurement points.

Figure 9: Temperature variations at different points; (a) Case 2; (b) Case 5
Fig. 10 shows the temperature fields of the two scenarios described above; as can be seen from Fig. 10, when the ambient temperature is at its highest, placing PCM on the wall leads to a significant temperature variation in the vertical direction; no similar phenomenon can be observed when PCM is placed on the roof. When the ambient temperature is at its lowest, placing PCM on the wall reduces the unevenness degree of the temperature distribution.

Figure 10: Temperature variations at different times and locations; (a) Case 2 (maximum temperature outside); (b) Case 5 (maximum temperature outside); (c) Case 2 (minimum temperature outside); (d) Case 5 (minimum temperature outside)
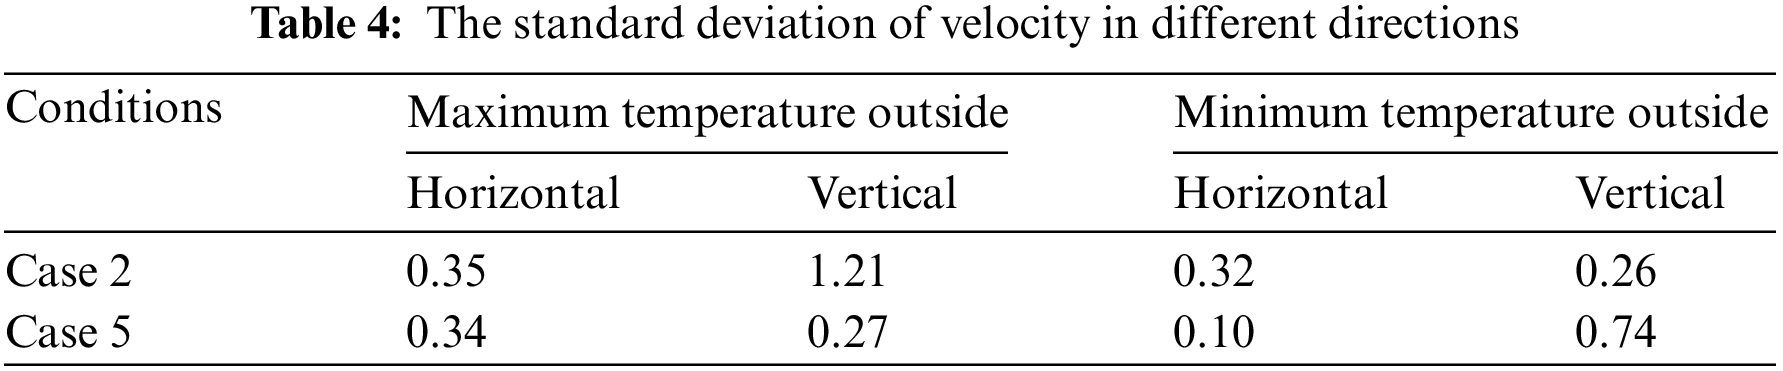
The uniformity of temperature distribution is quantified by the standard deviation of temperature at different cross-sections at the room’s center point, as shown in Table 4. The highest standard deviation is observed in Case 2 in the vertical direction when the ambient temperature is higher than the phase change temperature, reaching 1.21. Following this, in the scenario where the ambient temperature is lower than the phase change temperature, Case 5 exhibits a vertical standard deviation of 0.74. The other standard deviations are all below 0.35.
The uniformity of temperature distribution in the room is closely related to the airflow. Figs. 11 and 12, respectively, depict the airflow velocity field and streamlines corresponding to Fig. 10. As can be seen from Fig. 11, when the ambient temperature is higher than the phase change temperature, the high-temperature air concentrates at the top of the room under the vertical wall conditions. Only a tiny part of air contacts the PCM and is cooled down along the surface of the PCM; then, the tiny part of air is heated by the vertical wall on the other side where PCM is not arranged. However, the hot air concentrated at the top has no cooling source to cool it down, so it does not flow downwards; the effective airflow is not formed, and the exchange between the air above and below is insufficient, resulting in stratification in the room temperature. As shown in Fig. 12a, in most spaces, airflow primarily flows horizontally, with minimal vertical movement. Therefore, while the airflow velocity near the wall may peak at 0.06 m/s, the prevailing average rests at approximately 0.01 m/s. This phenomenon arises from the fact that a significant 75.78% of the surface area experiences velocities below this mean value. In contrast, when PCM is arranged on the roof, the air being heated by the vertical wall converges at the top. Then, it is cooled by the PCM at the roof, creating a relatively effective and full airflow in the room and, therefore, a more even temperature distribution. The vicinity of the wall sees the airflow velocity peaking at approximately 0.11 m/s while the downward-converging air from the top maintains a velocity of around 0.08 m/s. As shown in Fig. 12b, it forms the most adequate flow. Consequently, the computed average airflow velocity stands at 0.03 m/s, with a noteworthy 55.35% of the total area experiencing velocities beneath this mean value. To sum up, a reasonable PCM arrangement could promote airflow and enhance the heat exchange between the PCM and the air; when the ambient temperature is higher than the phase change temperature, the arrangement on the roof is better.

Figure 11: Speed field of airflow; (a) Case 2 (maximum temperature outside); (b) Case 5 (maximum temperature outside); (c) Case 2 (minimum temperature outside); (d) Case 5 (minimum temperature outside)

Figure 12: Streamlines of airflow; (a) Case 2 (maximum temperature outside); (b) Case 5 (maximum temperature outside); (c) Case 2 (minimum temperature outside); (d) Case 5 (minimum temperature outside)
When the ambient temperature is lower than the phase change temperature, for the case in which PCM is arranged on the wall, the air is heated by the PCM and then cooled at the other side of the wall, forming a circulation against the wall; however, in this case, although the indoor airflow is enhanced, the flow cycles very near the wall, the air in the center does not fully participate in the circulation. As shown in Fig. 11c, close to the PCM, the airflow velocity attains a peak of 0.1 m/s, while at the center, it dwindles to a mere 0.002 m/s. This interplay gives rise to a modest mean airflow velocity of 0.02 m/s, with 66.40% of the spatial expanse encountering velocities below this average. Therefore, the temperature difference between the upper and lower parts of the room still existed despite the value being reduced. When placing PCM on the roof, the air is cooled at the wall, then drops down, pools at the bottom, and flows upward; however, the kinetic energy of upward-flowing air diminishes gradually because no additional heating is supplemented. As shown in Fig. 12d, the air at the top cannot flow downward because it is close to the heat source. Hence, it is evident that the airflow velocities within the two streams along the wall can attain levels of 0.05–0.06 m/s. Nevertheless, these velocities decrease to zero at 0.7 m post-convergence. Consequently, the resultant average velocity manifests a mere 0.008 m/s, highlighting that 65.99% of the spatial expanse registers airflow velocities below this computed mean. As a result, the air can only mix and cycle in the lower and middle regions, and the room temperature is divided into two temperature zones along the height direction. At the upper and lower ends of the vertical wall and the end of the roof, the airflow is sufficient; PCM always melts to a greater extent in these areas.
4.3 Melting and Solidification of PCM
The above analysis shows that the location of PCM affects the heat transfer between PCM and surrounding environment, as well as the indoor airflow. A rapid temperature rise or a high room temperature usually occurs when the latent heat release/absorption of PCM has been completed. The melting and solidification of the PCM under different scenarios in a 24-h simulation period are shown in Fig. 13. From Fig. 13, it can be seen that the maximum melting thicknesses are 1.24, 1.20, and 0.97 mm under Case 1, Case 2, and Case 3, respectively; and are 1.41, 1.37, and 1 mm under Case 4, Case 5, and Case 6, respectively. The thicker the PCM, the greater the melting. This is because PCM has a lower thermal conductivity and a higher specific heat capacity in the liquid state than in the solid state. That is, the thermal resistance and the heat capacity both increase with PCM gradually melting, resulting in the melting of the thinner PCM being less than that of the thicker PCM. Besides, different locations lead to the varying airflow near the PCM at different moments; thus, the PCM is completely melted in Case 6 but partly melted in Case 3 during the heat absorption process. Moreover, in the later stage of melting, the temperature difference between room and ambient gradually diminishes with the decrease in ambient temperature, further weakening the airflow in Case 3; therefore, Case 3 is partly melted compared to Case 6.

Figure 13: Variations of liquid fractions of PCM under different cases
As shown in Fig. 14, the thinner PCM always absorbs less heat than the thicker PCM. Based on the calculation, Case 1, Case 2, and Case 3 respectively absorb the heat of 351.94, 343.63, and 287.74 kJ, while that of Case 4, Case 5, and Case 6 are 399.74, 392.91 and 304.61 kJ, respectively, the latter three achieves better performance. However, the heat released by the latter three is smaller than that of the first three. The results show that the heat release of Case 1, Case 2, and Case 3 are 184.98, 184.58, and 193.52 kJ, respectively, while that of Case 4, Case 5, and Case 6 are only 116.68, 120.08, and 135.06 kJ, respectively.

Figure 14: Variations of the heat absorption and release of PCM under different cases
In the heat absorption stage of PCM, Case 4 and Case 5 absorb 13.58% and 14% more heat than Case 1 and Case 2, respectively, while in the latent heat release stage, Case 1 and Case 2 release 53.75% and 58.54% more heat than Case 4 and Case 5, respectively. It is because, during the heat absorbing period, as shown in Fig. 12, the airflow near the PCM in Case 5 is more adequate compared to that in Case 2; however, during the heat release period, the airflow near the PCM in Case 5 is very weak, while that near the PCM in Case 2 is adequate. Therefore, the heat absorption and heat release under different locations are different. Especially during the heat release, using PCM on the roof is far less effective than that on the vertical wall.
As shown in Fig. 15, when the ambient temperature is higher than the phase change temperature, arranging PCM on the roof promotes adequate airflow in the room; accordingly, the heat exchange rate between the PCM and the air is greater than that on the vertical wall. Therefore, the liquid fraction during the melting phase is also always bigger. The arrangement of PCM on the roof achieves a better temperature regulation effect in this case.

Figure 15: Variations of the heat transfer rate of PCM under different cases; (a) heat exchange between PCM and air; (b) heat exchange between PCM and wall
However, when the ambient temperature is lower than the phase change temperature, the solidification rates under the conditions of the top arrangement are always lower than that of the vertical wall. Because the former cannot exchange heat with the air sufficiently. The maximum difference in the heat transfer rate between the two arrangements reaches seven times. In conjunction with Fig. 12, this is because the airflow velocity in the vicinity of the PCM when Case 5 absorbs latent heat is around 0.1 m/s, In contrast, the airflow in its vicinity when releasing latent heat is weak, with the air flow velocity averaging around 0.01 m/s. Combined with the heat exchange rate between the PCM and wall in Fig. 15b, it can be seen that the PCM’s location does not influence the heat exchange between the PCM and the wall because only heat conduction occurs under this condition.
At present, most of the research on the application of PCM in passive buildings only stays in the macroscopic aspect of indoor temperature change, but detailed research on the impact of the application location and thickness of PCM on indoor temperature is still lacking, especially the interaction between PCM and indoor airflow. This interaction not only affects the heat exchange rate between PCM and air, but also affects the uniformity of indoor temperature distribution, and these effects are synthesized in the temperature change. The study of these elements can help to improve the application of PCM. In this paper, a numerical model of a building-integrated PCM for passive temperature regulation is developed. The effects of the location and thickness of PCM on the indoor temperature are revealed and discussed. The indoor airflow and temperature field are employed for analysis. The main conclusions are as follows:
1. Applying PCM can significantly lower the room’s temperature fluctuation and lengthen the time that the room temperature immerses in the comfort zone. Compared to Case 7, the maximum average temperature can be reduced by 4.83°C and the minimum average temperature can be lifted by 2.73°C. Compared to Case 7 which only occupies 26.70% of the whole day, the duration can be increased to 94.10%, 94.10% and 66.67% in Case 1, Case 2 and Case 3, respectively, and 78.13%, 78.13% and 51.04% in Case 4, Case 5 and Case 6, respectively. So, increasing the amount of PCM beyond a certain point does not further extend the comfort duration and has a minimal impact on temperature fluctuations, less than 0.1°C.
2. The optimal placement of PCM depends on the difference between the environmental and phase change temperatures. If the difference is positive, placing PCM on the roof is more effective; conversely, the opposite holds. According to the results over the entire cycle, PCM application on vertical walls yields better performance. This phenomenon arises due to PCM’s varying cooling/heating effects at different temperatures in different positions, leading to varying natural convection intensities. This results in temperature non-uniformity indoors and affects the melting/solidification rates and absolute quantities of PCM.
3. When PCM of different thicknesses is applied in the same location, thicker PCM exhibits a greater absolute melting quantity, attributed to differences in thermal resistance and heat capacity during phase change. The maximum melting thickness is 1.24, 1.20 and 0.97 mm in Case 1, Case 2 and Case 3, respectively, and 1.41, 1.37 and 1 mm in Case 4, Case 5 and Case 6, respectively.
The findings of this study provide data references for the placement and quantity of PCM, especially in scenarios with fixed requirements for indoor temperature comfort periods. In situations without HVAC equipment, environmental temperature relative to the phase change temperature is a key factor influencing PCM placement and can be chosen based on specific requirements. Further research is needed for scenarios involving the combined use of PCM and HVAC systems.
Acknowledgement: The authors would like to acknowledge Heatmate New Energy Technology Co., Ltd. for the invaluable technical support of the work conducted.
Funding Statement: This work was supported by National Innovation Talent Promotion Program (G2022013028L).
Author Contributions: The authors confirm contribution to the paper as follows: study conception and design: Jie Ren, Tao Zhang, Zhengrong Shi; data collection: Jie Ren, Yanming Shen; analysis and interpretation of results: Jie Ren, Tao Zhang; draft manuscript preparation: Jie Ren, Tao Zhang. All authors reviewed the results and approved the final version of the manuscript.
Availability of Data and Materials: The data presented in this study are available on request from the corresponding author.
Conflicts of Interest: The authors declare that they have no conflicts of interest to report regarding the present study.
References
1. Efficiency, C. A. O. B. E. (2022). 2022 China Urban and Rural Construction Sector Carbon Emission Series Research Report (In Chinese). https://www.cabee.org/site/content/24420.html (accessed on 05/04/2023). [Google Scholar]
2. Rathore, P. K. S., Gupta, N. K., Yadav, D., Shukla, S. K., Kaul, S. (2022). Thermal performance of the building envelope integrated with phase change material for thermal energy storage: An updated review. Sustainable Cities and Society, 79, 103690. [Google Scholar]
3. Faraj, K., Khaled, M., Faraj, J., Hachem, F., Castelain, C. (2021). A review on phase change materials for thermal energy storage in buildings: Heating and hybrid applications. Journal of Energy Storage, 33, 101913. [Google Scholar]
4. Yu, S., Fan, Y., Shi, Z., Li, J., Zhao, X. et al. (2023). Hydrogen-based combined heat and power systems: A review of technologies and challenges. International Journal of Hydrogen Energy, 48(89), 34906–34929. https://doi.org/10.1016/j.ijhydene.2023.05.187 [Google Scholar] [CrossRef]
5. Zhou, D., Zhao, C. Y., Tian, Y. (2012). Review on thermal energy storage with phase change materials (PCMs) in building applications. Applied Energy, 92, 593–605. [Google Scholar]
6. Tyagi, V., Kaushik, S., Tyagi, S., Akiyama, T. (2011). Development of phase change materials based microencapsulated technology for buildings: A review. Renewable and Sustainable Energy Reviews, 15(2), 1373–1391. [Google Scholar]
7. Memon, S. A., Cui, H. Z., Zhang, H., Xing, F. (2015). Utilization of macro encapsulated phase change materials for the development of thermal energy storage and structural lightweight aggregate concrete. Applied Energy, 139, 43–55. [Google Scholar]
8. Al-Yasiri, Q., Szabó, M. (2021). Incorporation of phase change materials into building envelope for thermal comfort and energy saving: A comprehensive analysis. Journal of Building Engineering, 36, 102122. [Google Scholar]
9. Soares, N., Costa, J. J., Gaspar, A. R., Santos, P. (2013). Review of passive PCM latent heat thermal energy storage systems towards buildings’ energy efficiency. Energy and Buildings, 59, 82–103. [Google Scholar]
10. Mahdaoui, M., Hamdaoui, S., Msaad, A. A., Kousksou, T., El Rhafiki, T. et al. (2021). Building bricks with phase change material (PCMThermal performances. Construction and Building Materials, 269, 121315. [Google Scholar]
11. Principi, P., Fioretti, R. (2012). Thermal analysis of the application of pcm and low emissivity coating in hollow bricks. Energy and Buildings, 51, 131–142. [Google Scholar]
12. Gao, Y., He, F., Meng, X., Wang, Z., Zhang, M. et al. (2020). Thermal behavior analysis of hollow bricks filled with phase-change material (PCM). Journal of Building Engineering, 31, 101447. [Google Scholar]
13. Maleki, B., Khadang, A., Maddah, H., Alizadeh, M., Kazemian, A. et al. (2020). Development and thermal performance of nanoencapsulated PCM/plaster wallboard for thermal energy storage in buildings. Journal of Building Engineering, 32, 101727. [Google Scholar]
14. Kusama, Y., Ishidoya, Y. (2017). Thermal effects of a novel phase change material (PCM) plaster under different insulation and heating scenarios. Energy and Buildings, 141, 226–237. [Google Scholar]
15. Guardia, C., Barluenga, G., Palomar, I., Diarce, G. (2019). Thermal enhanced cement-lime mortars with phase change materials (PCMlightweight aggregate and cellulose fibers. Construction and Building Materials, 221, 586–594. [Google Scholar]
16. Navarro, L., De Gracia, A., Colclough, S., Browne, M., McCormack, S. J. et al. (2016). Thermal energy storage in building integrated thermal systems: A review. Part 1. Active storage systems. Renewable Energy, 88, 526–547. [Google Scholar]
17. Bland, A., Khzouz, M., Statheros, T., Gkanas, E. I. (2017). PCMs for residential building applications: A short review focused on disadvantages and proposals for future development. Buildings, 7(3), 78. [Google Scholar]
18. Rathore, P. K. S., Shukla, S. K., Gupta, N. K. (2020). Potential of microencapsulated PCM for energy savings in buildings: A critical review. Sustainable Cities and Society, 53, 101884. [Google Scholar]
19. Rathore, P. K. S., Shukla, S. K. (2019). Potential of macroencapsulated PCM for thermal energy storage in buildings: A comprehensive review. Construction and Building Materials, 225, 723–744. [Google Scholar]
20. Meng, E., Yu, H., Zhan, G., He, Y. (2013). Experimental and numerical study of the thermal performance of a new type of phase change material room. Energy Conversion and Management, 74, 386–394. [Google Scholar]
21. Rathore, P. K. S., Shukla, S. K. (2020). An experimental evaluation of thermal behavior of the building envelope using macroencapsulated PCM for energy savings. Renewable Energy, 149, 1300–1313. [Google Scholar]
22. Song, M., Niu, F., Mao, N., Hu, Y., Deng, S. (2018). Review on building energy performance improvement using phase change materials. Energy and Buildings, 158, 776–793. [Google Scholar]
23. Saafi, K., Daouas, N. (2019). Energy and cost efficiency of phase change materials integrated in building envelopes under Tunisia Mediterranean climate. Energy, 187, 115987. [Google Scholar]
24. Lei, J., Yang, J., Yang, E. H. (2016). Energy performance of building envelopes integrated with phase change materials for cooling load reduction in tropical Singapore. Applied Energy, 162, 207–217. [Google Scholar]
25. Zwanzig, S. D., Lian, Y., Brehob, E. G. (2013). Numerical simulation of phase change material composite wallboard in a multi-layered building envelope. Energy Conversion and Management, 69, 27–40. [Google Scholar]
26. Yu, J., Yang, Q., Ye, H., Huang, J., Liu, Y. et al. (2019). The optimum phase transition temperature for building roof with outer layer PCM in different climate regions of China. Energy Procedia, 158, 3045–3051. [Google Scholar]
27. Vukadinović, A., Radosavljević, J., Đorđević, A. (2020). Energy performance impact of using phase-change materials in thermal storage walls of detached residential buildings with a sunspace. Solar Energy, 206, 228–244. [Google Scholar]
28. Abd El-Raheim, D., Mohamed, A., Fatouh, M., Abou-Ziyan, H. (2022). Comfort and economic aspects of phase change materials integrated with heavy-structure buildings in hot climates. Applied Thermal Engineering, 213, 118785. [Google Scholar]
29. Sajjadian, S. M., Lewis, J., Sharples, S. (2015). The potential of phase change materials to reduce domestic cooling energy loads for current and future UK climates. Energy and Buildings, 93, 83–89. [Google Scholar]
30. Tabares-Velasco, P. C., Christensen, C., Bianchi, M. (2012). Verification and validation of EnergyPlus phase change material model for opaque wall assemblies. Building and Environment, 54, 186–196. [Google Scholar]
31. Kumar, S., Arun Prakash, S., Pandiyarajan, V., Geetha, N., Antony Aroul Raj, V. et al. (2020). Effect of phase change material integration in clay hollow brick composite in building envelope for thermal management of energy efficient buildings. Journal of Building Physics, 43(4), 351–364. [Google Scholar]
32. Auzeby, M., Wei, S., Underwood, C., Tindall, J., Chen, C. et al. (2016). Effectiveness of using phase change materials on reducing summer overheating issues in UK residential buildings with identification of influential factors. Energies, 9(8), 605. [Google Scholar]
33. Wang, R., Xiao, Y., Lei, J. (2020). A solid-solid phase change material based on dynamic ion cross-linking with reprocessability at room temperature. Chemical Engineering Journal, 390, 124586. [Google Scholar]
34. Jeon, J., Park, J. H., Wi, S., Yang, S., Ok, Y. S. et al. (2019). Latent heat storage biocomposites of phase change material-biochar as feasible eco-friendly building materials. Environmental Research, 172, 637–648. [Google Scholar] [PubMed]
35. Cai, R., Sun, Z., Yu, H., Meng, E., Wang, J. et al. (2021). Review on optimization of phase change parameters in phase change material building envelopes. Journal of Building Engineering, 35, 101979. [Google Scholar]
36. Pargana, N., Pinheiro, M. D., Silvestre, J. D., de Brito, J. (2014). Comparative environmental life cycle assessment of thermal insulation materials of buildings. Energy and Buildings, 82, 466–481. [Google Scholar]
37. Liu, Y., Wang, M., Cui, H., Yang, L., Liu, J. (2020). Micro-/macro-level optimization of phase change material panel in building envelope. Energy, 195, 116932. [Google Scholar]
38. Fioretti, R., Principi, P., Copertaro, B. (2016). A refrigerated container envelope with a PCM (phase change material) layer: Experimental and theoretical investigation in a representative town in Central Italy. Energy Conversion and Management, 122, 131–141. [Google Scholar]
39. Zhu, N., Li, S., Hu, P., Lei, F., Deng, R. (2019). Numerical investigations on performance of phase change material Trombe wall in building. Energy, 187, 116057. [Google Scholar]
40. Jamil, H., Alam, M., Sanjayan, J., Wilson, J. (2016). Investigation of PCM as retrofitting option to enhance occupant thermal comfort in a modern residential building. Energy and Buildings, 133, 217–229. [Google Scholar]
Cite This Article
 Copyright © 2024 The Author(s). Published by Tech Science Press.
This work is licensed under a Creative Commons Attribution 4.0 International License , which permits unrestricted use, distribution, and reproduction in any medium, provided the original work is properly cited.
 Downloads
 Citation Tools