
 Submit a Paper
 Propose a Special lssue
 Open Access
ARTICLE

Study on Image Recognition Algorithm for Residual Snow and Ice on Photovoltaic Modules
1 College of Electronics and Information, Xi’an Polytechnic University, Xi’an, 710048, China
2 Xi’an Key Laboratory of Interconnected Sensing and Intelligent Diagnosis for Electrical Equipment, Xi’an, 710048, China
* Corresponding Author: Xinbo Huang. Email:
(This article belongs to the Special Issue: Fault Diagnosis and State Evaluation of New Power Grid)
Energy Engineering 2024, 121(4), 895-911. https://doi.org/10.32604/ee.2023.041002
Received 07 April 2023; Accepted 17 July 2023; Issue published 26 March 2024
 View Full Text
 Download PDF
Abstract
The accumulation of snow and ice on PV modules can have a detrimental impact on power generation, leading to reduced efficiency for prolonged periods. Thus, it becomes imperative to develop an intelligent system capable of accurately assessing the extent of snow and ice coverage on PV modules. To address this issue, the article proposes an innovative ice and snow recognition algorithm that effectively segments the ice and snow areas within the collected images. Furthermore, the algorithm incorporates an analysis of the morphological characteristics of ice and snow coverage on PV modules, allowing for the establishment of a residual ice and snow recognition process. This process utilizes both the external ellipse method and the pixel statistical method to refine the identification process. The effectiveness of the proposed algorithm is validated through extensive testing with isolated and continuous snow area pictures. The results demonstrate the algorithm’s accuracy and reliability in identifying and quantifying residual snow and ice on PV modules. In conclusion, this research presents a valuable method for accurately detecting and quantifying snow and ice coverage on PV modules. This breakthrough is of utmost significance for PV power plants, as it enables predictions of power generation efficiency and facilitates efficient PV maintenance during the challenging winter conditions characterized by snow and ice. By proactively managing snow and ice coverage, PV power plants can optimize energy production and minimize downtime, ensuring a sustainable and reliable renewable energy supply.Keywords
Nomenclature
| PV | Photovoltaic |
| UAV | Unmanned aerial vehicle |
| OTSU | Maximum between-class variance |
| The number of pixels of snow area | |
| The total pixel number of PV module | |
| The proportion obtained by the algorithm segmentation | |
| The proportion of icing area obtained by manual measurement | |
| The absolute error | |
| The relative accuracy |
Solar energy is increasingly gaining attention as an important source of clean energy worldwide, with a sharp increase in its application [1]. By the first half of 2022, China alone had installed a solar power capacity of 30.84 GW, and the total installed capacity had reached 336 GW [2]. PV power generation has become one of the major forms of electricity in China. However, due to their location in harsh natural environments such as wilderness and mountainous areas, PV modules are vulnerable to disasters such as rainstorms, lightning, floods, snow and ice, and earthquakes [3]. Among these meteorological and geological disasters, snow and ice significantly reduce the power generation efficiency of PV modules, shorten their service life, and even cause them to collapse, making it one of the main factors that affects the normal operation of PV power plants in winter [4,5]. Reports from the United States, Canada, Norway, Germany, Turkey, and China all confirm that snow and ice have resulted in a significant decrease in the power generation efficiency of PV panels, and in some cases, the collapse of PV panels [6,7]. Relevant data indicate that the maximum monthly power generation loss caused by snow and ice problems can exceed 80%, with an annual power generation loss of up to 30% [8].
In Fig. 1, different forms of icing, such as snow, glaze ice, hard rime, soft rime, and other forms, can accumulate on PV modules under specific meteorological conditions. As a special pollutant, icing hinders sunlight from reaching the PV module’s surface and significantly reduces its power generation efficiency [9].
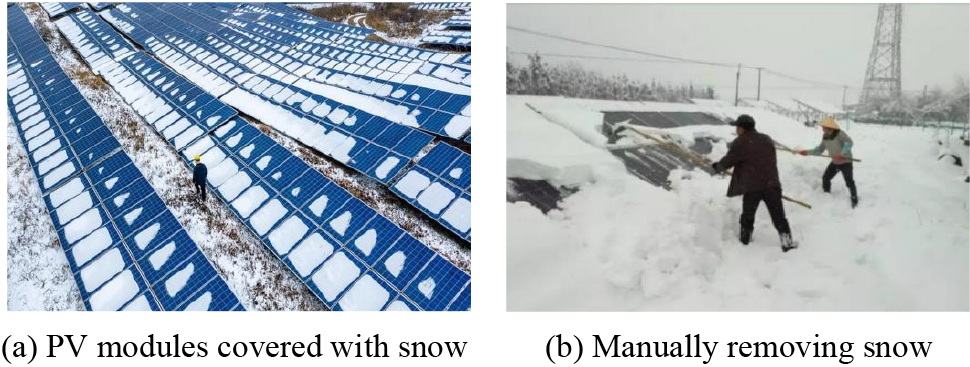
Figure 1: Residual snow and ice on PV power stations
Therefore, researchers from around the world have conducted extensive research on the detection of ice and snow accumulation on PV modules. Al-Dulaimi et al. [10] proposed the use of five deep learning models, namely Visual Geometry Group-16 (VGG-16), VGG-19, Residual Neural Network-18 (RESNET-18), RESNET-50, and RESNET-101, for classification and detection performance analysis of snow-covered solar panel images. Garcia et al. [11] utilized an intelligent sensor network and developed a Predictive Fault Diagnosis (PFD) application for solar power system management and supervision. Li et al. [12] designed a new system called “solardiagnostics”, which mainly employs the K-Means algorithm and convolutional neural networks to identify and characterize damages on the contours of rooftop PV installations. In the field of PV snow monitoring, various methods have been proposed for detecting snow accumulation using specialized or external sensors such as weight sensors, network cameras, and satellite data [13–15]. Additionally, environmental temperature [16] and module temperature [17] have been suggested as measurable parameters to identify snow-related losses in PV monitoring and fault diagnosis. Moreover, machine learning and deep learning techniques have been applied to distinguish between damage to PV arrays and other factors causing solar degradation (such as shading, dust, and snow). However, these approaches have limitations, including long detection times and high rates of misclassification errors, which have not been extensively addressed in the literature.
In addition, there have been notable advancements in the field of snow removal in PV systems. Abou Yassine et al. [18] identified four snow removal processes for PV modules: melting, rapid sliding, prolonged melting, and shedding after melting. Increasing liquid water content (LWC) reduces friction at the snow layer’s bottom, enabling easier sliding off the PV module surface. Zheng et al. [19] developed a domino-style snow removal system utilizing PV self-heating (PVSH). The system harnesses the energy generated by uncovered PV modules to remove snow from PV systems in a sequential, string-by-string manner. Currently, manual removal and natural melting are the most common methods used to deal with snow and ice on PV modules in power stations [8,20,21], as depicted in Fig. 1. However, these methods are time-consuming, labor-intensive, and costly due to the large scale and remote location of PV power stations. Furthermore, the uncertainty in the melting process makes it challenging to predict power generation accurately [22,23].
The mentioned topics on PV inspection have provided new insights for this study. The purpose of this paper is to present a snow and ice detection method for PV modules using image processing algorithms. To the best of our knowledge, similar work has not been extensively documented before. It can overcome the drawback of long detection times and is applicable for the identification and quantitative analysis of residual ice and snow on PV modules. Therefore, it is necessary to monitor the snow and ice on PV power stations in remote areas through intelligent sensing and UAVs to enable remote sensing of snow and ice on PV modules. This paper proposes a non-destructive inspection system based on image processing to achieve online inspection of PV module ice cover and accurate judgment. The system uses photos of snow and ice on PV modules to calculate the amount of residual snow and ice on modules during the ice melting process through image processing. Compared to expensive and delicate hardware inspection equipment, the non-destructive inspection system can be continuously optimized and updated to achieve intelligent inspection of PV modules and provide a reference basis for power production forecasting of PV power plants in winter.
The main structure of this article is as follows: firstly, an ice and snow recognition algorithm is proposed to effectively segment the ice and snow areas in the collected images. Based on this, two methods for determining the remaining ice and snow volume are proposed: the external ellipse method and the pixel statistical method. Then, the accuracy of the algorithm is evaluated by covering the ice and snow images with local and continuous photovoltaic modules. Finally, the importance of research in the field of ice and snow detection technology is summarized, and the limitations of this method are discussed.
2 The Recognition Algorithm for Snow and Ice on PV Modules
The parameters, colors, smoothness, and contrast of PV modules undergo significant changes before and after the accumulation of ice and snow, making their morphological features distinct. Therefore, image recognition technology can effectively detect residual ice and snow on PV modules. In this study, we employed various methods of image acquisition, including the use of drones and surveillance cameras, to obtain images of PV modules. These methods provided us with diverse and comprehensive image data for our proposed algorithm to assess the extent of snow and ice coverage.
The algorithm takes the captured PV module image as input and outputs the residual snow area. Its core steps include image preprocessing, PV module recognition, snow area segmentation, and snow area calculation.
In the first step, the saliency detection method [24] is used for image preprocessing to eliminate the influence of background, illumination, and texture and to obtain clear ice and snow parts and PV module parts. Then, the corner recognition method [24] is used to locate the region of the PV module by using the two upper corners of a single module as reference points. Through this method and the proper segmentation algorithm, the number of pixels within the range of a single PV module can also be obtained. Finally, the residual area of PV modules is recognized using methods such as the external ellipse method and pixel statistical method [25]. By calculating the area of residual snow and ice, the severity of snow and ice-covered PV modules can be determined. The specific algorithm flow is illustrated in Fig. 2.
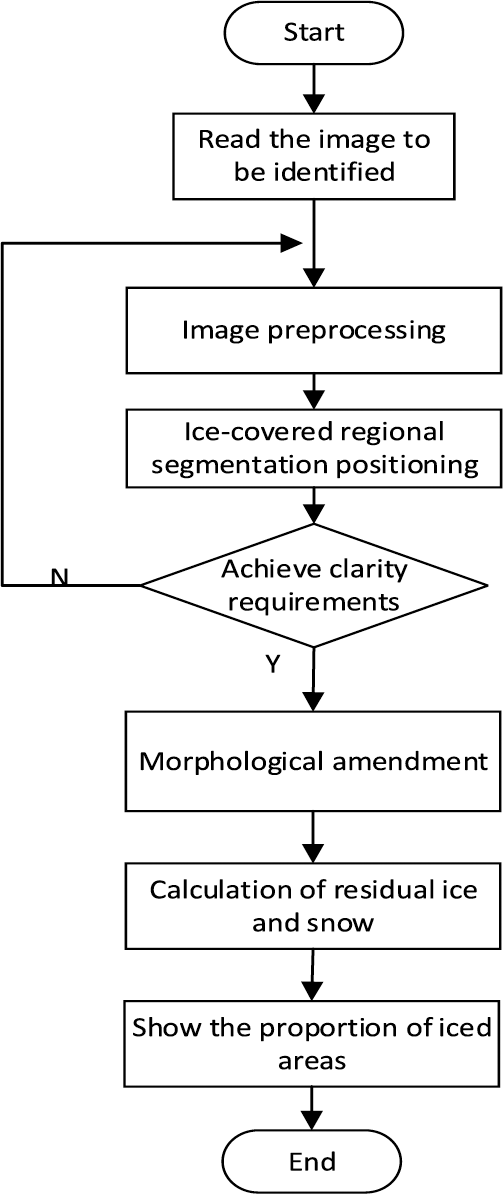
Figure 2: Algorithm flow chart
In order to reduce the data amount and improve processing speed, the visible light image of a PV module, which is a true color RGB image, is typically converted to a grayscale image. Various methods are available for this conversion, including the component method, maximum method, average method, weighted average method, and more [24]. Among these methods, the weighted average method is preferred for its excellent processing effectiveness. This method involves multiplying the three monochromatic values by different weights, based on the importance of the gray value, as shown in formula (1) and in Fig. 3.
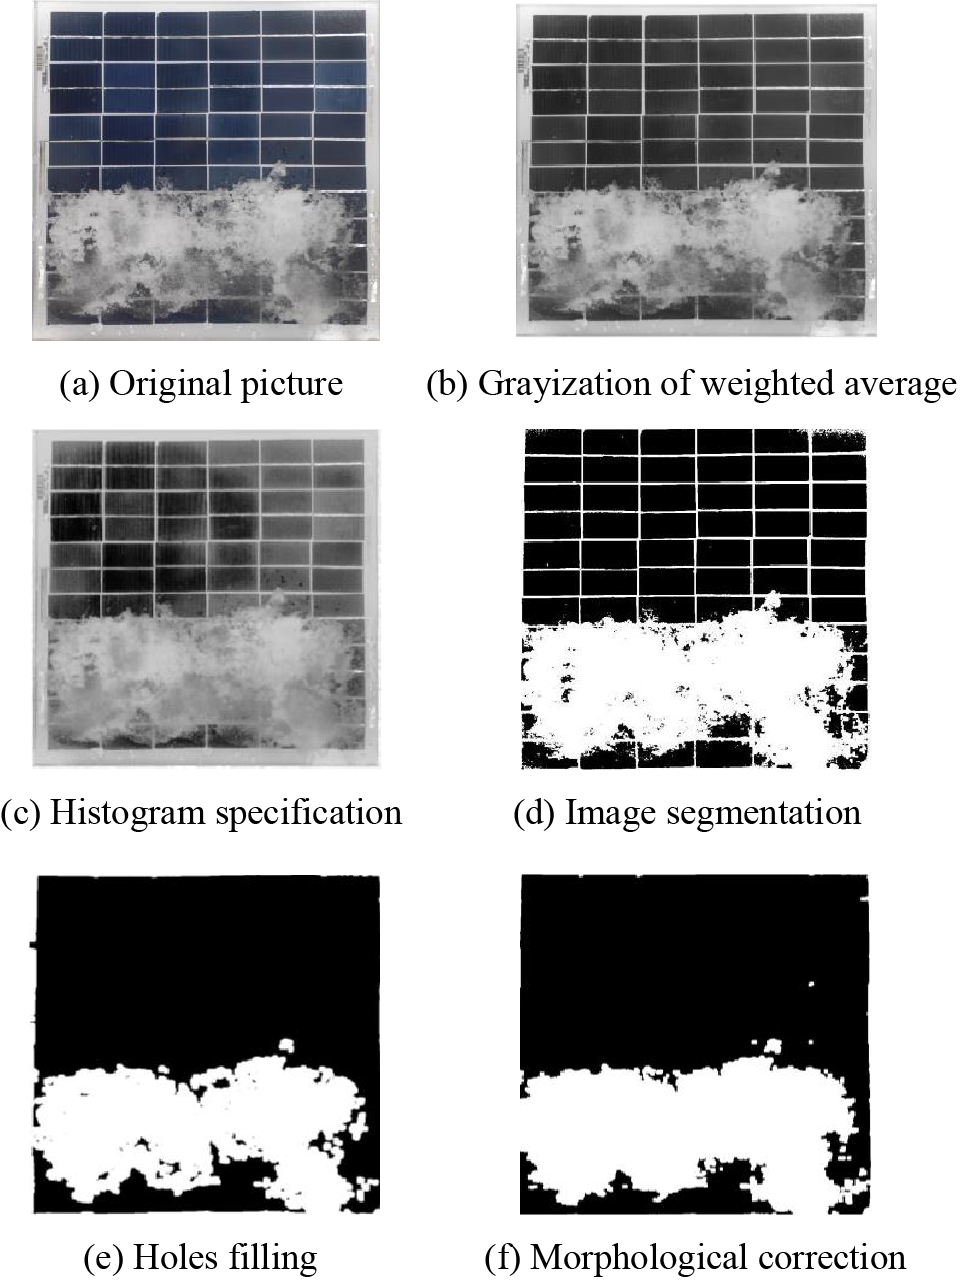
Figure 3: Image processing process diagram
where
The images captured in a PV power station in real-time are inevitably influenced by various natural conditions, such as rain, fog, snow, and reflective light. Therefore, it is essential to enhance contrast, highlight edge details, and increase image definition using methods like image histogram specification enhancement [24]. The processed images’ results are displayed in Fig. 3c.
Considering continuous grayscale values, the variable r is used to represent the grayscale of the image being processed. Typically, we assume that the range of values for r is [0, L − 1], where
The grayscale of each point in the original image, represented by
Then, the target image is also gray equalized:
In the target image, the grayscale of each point, represented by
Therefore, after performing the equalization, both
2.3 Segmentation and Correction the Residual Area of Snow and Ice
To achieve a relatively complete segmentation of snow and ice areas, this paper compared four different algorithms for their segmentation effects. Table 1 presents a comparison of the segmentation results of PV module snow areas using different algorithms, including Niblack, Bradley and Roth, Sauvola and Pietikainen, and Otsu methods [25]. Niblack introduces more noise, Bradley segmentation of snow is incomplete, Sauvola segmentation is slightly better than Bradley segmentation, but still contains many holes in the snow area. Through the comparison of various segmentation methods, it is evident that the Otsu method can effectively segment the ice and PV module areas, meeting the image processing requirements of this paper.
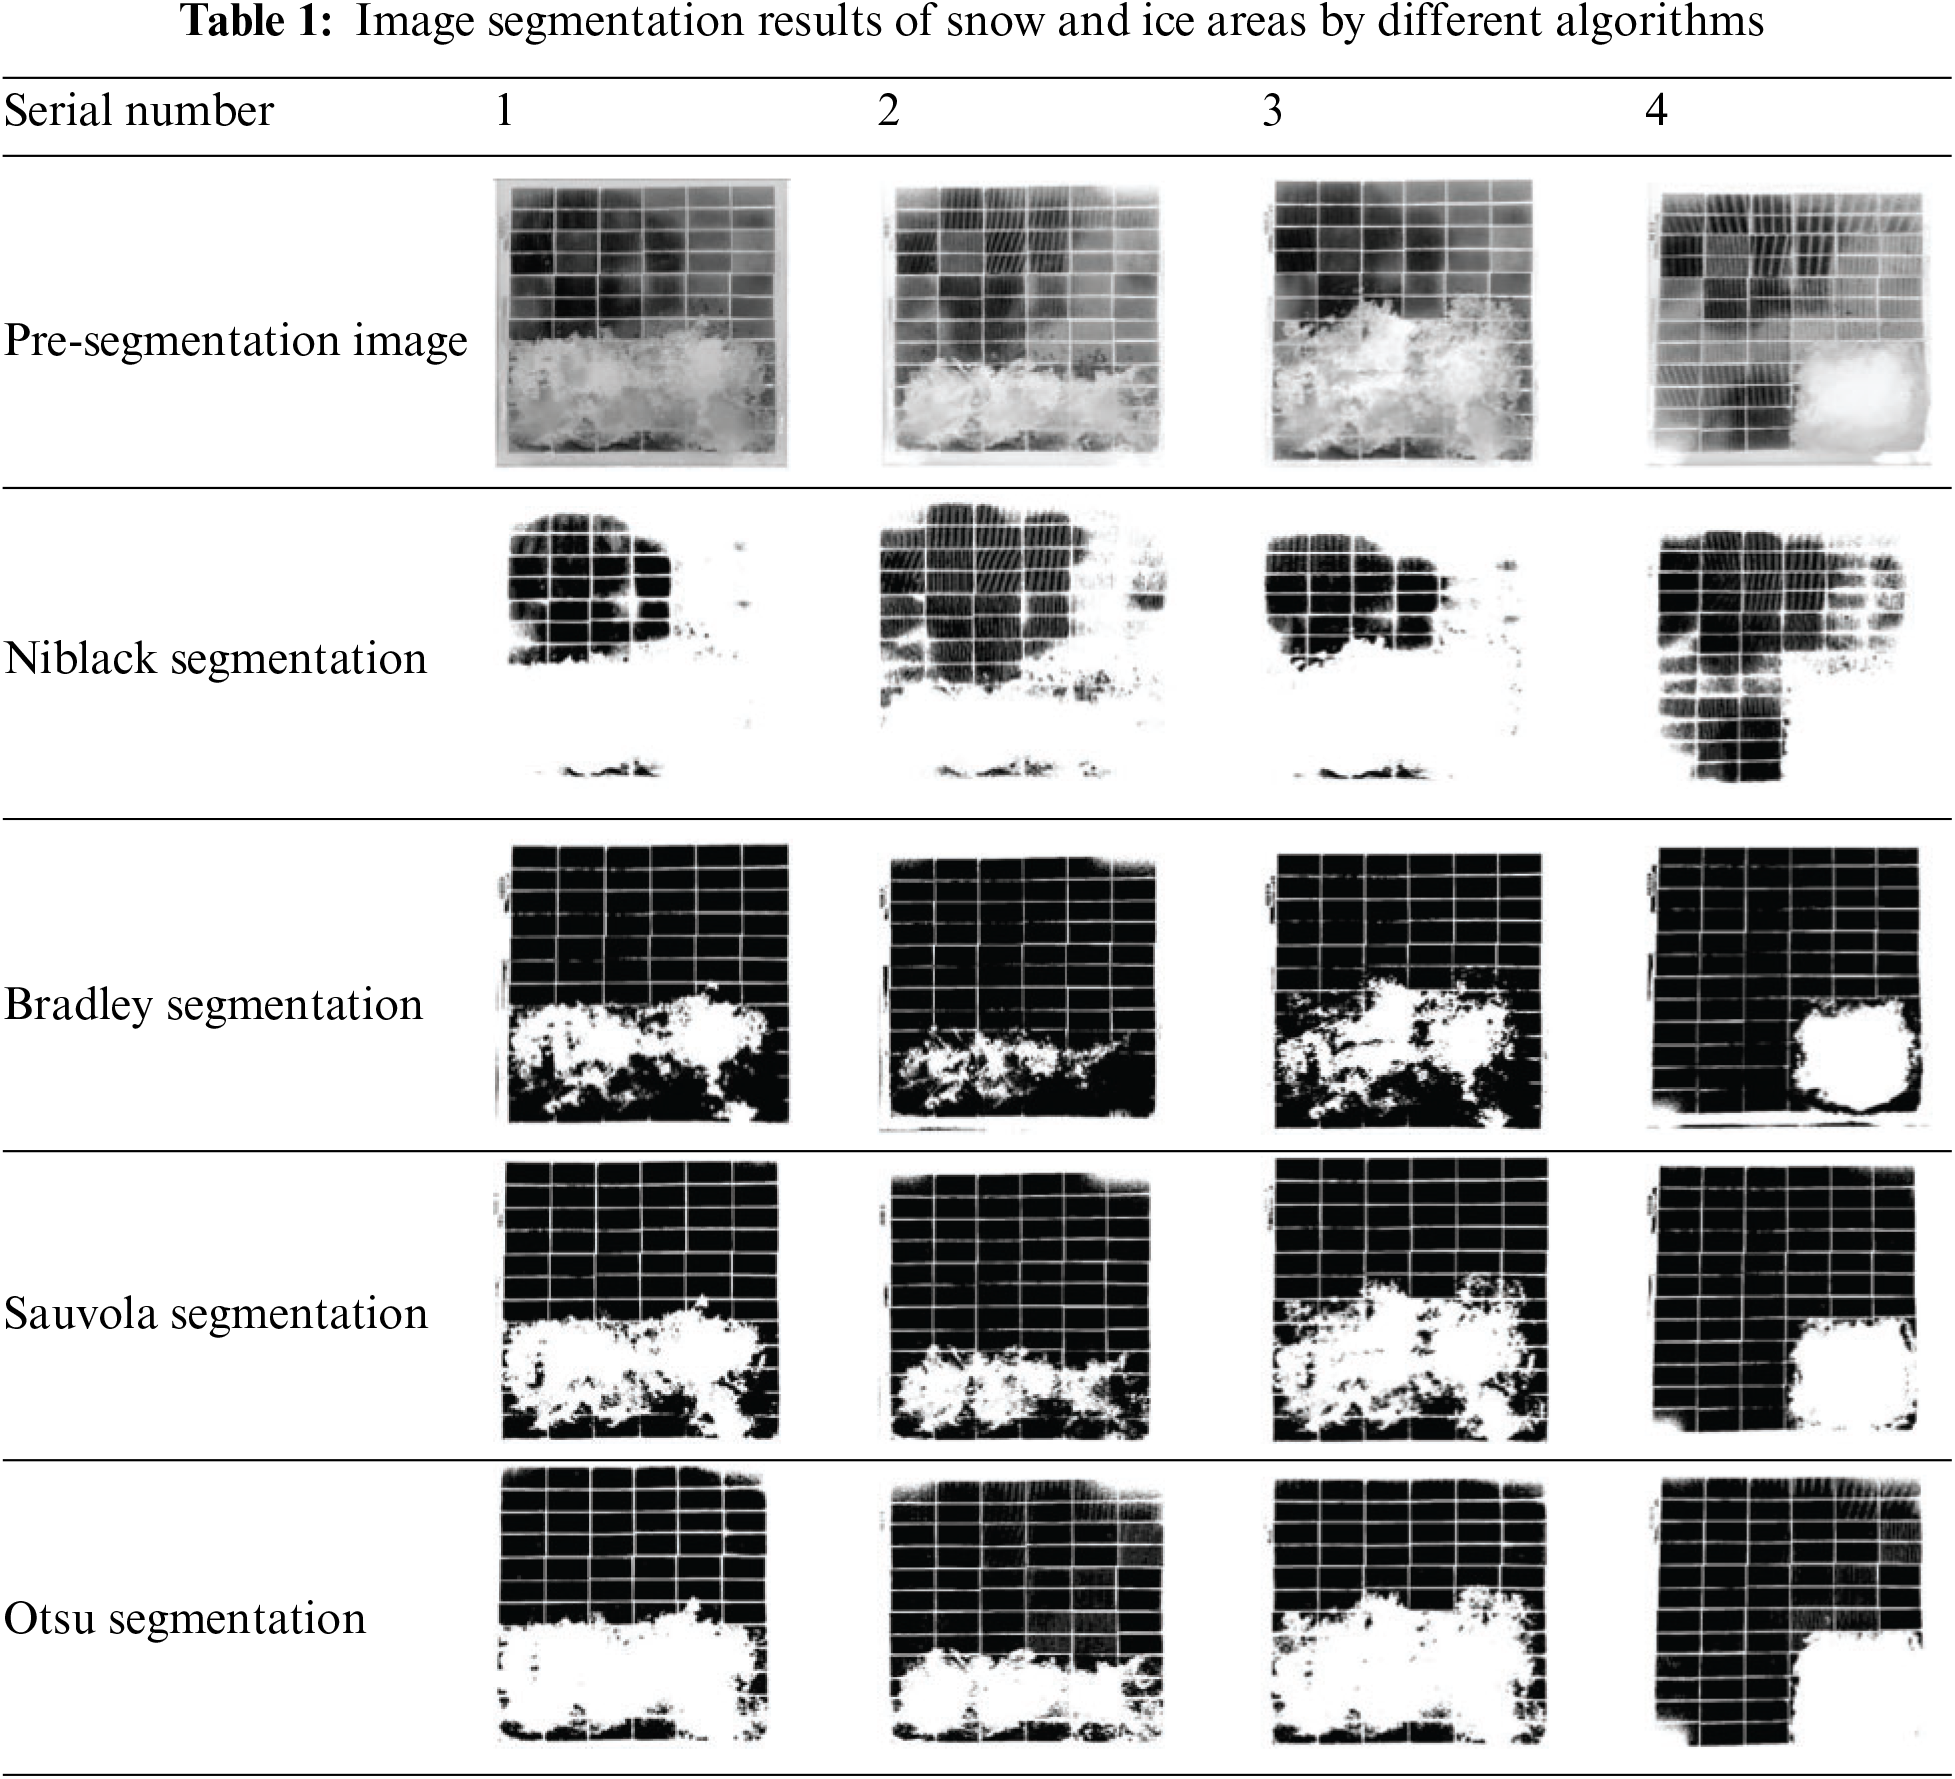
The main segmentation method utilized in this study is the Otsu method, also known as the maximum inter-class variance method. This algorithm is based on the principle of the least square method and performs a global search threshold in the grayscale image, which enables the target to obtain the maximum between-class variance between the average grayscale values of the background area [23]. The processing results are presented in Fig. 3d.
The algorithm is implemented as follows: the image size is set to
The sum of the probabilities for each gray value is:
The pixels in the image are classified into two categories, D1 and D2, based on a threshold T. Region D1 includes pixels with gray values ranging from [0, T], while region D2 includes pixels with gray values ranging from [T + 1, L − 1]. Based on this principle, the probability of pixel occurrence in the two regions is expressed as follows:
The average gray levels of the regions D1 and D2 are calculated as follows:
The variable u represents the average gray level of the entire image.
A precise criterion for selecting the optimal threshold to separate two regions is the total variance between these regions:
In addition, due to
The threshold T is iteratively selected in the gray range [0, L − 1]. The threshold that maximizes
The PV module image segmented for the ice and snow areas may contain holes in the icing area and have an uneven edge curve. To address this, this paper utilizes the morphological correction method [24] to process the segmented image. In order to preserve the details of the icing area and maintain the original state, the main steps of the morphological correction were determined through continuous experimentation.
Firstly, a disc structure of an initial radius of 7 pixels is created, and the filtering effect is influenced by the structure’s different sizes. The segmented image is subjected to an open operation to eliminate isolated dots, burrs, and bridges with the above feature size, while maintaining the shape of the residual snow and ice by removing the white fence in the background.
Secondly, all connected domains that are smaller than a certain number of pixels are removed from the image obtained in the previous step, and the internal small holes are filled. This process results in another binary image.
Lastly, the frame of the PV panel is cropped from the image obtained in the previous step in preparation for the next computational step of residual snow and ice.
3 Calculation of Residual Area of Snow and Ice on PV Modules
3.1 Calculation of Residual Area of Snow and Ice Based on the Pixel Statistical Method
This paper presents two methods to calculate the residual area of snow and ice on PV modules: the pixel statistics method and the external ellipse method [25]. The pixel statistical method involves calculating the percentage of foreground image pixels in the preprocessed PV module images with residual snow and ice relative to the total image pixels. The percentage is then multiplied by the actual area of the PV module to obtain the actual area of the product that is covered by residual snow and ice. The calculation formula is as follows:
where
The proposed method consists of two main components. Firstly, it involves calculating the area of the entire image by utilizing the corrected image. A pixel-based approach is employed to traverse the entire image, counting the number of pixels within each region and recording the total number of pixels. Secondly, it entails the computation of the ice and snow area. By traversing the target regions that exist as connected domains after segmentation, the pixel count within these regions is tallied. Finally, the area and proportion of the ice and snow-covered regions are obtained through calculation. The pixel statistical method has high requirements for image segmentation, and low error can be guaranteed only when the image segmentation of residual snow and ice area is accurate. However, because of the uncertain type of snow and ice cover, such as the late stage of snow melting, the small color difference between the background and the target may be ignored, and this part will be missed when counting the number of pixels.
3.2 Calculation of Residual Area of Snow and Ice by External Ellipse Method
During the process of snow and ice melting, their shapes undergo significant changes, making it challenging to accurately segment them. Given that the dimensions (major axis, minor axis, and angle) of an ellipse can be adjusted, this study proposes the external ellipse method to estimate the inaccurately segmented remaining snow and ice area during the later stages of melting.
The main steps of the external ellipse method are as follows: (1) Roughly determine the snow and ice area based on the image preprocessing results. (2) Take the frame direction of the PV module as the X-axis of the ellipse and the vertical direction as the Y-axis. Determine the center of the ellipse as the midpoint of the maximum pixel projection of the residual snow and ice along the X and Y-axis, and the two characteristic lengths of the ellipse as the projection length of the maximum pixel in the images. (3) Draw the ellipse with the parameters obtained in step 2. (4) If the area of the residual snow and ice outside the ellipse is 10%–20% of the ellipse area, consider it to meet the requirements. Otherwise, move to step 5. (5) Adjust the major axis, minor axis, and angle in 2% step length, and return to step 3.
The calculation formula is as follows:
where
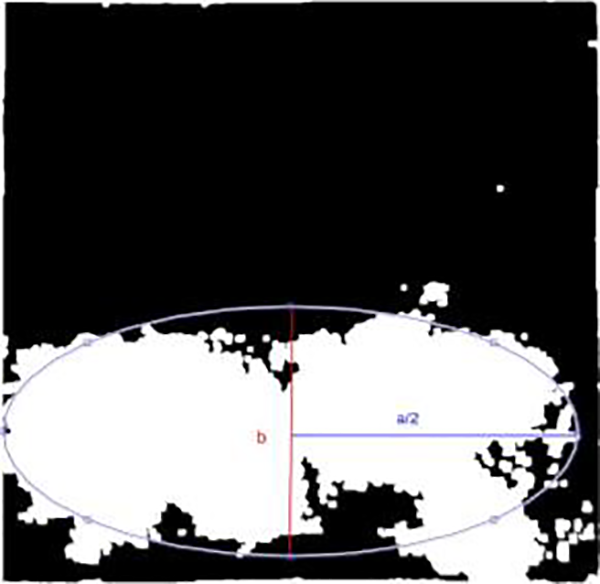
Figure 4: The ellipse outside the ice area
In this paper, the accuracy of the algorithm is evaluated using both relative accuracy and absolute error.
The manually measured snow area is represented by
The methods to obtain an
4 Analysis of Identification Results of Residual Area of Snow and Ice
4.1 Identification and Calculation for Continuous Snow Area
To assess the universality of the algorithm, images of the residual snow and ice areas of continuous PV modules captured by UAV were processed, and the processed images are presented in Fig. 5.
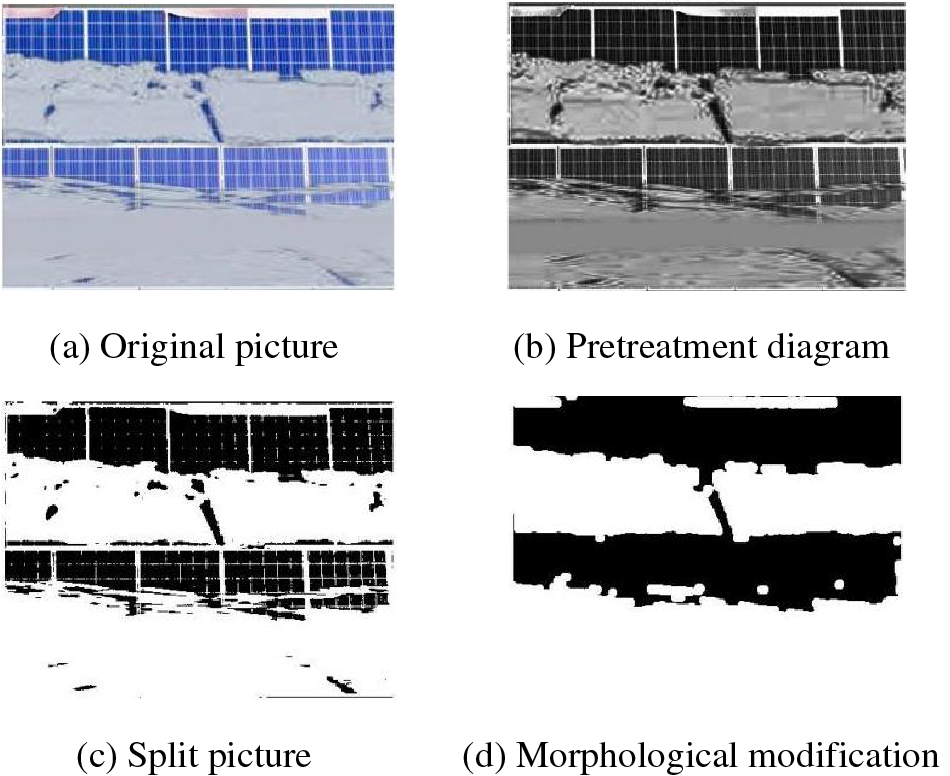
Figure 5: Image processing of the continuous snow on PV modules
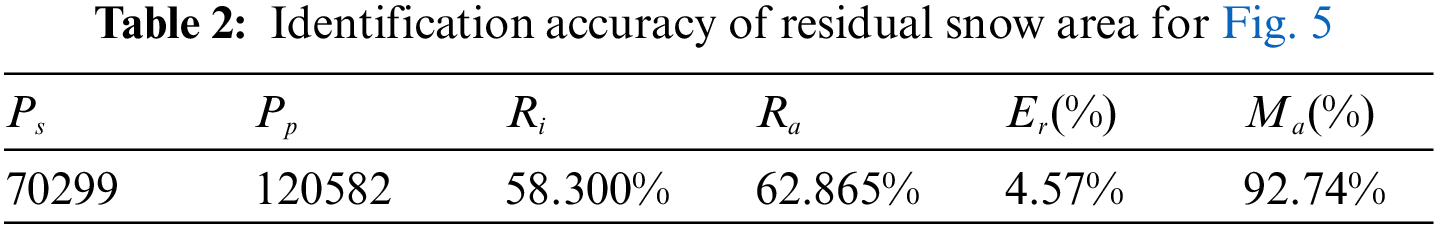
After preprocessing, image segmentation, and morphological filling, effective processing results were obtained, as shown in Figs. 5b–5d. The residual snow area was then calculated using the aforementioned method. However, since the image consists of upper and lower rows of PV modules, and the snow area is connected in a long strip shape, the external ellipse method cannot be applied to calculate the residual snow area, which would result in a significant error. Therefore, only the pixel count method was used to calculate the area of residual snow by counting the number of pixels in the target area of the image.
Table 2 presents a comparison of the algorithm’s calculation results and manual segmentation. The proportion of residual snow area in the upper row of PV modules is 58.3%, and the algorithm’s relative accuracy is 92.7%. The algorithm demonstrates high accuracy in handling the residual snow and ice areas of continuous PV modules.
4.2 Identification and Calculation for Isolated Snow Areas
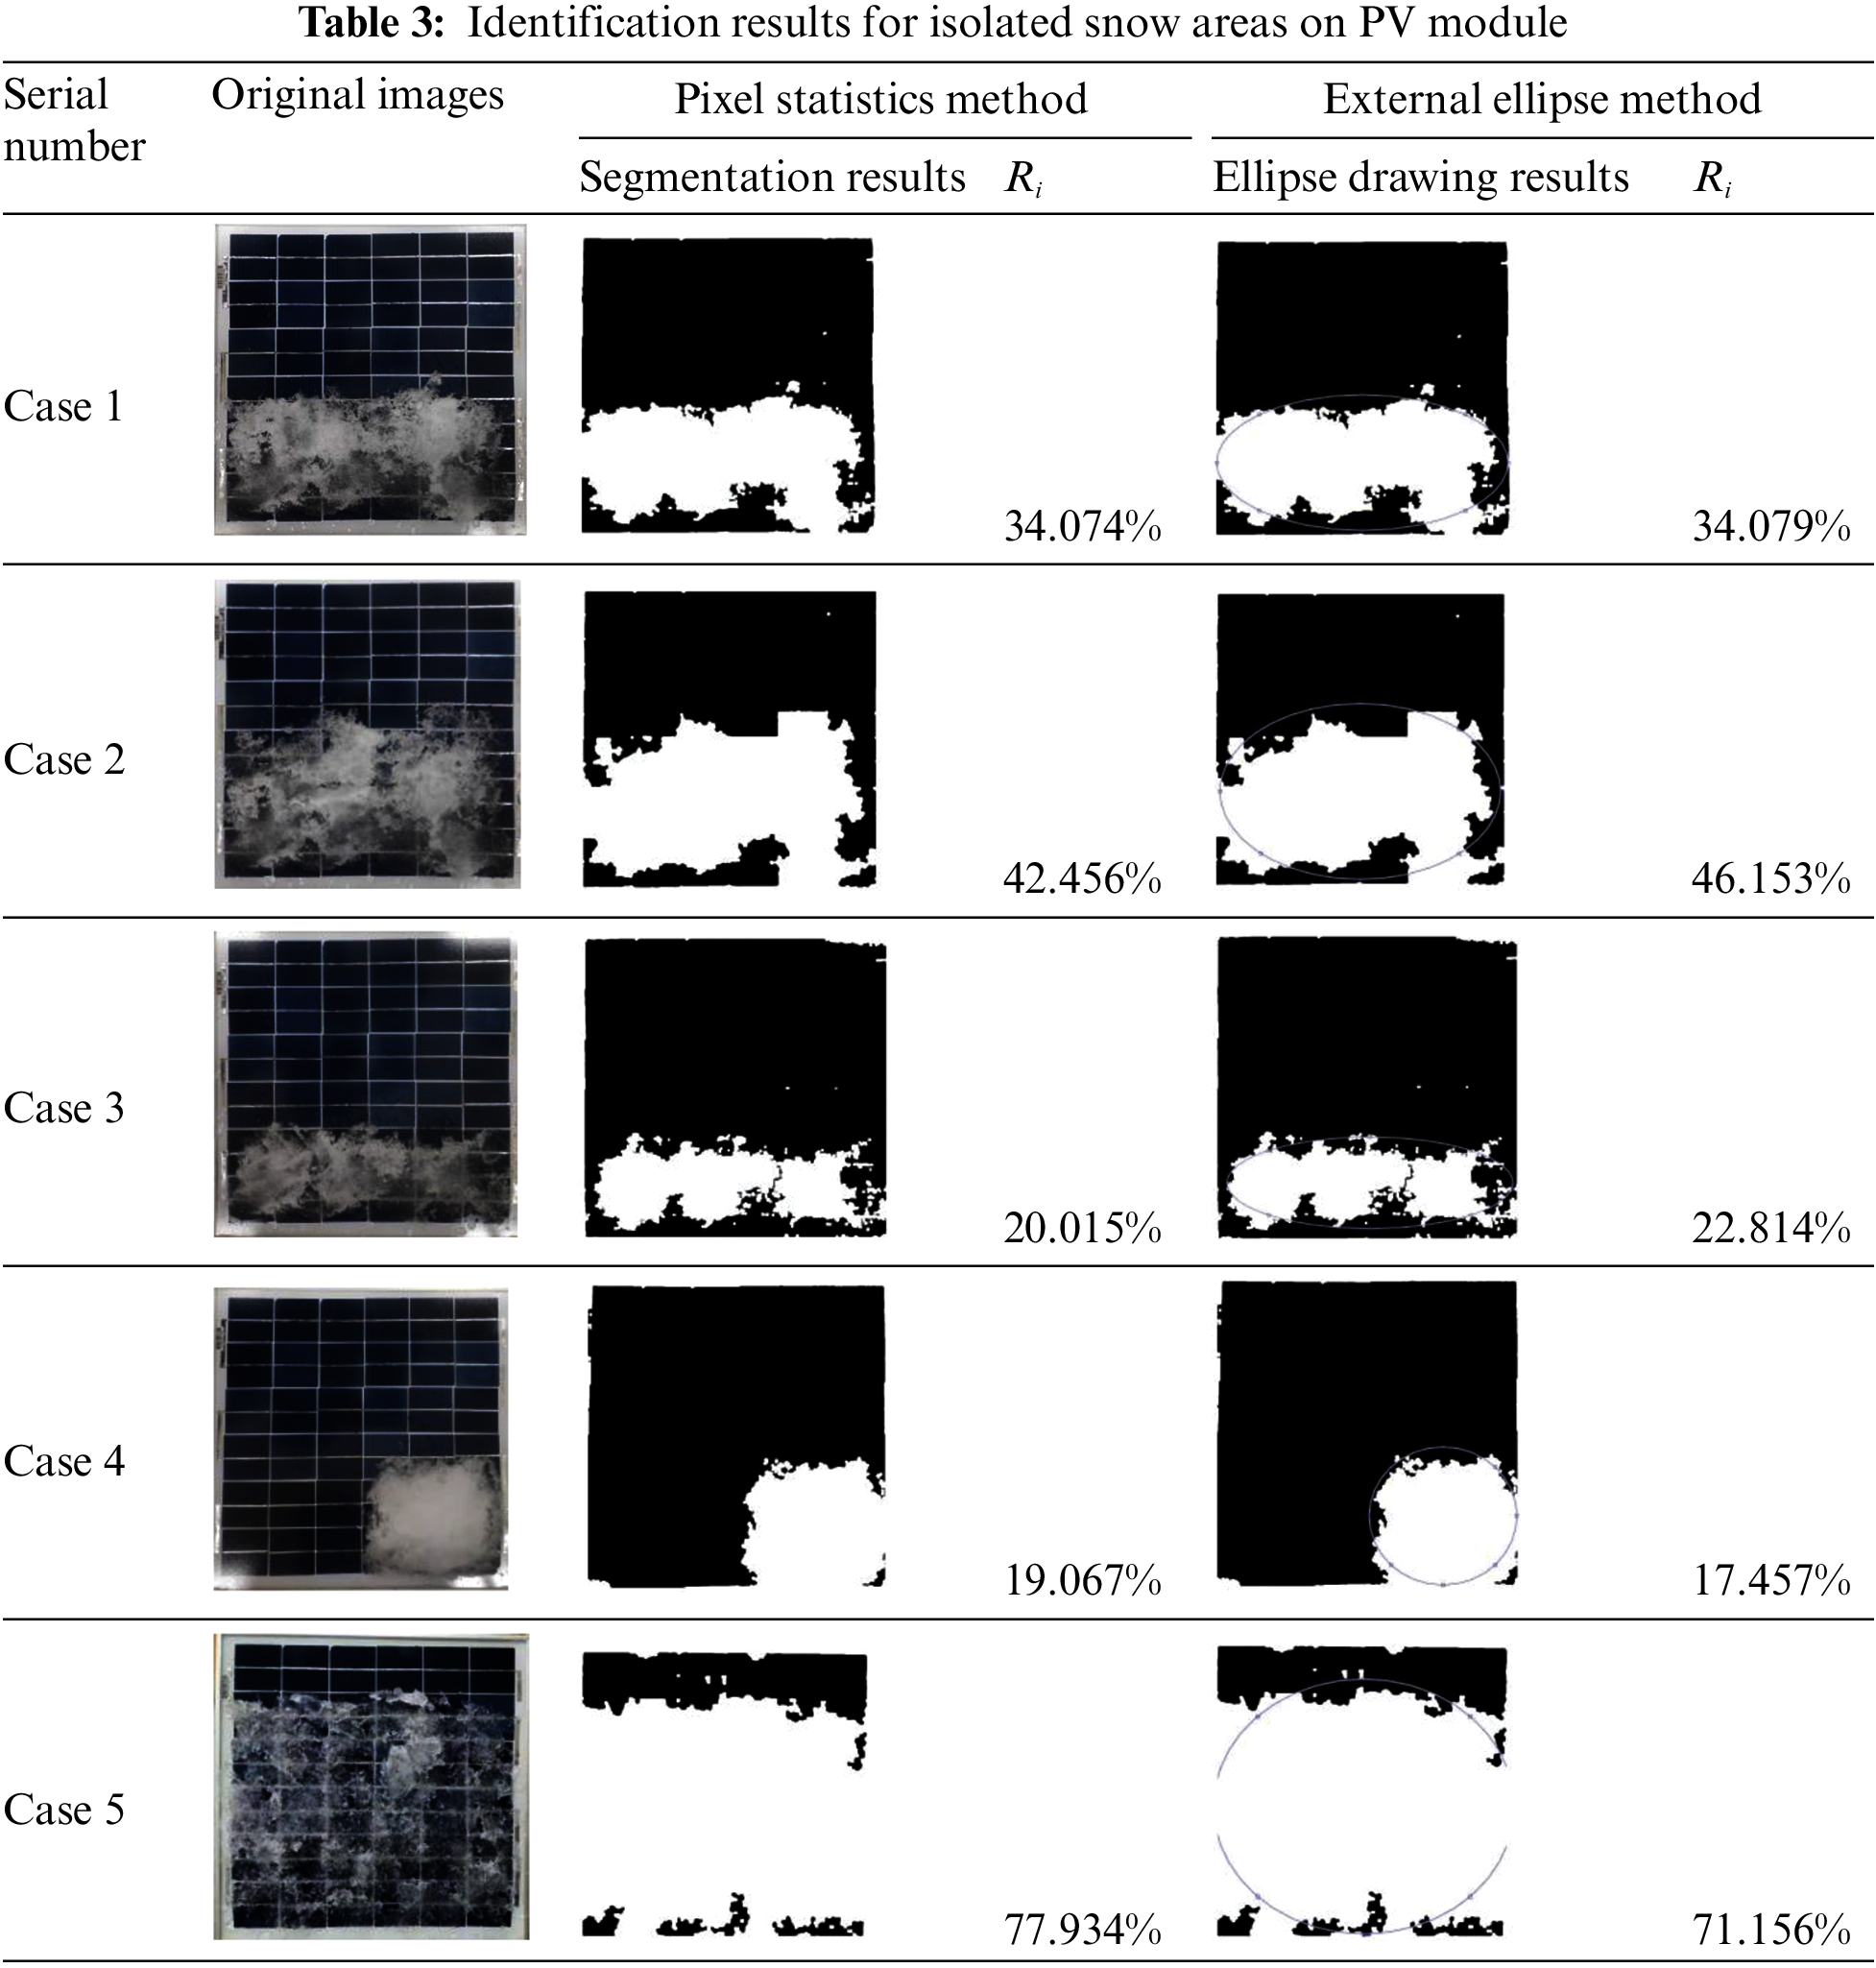
By using the aforementioned algorithm and steps, we have selected five representative and diverse cases of PV modules with different levels of ice and snow coverage from the images captured in the artificial climate laboratory. These cases were chosen to validate the detailed process and comparison of the algorithm analysis. A sequence of images of isolated residual snow areas on PV modules are processed by the above-mentioned algorithms of pixel statistical method and external ellipse method, respectively, and the results are shown in Table 3.
The specific structure of the artificial climate laboratory is shown in the Fig. 6.
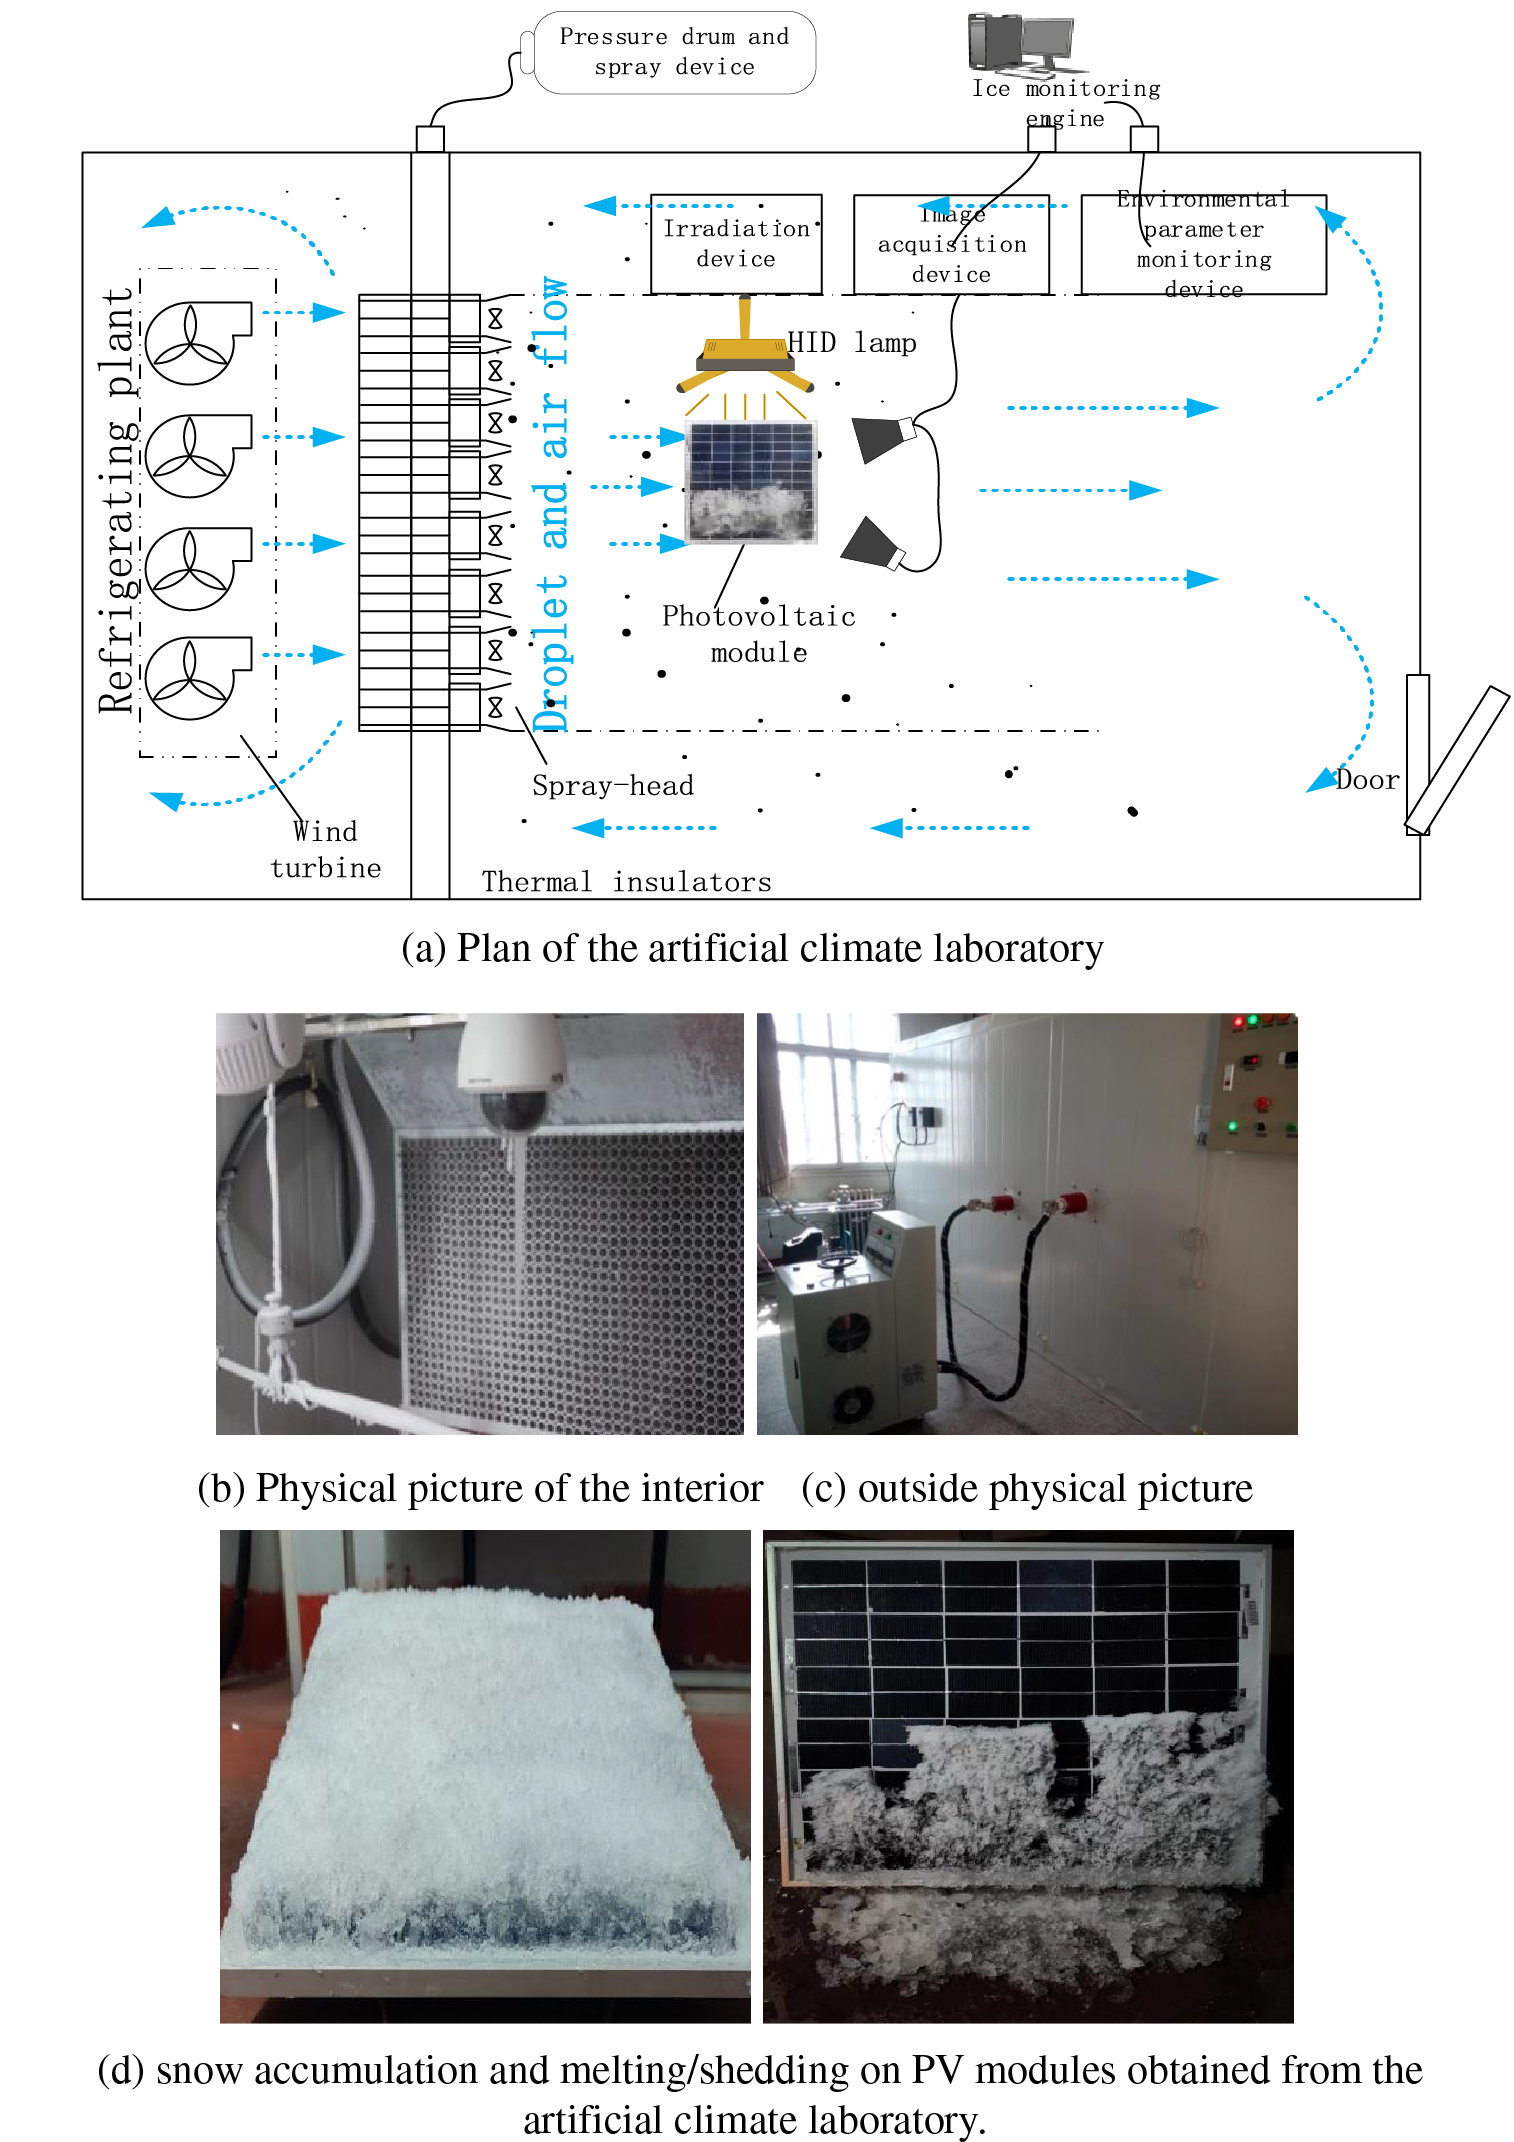
Figure 6: Artificial climate test platform
(1) The walls of the artificial climate chamber test platform are constructed of several insulation panels. The dimensions of the walls are 4.2 m in length, 3.2 m in width, and 2.2 m in height. The walls can be divided into rectangular wind tunnel structures with dimensions of 1.5 m in length and 0.8 m in height. Inside the walls, there are meteorological and icing monitoring devices, including temperature sensors, temperature and humidity recorders, temperature and humidity pressure displays, 360-degree high-definition cameras, and multiple sets of experimental equipment.
(2) The temperature control device of the test platform includes a refrigeration compressor, negative pressure fans, infrared quartz radiation lamps, and heaters. The 5HP refrigeration compressor, controlled by an independent control box and temperature sensors, allows continuous temperature adjustment from −25°C to 60°C inside the artificial climate chamber, with a control accuracy of ±0.1°C. The heater consists of a negative pressure fan and a heating resistor wire, which is easy to operate and control. The infrared quartz radiation lamp can achieve multi-level power adjustment from 0 W to 140 W, with adjustable position, and emits light that can simulate sunlight under various temperatures and radiation intensities in natural conditions. This structure enables the simulation of multi-angle light sources for testing.
(3) The objects for icing simulation inside the laboratory are PV modules, which simulate the process of snow and ice coverage on the modules and capture images.
By comparing the above two methods, the algorithm accuracy of residual area in the process of snow and ice melting is evaluated, as shown in Table 4.
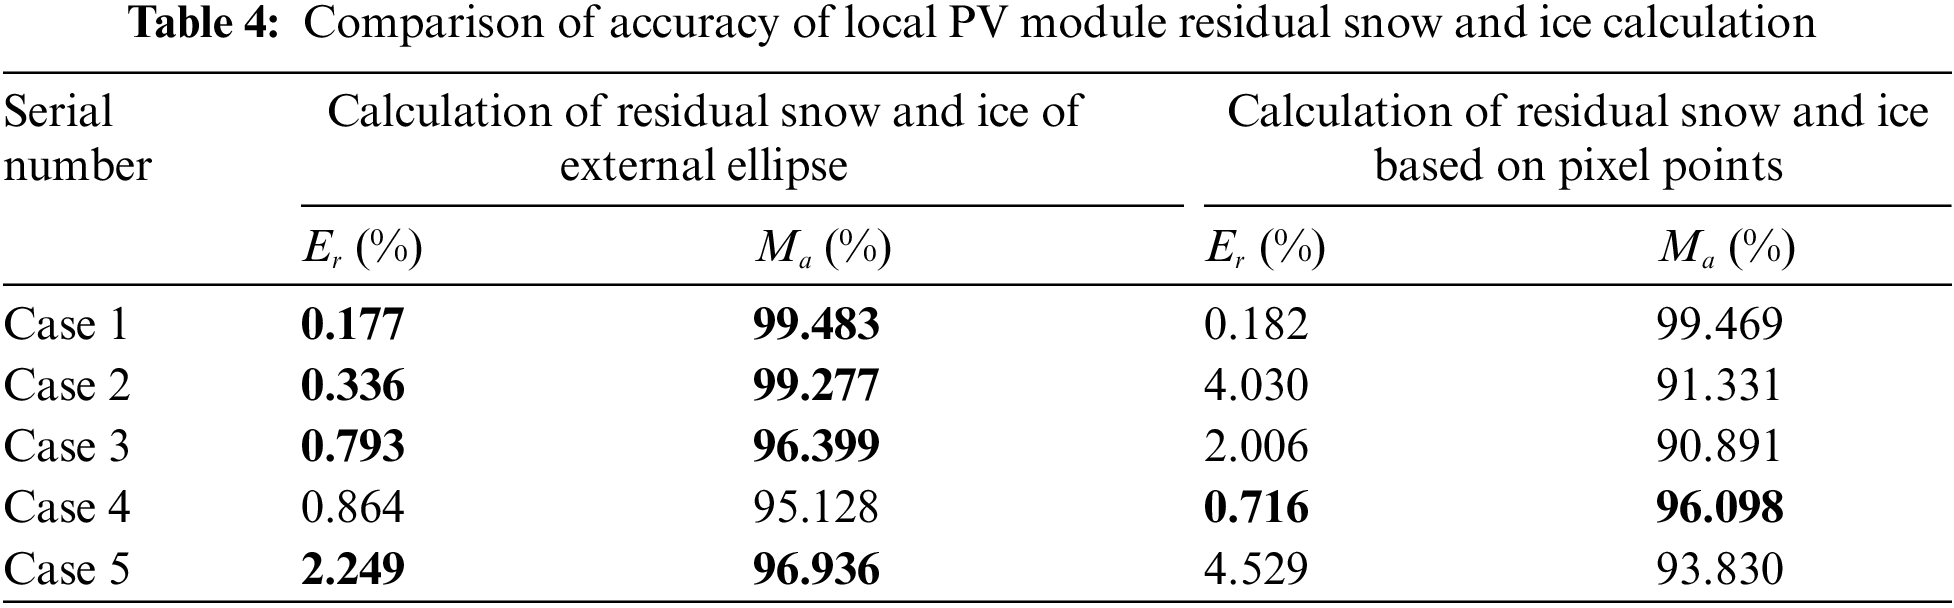
Both methods can be utilized to calculate the isolated areas of melting snow and ice on PV modules, with a maximum error of less than 5%. The pixel statistical method does not require consideration of the shape of residual snow and ice, only counting the pixels of the segmented image. This method is more suitable for analyzing snow layer and rime with strong color contrast and high image segmentation accuracy.
However, due to the strong light transmittance and weak color contrast of melting snow and ice, image preprocessing may not be satisfactory. In this case, it is more effective to use the external ellipse method to obtain the snow and ice area, rather than overemphasizing image segmentation accuracy. Thus, the external ellipse method is more valuable for identifying the isolated area of snow and ice in the later stages of natural melting.
This study selected representative cases that did not include freshly covered snow on the modules. Instead, modules with slightly melted snow were chosen as the display objects. The final selection consisted of five images that represented different processing results. It can be imagined that the identification of the target area is best when the PV module has just been covered with ice and snow, as the color contrast is significant and there is no melting. The cases 1, 2, 3, 5 in the selection show obvious signs of melting. This aligns with the results shown in Table 4: the external ellipse method exhibits higher accuracy in the later stages of melting, while the pixel statistical method performs better for large-scale snow coverage on PV modules.
Snow and ice accumulation on PV modules can significantly reduce their power generation efficiency. This paper studies the monitoring technology of residual snow and ice on PV modules, and establishes an algorithm for identifying snow and ice. The research is valuable for manual snow cleaning and power generation prediction of power plants. The main conclusions are as follows:
(1) The morphological characteristics of residual snow and ice on PV modules are significant. Therefore, a complete image identification process is proposed, including PV module corner positioning, area segmentation, residual area calculation of snow and ice, etc.
(2) Two methods for calculating residual snow and ice on PV modules are proposed and verified with errors less than 10%: the external ellipse method and the pixel statistical method. The external ellipse method exhibits higher accuracy during the later stages of snow and ice melting, while the pixel statistical method performs better in detecting large-scale snow coverage on PV modules.
In summary, this article proposes a non-destructive detection system based on image processing that can identify residual ice and snow on PV modules and assess the extent of snow and ice coverage. Compared to expensive and precise hardware detection equipment, the non-destructive detection system can be continuously optimized and updated, enabling intelligent detection of PV modules. This is of significant importance for predicting the power generation efficiency and PV operations under winter snow and ice conditions in PV power plants. However, this method still has limitations, such as the mismatch between calculation speed and acquisition speed, as well as concerns regarding the alignment of quantitatively analyzed images with the on-site positioning.
Acknowledgement: The authors acknowledge the reviewers for providing valuable comments and helpful suggestions to improve the manuscript.
Funding Statement: This research was supported by the Key Research and Development Projects in Shaanxi Province (Program No. 2021GY-306), the Innovation Capability Support Program of Shaanxi (Program No. 2022KJXX-41), and the Key Scientific and Technological Projects of Xi’an (Program No. 2022JH-RGZN-0005).
Author Contributions: Zhu, Y.C. and Wang, J.W. were responsible for the overall design of the study, conducted the experiments, analyzed the data, and wrote the main manuscript text. Zhang, Y. and Zhao, L. provided their expertise to the study and assisted in revising the manuscript. Jiang, B.T. and Huang, X.B. contributed to the interpretation of the data and the drafting of the manuscript. All authors have read and approved the final version of the manuscript.
Availability of Data and Materials: The datasets used and/or analyzed during the current study are available from the corresponding author on reasonable request. If any of these declarations are not applicable to the content of our submission, we declare that they are “not applicable”.
Conflicts of Interest: The authors declare that they have no conflicts of interest to report regarding the present study.
References
1. Hosseini, S., Taheri, S., Farzaneh, M., Taheri, H. (2018). Modeling of snow-covered photovoltaic modules. IEEE Transactions on Industrial Electronics, 65(10), 7975–7983. [Google Scholar]
2. The National Energy Administration, Construction and operation of photovoltaic power generation in the first half of 2022 (In Chinese). http://www.nea.gov.cn/2022-01/28/c_1310445390.htm (accessed on 08/11/2023). [Google Scholar]
3. Pawluk, R. E., Chen, Y. X., She, Y. T. (2019). Photovoltaic electricity generation loss due to snow—A literature review on influence factors, estimation, and mitigation. Renewable & Sustainable Energy Reviews, 107, 171–182. [Google Scholar]
4. Fillion, R. M., Riahi, A. R., Edrisy, A. (2014). A review of icing prevention in photovoltaic devices by surface engineering. Renewable & Sustainable Energy Reviews, 32, 797–809. [Google Scholar]
5. Andenaes, E., Jelle, B. P., Ramlo, K., Kolas, T., Selj, J. et al. (2018). The influence of snow and ice coverage on the energy generation from photovoltaic solar cells. Solar Energy, 159, 318–328. [Google Scholar]
6. Mehrtash, M., Rousse, D. R., Quesada, G. (2013). Effects of surroundings snow coverage and solar tracking on photovoltaic systems operating in Canada. Journal of Renewable and Sustainable Energy, 5(5), 53119. [Google Scholar]
7. Andrews, R. W., Pollard, A., Pearce, J. M. (2013). The effects of snowfall on solar photovoltaic performance. Solar Energy, 92, 84–97. [Google Scholar]
8. Yan, C. Y., Qu, M. L., Chen, Y., Feng, M. (2020). Snow removal method for self-heating of photovoltaic panels and its feasibility study. Solar Energy, 206, 374–380. [Google Scholar]
9. Jelle, B. P. (2013). The challenge of removing snow downfall on photovoltaic solar cell roofs in order to maximize solar energy efficiency-research opportunities for the future. Energy and Buildings, 67, 334–351. [Google Scholar]
10. Al-Dulaimi, A. A., Guneser, M. T., Hameed, A. A., Marquez, F. P. G., Fitriyani, N. L. et al. (2023). Performance analysis of classification and detection for PV panel motion blur images based on deblurring and deep learning techniques. Sustainability, 15(2), 1150. https://doi.org/10.3390/su15021150 [Google Scholar] [CrossRef]
11. Garcia, E., Quiles, E., Zotovic-Stanisic, R., Gutierrez, S. C. (2022). Predictive fault diagnosis for ship photovoltaic modules systems applications. Sensors, 22(6), 2175. https://doi.org/10.3390/s22062175 [Google Scholar] [PubMed] [CrossRef]
12. Li, Q., Yu, K., Chen, D. (2021). Solardiagnostics: Automatic damage detection on rooftop solar photovoltaic arrays. Sustainable Computing-Informatics & Systems, 32, 100595. [Google Scholar]
13. Aarseth, B. B., Øgaard, M. B., Zhu, J., Stromberg, T., Tsanakas, J. A. et al. (2018). Mitigating snow on rooftop PV systems for higher energy yield and safer roofs. Proceedings of the 35th European Photovoltaic Solar Energy Conference and Exhibition, pp. 1630–1635. Brussels, Belgium. [Google Scholar]
14. Andrews, R. W., Pearce, J. M. (2012). Prediction of energy effects on photovoltaic systems due to snowfall events. 2012 38th IEEE Photovoltaic Specialists Conference, pp. 3386–3391. Austin,TX, USA, IEEE. https://doi.org/10.1109/PVSC.2012.6318297 [Google Scholar] [CrossRef]
15. Wirth, G., Schroedter-Homscheidt, M., Zehner, M., Becker, G. (2010). Satellite-based snow identification and its impact on monitoring photovoltaic systems. Solar Energy, 84(2), 215–226. https://doi.org/10.1016/j.solener.2009.10.023 [Google Scholar] [CrossRef]
16. Drews, A., Betcke, J., Lorenz, E., Heinemann, D., Toggweiler, P. et al. (2004). Intelligent performance check of PV system operation based on satellite data. ISES Europe Solar Congress, pp. 3079–3085. Germany. [Google Scholar]
17. Øgaard, M. B., Haug, H., Selj, J. (2018). Methods for quality control of monitoring data from commercial PV systems. Proceedings of the 35th European Photovoltaic Solar Energy Conference and Exhibition, pp. 2083–2088. Brussels, Belgium. [Google Scholar]
18. Abou Yassine, A. H., Namdari, N., Mohammadian, B., Sojoudi, H. (2022). Understanding mechanisms of snow removal from photovoltaic modules. Solar Energy, 231, 175–184. [Google Scholar]
19. Zheng, J., Liu, W., Cui, T., Wang, H., Chen, F. et al. (2023). A novel domino-like snow removal system for roof pv arrays: Feasibility, performance, and economic benefits. Applied Energy, 333, 120554. [Google Scholar]
20. Li, Y. X., Yuan, H. T. (2020). Analysis of the operation of double-glass and double-sided photovoltaic modules in snowy weather. Solar Energy, 318(10), 63–67. [Google Scholar]
21. Razagui, A., Abdeladim, K., Semaoui, S., Arab, A. H., Boulahchiche, S. (2020). Modeling the forecasted power of a photovoltaic generator using numerical weather prediction and radiative transfer models coupled with a behavioral electrical model. Energy Reports, 6, 57–62. [Google Scholar]
22. Kako, T., Nakajima, A., Irie, H., Kato, Z., Uematsu, K. et al. (2004). Adhesion and sliding of wet snow on a super-hydrophobic surface with hydrophilic channels. Journal of Materials Science, 39(2), 547–555. [Google Scholar]
23. Chen, X. Q., Liu, S. L., Liu, W. (2014). Research on image technology with algorithm of image threshold segmentation based on gray level characteristics. Applied Mechanics and Materials, 473, 190–193. [Google Scholar]
24. Gonzalez, R. C., Woods, R. E. (2007). Digital image processing, 3rd edition. USA: Prentice Hall. [Google Scholar]
25. Zhang, Y., Huang, X. B., Jia, J. Y., Zhu, Y. C., Zhao, L. et al. (2020). Detection and condition assessment of icicle bridging for suspension glass insulator by image analysis. IEEE Transactions on Instrumentation and Measurement, 69(10), 7458–7471. [Google Scholar]
Cite This Article
 Copyright © 2024 The Author(s). Published by Tech Science Press.
This work is licensed under a Creative Commons Attribution 4.0 International License , which permits unrestricted use, distribution, and reproduction in any medium, provided the original work is properly cited.
 Downloads
 Citation Tools