
 Submit a Paper
 Propose a Special lssue
 Open Access
ARTICLE

Prediction Model of Wax Deposition Rate in Waxy Crude Oil Pipelines by Elman Neural Network Based on Improved Reptile Search Algorithm
1 The Second Oil Production Plant, Sinopec Northwest Oilfield Company, Urumqi, 830011, China
2 Yingmaili Oil and Gas Production Management Area, PetroChina Tarim Oilfield Company, Korla, 841001, China
3 College of Petroleum Engineering, Xi’an Shiyou University, Xi’an, 710065, China
* Corresponding Author: Zhuo Chen. Email:
Energy Engineering 2024, 121(4), 1007-1026. https://doi.org/10.32604/ee.2023.045270
Received 22 August 2023; Accepted 23 November 2023; Issue published 26 March 2024
 View Full Text
 Download PDF
Abstract
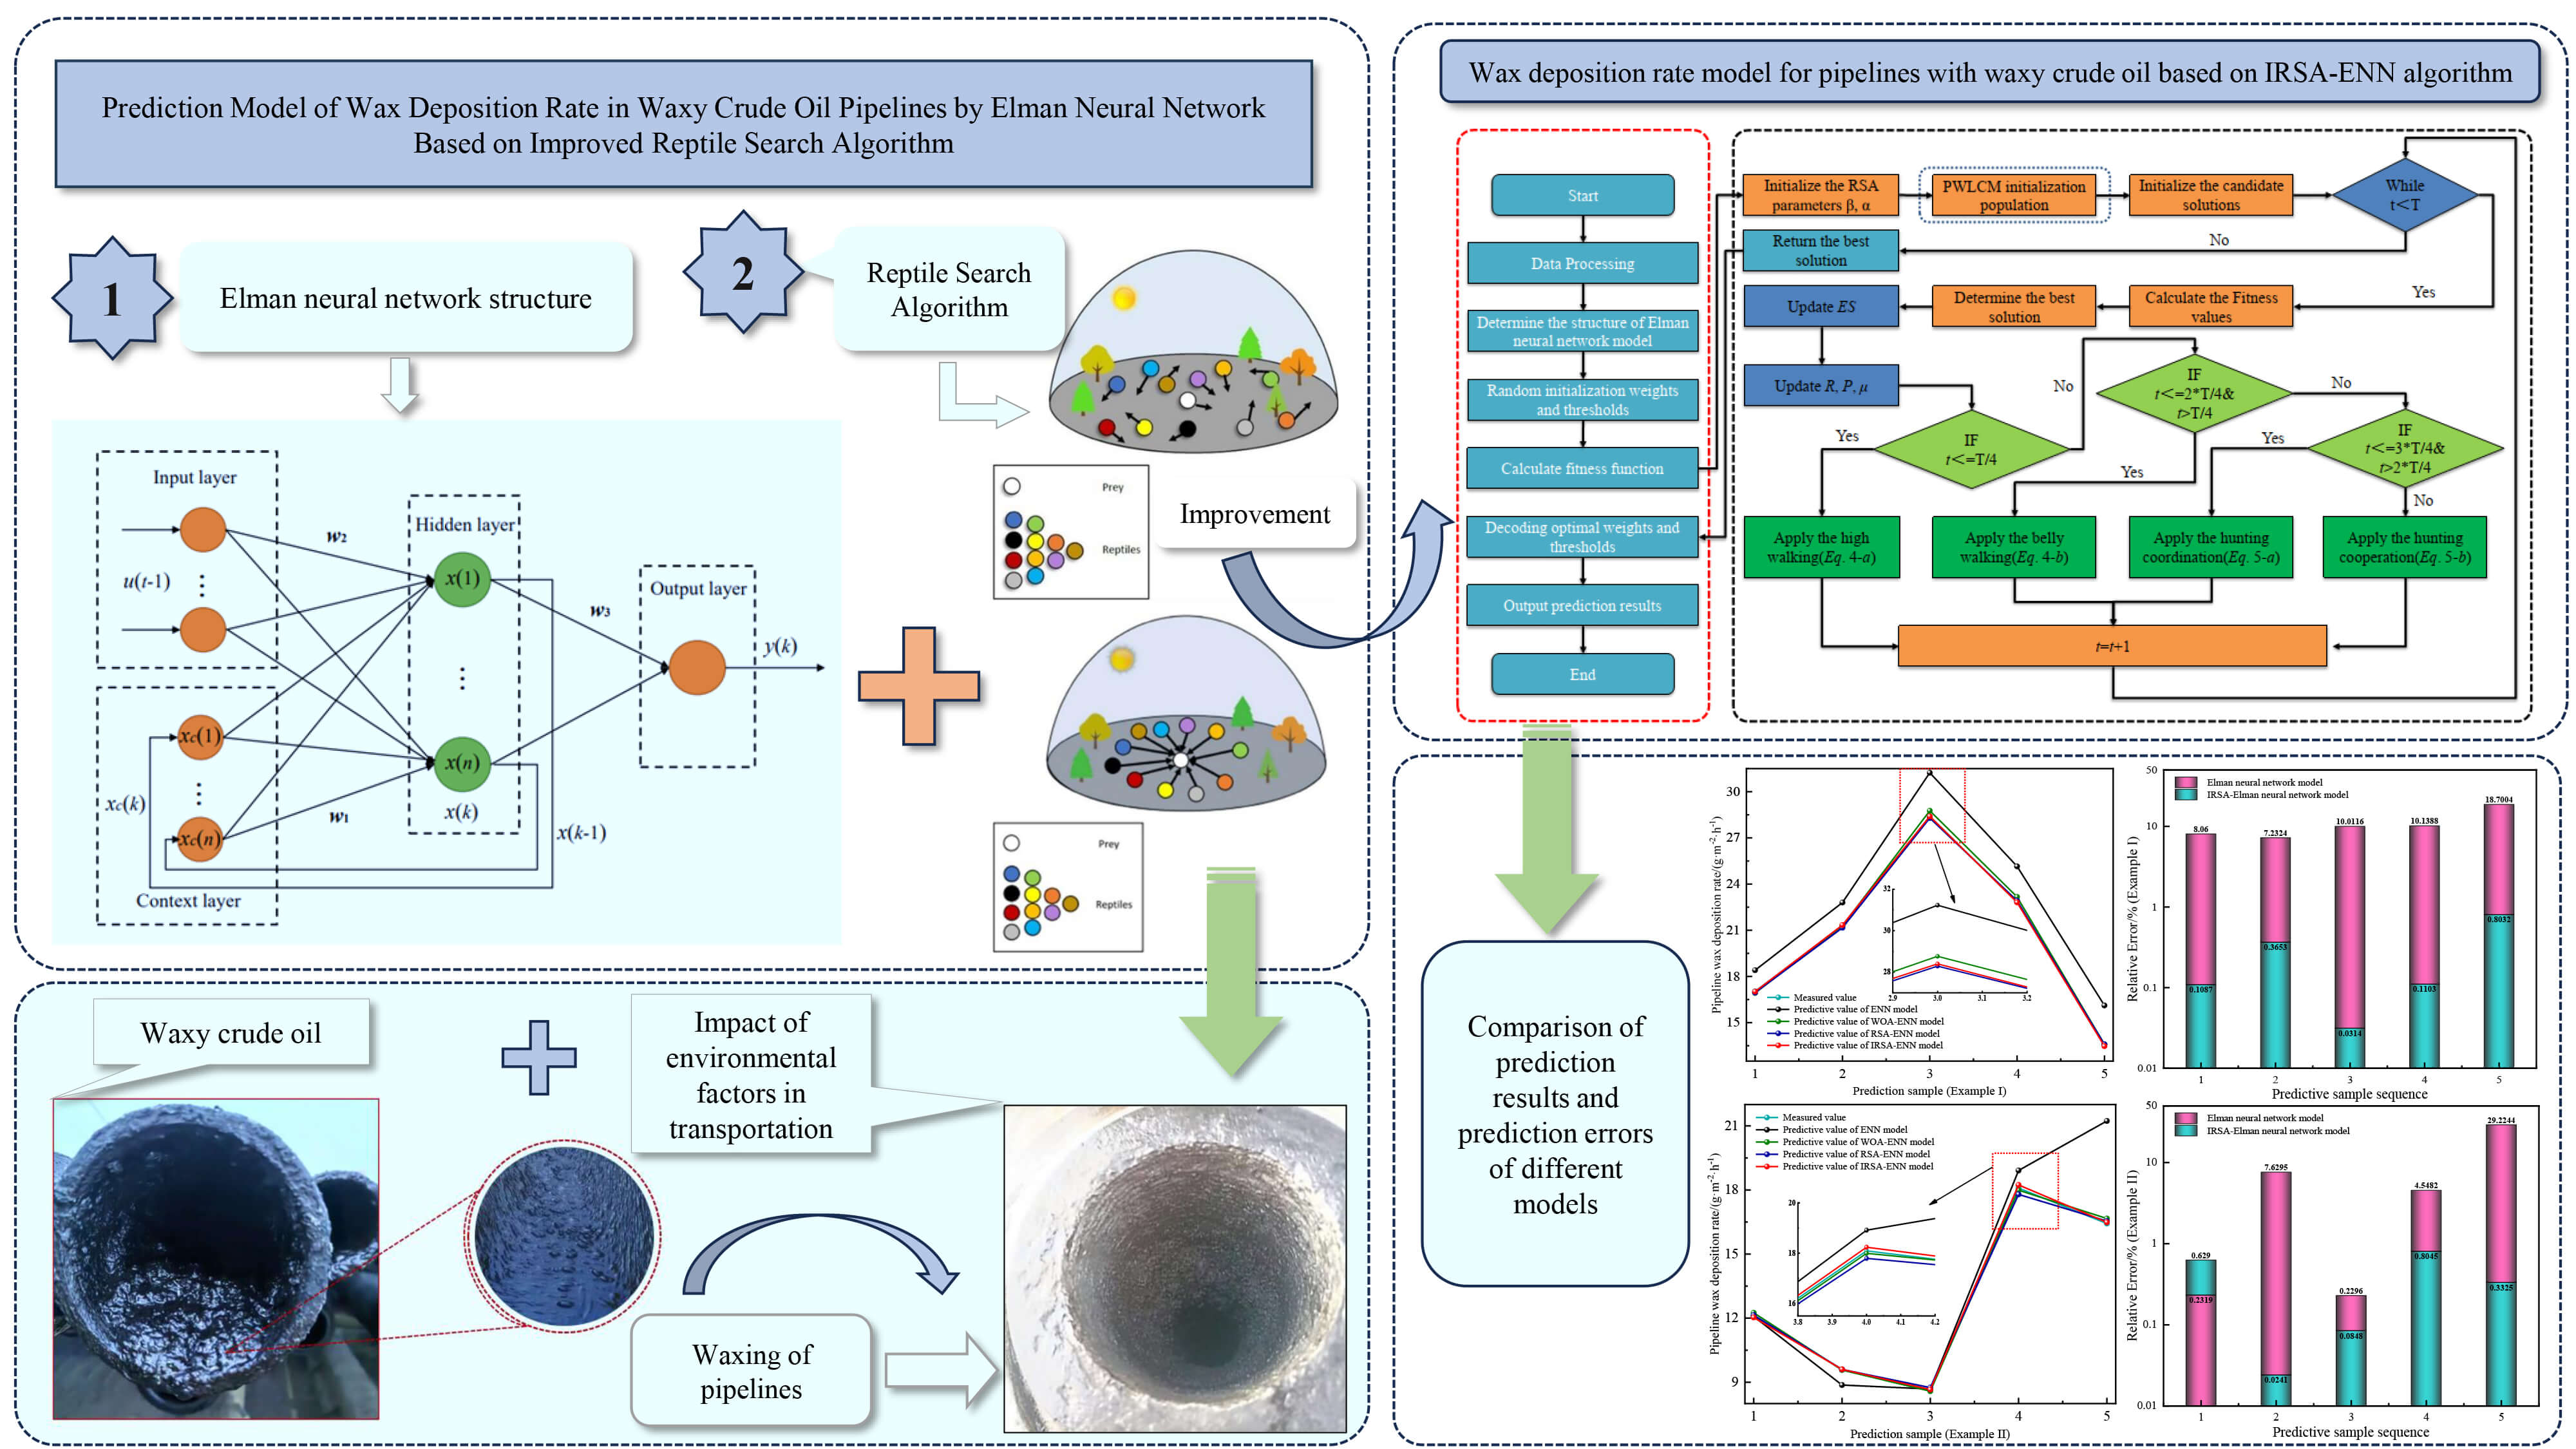
A hard problem that hinders the movement of waxy crude oil is wax deposition in oil pipelines. To ensure the safe operation of crude oil pipelines, an accurate model must be developed to predict the rate of wax deposition in crude oil pipelines. Aiming at the shortcomings of the ENN prediction model, which easily falls into the local minimum value and weak generalization ability in the implementation process, an optimized ENN prediction model based on the IRSA is proposed. The validity of the new model was confirmed by the accurate prediction of two sets of experimental data on wax deposition in crude oil pipelines. The two groups of crude oil wax deposition rate case prediction results showed that the average absolute percentage errors of IRSA-ENN prediction models is 0.5476% and 0.7831%, respectively. Additionally, it shows a higher prediction accuracy compared to the ENN prediction model. In fact, the new model established by using the IRSA to optimize ENN can optimize the initial weights and thresholds in the prediction process, which can overcome the shortcomings of the ENN prediction model, such as weak generalization ability and tendency to fall into the local minimum value, so that it has the advantages of strong implementation and high prediction accuracy.Graphic Abstract
Keywords
Nomenclature
| X1 | Flow velocity/(m.s−1) |
| X2 | Oil temperature/°C |
| X3 | Wall temperature/°C |
| X4 | Shear stress at pipe wall/Pa |
| X5 | Crude oil viscosity/(mPa·s) |
| X6 | Wax molecular concentration gradient at pipe wall/(10−3·°C−1) |
| X7 | Temperature gradient at pipe wall/(°C·mm−1) |
| X8 | Wax deposition rate/(g·m−2·h−1) |
| Y1 | Oil temperature/°C |
| Y2 | Wall temperature/°C |
| Y3 | Crude oil viscosity/(mPa·s) |
| Y4 | Shear stress at pipe wall/Pa |
| Y5 | Flow velocity/(m·s−1) |
| Y6 | Temperature gradient at pipe wall/(°C·mm−1) |
| Y7 | Wax molecular concentration gradient at pipe wall/(10−3·°C−1) |
| Y8 | Wax deposition rate/(g·m−2·h−1) |
| P | Predicted value/(g·m−2·h−1) |
| R | Relative error/% |
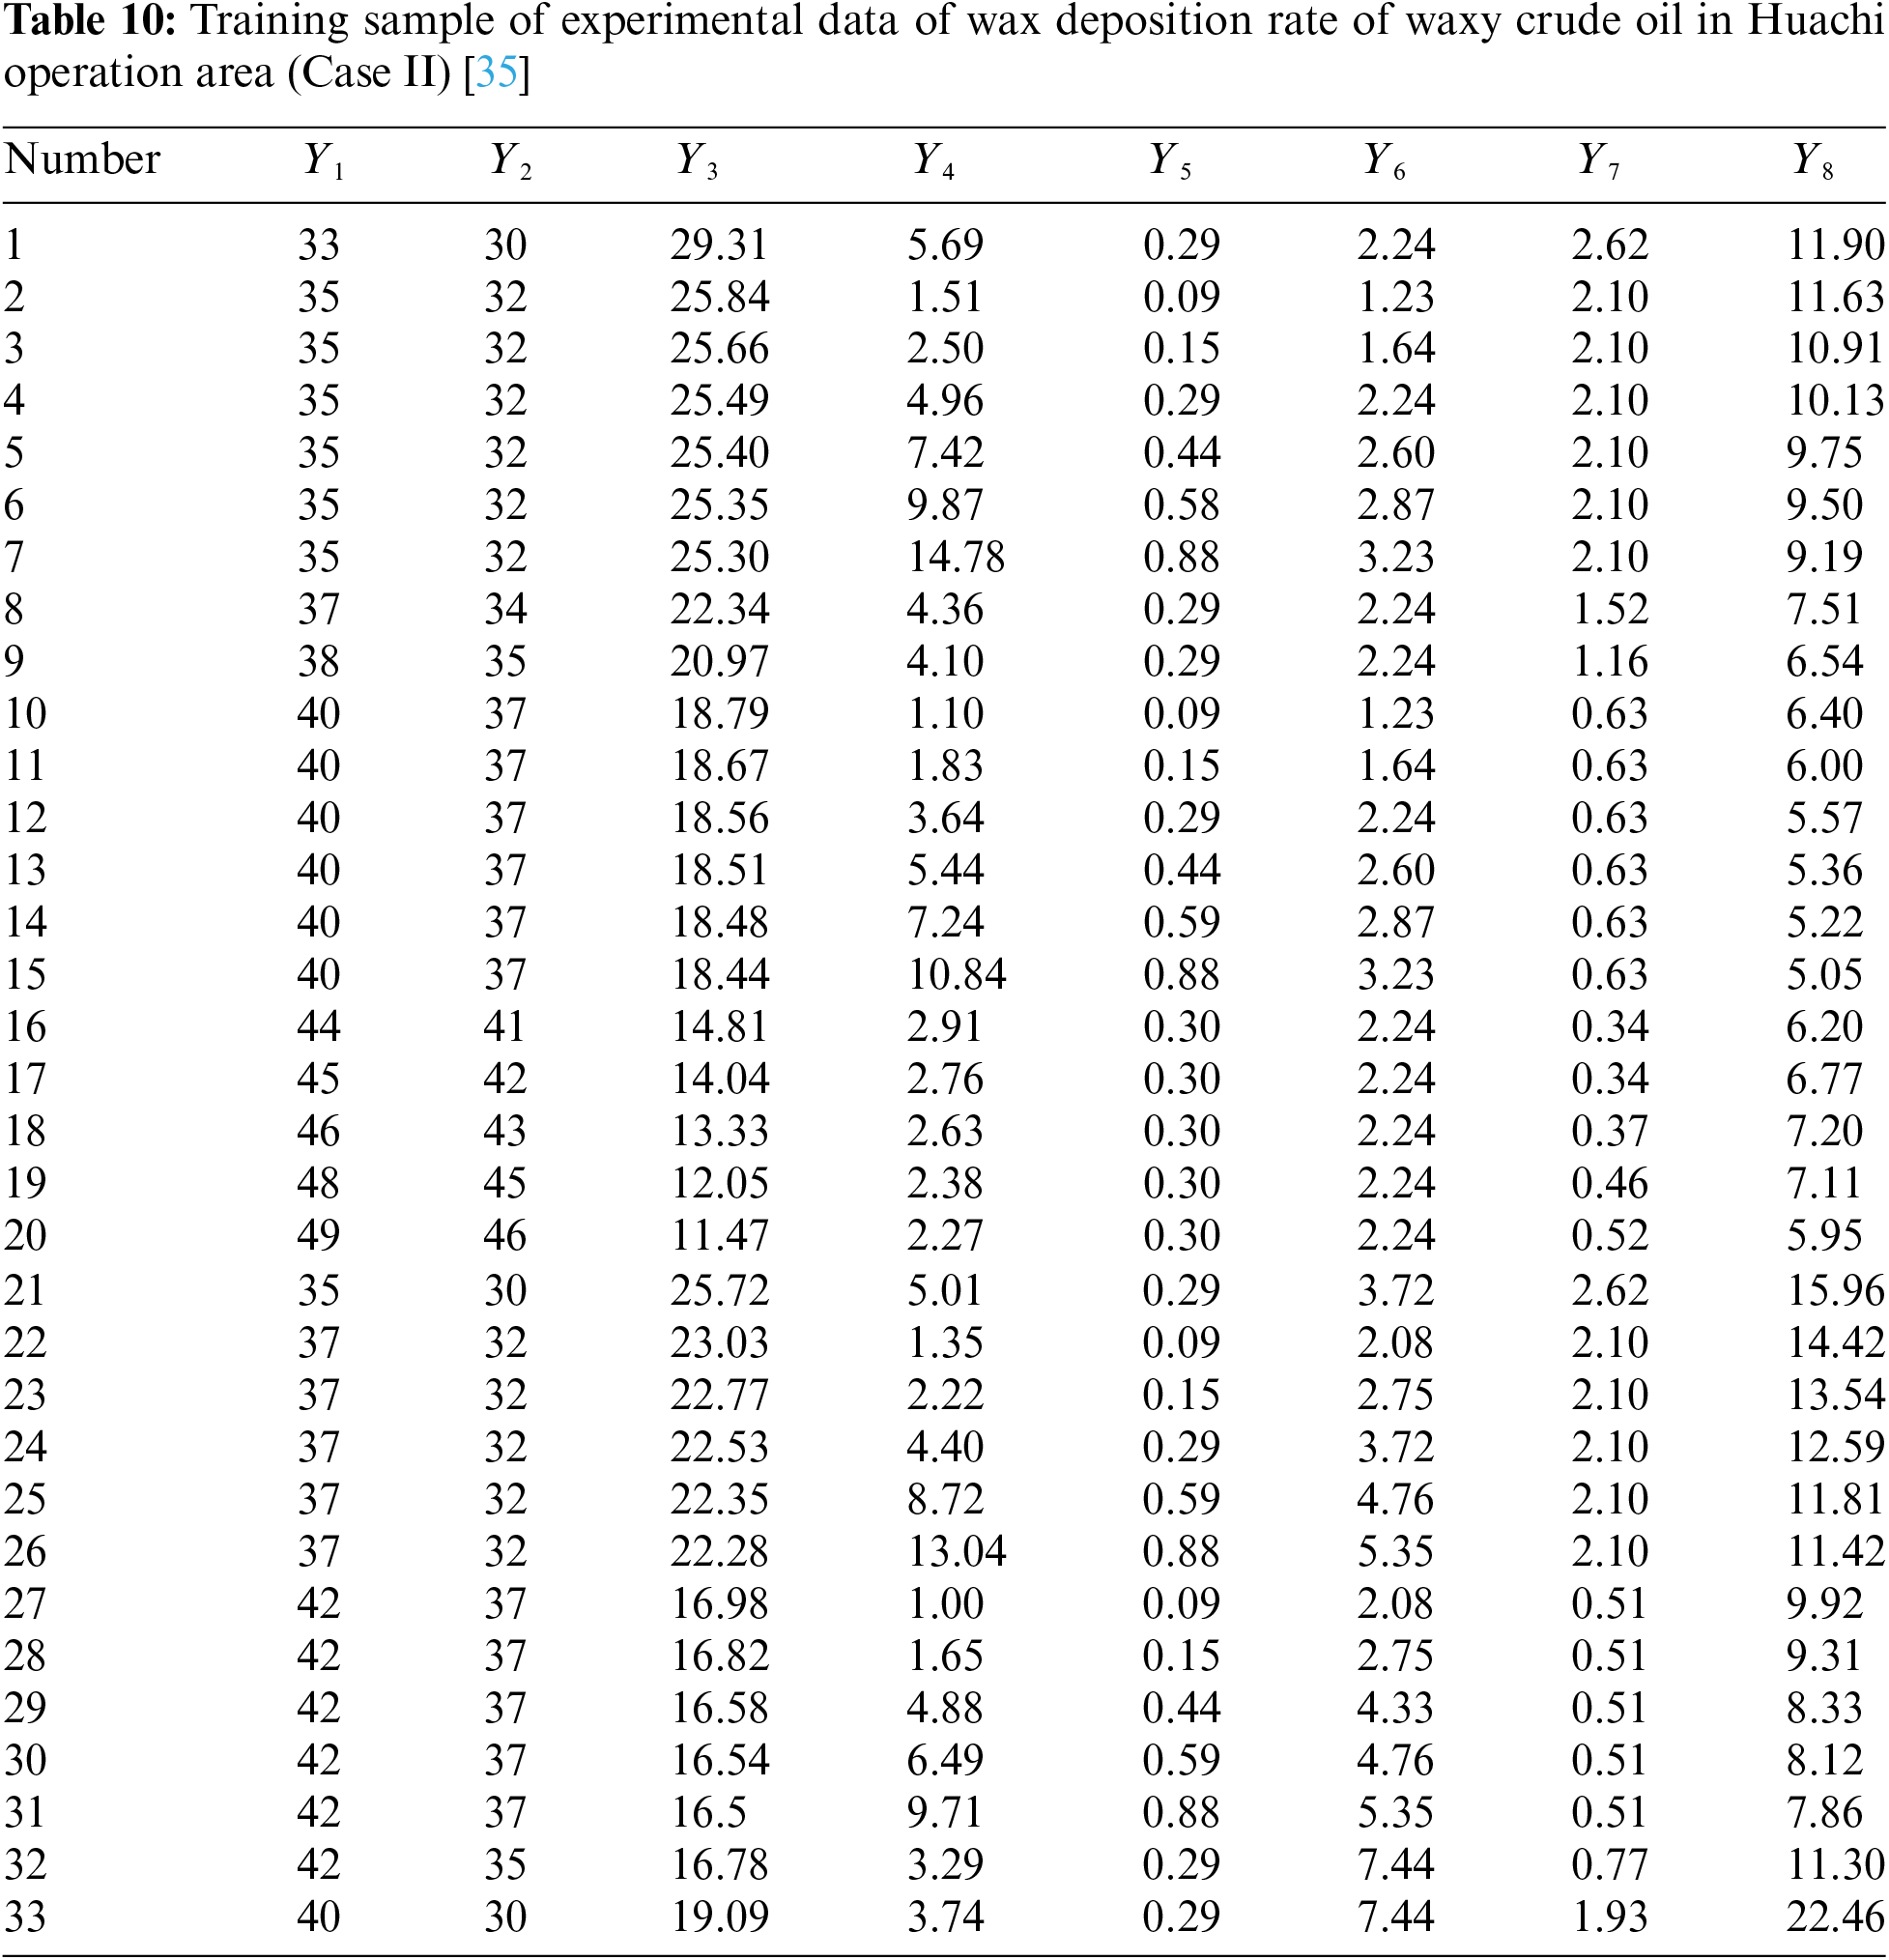
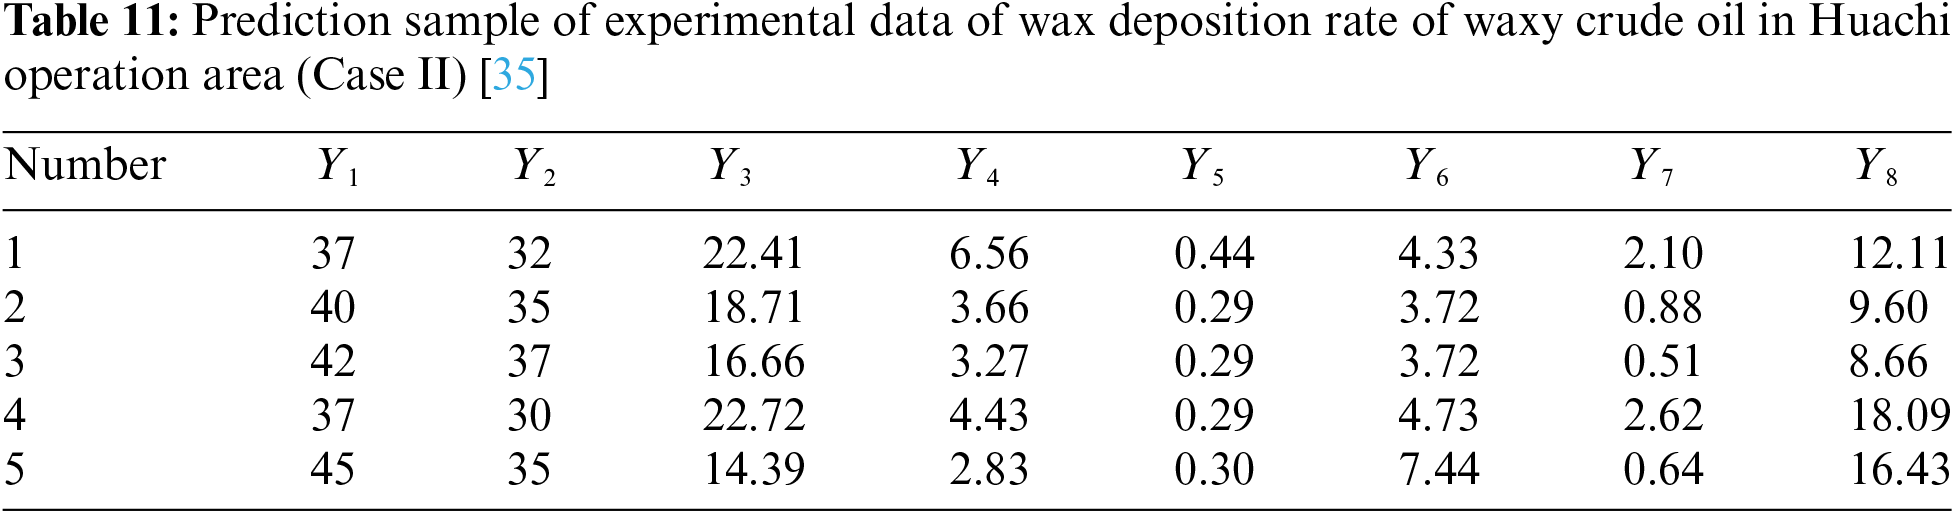
| *Note: | Variables X1 to X8 represent wax deposition rate data from the Kenli Oilfield, and variables Y1to Y8 represent wax deposition rate data from the Huachi operation area. |
| ENN | Elman neural network |
| IRSA | Improved reptile search algorithm |
| RSA | Reptile search algorithm |
| BPNN | Back-propagation neural network |
| RBF | Radial basis function |
| MLP | Multilayer perceptron |
| MLP-LMA | Multilayer perceptron Levenberg-Marquardt algorithm |
| CFNN | Cascaded forward neural network |
| GRNN | Generalized regression neural network |
| PWLCM | Piecewise linear chaotic map |
| N | Number of hidden layer nodes |
| MSE | Mean square error |
| RMSE | Root mean square error |
| MAPE | Mean absolute percentage error |
| R2 | Correlation coefficient |
| m | Number of nodes in the input layer |
| n | Number of nodes in the output layer |
| a | Integers between 1 and 10 |
| WOA | Whale optimization algorithm |
| HUANG | Huang Qiyu wax deposition prediction model |
Pipeline wax deposition is a common problem when crude oils are transported in pipelines. Crude oils produced in China tend to have a high viscosity, coagulate easily, and contain high levels of wax. During the transportation of waxy crude oil through pipelines, changes in pressure and temperature conditions promote the precipitation of solid heavy constituents, including waxes, colloids, and asphaltenes, resulting in the formation of wax deposits on the pipeline walls [1–3]. The oil produced from an oilfield in China is shown in Fig. 1.
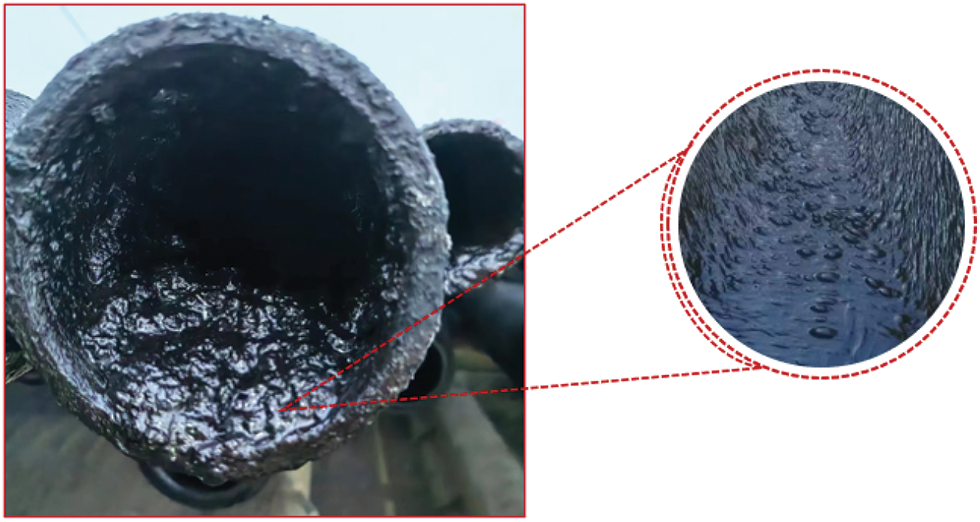
Figure 1: The oil produced from an oilfield in China
Wax deposition reduces the effective flow area of the pipeline, increasing flow resistance, reducing transport capacity, and in severe cases, even causing pipeline blockage and destructive accidents [4–6]. Therefore, it is crucial to accurately understand the mechanism of wax deposition during crude oil pipeline transportation and calculate the rate of wax deposition in the pipeline. This holds significant practical importance for ensuring safe oil well production. The wax deposition phenomenon of crude oil pipelines in oilfield engineering practice is shown in Fig. 2.
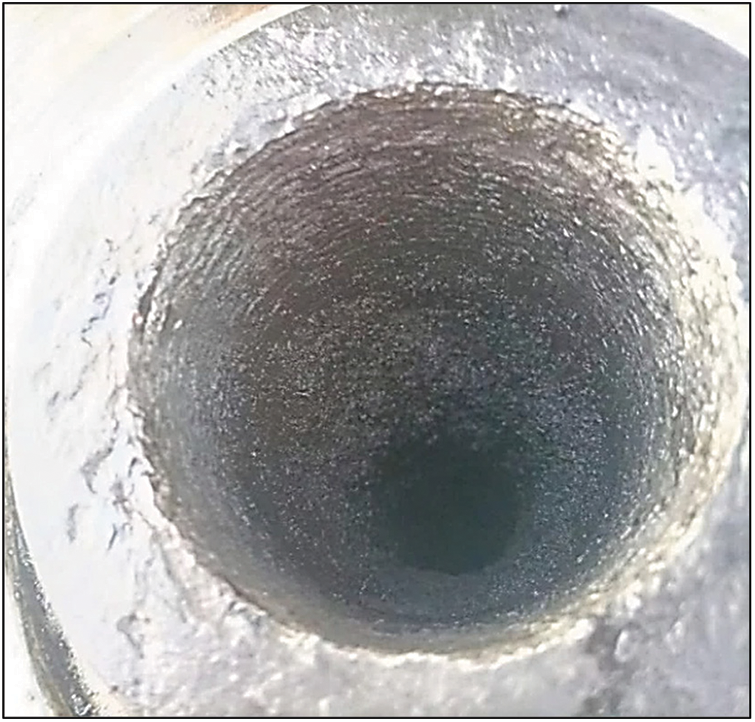
Figure 2: Wax deposition in crude oil pipeline
Researchers simulated the wax deposition phenomenon in pipelines through experiments, combined with theoretical analysis to summarize the influence mechanism of wax deposition, and established prediction models for wax deposition to predict the actual wax deposition [7–11]. Currently, prediction models for wax deposition rate generally consist of the thermodynamic prediction model, kinetic prediction model, and artificial intelligence prediction model [12–14].
1) Thermodynamic prediction model
The relevant theories affecting wax deposition have been introduced by researchers, who utilized thermodynamics, colloid chemistry, and hydrodynamics to conduct extensive experiments, theoretical analyses, and summarize a representative Thermodynamic mathematical model of wax deposition. However, the components contained in the solid phase of wax deposition are very complex, and the properties of the components are quite different, which leads to the complexity of the model formula, poor adaptability, narrow application range, limited accuracy, and inconvenient application [15].
2) Dynamic prediction model
Combined with the wax deposition mechanism of crude oil pipelines and the influence of various conditions and factors, researchers established the prediction model of wax deposition dynamics based on “The Law of Fick Diffusion” and determined the relevant parameters of the model through experiments. This kind of model is characterized by simple application and can reflect the wax deposition in the actual pipeline to a certain extent, but the prediction accuracy still has a lot of room for improvement [16,17].
3) Artificial intelligence prediction model
The fast development of computer science provides a new way of thinking about wax deposition prediction. This method does not need to consider various mechanisms and complicated influencing factors affecting wax deposition, but only needs to establish enough experimental data samples, then combine artificial intelligence methods to learn the experimental data samples, and then a trained artificial intelligence wax deposition prediction model can be constructed. This method can be used to predict the wax deposition in other operating conditions [18,19].
Zhou et al. [20] examined the effect of different factors on the wax deposition rate of pipelines and established a prediction model for the BPNN wax deposition model by error back-propagation neural network (BPNN). Coto et al. [21] established a novel predictive model for wax deposition in pipelines and compared it with laboratory measurements, which has the advantage of high prediction accuracy. Tian et al. [22] considered the effects of seven factors on the rate of wax deposition in pipelines and established a 7-10-1 three-layer neural network structure using the BPNN model. The results show that the BPNN model itself has some inherent defects, which will greatly affect the prediction performance. Wang et al. [23] established a novel prediction model for pipeline wax deposition rate using support vector machine (SVM) model. The authors pointed out that different combinations of the penalty factor C and the kernel function parameter g have a great impact on the prediction results when the radial basis function (RBF) neural network is used as the kernel function. Xie et al. [24] established an RBF neural network wax deposition rate prediction model. The relative error of the model is only 1.5% compared with the experimental data. Lashkarbolooki et al. [25] established a novel multilayer perceptron (MLP) wax deposition prediction model, and compared with the experimental data, the newly constructed model has higher prediction accuracy. Behnam et al. [26] established four models to predict wax deposition rates in crude oil pipelines using pour point temperature and °API as the main factors affecting wax deposition: MLP, RBF, CFNN, and GRNN. The results showed that the GRNN model has a stronger predictive capability. The models and methods proposed by the above scholars have unique advantages, but due to the limitations of optimization algorithms (it is impossible to achieve the best balance between global optimum and local optimum) and neural networks, it may lead to the inability to accurately predict the wax deposition rate of waxy crude oil pipelines for multi-factor and high-dimensional problems.
As a widely used neural network, ENN has a real-time feedback function and short-term memory capability (adding a context layer to the traditional three-layer network structure) [27,28]. Compared with BPNN, ENN is better in network stability and calculation accuracy, but it also has some defects (lack of generalization ability, easy to fall into the local minimum value). How to improve it through related optimization algorithms is still an important content of current research. The Reptile Search Algorithm (RSA) is a novel meta-heuristic algorithm, which has the advantages of high solution accuracy and fast operation speed [29–31]. In the application of RSA, a difficult problem is how to get the best balance between global search and local search. In fact, this is also a shortcoming of the algorithm. Considering the advantages of RSA and the shortcomings of current research, this paper introduces the strategy of Piecewise Linear Chaotic Map (PWLCM) (enriching population exploration space), proposes an IRSA, constructs the IRSA-ENN model, and verifies the validity of the new model by predicting the wax deposition rate of two groups of waxy crude oil measured data. The research results have important guiding significance for the accurate prediction of the wax deposition rate of waxy crude oil pipeline.
2.1 Bellman Neural Network Model
ENN is a type of local regression network with a local memory unit and a local feedback connection. Different from BPNN, it adds a context layer based on the traditional three-layer network structure, so it has the characteristics of memory. Its structure is schematically shown in Fig. 3.
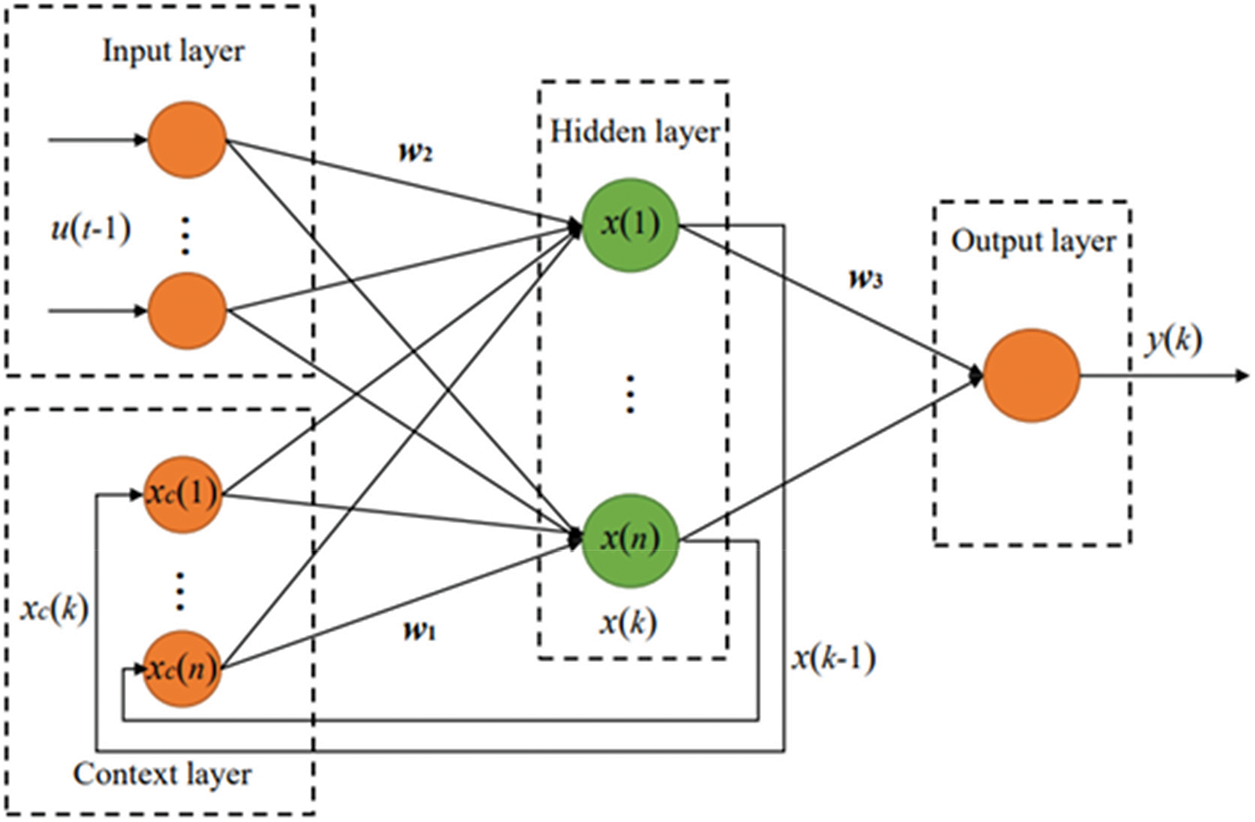
Figure 3: Elman neural network structure
The nonlinear state space expression of ENN is shown in Eq. (1).
where: k represents the time; y(k) is the output vector of the output node unit; x(k) is the output vector of the middle layer; ac(k) is the output of the context layer; u is the input layer unit vector; w1 represents the weight matrix of the context and hidden layers; w2 represents the weight matrix of the input and hidden layers; w3 represents the weight matrix of the output and hidden layers; P( ) is the transfer function of the output neuron; Q( ) is the transfer function of middle layer neurons, the sigma function is used in this paper [32], as shown in Eq. (2).
When ENN updates the weights and thresholds, it actually uses error back-propagation and the error square sum function to measure them, as shown in Eq. (3).
where: E(k) represents the sum of squares of errors; yd(k) is the actual output matrix of the neural network at the k-th time; y(k) is the network prediction output matrix at the k-th time; T is the transpose matrix.
2.2 Improved Reptile Search Algorithm
RSA, as a novel intelligent optimization algorithm, is superior to the traditional optimization algorithm in terms of high precision and fast computing speed. However, when applied to high-dimensional feature selection problems, RSA will be affected by population diversity. In order to overcome this shortcoming, PWLCM is utilized to enhance the population’s exploration ability in the search range, and an IRSA is proposed.
Specifically, IRSA is a coupling algorithm that takes advantage of PWLCM to enhance population diversity. In IRSA, PWLCM is used to enrich the ability of the RSA population to explore the spatial domain, thereby improving its ability to solve high-dimensional and complex nonlinear optimization problems.
2.2.1 Reptile Search Algorithm
RSA is a novel meta-heuristic algorithm proposed by Abualigah et al. It is a population-based and gradient-free algorithm established by studying the social behavior, prey encircling mechanism, and hunting mechanism of crocodiles in nature. The algorithm is mainly divided into three main stages: initialization, prey encircling, and hunting. In the calculation process, the prey encircling stage and the hunting stage can be alternated continuously, thus narrowing the search range and catching prey.
The detailed principle of RSA has been described in the literature, which will not be repeated in the article [29–31]. The RSA optimization process is divided into two phases: the exploration phase and the exploitation phase, which are described as follows:
1) Exploration phase [Encircling]
When reptiles encircle their prey, they have two walking modes (high walking and low creeping walking), as shown in Fig. 4, and the mathematical expression is shown in Eq. (4).
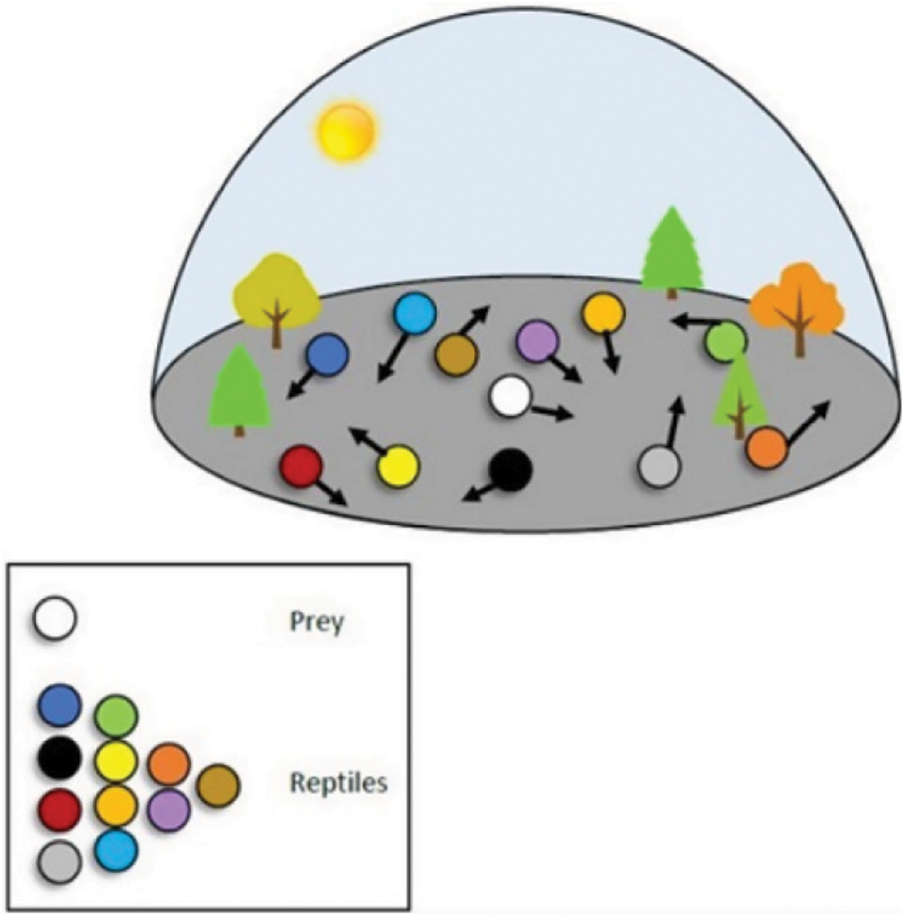
Figure 4: Reptiles encircling the prey [29]
where: Best(t) is the optimal solution obtained at the j position in this stage; C(i, j) is the hunting operator at the j position on the i result; β is the correction parameter, which controls the accuracy of the solution under the constraint condition of high walk in this stage; R(i, j) is a Reduce function, which is mainly used to narrow the search range; rand is a random number from 0 to 1; x(r1, j) is the random position of the i-Th solution; t is the current number of iteration steps; T is the maximum number of iteration steps; ES(t) is the evolutionary ratio, which is the probability ratio that decreases randomly between [−2, 2] in the iterative process.
2) Exploitation phase [Hunting]
In the hunting phase, reptiles have two social behaviors (coordination and cooperation), as shown in Fig. 5, and the mathematical expression is shown in Eq. (5).
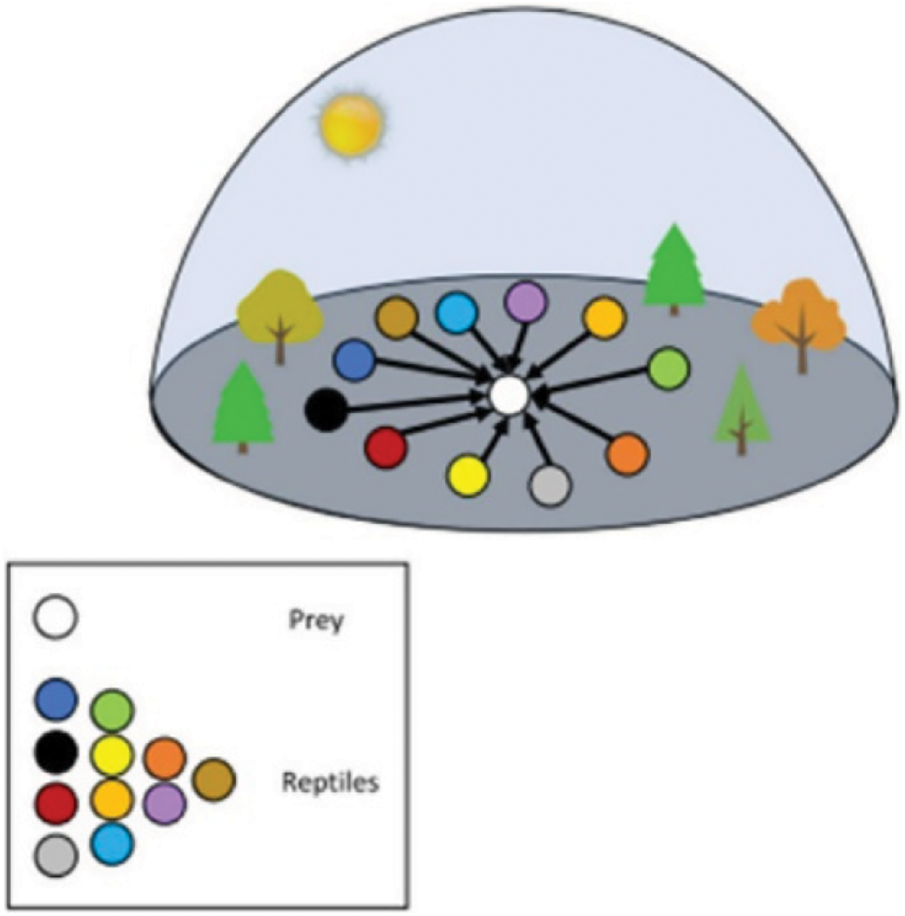
Figure 5: Reptiles attacking the prey [29]
where: Best(t) is the optimal solution obtained at the j position in this stage; C(i, j) is the hunting operator at the j position on the i result; P(i, j) is the percentage of the difference between the best solution at the j-th position and the current solution; rand is a random number from 0 to 1; δ is a small value.
2.2.2 Piecewise Linear Chaotic Map
Chaotic mapping is an effective method to deal with the problem of population diversity and low convergence speed in optimization algorithms. In this paper, PWLCM is used to initialize the population position, and then expand the search space, so as to improve the performance of RSA. As a typical representative of chaotic mapping, PWLCM has a simple mathematical form, ergodicity, and randomness. The mathematical expression is shown in Eq. (6).
where: p is a control parameter, which is used to determine the section range of the four-section formula so that there is no overlap between them, and the range is (0, 0.5). x(t) is the generated random iterative value in the range of [0,1].
2.2.3 Comparison before and after Algorithm Improvement
In this paper, the RSA original method and PWLCM are used to initialize the population, and the results of random initialization of the population sequence are compared to verify whether PWLCM can explore the population space more thoroughly [30,31]. To conveniently compare the results, the number of particles is set to 150, the maximum number of iterations is 50, and the value of p in PWLCM is 0.4.
Comparing Figs. 6 with 7, it can be seen that the random initialization strategy of the PWLCM effectively enhances the ergodicity of the population and avoids the large blank of the population in the search range.
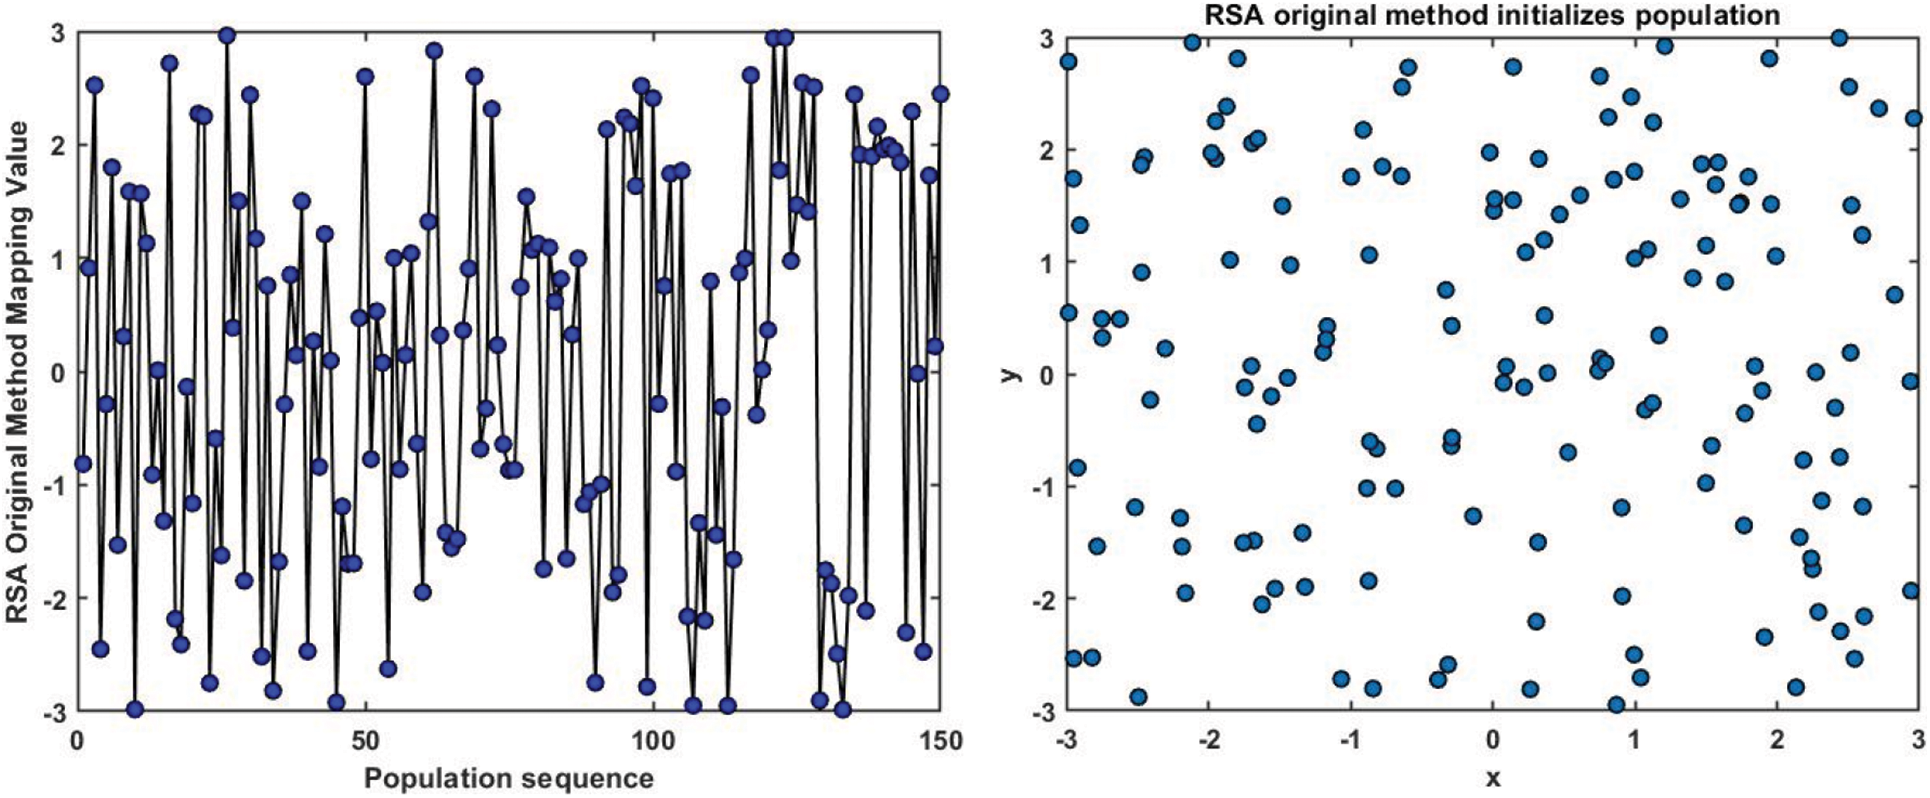
Figure 6: The RSA original method randomly initializes the population
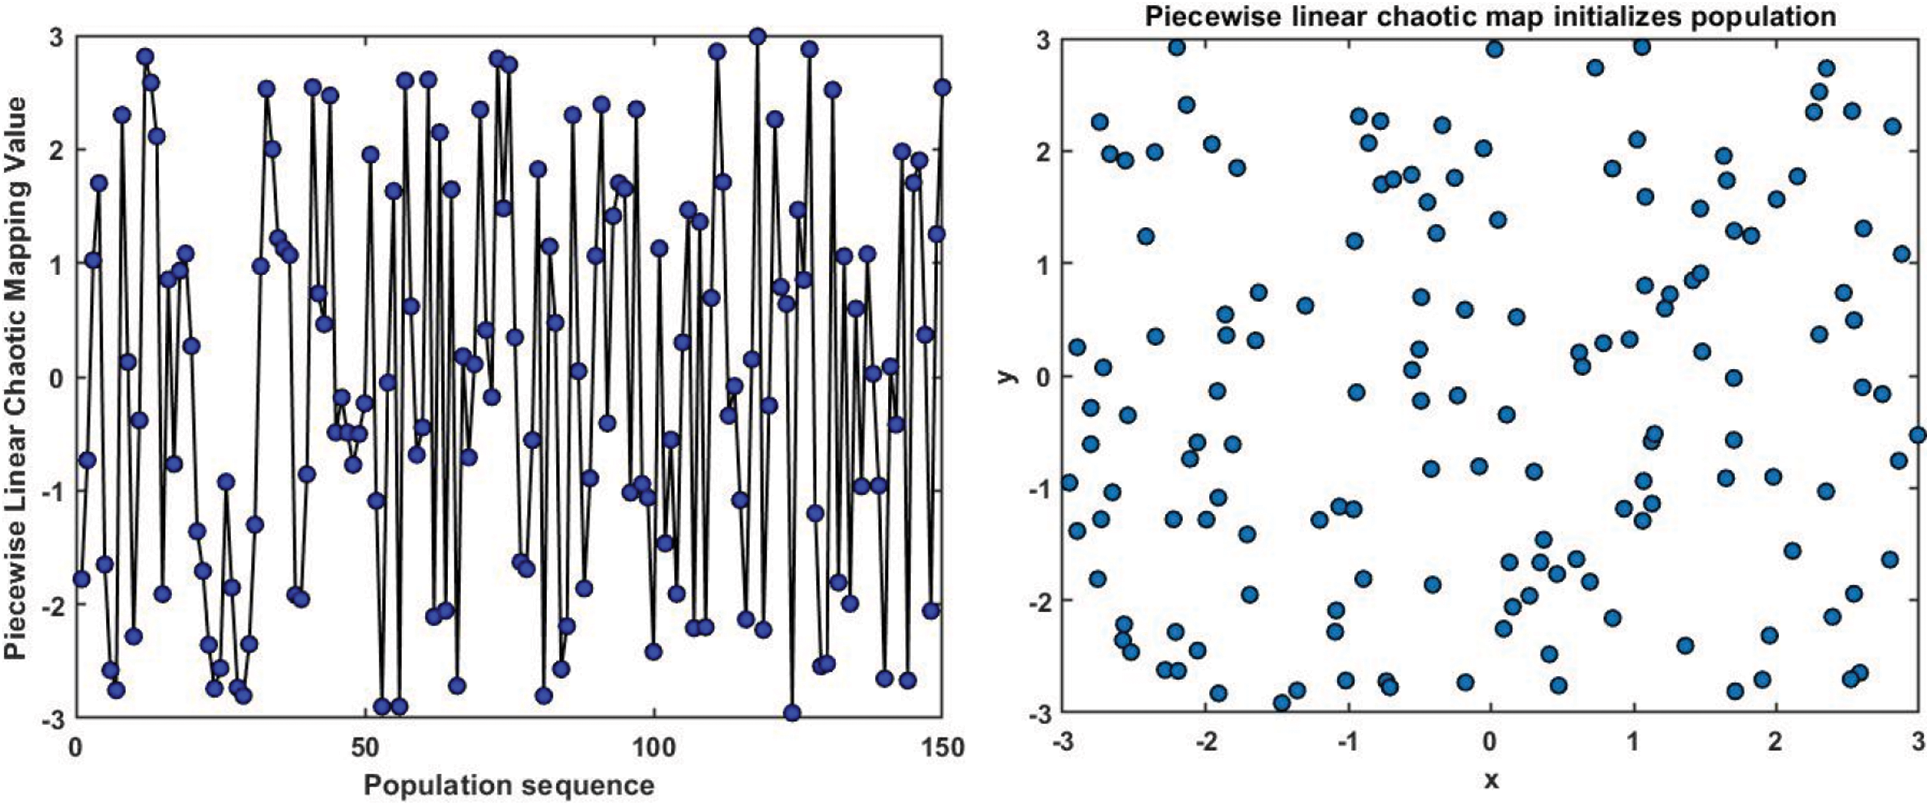
Figure 7: PWLCM randomly initializes the population
3 Wax Deposition Rate Prediction Model for Crude Oil Pipelines Based on IRSA-ENN Algorithm
3.1 Construction of IRSA-ENN Model
The construction process of the wax deposition rate prediction model for waxy crude oil pipelines based on the IRSA-ENN prediction model is shown in Fig. 8.
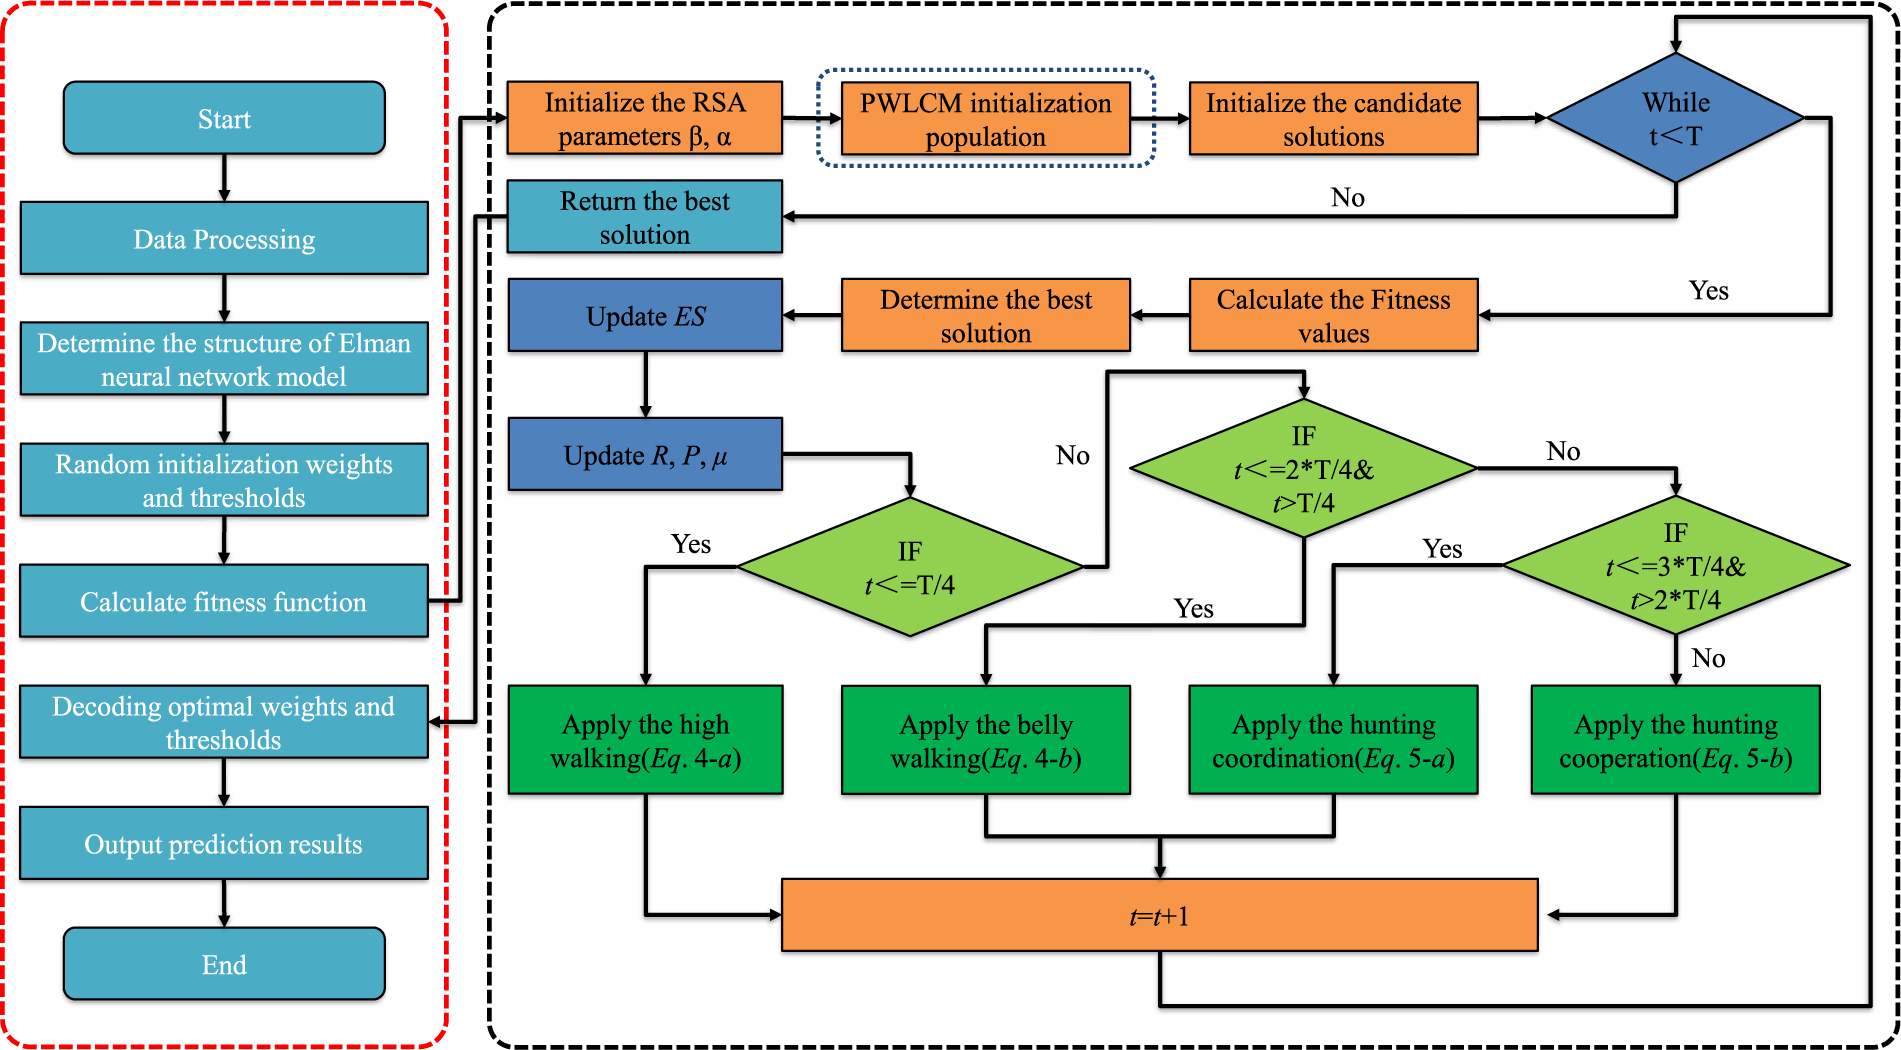
Figure 8: Wax deposition rate model for pipelines with waxy crude oil based on IRSA-ENN algorithm
The IRSA is applied to optimize the ENN model, thus constructing the IRSA-ENN prediction model. The model constructed by this method can overcome the problems of low prediction accuracy and insufficient generalization ability of the ENN model. The steps of establishing the model are as follows.
Step 1: The experimental data on wax deposition rates in crude oil pipelines have been normalized to initialize the ENN model and determine the number of input hidden and output layers. The IRSA is introduced to set the initial parameters (including population number, iteration times, problem dimension, etc.).
Step 2: PWLCM (Eq. (6)) is introduced to initialize the reptile population sequence and randomly distribute the reptile exploration space. The fitness function (MSE of training samples) is calculated (Eq. (7)) to measure the optimal solution in the overall optimization process.
where: dfi is the output value of the i-th sample model; dvi is the actual value of the i-th sample.
Step 3: According to the updated position of the reptile, the fitness function of the reptile at this position is obtained, and the position of the reptile is updated by Eqs. (4) and (5), that is to adjust the threshold and weight of ENN. Then, compared with the current position fitness value and the current optimal value. If the current position fitness value is better, it is updated, otherwise it is not updated.
Step 4: Generation of the optimal solution. When the iteration of the algorithm stops, the final optimal solution is the optimal solution of the whole training.
Step 5: The optimal solution (optimal weights and thresholds of the ENN) is assigned to the ENN model, and the improved ENN model is trained after matrix reconstruction and predicted from the experimental data of pipeline wax deposition rate.
Three evaluation parameters, RMSE, MAPE, and R2, are introduced to evaluate the prediction accuracy of the model [33]. The calculation Eqs. (8)–(10) of the three are as follows:
where: M represents the number of sample sets; yi is the actual value; f(xi) is the predicted value;
4 Proposed ENN Modelling and Analysis
4.1 Data Acquisition and Preprocessing
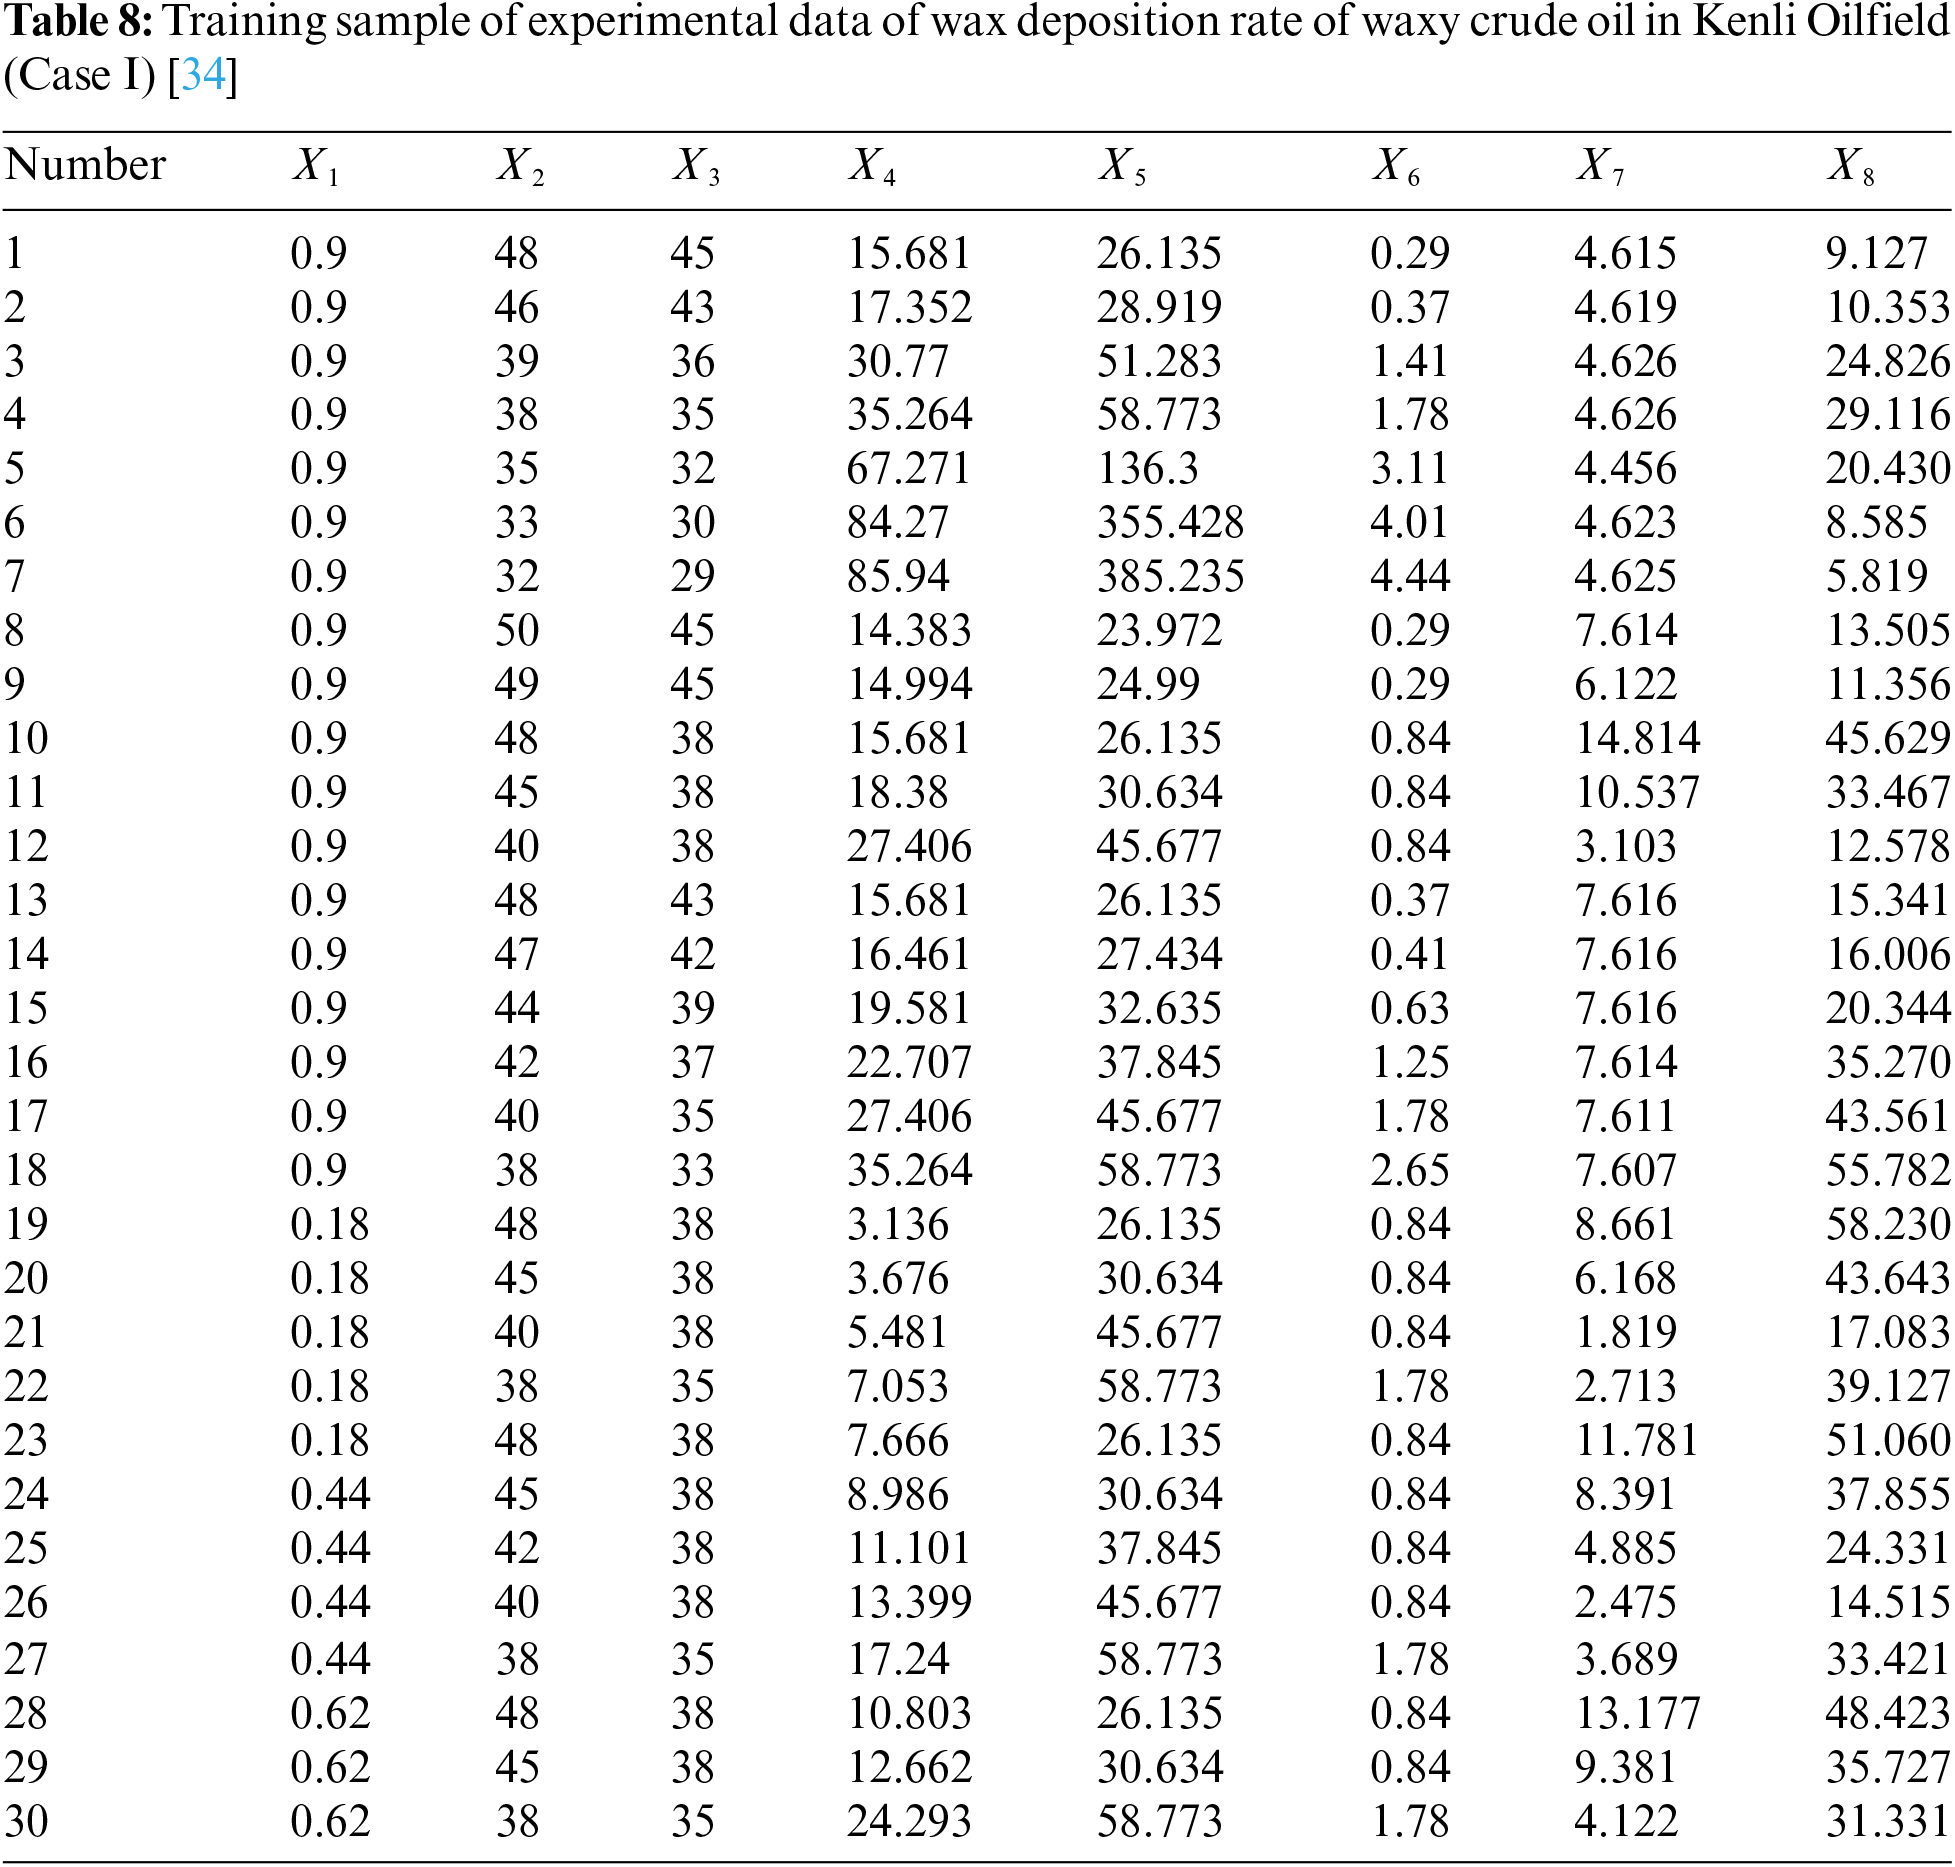
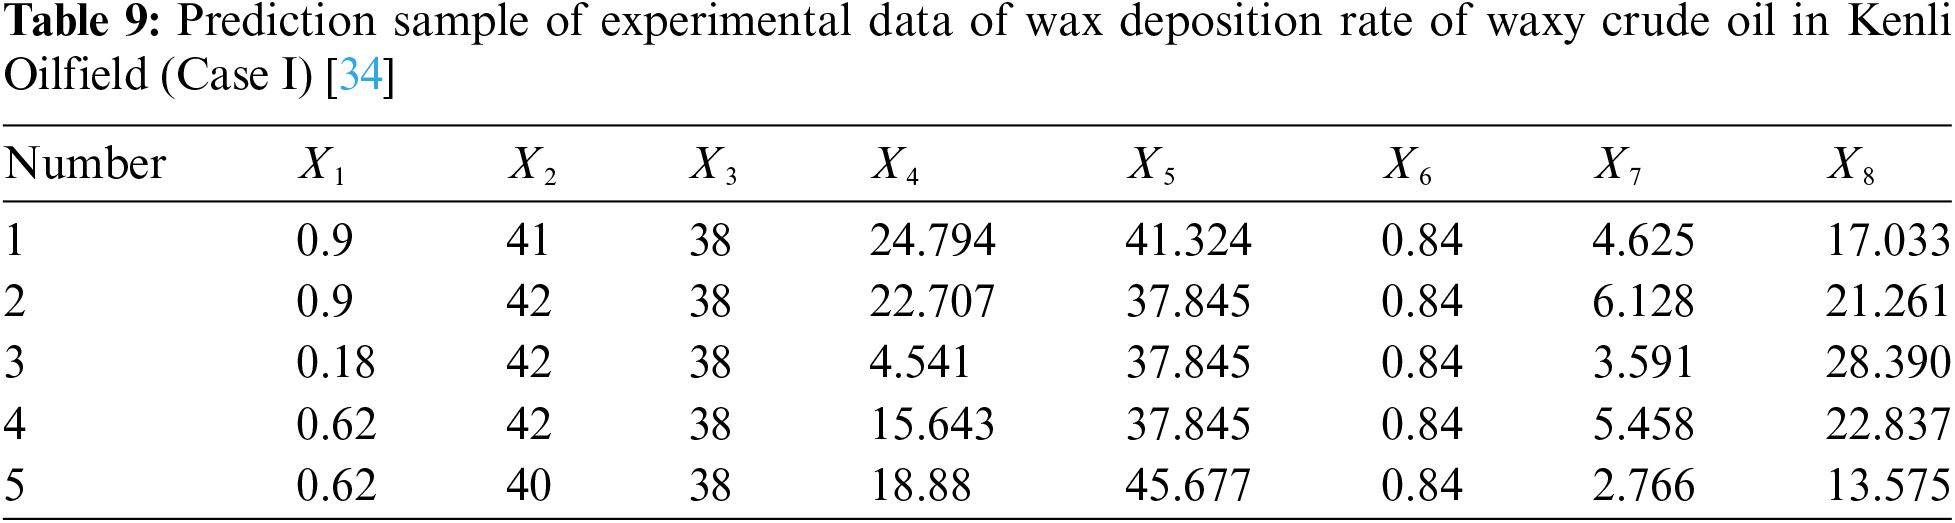
Two groups of measured wax deposition rate data of crude oil pipelines with different physical properties given in the article [34,35] are taken as cases (corresponding to Case I and Case Ⅱ respectively) to verify the generalization performance of the improved new model (learning ability for different groups of measured data), and to compare and analyze the prediction accuracy of the IRSA-ENN model and other models. The measured data of wax deposition rate in crude oil pipelines are 35 groups and 38 groups, respectively, among which 5 groups of data are randomly selected as prediction samples (the rest are used as their own training samples) to compare and analyze the prediction accuracy of each model. The measured data of wax deposition rate in two groups of different waxy crude oil pipelines are shown in Appendix A.
When learning training samples, because of the different dimensions among variables, we need to use the map min-max function to normalize the data, that is, map the data of each variable to the range of [0,1], The mathematical expression is shown in Eq. (11).
where: yi represents the processed sample data; xi represents preprocessing data.
4.2 Result Analysis and Model Evaluation
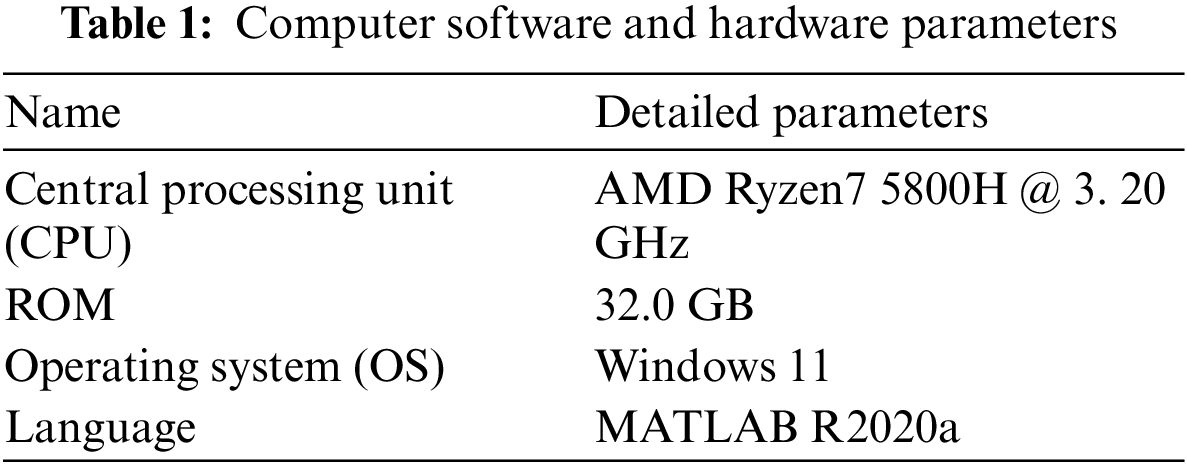
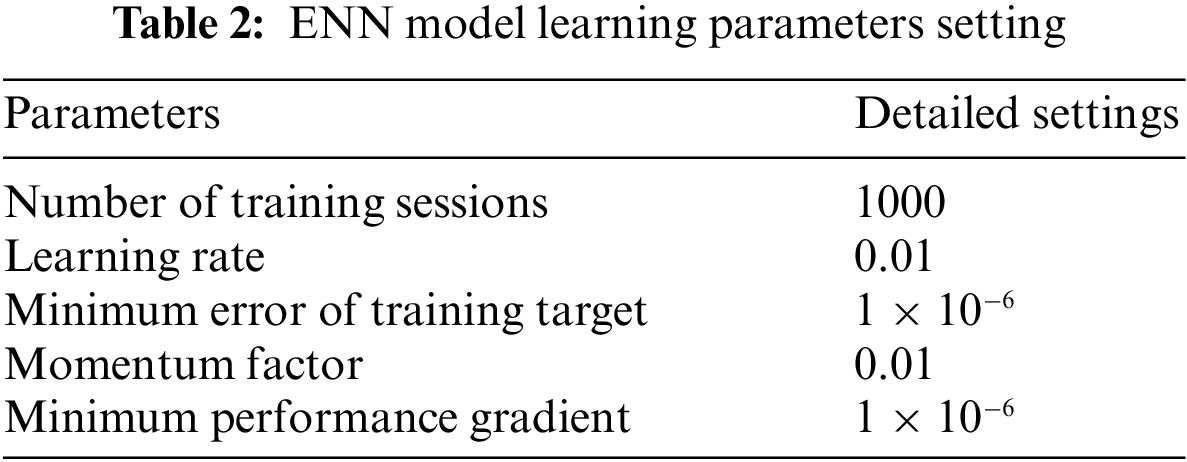
MATLAB software is used to realize the simulation process, and the parameters of the computer are shown in Table 1. The ENN model determines the optimal number of hidden layer nodes by minimizing the MSE of the training samples as a measure of the machine learning on the training samples of Case 1 and Case 2. The learning parameters of the ENN model are shown in Table 2. When the ENN model determines the optimized number of hidden layer nodes H for the wax deposition rate data of the pipelines in Case 1 and Case 2, the formula is Eq. (12).
where: The value of H varies with the value of a.
The MSE results of training samples solved by different hidden layer nodes in Case I and Case II are shown in Tables 3 and 4.
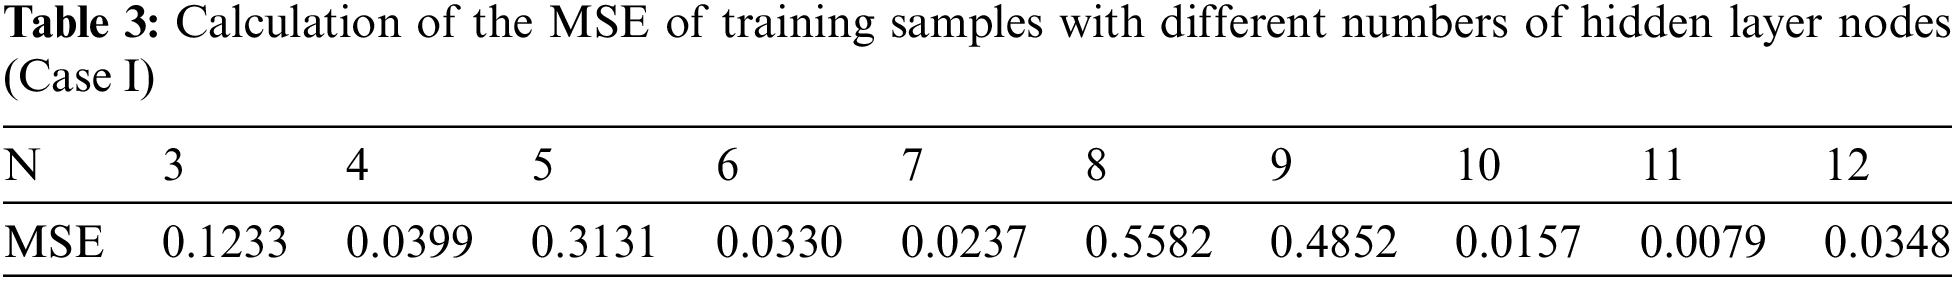
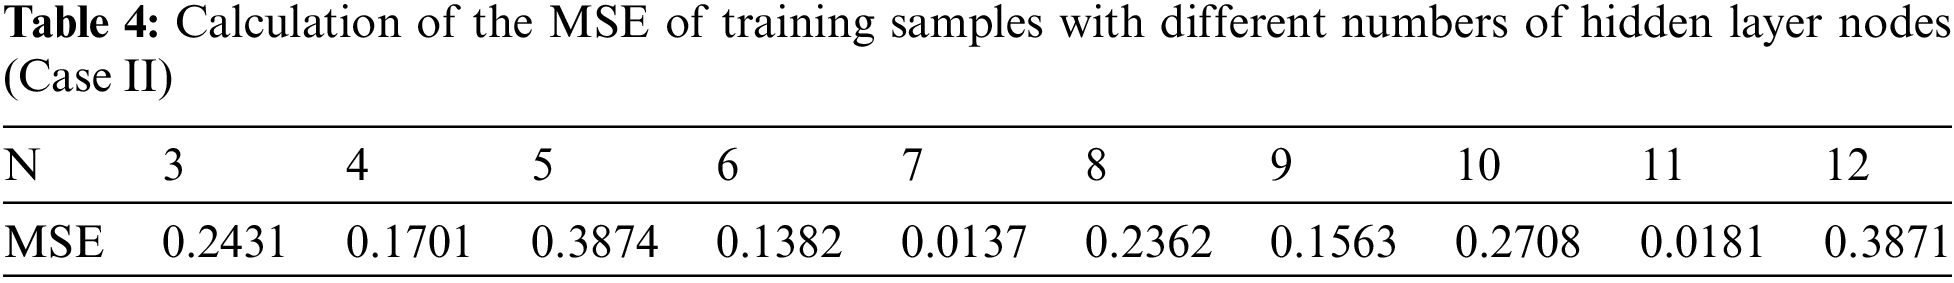
As shown in Table 3, when the number of hidden layer nodes is 11, the MSE of the training samples is minimized (Case 1), so Case 1 is determined to construct a 7-11-1 three-layer ENN model. Similarly, as shown in Table 4, when the number of hidden layer nodes is 7, the MSE of the training samples is minimized (Case 2), so Case 2 is determined to construct the 7-7-1 three-layer ENN model.
To validate the prediction accuracy of the IRSA-ENN, Huang Qiyu wax deposition prediction (HUANG), ENN, Whale optimization algorithm-ENN (WOA-ENN), and RSA-ENN models are established and compared [36,37]. For easy comparison and analysis of the forecast results, fixed random seeds are used to ensure the consistency of each running result of each model, the iterative optimization times of each model are set to 150 times and the population size is 50. The initialization constants of the WOA-ENN model are a = [0,2], b = 1, l = [−1,1]. The initialization constants of RSA-ENN and IRSA-ENN are α = 0.1 and β = 0.005. The results of the predictions of various models for the two wax deposition rate Cases are shown in Tables 5–7, Figs. 9 and 10, along with the relative error results.
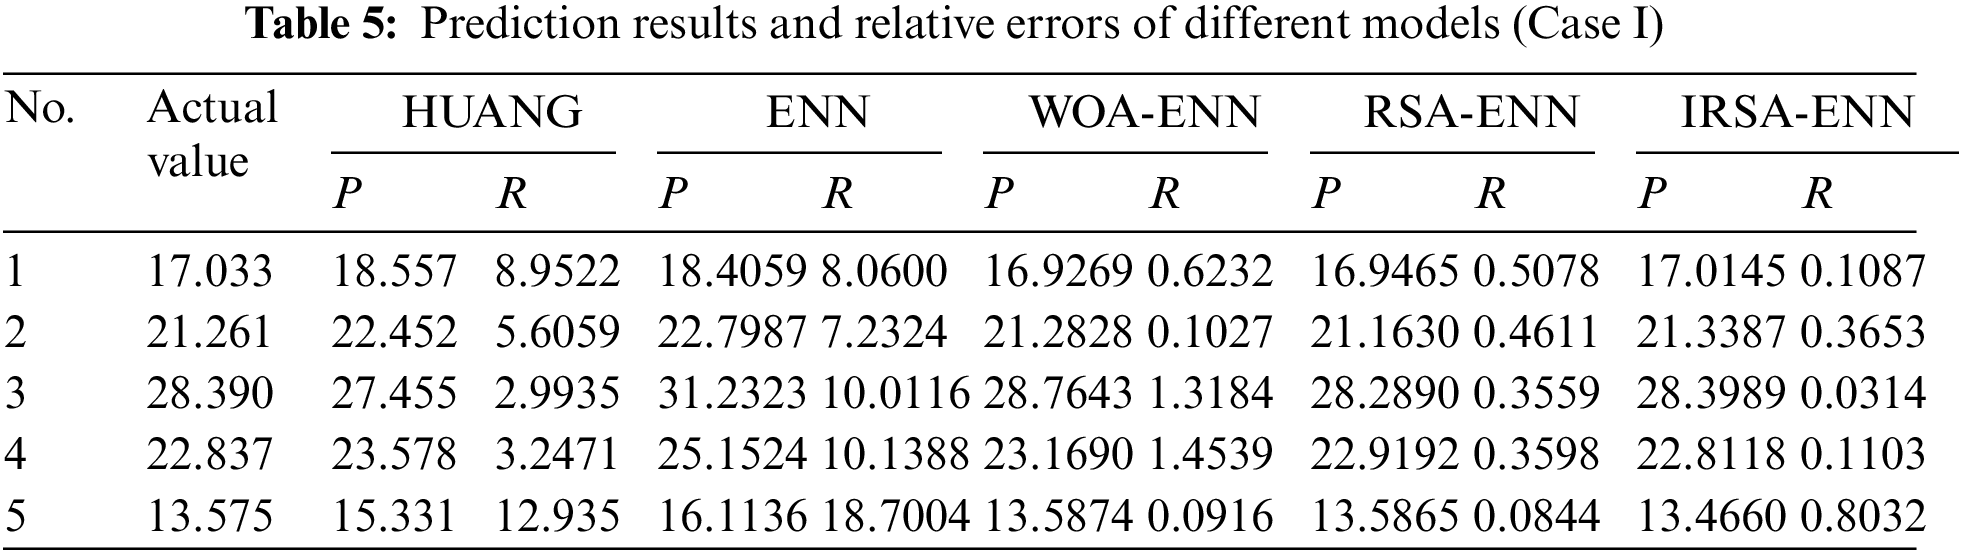
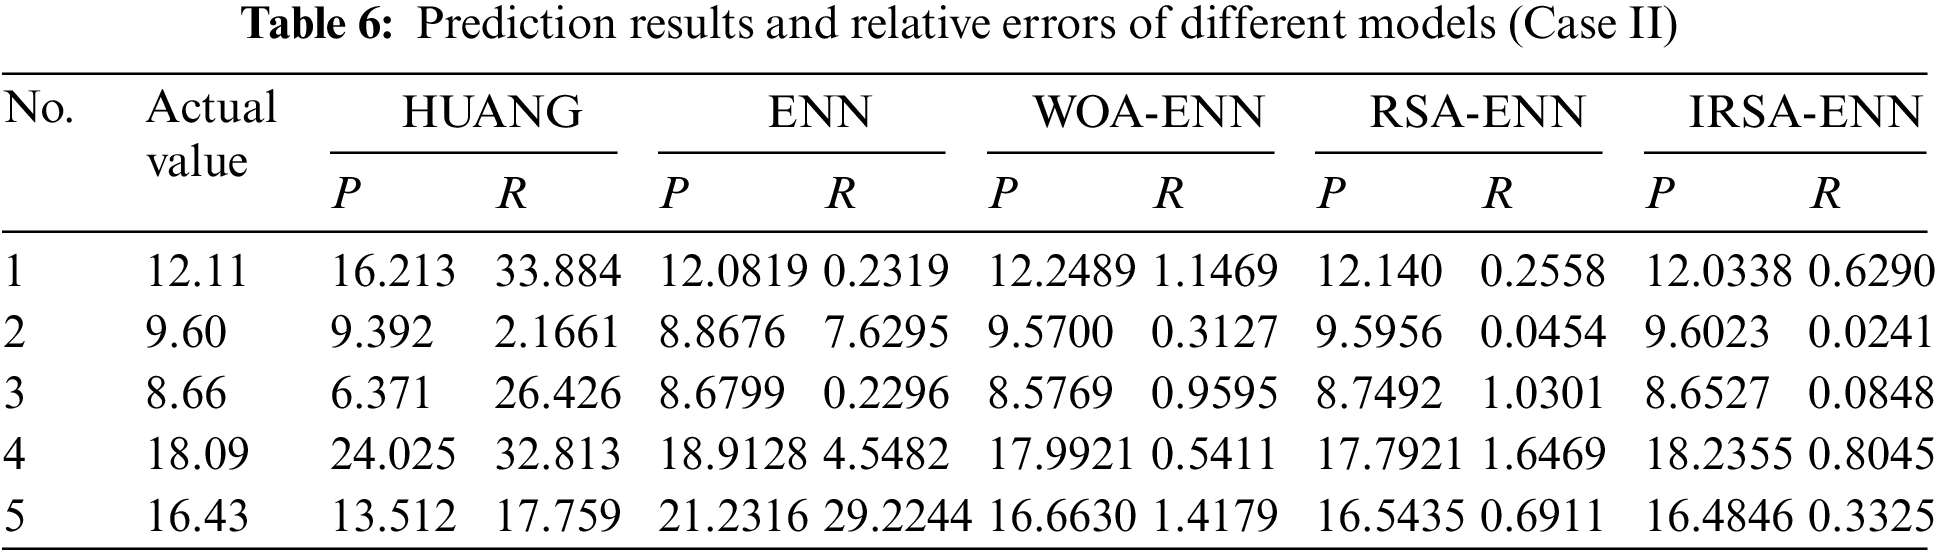
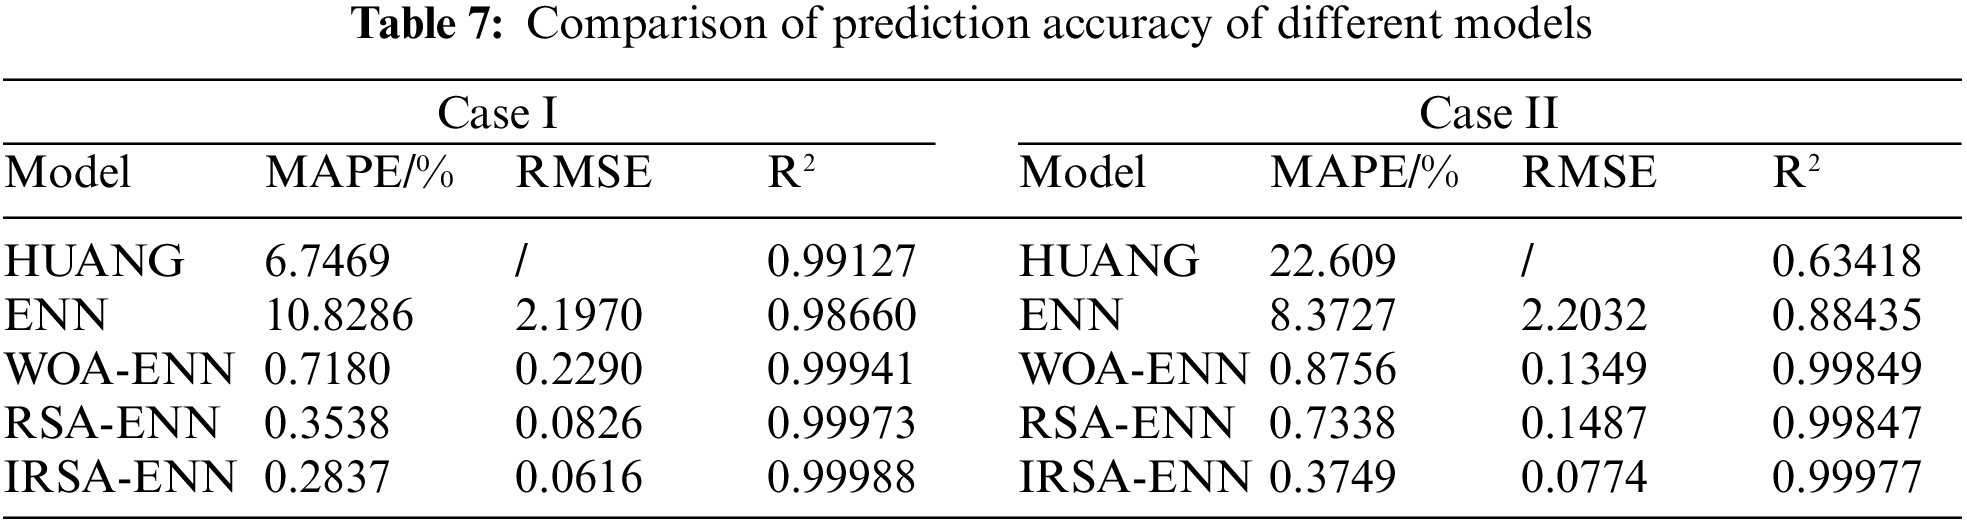
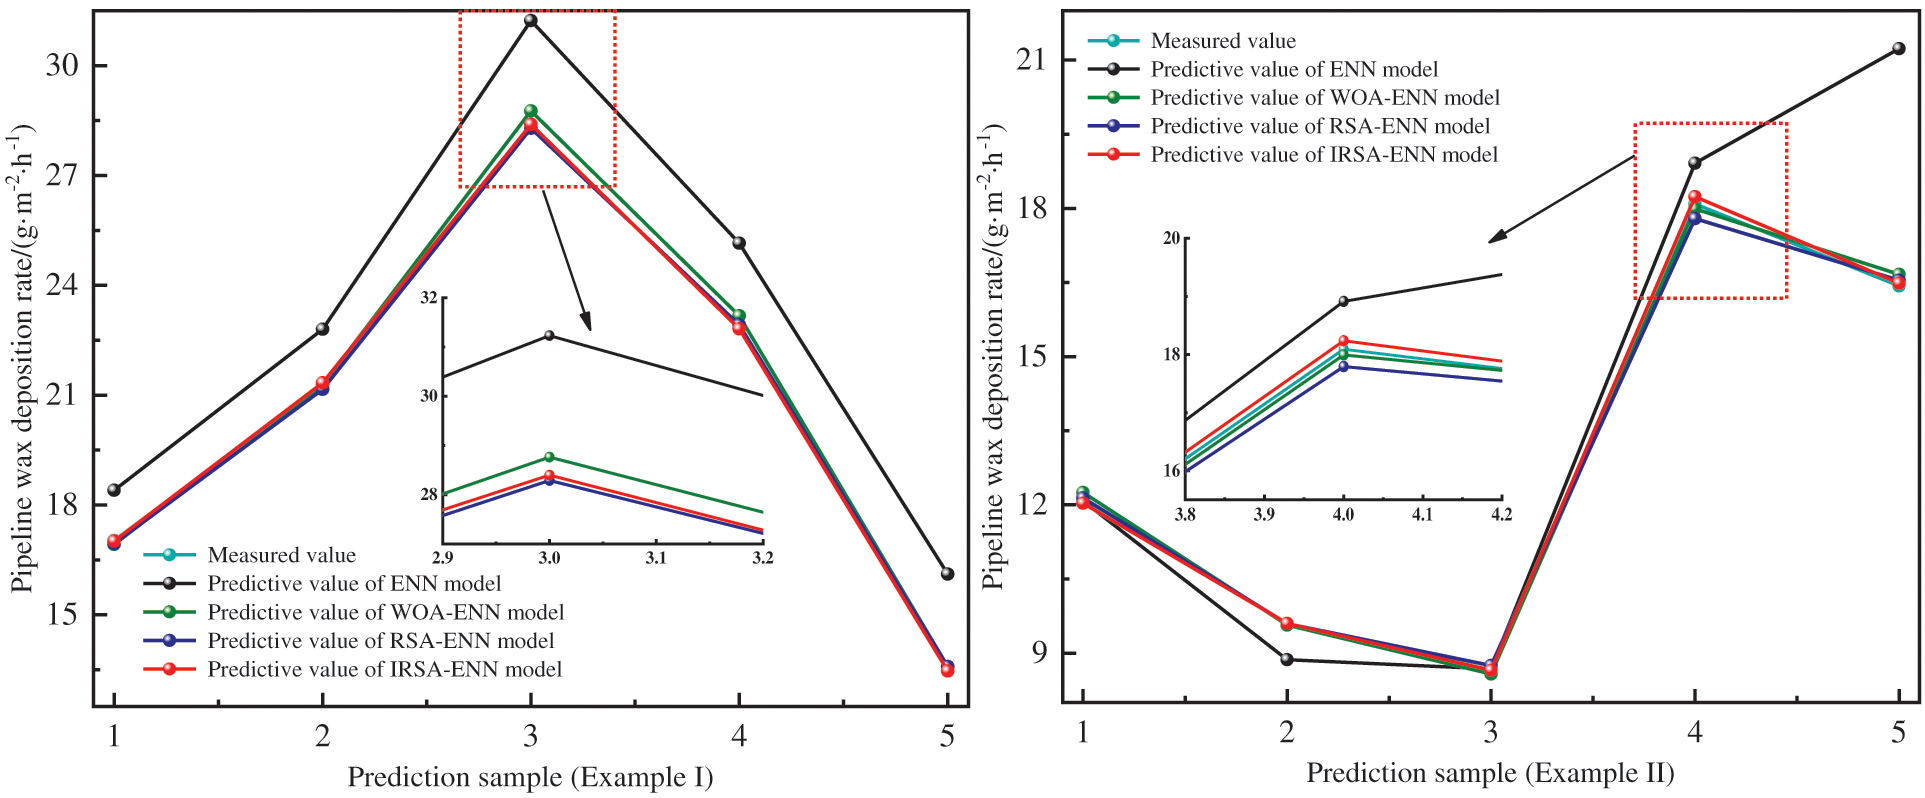
Figure 9: Comparison of prediction results of different models
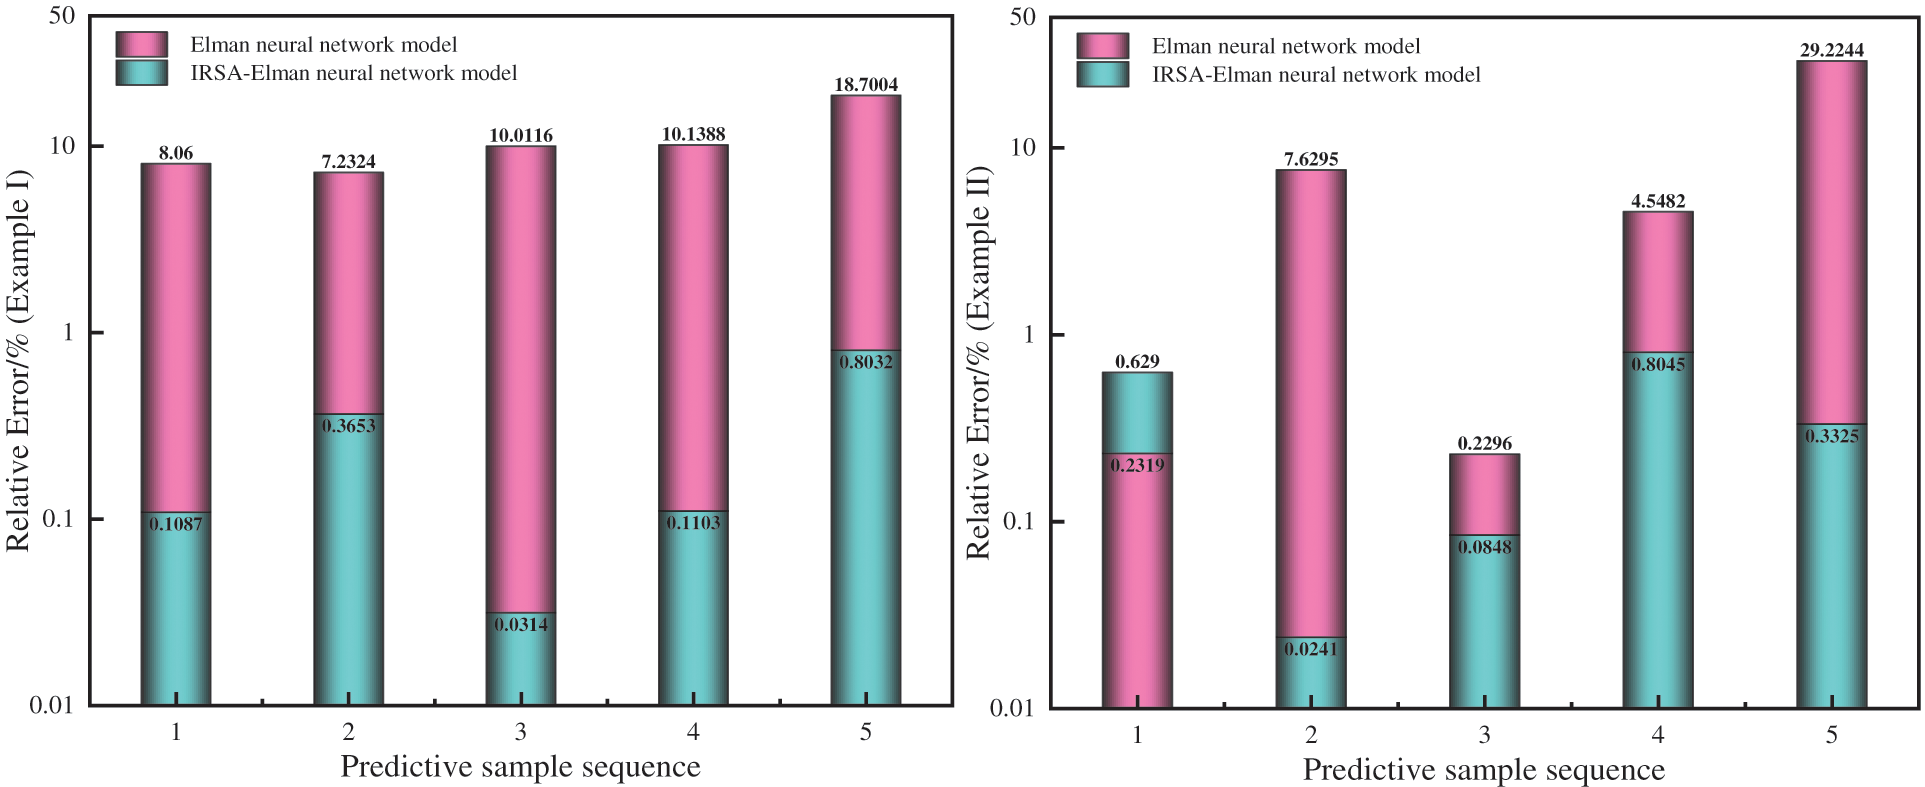
Figure 10: Comparison of prediction errors between IRSA-ENN and ENN models
It can be seen from Tables 5–7, Figs. 9 and 10 that the IRSA-ENN model has higher prediction accuracy than the HUANG, RSA-ENN, WOA-ENN, and ENN models, and its correlation coefficient R2 is closer to 1, and its MAPE is only 0.2837% and 0.3749%, respectively, which is smaller than other models. In addition, the prediction accuracy of WOA-ENN and RSA-ENN models for two groups of waxy crude oil wax deposition rate is obviously higher than that of the ENN model, which further proves the effectiveness of using an optimization algorithm to improve the ENN model. Generally speaking, the IRSA-ENN model has ideal results for predicting wax deposition rate data of different groups of crude oil. The model is suitable for describing wax deposition in waxy crude oil pipelines in the petroleum industry and has a certain guiding significance for guiding the pigging of crude oil pipelines.
According to the prediction results of wax deposition in two groups of crude oil pipelines by the ENN model, the prediction accuracy is poor. This is due to the fact that the Elman trains function of the ENN model uses the BP training function to modify the weights, which leads to the defect that the gradient descent method easily falls into local minima when solving the partial derivative of E(k) to the weights. When the ENN is used to create the prediction model, the initial weights and thresholds are usually initialized by pseudo-random numbers, which leads to the poor stability of the trained prediction model, and then leads to the lack of generalization ability (the adaptability of training and learning to new samples).
The improved ENN model can be globally optimized for the randomly initialized weights and thresholds, which is beneficial to: (1) overcoming as much as possible the defects of slow convergence speed and easily falls into local minima when the ENN model is adjusted by the gradient descent method in the training process due to improper initial weights and thresholds; (2) it avoids the defect that when using the random method to assign weights and thresholds, it is easy to lead to a well-trained model, and it is difficult to obtain accurate prediction results when predicting other samples, and improving the generalization ability of ENN model.
In addition, according to the results of IRSA-ENN and RSA-ENN for waxy crude oil pipeline wax deposition prediction, the MAPE and RMSE of RSA-ENN for Case I are 0.3538% and 0.0826%, respectively, and the MAPE and RMSE for Case II are 0.7338% and 0.1487%, respectively. The MAPE and RMSE of the IRSA-ENN model for Case I are 0.2837% and 0.0616%, respectively, and the MAPE and RMSE for Case II are 0.3749% and 0.0774%, respectively. Compared with the RSA-ENN model, the IRSA-ENN model has higher prediction accuracy and has more obvious advantages in the wax deposition rate of crude oil pipelines. This also proves the effectiveness of using PWLCM to improve the RSA. The reason is that the PWLCM can initialize the population sequence more randomly, and then expand the search space of the population, which overcomes the defect of insufficient global search ability of RSA in the initial stage of iterative optimization to a certain extent.
Aiming at the problem of wax deposition rate prediction of crude oil pipelines, a new method based on the IRSA-ENN model for wax deposition rate prediction is proposed in this paper. The new model is trained and verified by using two sets of measured data of the wax deposition rate of crude oil pipelines with different physical properties, and the following conclusions are obtained.
1) Aiming at the deficiency of the ENN model (generalization ability is not strong, easy to fall into local minimum value), an IRSA-ENN model is proposed, and the wax deposition rate of the crude oil pipeline is predicted by two Cases. The results show that the MAPE of the IRSA-ENN prediction model is only 0.2837% and 0.3749%, respectively, which has good prediction accuracy.
2) Using PWLCM, the RSA is improved. By comparing RSA-ENN and IRSA-ENN models for two groups of wax deposition rate prediction data of crude oil pipelines, it can be seen that the IRSA has better optimization performance.
3) Compared with the ENN model, WOA-ENN model, and RSA-ENN model, the prediction accuracy of the IRSA-ENN model has obvious advantages. It effectively solves the shortcomings of the ENN model, such as insufficient generalization ability, and easily falls into minimum value. This method provides a new way for accurate prediction of wax deposition rate, can effectively meet the demand of wax deposition rate prediction in crude oil pipelines under actual working conditions, and provides a new decision-making basis method for pigging cycle formulation and safety management of waxy crude oil pipeline.
Acknowledgement: None.
Funding Statement: None.
Author Contributions: The authors confirm contribution to the paper as follows: study conception and design: Zhuo Chen, Wenbo Jin; data collection: Zhuo Chen, Dui Li; analysis and interpretation of results: Zhuo Chen, Wenbo Jin, Ningning Wang, Dui Li; draft manuscript preparation: Zhuo Chen. All authors reviewed the results and approved the final version of the manuscript.
Availability of Data and Materials: Data supporting this study are included within the article.
Conflicts of Interest: The authors declare that they have no conflicts of interest to report regarding the present study.
References
1. Quan, Q., Gong, J., Wang, W., Gao, G. (2015). Study on the aging and critical carbon number of wax deposition with temperature for crude oils. Journal of Petroleum Science and Engineering, 130, 1–5. https://doi.org/10.1016/j.petrol.2015.03.026 [Google Scholar] [CrossRef]
2. Ballo, M. L., Liu, G. (2022). Review of wax sedimentations prediction models for crude-oil transportation pipelines. Petroleum Research, 7(2), 220–235. https://doi.org/10.1016/j.ptlrs.2021.09.005 [Google Scholar] [CrossRef]
3. Asger, B. H., Elfinn, L., Walther, B. P., Anne, B. N., Hans, P. R. (1991). Wax precipitation from North Sea crude oils. 3. Precipitation and dissolution of wax studied by differential scanning calorimetry. American Chemical Society, 5(6), 914–932. https://doi.org/10.1021/ef00030a021 [Google Scholar] [CrossRef]
4. Burger, E., Perkins, T., Striegler, J. (1981). Studies of wax deposition in the trans Alaska pipeline. Journal of Petroleum Technology, 33(6), 1075–1086. https://doi.org/10.2118/8788-PA [Google Scholar] [CrossRef]
5. Brown, T. S., Niesen, V. G., Erickson, D. D. (1993). Measurement and prediction of the kinetics of paraffin deposition. SPE Annual Technical Conference and Exhibition, SPE-26548. Huston, USA. https://doi.org/10.2118/26548-MS [Google Scholar] [CrossRef]
6. Piroozian, A., Hemmati, M., Safari, M., Rahimi, A., Rahmani, O. et al. (2021). A mechanistic understanding of the water-in-heavy oil emulsion viscosity variation: Effect of asphaltene and wax migration. Colloids and Surfaces A: Physicochemical and Engineering Aspects, 608, 125604. https://doi.org/10.1016/J.COLSURFA.2020.125604 [Google Scholar] [CrossRef]
7. Ashoori, S., Sharifi, M., Masoumi, M., Salehi, M. M. (2017). The relationship between SARA fractions and crude oil stability. Egyptian Journal of Petroleum, 26, 209–213. https://doi.org/10.1016/j.ejpe.2016.04.002 [Google Scholar] [CrossRef]
8. Arjun, J., Lu, Y. D., Sriram, R., Sarica, C., Daraboina, N. (2019). Influence of operating temperatures on long-duration wax deposition in flow lines. Journal of Petroleum Science and Engineering, 184, 106373. https://doi.org/10.1016/j.petrol.2019.106373 [Google Scholar] [CrossRef]
9. Shaik, N. B., Pedapati, S. R., Taqvi, S. A., Othman, A. R., Dzubir, F. A. (2020). A feed-forward back propagation neural network approach to predict the life condition of crude oil pipeline. Processes, 8(6), 661. https://doi.org/10.3390/pr8060661 [Google Scholar] [CrossRef]
10. Shaik, N. B., Pedapati, S. R., Othman, A. R., Bingi, K., Dzubir, F. A. (2021). An intelligent model to predict the life condition of crude oil pipelines using artificial neural networks. Neural Computing and Applications, 33, 14771–14792. https://doi.org/10.1007/s00521-021-06116-1 [Google Scholar] [CrossRef]
11. Wang, Z. H., Liu, Y., Li, J. X., Zhuge, X. L., Zhang, L. (2016). Study on two-phase oil-water gelling deposition behavior in low-temperature transportation. Energy & Fuels, 30, 4570–4582. https://doi.org/10.1021/acs.energyfuels.6b00294 [Google Scholar] [CrossRef]
12. Zhao, J., Xi, X., Dong, H., Wang, Z., Zhuo, Z. (2022). Rheo-microscopy in situ synchronous measurement of shearing thinning behaviors of waxy crude oil. Fuel, 323, 124427. https://doi.org/10.2139/ssrn.3998963 [Google Scholar] [CrossRef]
13. Chen, Z., Tian, Y. Y., Zhuang, Q. (2023). Effect of gas flow rate on separation efficiency at different scaling scales of cyclone separators. Frontiers in Heat and Mass Transfer, 20, 1–11. https://doi.org/10.5098/hmt.20.26 [Google Scholar] [CrossRef]
14. Ochieng, F. O., Kinyanjui, M. N., Abonyo, J. O., Kiogora, P. R. (2022). Mathematical modeling of wax deposition in field-scale crude oil pipeline systems. Journal of Mathematical Analysis and Applications, 2845221, 1–13. https://doi.org/10.1155/2022/2845221 [Google Scholar] [CrossRef]
15. Zheng, S., Saidoun, M., Palermo, T., Mateen, K., Fogler, H. S. (2017). Wax deposition modeling with considerations of non-Newtonian characteristics: Application on field-scale pipeline. Energy & Fuels, 31, 5011–5023. https://doi.org/10.1021/ACS.ENERGYFUELS.7B00504 [Google Scholar] [CrossRef]
16. Zhou, Y., Gong, J., Wang, P. (2016). Modeling of wax deposition for water-in-oil dispersed flow. Asia-Pacific Journal of Chemical Engineering, 11, 108–117. https://doi.org/10.1002/APJ.1948 [Google Scholar] [CrossRef]
17. Couto, G., Chen, H., Dellecase, E., Sarica, C., Volk, M. (2008). An investigation of two-phase oil/water paraffin deposition. SPE Production & Operations, 23(1), 49–55. https://doi.org/10.4043/17963-MS [Google Scholar] [CrossRef]
18. Faysal, A., Adhreena, M., Vorathin, E., Hafizi, Z. M., Ngui, W. K. (2021). Leak diagnosis of pipeline based on empirical mode decomposition and support vector machine. IOP Conference Series: Materials Science and Engineering, 1078, 012023. https://doi.org/10.1088/1757-899X/1078/1/012023 [Google Scholar] [CrossRef]
19. Shaik, N. B., Pedapati, S. R., Abd Dzubir, F. A. (2020). Remaining useful life prediction of crude oil pipeline by means of deterioration curves. Process Safety Progress, 39. https://doi.org/10.1002/prs.12112 [Google Scholar] [CrossRef]
20. Zhou, S. D., Wu, M., Wang, J. (2004). Wax deposition rate model for crude oil pipeline based on neural network. Journal of Xi’an Shiyou University (Natural Science Edition), 19(1), 38–40. https://doi.org/10.3969/j.issn.1673-064X.2004.01.009 [Google Scholar] [CrossRef]
21. Coto, B., Martos, C., Espada, J. J., Robustillo, M. D., Merino-García, D. et al. (2011). A new DSC-based method to determine the wax porosity of mixtures precipitated from crude oils. Energy Fuels, 25, 1707–1713. https://doi.org/10.1021/ef200206h [Google Scholar] [CrossRef]
22. Tian, Z., Jin, W. B., Zhou, L., An, Y. P., Wu, H. F. (2014). Prediction of wax deposition rate in pipeline by BP neural network. Journal of Xi’an Shiyou University (Natural Science Edition), 29(1), 66–70. https://doi.org/10.3969/j.issn.1673-064X.2014.01.013 [Google Scholar] [CrossRef]
23. Wang, L., Tian, Z., Pu, H. T., Jin, W. B., Dong, L. (2015). Study of wax deposition rate prediction model based on support vector machines. Applied Chemical Industry, 73–77. [Google Scholar]
24. Xie, Y., Xing, Y. (2017). A prediction method for the wax deposition rate based on a radial basis function neural network. Petroleum, 3(2), 237–241. https://doi.org/10.1016/j.petlm.2016.08.003 [Google Scholar] [CrossRef]
25. Lashkarbolooki, M., Seyfaee, A., Esmaeilzadeh, F., Mowla, D. (2010). Experimental investigation of wax deposition in Kermanshah crude oil through a monitored flow loop apparatus. Energy & Fuels, 24, 1234–1241. https://doi.org/10.1021/EF9010687 [Google Scholar] [CrossRef]
26. Behnam, A. R., Reza, Z., Abdolhossein, H. S. (2023). Modeling wax deposition of crude oils using cascade forward and generalized regression neural networks: Application to crude oil production. Geoenergy Science and Engineering, 224, 211613. https://doi.org/10.1016/j.geoen.2023.211613 [Google Scholar] [CrossRef]
27. Elman, J. L. (1990). Finding structure in time. Cognitive Science, 14, 179–211. https://doi.org/10.1207/s15516709cog1402-1 [Google Scholar] [CrossRef]
28. Li, X. Y., Zhang, L., Wang, Z. P., Dong, P. (2019). Remaining useful life prediction for lithium-ion batteries based on a hybrid model combining the long short-term memory and Elman neural networks. Journal of Energy Storage, 21, 510–518. https://doi.org/10.1016/j.est.2018.12.011 [Google Scholar] [CrossRef]
29. Abualigah, L., Abd, E. M., Sumari, P., Geem, Z. W., Gandomi, A. H. (2021). Reptile search algorithm (RSAA nature-inspired meta-heuristic optimizer. Expert Systems with Applications, 191, 116158. https://doi.org/10.1016/j.eswa.2021.116158 [Google Scholar] [CrossRef]
30. Almotairi, K. H., Abualigah, L. (2022). Hybrid reptile search algorithm and remora optimization algorithm for optimization tasks and data clustering. Symmetry, 14, 458. https://doi.org/10.3390/sym14030458 [Google Scholar] [CrossRef]
31. Elgamal, Z. M., Sabri, A. Q., Tubishat, M., Tbaishat, D., Makhadmeh, S. N. et al. (2022). Improved reptile search optimization algorithm using chaotic map and simulated annealing for feature selection in medical field. IEEE Access, 10, 51428–51446. https://doi.org/10.1109/ACCESS.2022.3174854 [Google Scholar] [CrossRef]
32. Shaik, N. B., Benjapolakul, W., Pedapati, S. R., Bingi, K., Thien Le, N. et al. (2022). Recurrent neural network-based model for estimating the life condition of a dry gas pipeline. Process Safety and Environmental Protection, 164, 639–650. https://doi.org/10.1016/j.psep.2022.06.047 [Google Scholar] [CrossRef]
33. Shaik, N. B., Inayat, M., Benjapolakul, W., Bakthavatchalam, B., Barewar, S. D. et al. (2022). Artificial neural network modeling for thermophysical behavior of mxene ionanofluids for hybrid solar photovoltaic and thermal systems applications. SSRN Electronic Journal, 4034718. https://doi.org/10.2139/ssrn.4034718 [Google Scholar] [CrossRef]
34. Yang, H. M. (2015). Study on wax deposition law and paraffin inhibitor in Kenli crude oil pipeline. Sichuan: Southwest Petroleum University (In Chinese). [Google Scholar]
35. Wang, X. L. (2010). Prediction and analysis of wax deposition in pipeline crude oil in Huachi operation area. Shaanxi: Xi’an Shiyou University (In Chinese). https://doi.org/10.7666/d.y1854507 [Google Scholar] [CrossRef]
36. Seyedali, M., Lewis, A. (2016). The whale optimization algorithm. Advances in Engineering Software, 95, 51–67. https://doi.org/10.1016/j.advengsoft.2016.01.008 [Google Scholar] [CrossRef]
37. Fadi, A., Mohammed, Z. (2020). Wax deposition and prediction in petroleum pipelines. Journal of Petroleum Science and Engineering, 184, 106385. https://doi.org/10.1016/j.petrol.2019.106385 [Google Scholar] [CrossRef]
Innovation
1. Aiming at correcting the defects of the traditional ENN, such as the tendency to fall into the local minimum value and weak generalization ability, an IRSA is proposed to improve the prediction model of ENN, which can optimize the weights and thresholds initialized by the traditional ENN, so the prediction accuracy of the model can be greatly improved.
2. The RSA cannot achieve a good balance between global search and local search, and it will fall into the local optimal solution. PWLCM is introduced to initialize the population and expand the search space of the population. A novel IRSA is proposed.
Cite This Article
 Copyright © 2024 The Author(s). Published by Tech Science Press.
This work is licensed under a Creative Commons Attribution 4.0 International License , which permits unrestricted use, distribution, and reproduction in any medium, provided the original work is properly cited.
 Downloads
 Citation Tools