
 Submit a Paper
 Propose a Special lssue
 Open Access
ARTICLE

Research on the Stability Analysis Method of DC Microgrid Based on Bifurcation and Strobe Theory
School of Electrical Engineering and Information Engineering, Lanzhou University of Technology, Lanzhou, 730050, China
* Corresponding Author: Nan Qiu. Email:
(This article belongs to the Special Issue: Key Technologies of Renewable Energy Consumption and Optimal Operation under )
Energy Engineering 2024, 121(4), 987-1005. https://doi.org/10.32604/ee.2023.045475
Received 18 September 2023; Accepted 07 November 2023; Issue published 26 March 2024
 View Full Text
 Download PDF
Abstract
During the operation of a DC microgrid, the nonlinearity and low damping characteristics of the DC bus make it prone to oscillatory instability. In this paper, we first establish a discrete nonlinear system dynamic model of a DC microgrid, study the effects of the converter sag coefficient, input voltage, and load resistance on the microgrid stability, and reveal the oscillation mechanism of a DC microgrid caused by a single source. Then, a DC microgrid stability analysis method based on the combination of bifurcation and strobe is used to analyze how the aforementioned parameters influence the oscillation characteristics of the system. Finally, the stability region of the system is obtained by the Jacobi matrix eigenvalue method. Grid simulation verifies the feasibility and effectiveness of the proposed method.Keywords
DC microgrids are important in DC area power distribution for data centers, warships, aerospace and automation systems, DC power technology for electric traction, residential DC power supply, and industrial green microgrids. Compared with AC microgrids, the DC microgrid control is simple, the power conversion efficiency is high, and there is no need to consider the phase and frequency tracking of voltage or reactive power compensation [1,2]. However, the access of a large number of loads with negative damping characteristics reduces the system damping and can cause DC bus voltage oscillation instability [3]. Simultaneously, the interaction between LC filters and converters used to eliminate high-frequency harmonics affects the output impedance of batteries and grid-connected converters, which reduces the stability margin of the system and limits the development of DC microgrids [4,5].
Current methods for microgrid oscillation analysis are mainly eigenvalue analysis [6], impedance analysis [7], and time domain simulation [8]. In reference [9], the eigenvalue analysis method is used to study the influence of factors such as the sag coefficient and power load on bus voltage stability. Data show an interaction between the power load and weakly damped LC, which leads to high-frequency oscillations in the bus voltage, and the oscillation frequency varies with the size of the load and the amount of the load, thus affecting the stability of the grid. In reference [10], a small disturbance stability model for a single-bus system is derived based on modeling the key components of the DC microgrid. The stability of the model under small disturbances is explored using the eigenvalue analysis method. In reference [11], a three-port power electronic transformer was studied, an improved control strategy for its asymmetric loading conditions was proposed, and a cascaded DC bus-side low-frequency stability analysis study using the impedance analysis method is conducted. In reference [12], a small-signal stability analysis was presented based on impedance analysis performed at the DC bus by a multi-parallel converter, and impedance criterion is considered for a DC microgrid. References [13,14] equated a closed-loop controlled load converter in a DC microgrid, a constant power load that exhibits negative impedance characteristics, reduces the system damping, and impacts the system stability. The stability of the load converter is improved by the inclusion of an input filter. In reference [15], the basic framework of electromagnetic transient simulation based on nodal equations is used as the basis for the transient simulation of microgrid systems, and transient stability analysis was performed using the time domain simulation method.
The abovementioned literature has been studied in terms of linear analysis, but microgrid systems include significant stochastic, strongly nonlinear, multiscale, multi-coupled, and strongly time-varying dynamic characteristics, and the oscillation characteristics of such a system cannot be effectively analyzed using linear analysis methods. To this end, reference [16] investigated the chaotic phenomenon of DC-DC converters in photovoltaic DC microgrids using chaotic control methods, focusing on simulation models and nonlinear phenomena of high- and low-order DC-DC converters. In reference [17], the influence of the circuit parameters of the boost converter, buck-boost converter, and quadratic boost converter on system stability was analyzed by establishing an exact discrete iterative mapping model of the converter based on a bifurcation diagram and Lyapunov exponential spectrum. In references [18,19], buck and boost converters were studied for their respective oscillation characteristics. Reference [20] discussed the oscillation mechanisms such as subharmonics, bifurcation, and chaos that may arise in single-stage buck converters in some cases. Reference [21] focused on the stability of the converter under various control and circuit parameters using bifurcation diagrams and discrete iterative methods. Reference [22] investigated the presence of bifurcation phenomena in boost converters using numerically constructed Lyapunov functions. Reference [23] also used the Lyapunov exponential spectrum to study the existence of chaos in DC-DC converters. Reference [24] analyzed the bifurcation and chaotic nonlinear properties using iterative functions and difference equations for the discrete model.
As mentioned above, the current study using nonlinear analysis is focused on the individual sources in the DC microgrid and does not take into account the oscillation characteristics of the whole DC microgrid due to the variation in the individual microgrid source parameters. The existing nonlinear analysis methods mainly focus on bifurcation analysis, this thesis adopts the method of combining bifurcation and stroboscopic DC microgrid stability analysis, based on which the Lyapunov exponential method is used for validation, and the results are the same as those of the above method, which verifies the correctness of the method. In this paper, a nonlinear dynamic model of a DC microgrid with sag control is established, the influence of microgrid sources in the DC microgrid is considered from the perspective of nonlinear dynamics, the oscillation mechanism of bus voltage is studied by combining bifurcation analysis and a stroboscopic sampling diagram, and the stability region of system parameters is divided by combining the Jacobian matrix, which provides a theoretical basis for optimal control, parameter design and stability analysis of a microgrid. Theoretical basis for optimal control, parameter design, and stability analysis of microgrid.
The remainder of the paper is structured as follows. Section 2 introduces the busbar oscillation characteristics and stability analysis methods. Section 3 presents the nonlinear dynamic model of the microgrid. Section 4 investigates the system oscillation characteristics and system stability region under the association of the main circuit parameters and controller parameters. Section 5 offers conclusions.
2 Busbar Oscillation Characteristics and Stability Analysis Method
2.1 Busbar Oscillation Characteristics
Distributed power sources and energy storage units in the DC microgrid are connected to the DC bus by corresponding unidirectional or bidirectional DC-DC and DC-AC converters, which constitute an environment of multiple power electronic converters. In such a system, when the parameters of the converters change, their constant power load characteristics interact with the LC filters, resulting in high-frequency oscillations in the bus voltage of the DC microgrid; moreover, the oscillation frequency changes with the change in the access location or number of loads or distributed power sources.
In a DC microgrid, loads such as electric vehicles usually need to be connected to the DC bus through the converter, and the converter has closed-loop control of constant power load characteristics. Fig. 1 shows a cascaded power supply structure in a DC microgrid system.
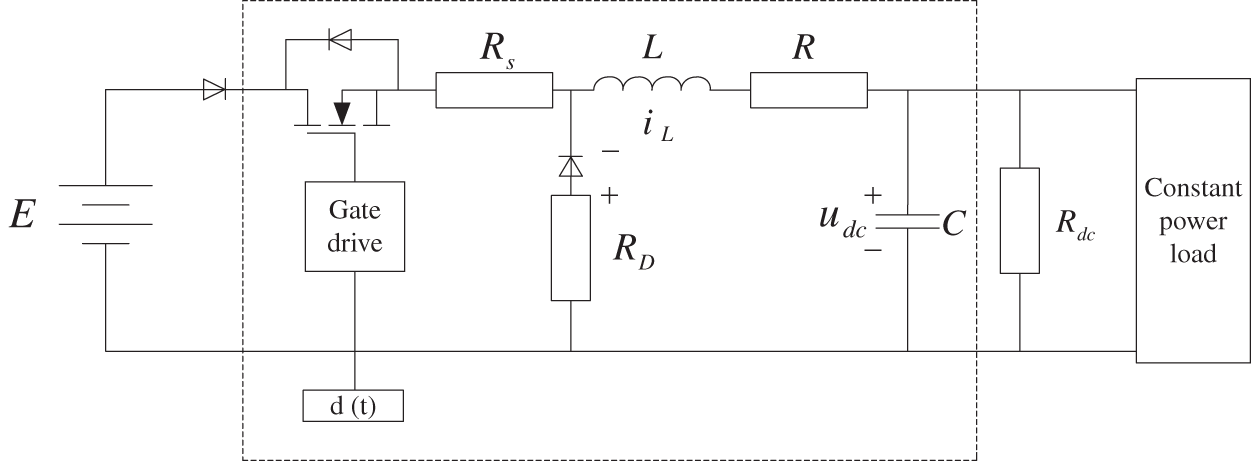
Figure 1: DC microgrid system cascade power supply structure
In the system, when the parameters of the load converter change, its constant power load characteristics interact with the LC filter, causing high-frequency oscillations in the bus voltage. The frequency of these oscillations also varies with the location and number of load or distributed power sources connected. The impedance criterion established by Dr. Middlebrook can be used to determine the bus voltage oscillations caused by the interaction between the load converter and the input filter.
The input filter can be equated to a source-side converter, such that the DC microgrid system can be equated to a DC cascade system, as shown in Fig. 2. Using the impedance criterion, the stability of the DC microgrid system can be analyzed when the source-side converter and load-side converter are cascaded. Moreover, the impact of oscillation on bus voltage stability can be more intuitively understood by analyzing the impedance relationship.
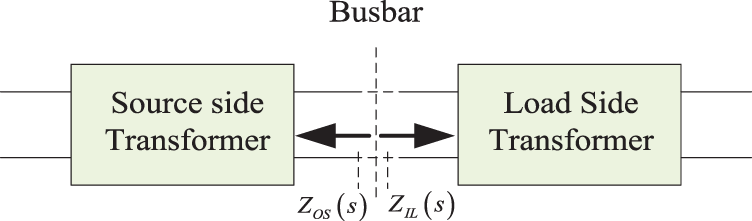
Figure 2: Transformer system model
Fig. 2 shows the source-side and load-side converter cascade system. The output impedance of the source-side converter is
If the magnitudes of both
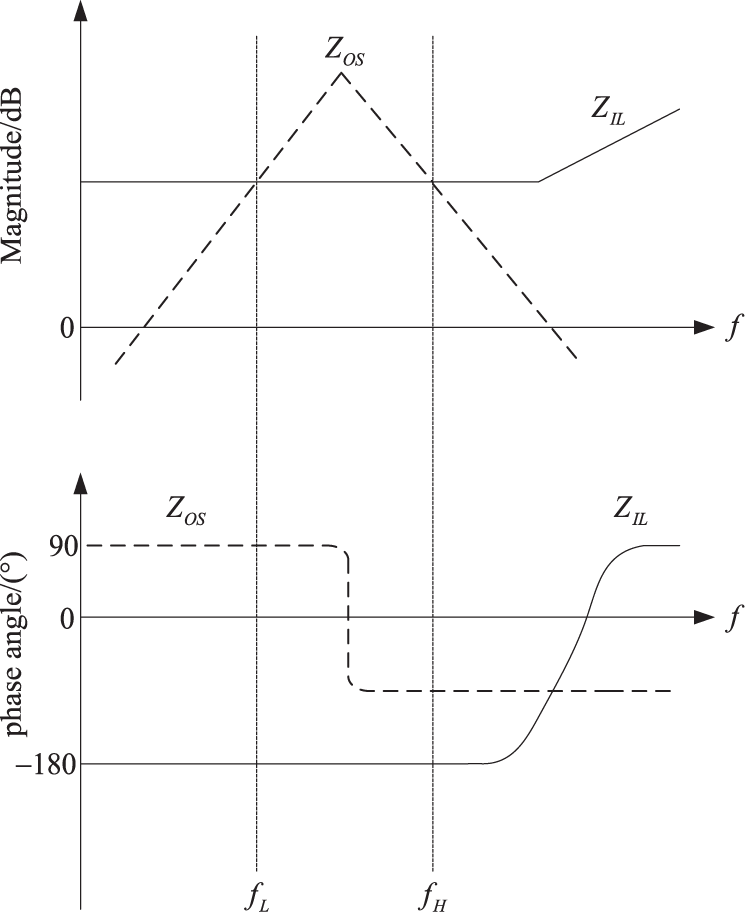
Figure 3: Schematic diagram of the instability situation
2.2 Stability Analysis Methods
Stability analysis is used to study the oscillation characteristics of the system by analyzing the characteristics of the system in different operating states. The stability analysis method used in this paper is mainly the bifurcation analysis method. To verify the accuracy of these methods, a maximum Lyapunov exponential diagram and a stroboscopic sampling diagram are also utilized. Finally, the Jacobi matrix eigenvalue method is used to determine the stable operation region of the DC microgrid.
Bifurcation analysis is a very effective analytical method for analyzing the parameter stability of nonlinear dynamical systems. Consider the dynamic nonlinear system:
The maximum Lyapunov exponent diagram further verifies the accuracy of the theory based on the bifurcation diagram. By comparing the bifurcation diagram and the maximum Lyapunov exponent diagram, the bifurcation of the DC microgrid can be more clearly seen when the selected circuit parameters are the same. Based on this circumstance, the stability of the system is judged based on the value of the maximum Lyapunov exponent, which is chaotic when the maximum Lyapunov exponent is greater than zero and periodic when it is less than zero. The nonlinear dynamic characteristics can be judged intuitively by the frequency sampling map. First, an iterative model of discrete mapping is constructed for this system, and then any initial value is substituted into this iterative method. The initial instability term is eliminated, sampled according to a specific period, and then stored to obtain the stroboscopic sampling map of this system. By analyzing the stroboscopic sampling map, the degree of stability of the system can be determined. If the sample curve of the stroboscopic sampling map is a straight line, the system is in a single-cycle steady state; in the case of two straight lines on the stroboscopic sampling map, the system has a periodic bifurcation; in the stroboscopic sampling map, if the sampling points appear irregularly distributed, it indicates that the system is chaotic.
The Jacobian matrix eigenvalues can also be used to study the stability of nonlinear systems. It can determine the working state of a second-order system based on the magnitude of its Jacobian matrix eigenvalues: if the absolute value of the Jacobian matrix eigenvalues of a second-order system is less than 1, then the second-order system is in a stable state. In contrast, unstable periodicity or chaos occurs.
The Jacobian matrix can be found by the implicit function derivative theorem as follows:
After obtaining the eigenvalues of the Jacobi matrix, we observe that the trajectory of the eigenvalues of this matrix changes when the parameters of the system change according to the following guidelines.
The system is in a steady state when the eigenroots are all in one unit circle.
When the parameters of the system change, the system appears as a kind of Neimark-Sacker bifurcation (Hopf bifurcation) if there is a pair of conjugate complex eigen roots but the other pair of eigen roots are still in the unit circle.
A multiplicative period bifurcation occurs when the parameters change, when one eigenroot removes ward along the negative real coordinate axis and the other eigenroots remain in the unit circle.
When the parameters of the system are changed, if there is an eigen root moving outward along the positive real axis but the other eigen roots remain within the unit circle, then the system has a saddle-knot bifurcation.
The trajectory of the maximum mode eigenvalue of the Jacobi matrix of the system can be used to discriminate the nonlinear dynamics of the nonlinear dynamical system more accurately and intuitively. Let
From
Then the Jacobi matrix of the system is
Included among these,
As seen from Eq. (3) of the Jacobi matrix for this system, before finding the eigenvalues, it is necessary to determine the steady-state periodic solutions of the discrete mapping iterative equations of the system,
3 DC Microgrid Nonlinear Dynamic Model
The structure of a DC microgrid is shown in Fig. 4 and includes four main parts: (1) a bidirectional DC-AC converter is used to complete power exchange between the DC microgrid and the external AC grid; (2) distributed new energy sources such as wind power and photovoltaic power generation are connected, usually using AC-DC or DC-DC converters; and (3) energy storage devices are connected by bidirectional DC-DC converters. To keep the system stable and suppress the fluctuation of bus voltage, voltage or power control is usually performed. (4) There are also many types of loads in a DC microgrid, mainly two types: one is a resistive load, and one is a constant power load. In some devices, resistive loads can be directly connected to the DC bus, while for most traditional AC loads, as well as new power electronic type loads and other related loads, power must be connected through the corresponding DC-AC and DC-DC converters. In practical applications, these types of loads will show dynamic characteristics of constant power externally.
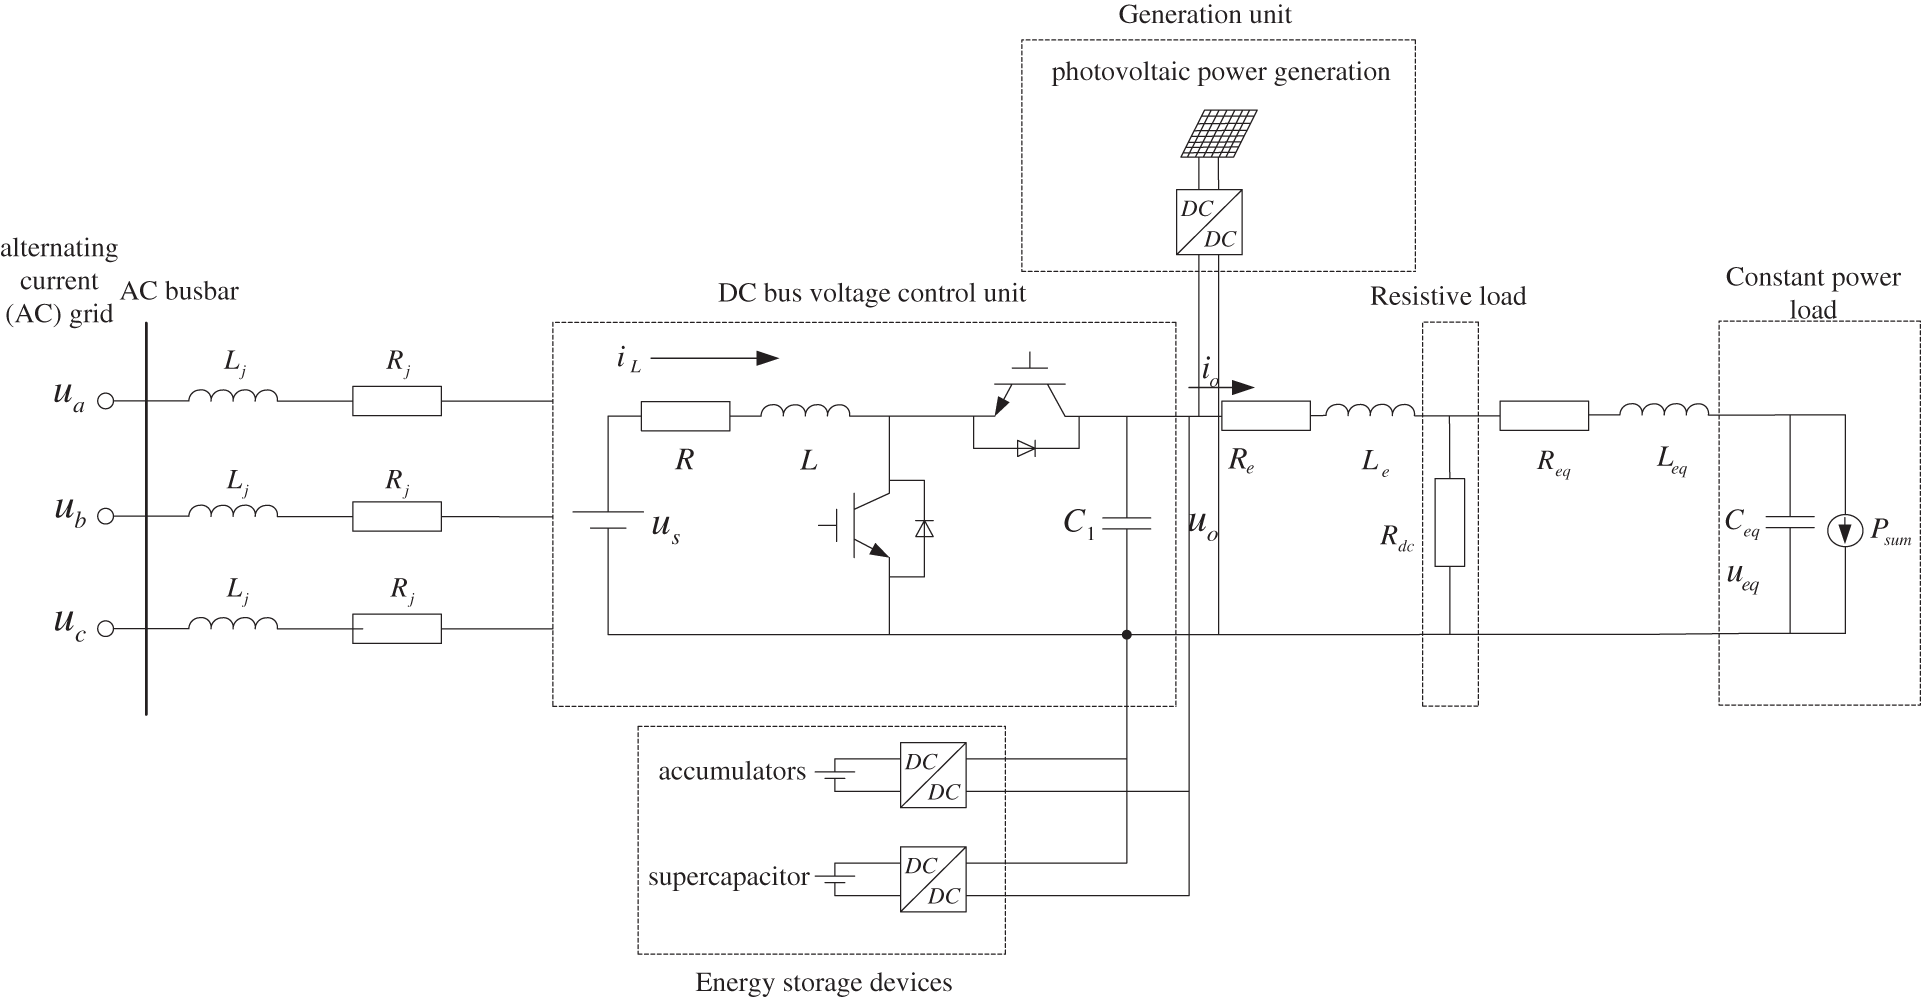
Figure 4: DC microgrid topology
Power regulation for grid-connected DC-AC converters and sag control for energy storage converters can maintain the stability of the nodes. In the system, the converter with power control can be considered as a special constant power load with negative output power in modeling because of its external characteristics similar to a constant voltage load. The DC microgrid is simplified to a system consisting of multiple DC-DC converters (i.e., DC bus voltage control units), resistive loads, and constant power loads. Because the equivalent impedance of the constant power load is relatively large, its control system can be neglected in the stability analysis, and it is equated to a simple structure of a constant power supply and a capacitor in parallel (see Fig. 4).
In Fig. 4,
3.1 DC Bus Voltage Control Unit Model
The DC bus voltage regulation part of this system is regulated in normal operation based on capacitor voltage
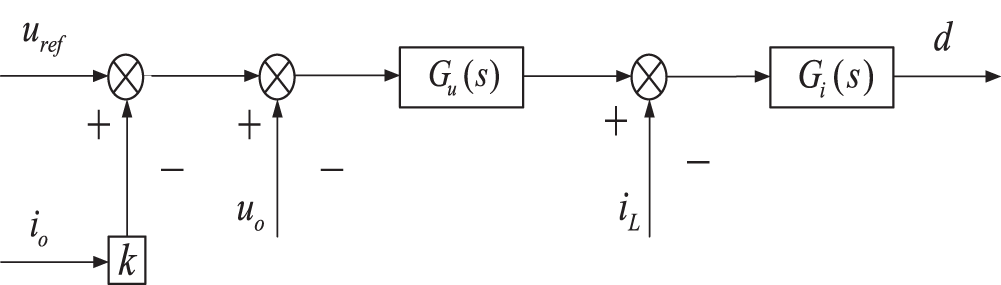
Figure 5: DC bus voltage control unit control system box
The corresponding mathematical model can be expressed as
where
In the control system, the phase-locked loop is obtained through the output voltage, and the output voltage and current of the microgrid are respectively coordinate transformed to obtain the instantaneous value of the power, which is combined with the first-order low-pass filter to filter the high-frequency component in the instantaneous power and provide certain control inertia for the droop control. It is represented as follows:
where
Sag control, as an important controller of the microgrid, can distribute the output active and reactive power of the microgrid effectively and synthesize a new voltage to provide a reference voltage value for the double-loop control to better realize the control of the inverter, which is expressed as
where
In the case of a DC microgrid system with multiple constant power loads operating in parallel, a simplified model equivalent remains available, as shown in Fig. 6.
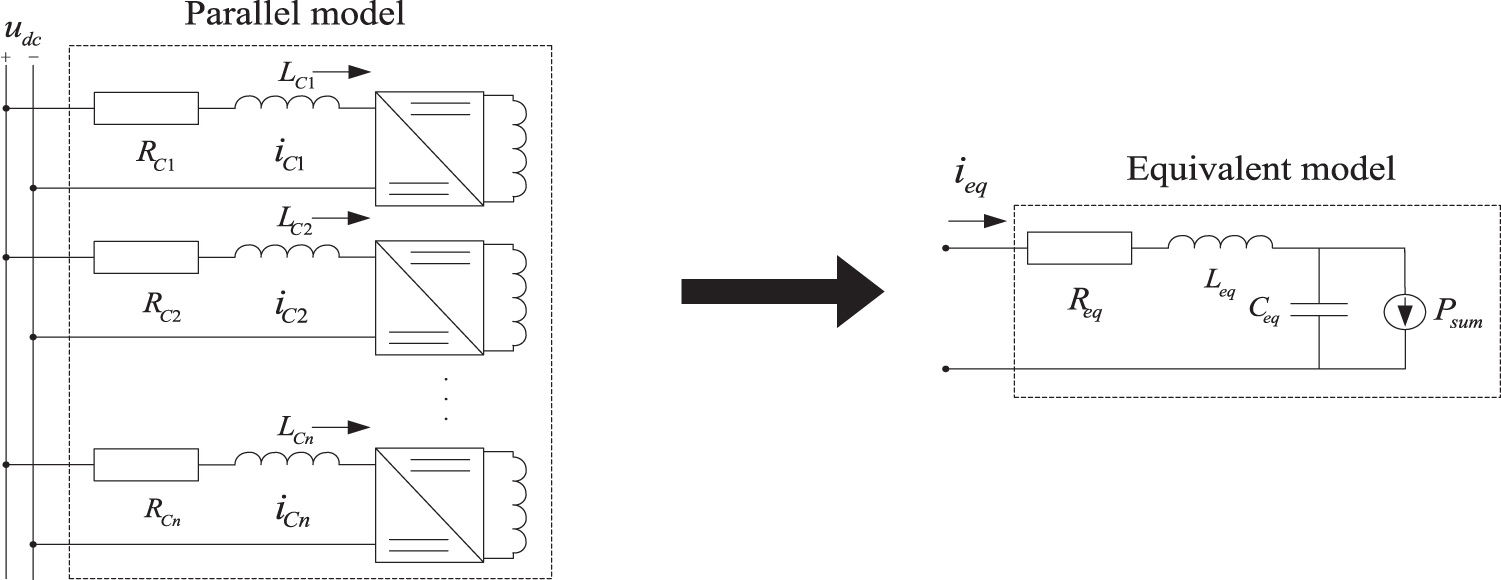
Figure 6:
Assuming that there are
where
If the inductance and resistance are defined as
then,
By analyzing the voltage stabilization capacitor at the input of a constant power load, we obtain
where
Because a power-controlled converter is used in the DC microgrid, the power of the equivalent model in Fig. 6 can be modified to
In this way, the equation of state for a constant power load can be expressed as
Frequency mapping is the most applied type of closed-loop discrete mapping for DC-DC converters. This method first samples the start of each tooth cycle of the converter and then models the operation of the converter. The basic idea of this method is to set an initial value and then use this initial value as a variable to find the solution for the next cycle until finally, the required exact solution
The voltage feedback-controlled converter strobe mapping can be obtained as follows:
where
To analyze the dynamical behavior of the system, a discrete mapping model of the system is generally established by data sampling, and then the nonlinear behavior of the system is accurately analyzed based on the resulting discrete mapping model. behavior. Currently, strobe mapping, asynchronous switching mapping, and synchronous switching mapping are the three most important data sampling methods. In this thesis, the most widely used data sampling method is the strobe mapping method, in which the state variables of the system are analyzed at each moment of the on/off cycle. In this thesis, the most widely used data sampling method is the strobe mapping method, in which the system state variables are sampled at each moment of the switching cycle to establish the discrete mapping model of the system.
Let the system switching period be
a. When
b. When
c. When
Buck-Boost The discrete mapping model of the switched inductor Buck-Boost converter in intermittent conduction mode is shown in Eq. (17). The above Eqs. (18)–(20) show the switching inductor in intermittent conduction mode. Based on the discrete mapping model of the system, the discrete mapping model of the inductor is obtained by using MATLAB Based on the discrete mapping model of the system, the nonlinear behavior of the system can be accurately analyzed by numerical simulation in MATLAB.
4 Analysis of Simulation Results
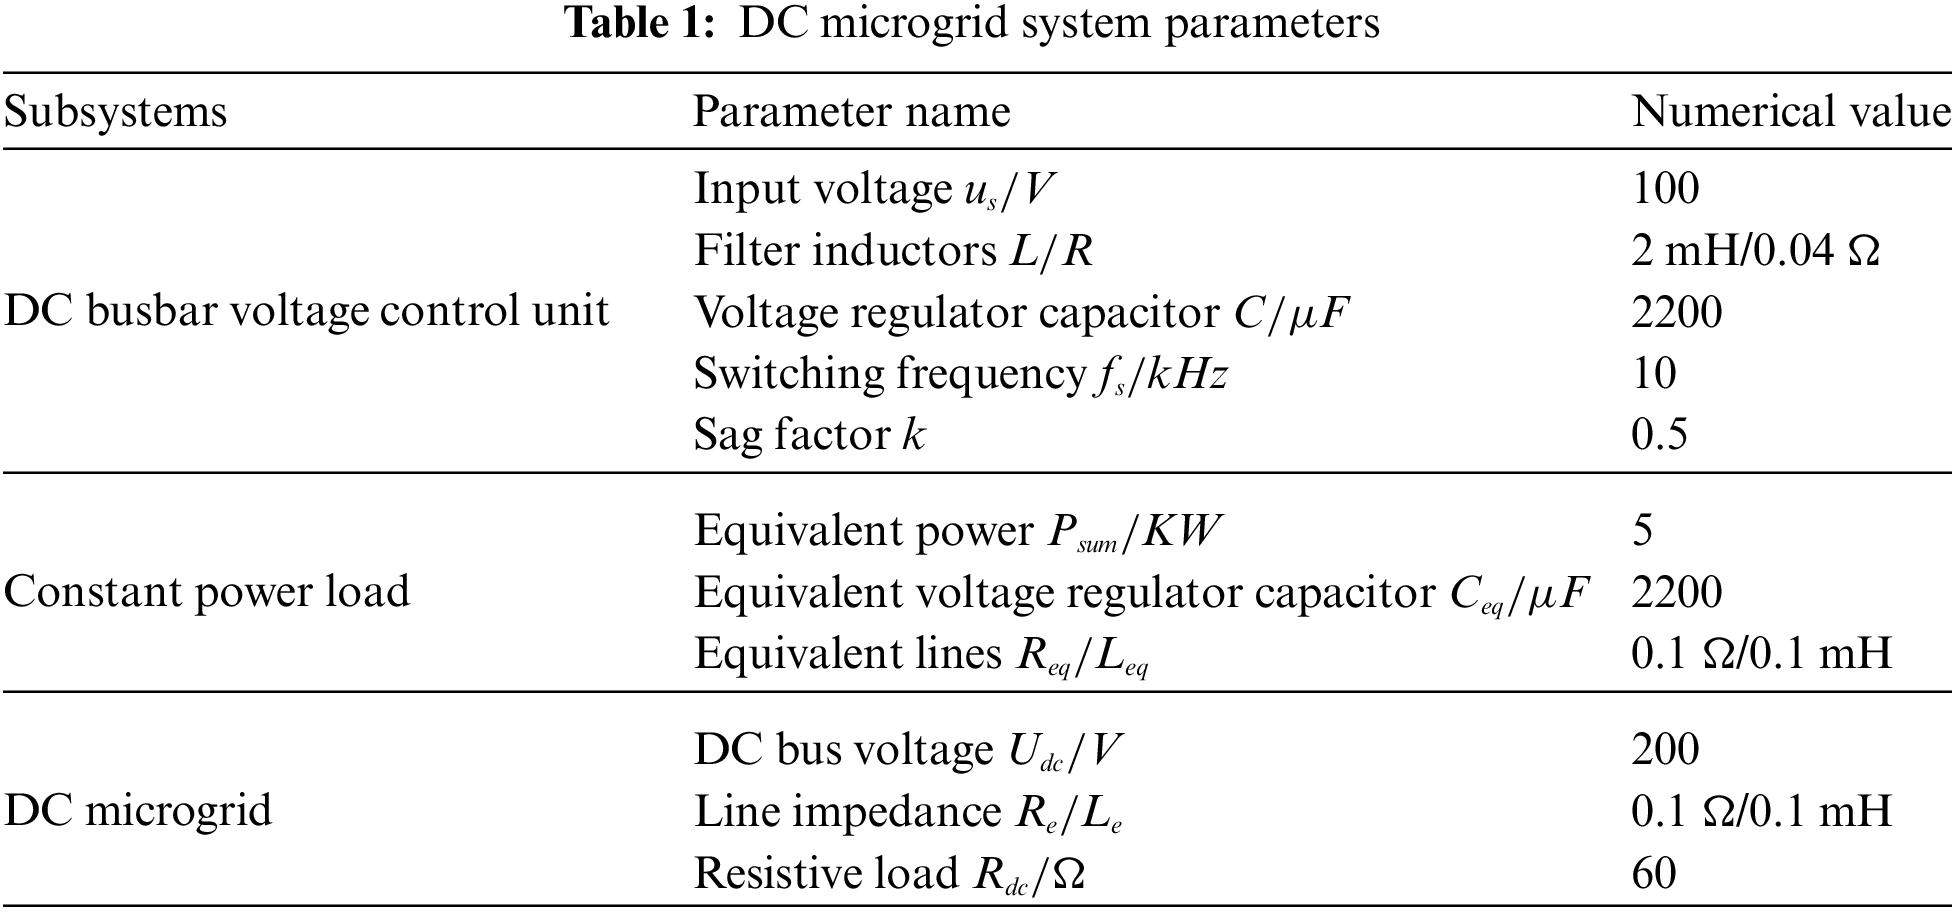
To verify the accuracy of our proposed method, system parameters are determined as shown in Table 1. This paper will analyze and compare the stability of both constant power loads and resistive loads.
4.1 Stability Analysis under Constant Power Load Conditions
4.1.1 Bifurcation Diagram of a Microgrid with Parameter Variation
During the change of sag factor
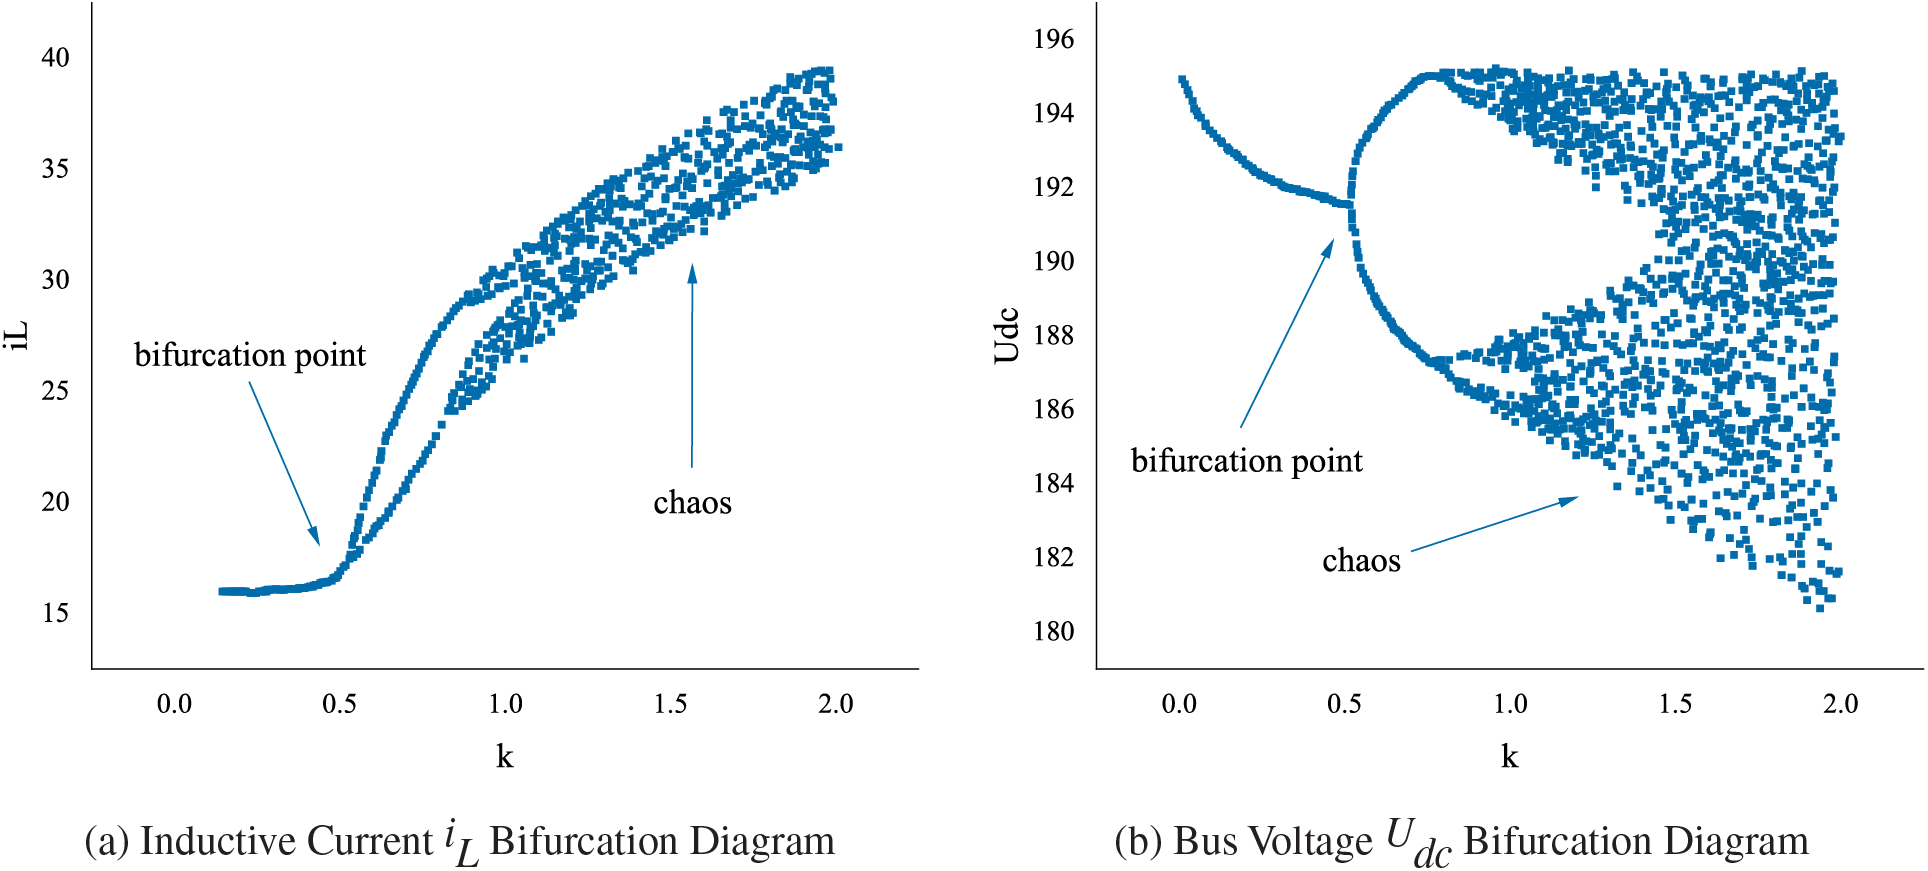
Figure 7: Bifurcation diagram of a microgrid with sag factor
Setting the sag factor as
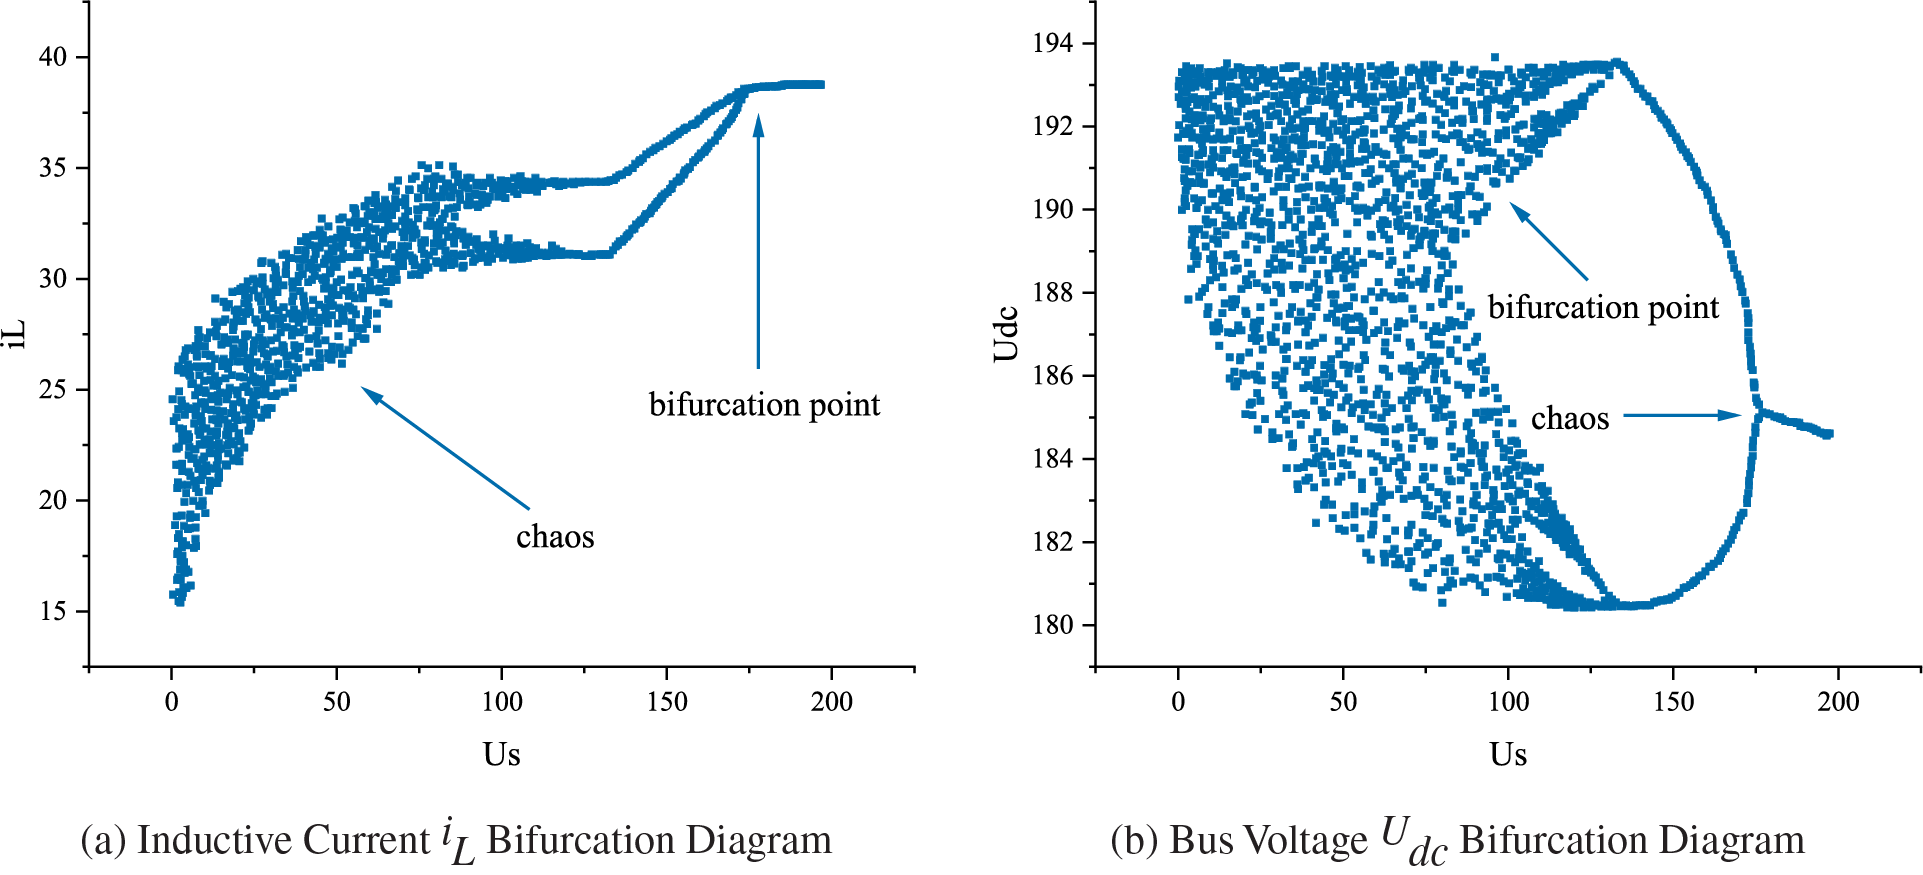
Figure 8: Bifurcation diagram of a microgrid with input voltage
Setting the sag factor to
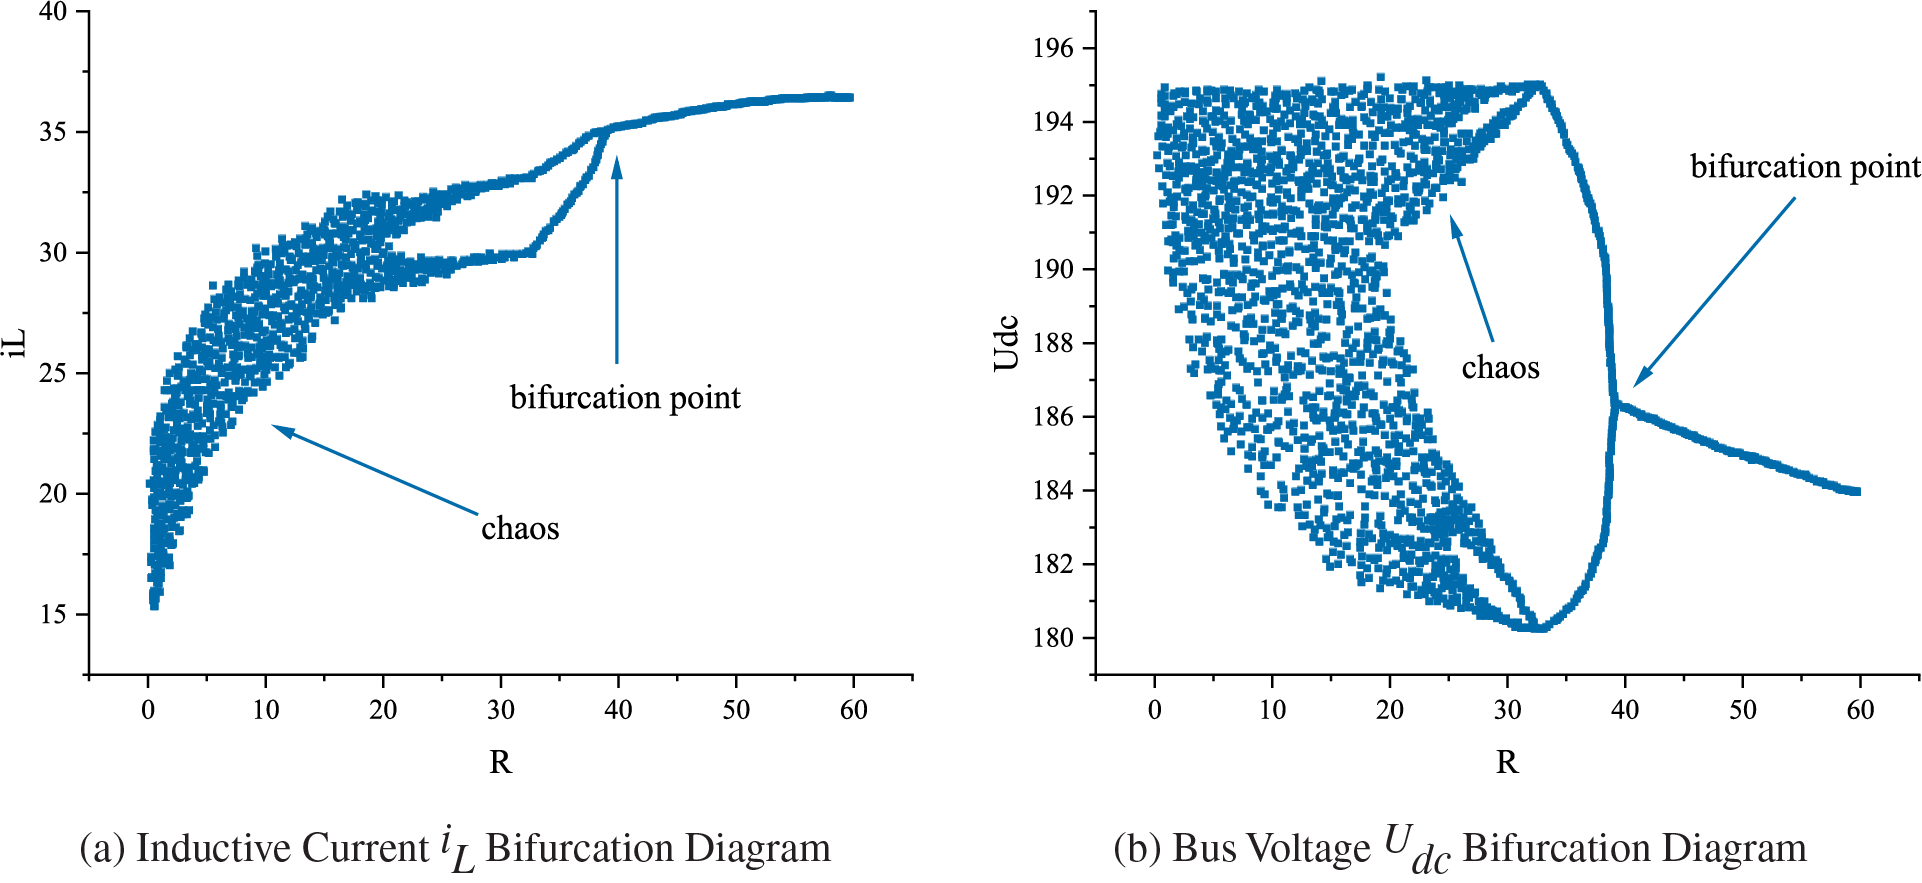
Figure 9: Bifurcation diagram of a microgrid with load resistance
4.1.2 Lyapunov Index of the Microgrid with Parameter Variation
As shown in Fig. 10a, when
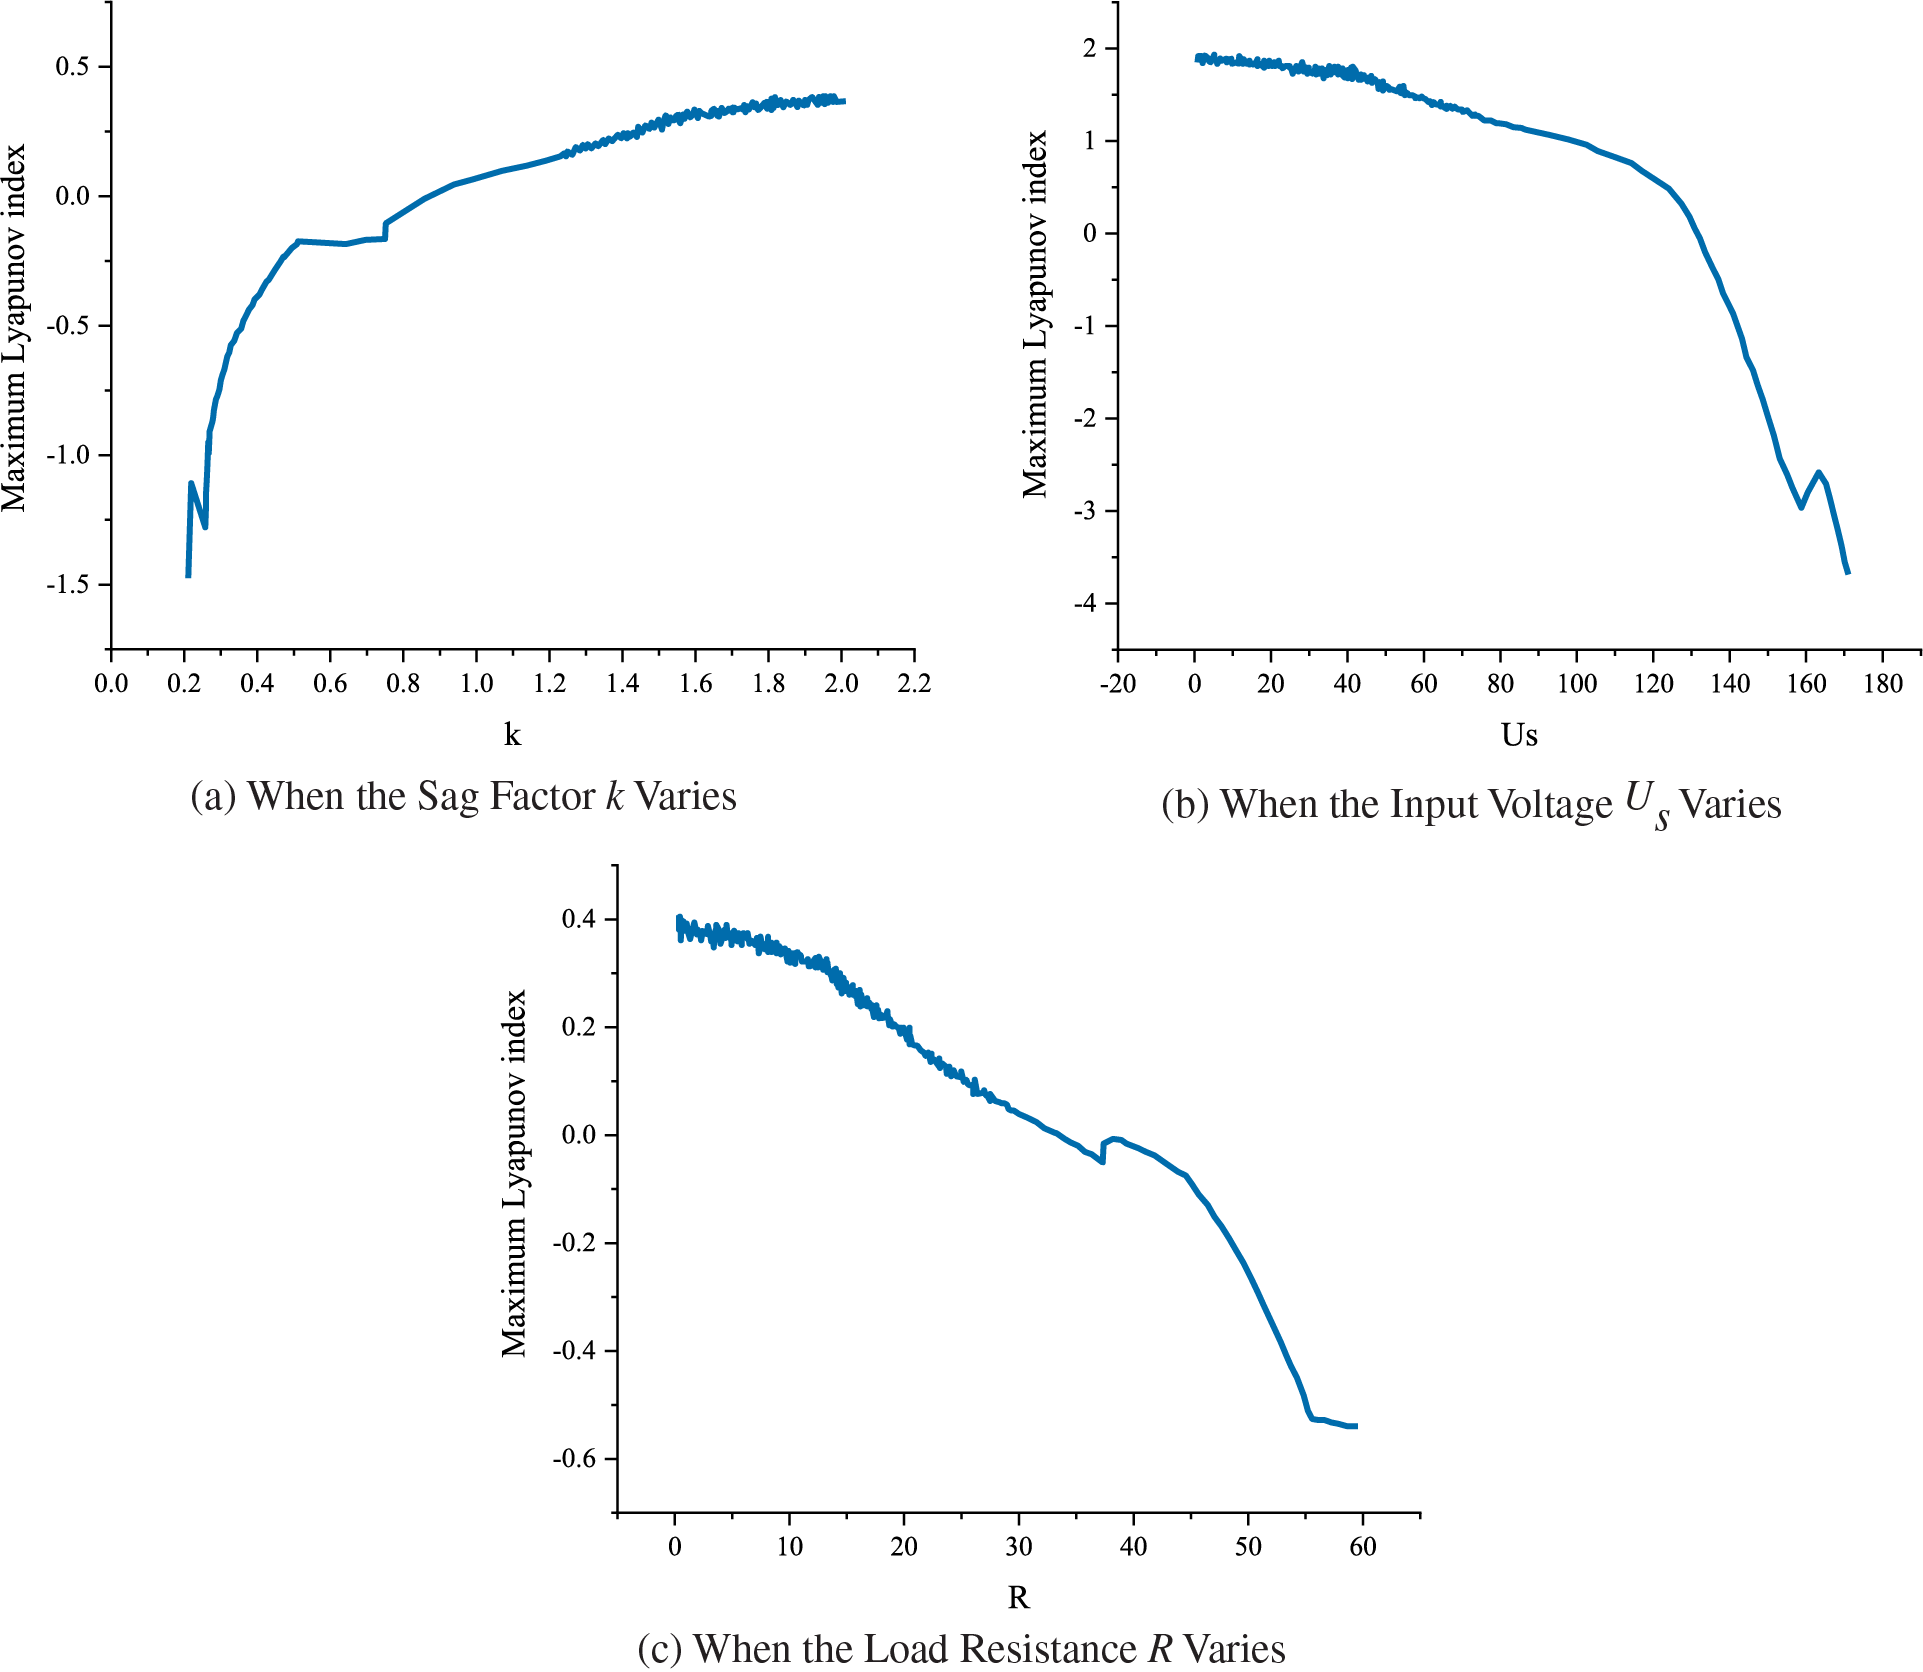
Figure 10: Plot of Lyapunov’s exponent for each parameter change
4.1.3 Stroboscopic Sampling Diagram of a Microgrid with Variation in the Sag Coefficient
Fig. 11 shows the stroboscopic sampling plots under different sag coefficients. When the scale factor
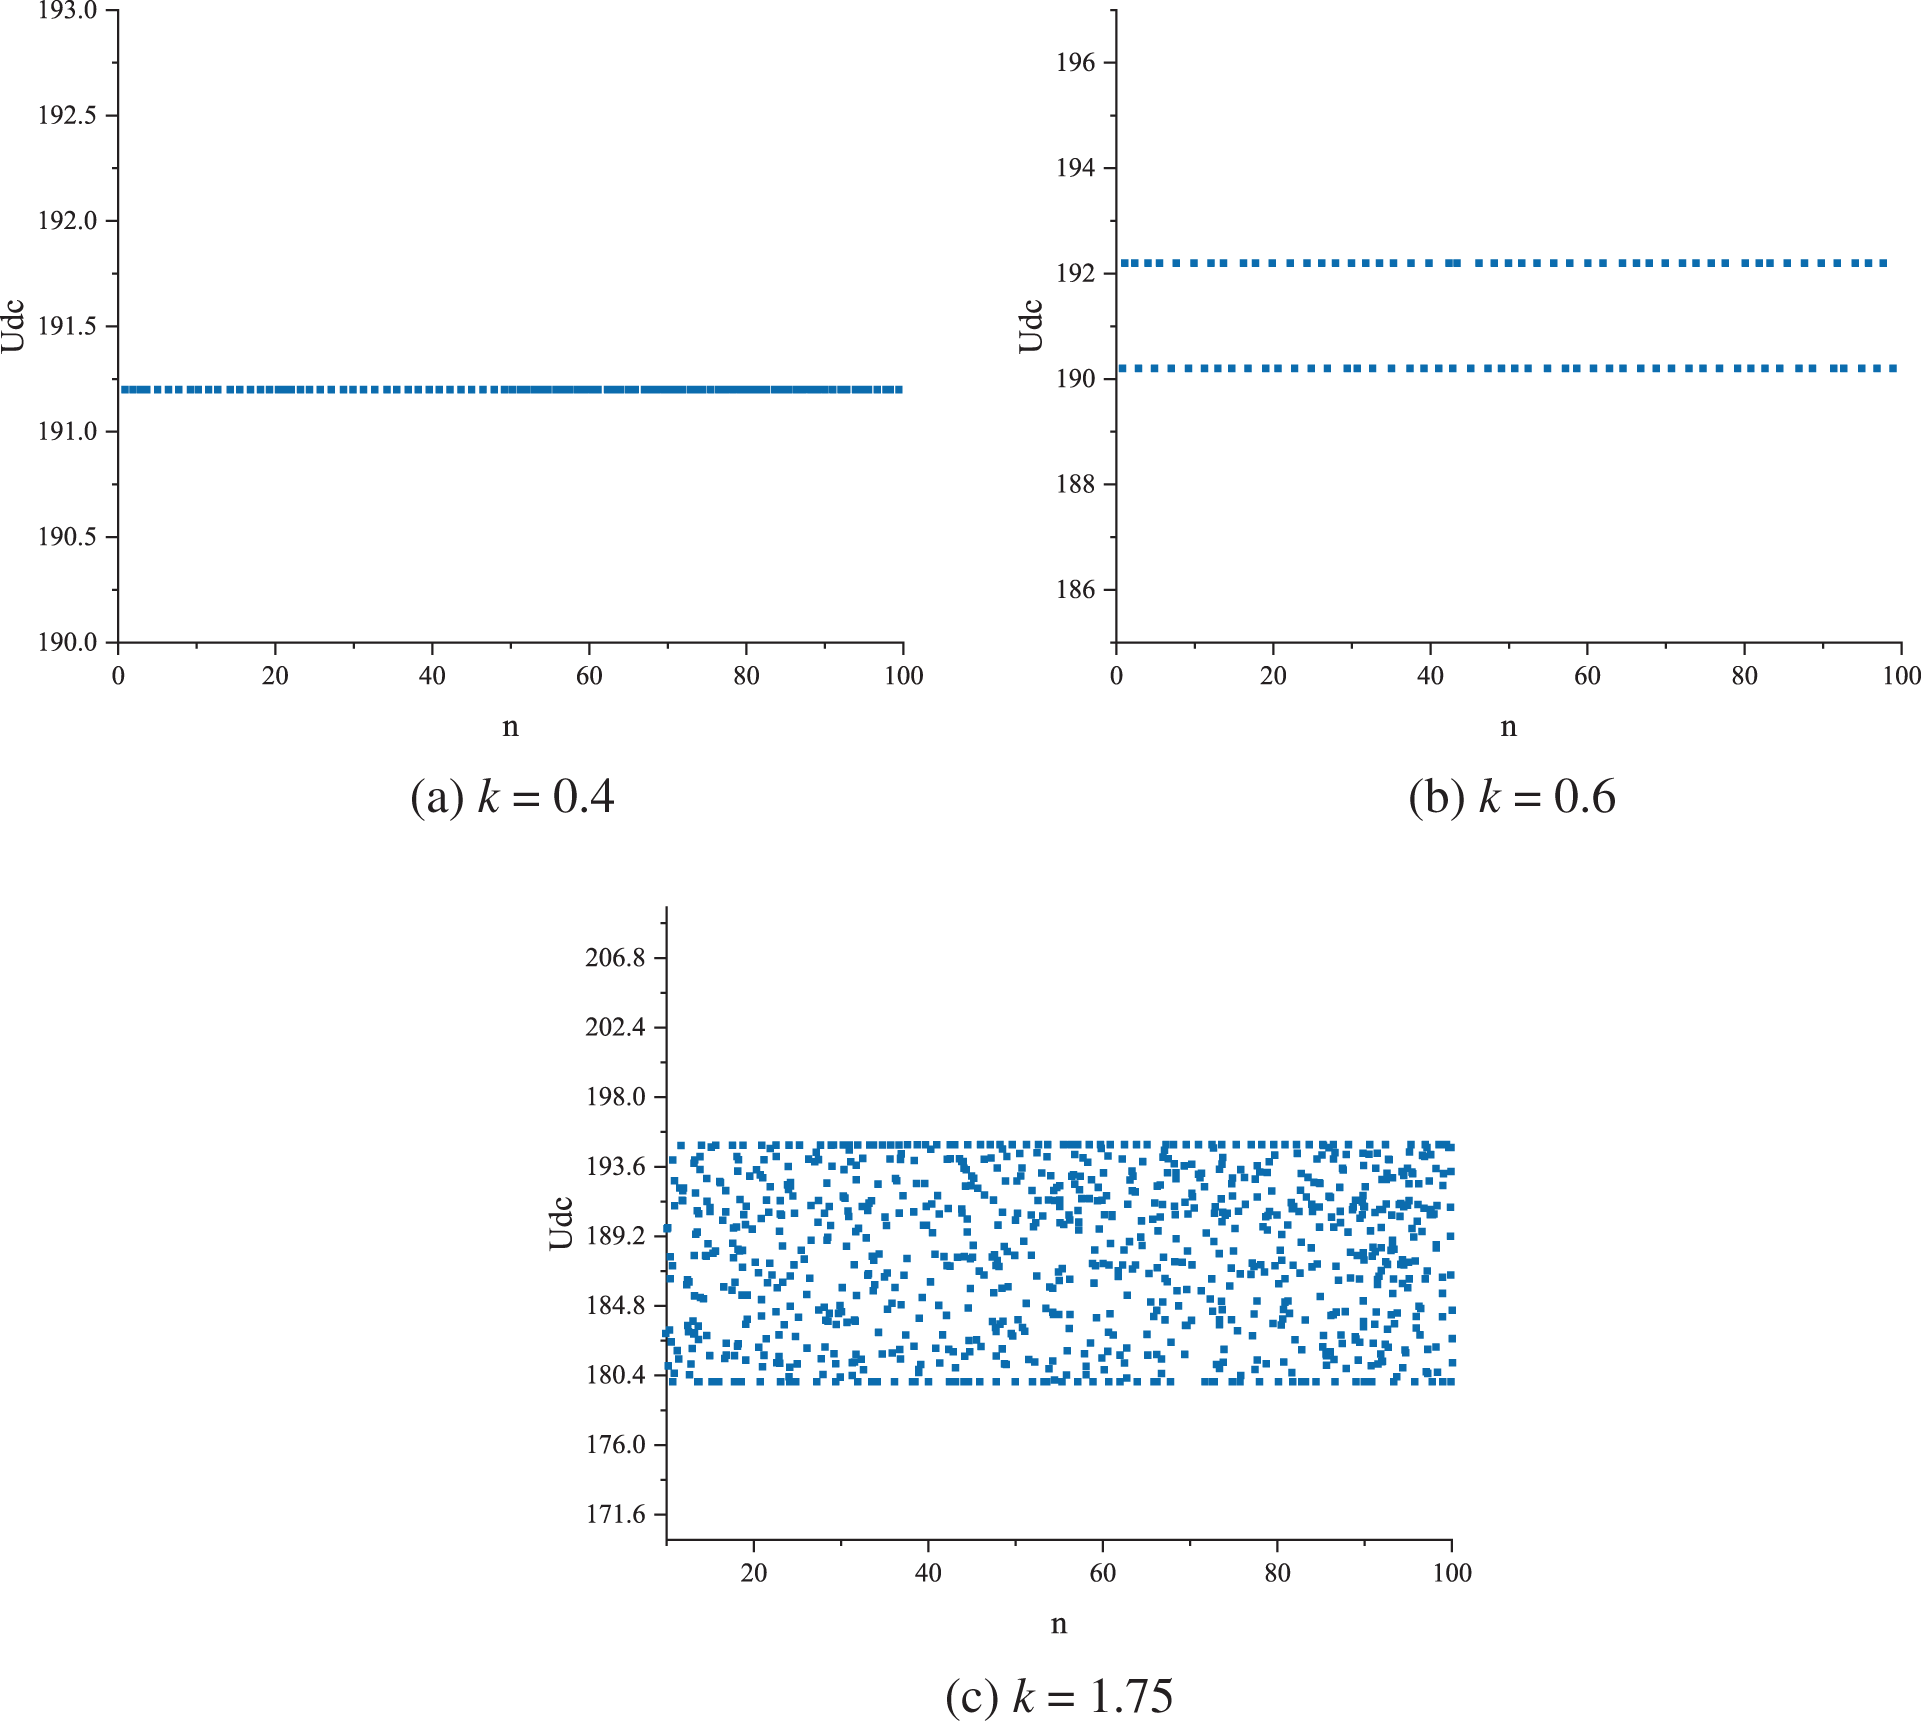
Figure 11: Stroboscopic sampling plots with different sag coefficients
The bifurcation and chaotic state based on the stroboscopic sampling diagram coincide with the characteristics of the bifurcation diagram and Lyapunov exponential diagram, thus further confirming the accuracy of the nonlinear dynamic analysis using the bifurcation diagram and Lyapunov exponential diagram. The data show that the DC microgrid easily enters the bifurcation and chaotic states when the circuit parameters are set accordingly.
4.1.4 Stability Domain Division of Microgrid Operation
The above study can determine whether the system is stable under specific parameters by parameter changes. To obtain the stability region of the system more clearly and facilitate the selection of the optimal parameter range, we divide the stability domain of the system by the analysis method of the Jacobian matrix eigenvalue. First, the Jacobian matrix of the system is obtained by establishing the nonlinear model of the system, and then the maximum mode eigenvalue of the Jacobian matrix is analyzed according to the change in the bifurcation coefficient, and the stability region of the system is derived.
Fig. 12 shows the stability region of the microgrid dominated by the sag factor and input voltage. When the sag factor
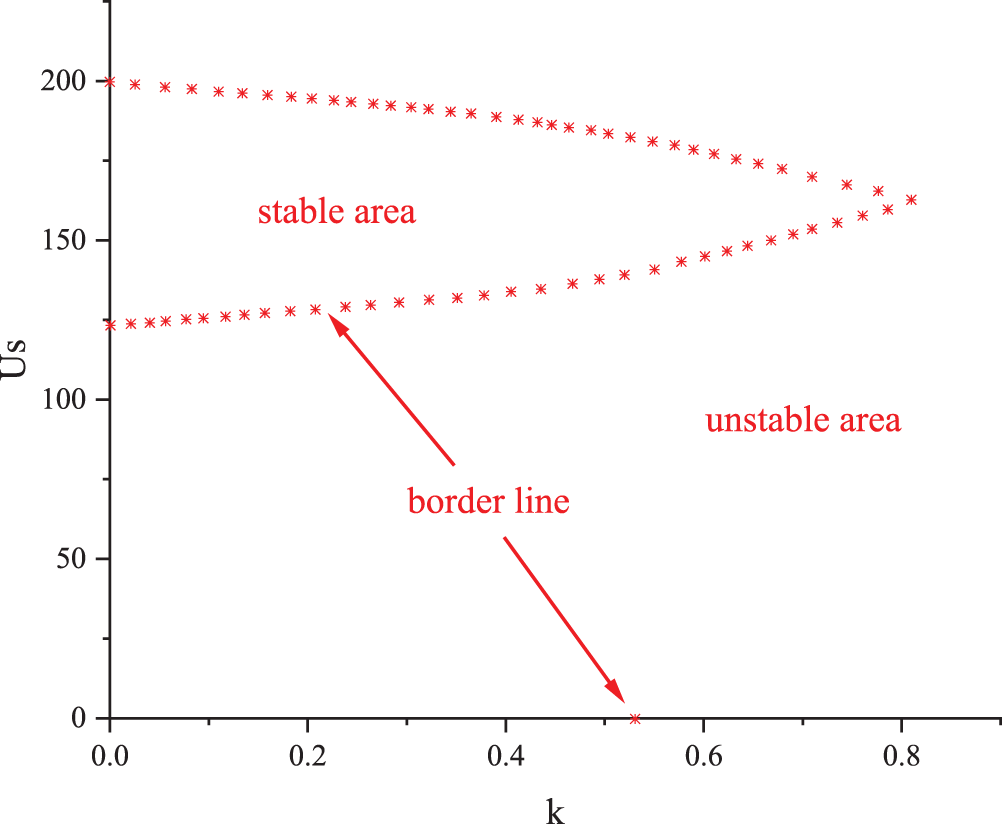
Figure 12: Sag coefficient and input voltage dominant stability domain
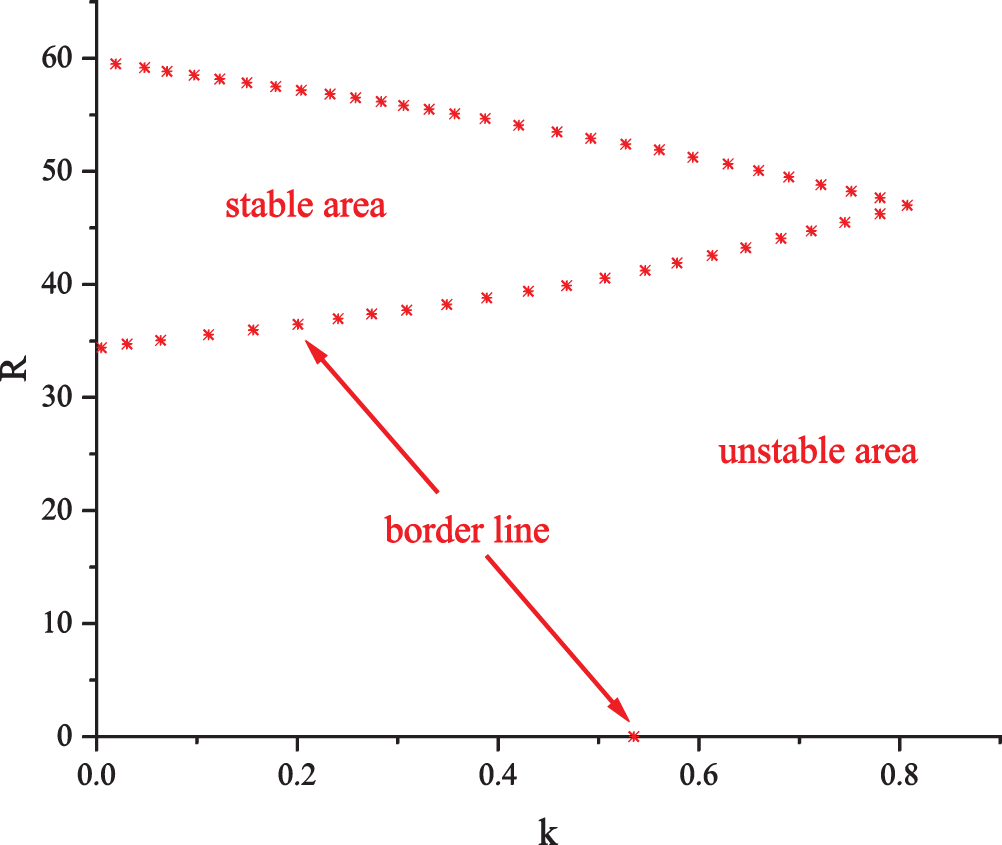
Figure 13: Sag coefficient and load resistance dominate the stability domain
4.2 Stability Analysis under Resistive Load Conditions
Considering different forms of loads, Fig. 14 shows the waveforms of the transient values of the DC bus voltage at resistive loads. From the figure, it can be seen that the DC microgrid can maintain stable operation when resistive loads are introduced into the system, whereas the DC microgrid system oscillates and destabilizes when constant power loads are introduced into the system.
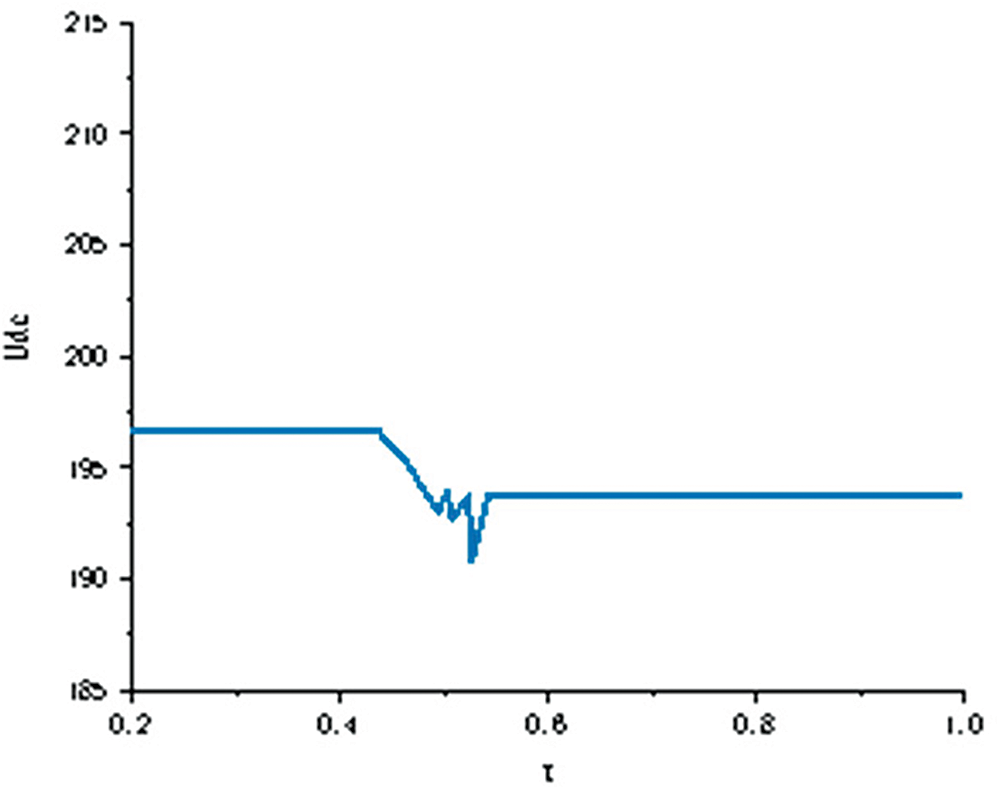
Figure 14: Resistive load DC bus voltage transient waveforms
In this paper, a nonlinear dynamic model of a DC microgrid is constructed, and a DC microgrid stability analysis method combining bifurcation analysis and stroboscopic analysis is developed based on correlations between the main circuit parameters and controller parameters. With this model, we analyze the bifurcation behavior of the microgrid system at different parameters. The stability region of the system is divided by combining Jacobi matrix analysis to avoid system destabilization collapse. The research shows the bifurcation and chaotic behavior of the system are closely related to the specific parameters in the system. The correct selection of parameters is of great significance for the stable operation and optimal design of the system. It also provides new references and new insights for the engineering design, application, and research of some complex systems. The main conclusions are as follows:
(1) The variation of a single source in a DC microgrid causes a multiple periodic bifurcation of the DC bus.
(2) Variation in a single source parameter causes bifurcation and chaos in a DC microgrid; moreover, its operating state is not only related to the control parameters but is also affected by several circuit parameters.
(3) The method of Jacobi matrix eigenvalues can obtain different stable operation regions of the system according to different parameters, such as the sag coefficient, input voltage, and load resistance, which all have their stable domains.
We finally note that the main circuit parameters and sag control coefficients are selected in this paper to study the analysis of the oscillation mechanism of the system by parameter changes, with the other parameters analyzed similarly. In addition, we focus on the corresponding physical mechanisms from the parametric perspective and leave the topic of how to use these mechanisms to suppress similar oscillations in a real system remains a future work.
Acknowledgement: None.
Funding Statement: National Natural Science Foundation of China (Nos. 51767017, 51867015, 62063016), Fundamental Research Innovation Group Project of Gansu Province (18JR3RA133), Gansu Provincial Science and Technology Program (20JR5RA048, 20JR10RA177).
Author Contributions: The authors confirm their contribution to the paper as follows: Study conception and design: Wei Chen, Nan Qiu. Data collection: Nan Qiu. Analysis and interpretation of results: Wei Chen, Nan Qiu, Xusheng Yang. Draft manuscript preparation: Wei Chen, Nan Qiu, Xusheng Yang. All authors reviewed the results and approved the final version of the manuscript.
Availability of Data and Materials: Data supporting this study are included within the article.
Conflicts of Interest: The authors declare that they have no conflicts of interest to report regarding the present study.
References
1. Wang, T., Li, C., Mi, D., Wang, Z., Xiang, Y. (2020). Coordinated modulation strategy considering multi-HVDC emergency for enhancing transient stability of hybrid AC/DC power systems. CSEE Journal of Power and Energy Systems, 6(4), 806–815. [Google Scholar]
2. Zhang, Q., Yu, H., Liu, Y., Zhao, Y., Hu, Y. et al. (2022). Consensus-based state of charge dynamic equilibrium strategy in isolated DC microgrid with bus voltage regulation. Sustainable Energy Technologies and Assessments, 54, 2213. [Google Scholar]
3. Zhang, X., Pei, W., Deng, W., Yu, T., Huang, R. (2017). Stability analysis of AC-DC hybrid distribution system with constant power load. Chinese Journal of Electrical Engineering, 37(19), 5572–5582 (In Chinese). [Google Scholar]
4. Buddhadeva, S., Mohammed, M. A., Pravat, K. R. (2023). Power quality and stability improvement of microgrid through shunt active filter control application: An overview. Renewable Energy Focus, 44, 1755. [Google Scholar]
5. Ullah, S., Haidar, A. M., Hoole, P., Zen, H., Ahfock, T. (2020). The current state of distributed renewable generation, challenges of interconnection and opportunities for energy conversion-based DC microgrids. Journal of Cleaner Production, 273, 122777. [Google Scholar]
6. Su, M., Liu, Z., Sun, Y., Han, H., Hou, X. (2018). Stability analysis and stabilization methods of DC microgrid with multiple parallel-connected DC-DC converters loaded by CPLs. IEEE Transactions on Smart Grid, 9(1), 132–142. [Google Scholar]
7. Liu, Z., Zhao, J., Zou, Z. (2020). Impedance modeling, dynamic analysis and damping enhancement for DC microgrid with multiple types of loads. International Journal of Electrical Power & Energy Systems, 122, 106183. [Google Scholar]
8. Wang, R., Feng, W., Xue, H., Gerber, D., Li, Y. et al. (2021). Simulation and power quality analysis of a loose-coupled bipolar DC microgrid in an office building. Applied Energy, 303, 117606. [Google Scholar]
9. Guo, L., Zhang, S., Li, X., Li, Y. W., Wang, C. et al. (2017). Stability analysis and damping enhancement based on frequency-dependent virtual impedance for DC microgrids. IEEE Journal of Emerging and Selected Topics in Power Electronics, 5(1), 338–350. [Google Scholar]
10. Wang, L., Peng, X. L., Yang, H. S., Teng, C. W., Zhang, J. R. et al. (2022). Stability analysis of a grid-connected large-scale DC microgrid with a hybrid wind/solar farm. 2022 IET International Conference on Engineering Technologies and Applications(IET-ICETA), pp. 1–2. Changhua, Taiwan. [Google Scholar]
11. Zheng, L., Kandula, R. P., Divan, D. (2022). Predictive direct DC-link control for 7.2 kV three-port low-inertia solid-state transformer with active power decoupling. IEEE Transactions on Power Electronics, 37(10), 11673–11685. [Google Scholar]
12. Yang, Y., Xu, J., Wu, Q., Li, C., Zhang, W. (2022). An impedance amplitude compensation control strategy for improvement of dynamic performance of DC microgrid. International Journal of Electrical Power & Energy Systems, 136, 107462. [Google Scholar]
13. Liu, Z., Su, M., Sun, Y., Han, H., Hou, X. et al. (2018). Stability analysis of DC microgrids with constant power load under distributed control methods. Automatic, 90, 62–72. [Google Scholar]
14. Zhang, Z., Yang, X., Zhao, S., Wu, D., Cao, J. et al. (2022). Large-signal stability analysis of islanded DC microgrids with multiple types of loads. International Journal of Electrical Power & Energy Systems, 143, 108450. [Google Scholar]
15. Saxena, P., Singh, N., Pandey, A. K. (2022). Enhancing the transient performance and dynamic stability of microgrid using PI inertia injection controller. International Journal of Electrical Power & Energy Systems, 134, 107334. [Google Scholar]
16. Sundaramoorthi, S., Karunanithi, K., Saravanan, S., Praveenkumar, S. (2017). Investigation and control of chaos in DC-DC noel converter using slope compensation method. 2017 IEEE International Conference on Intelligent Techniques in Control, Optimization and Signal Processing (INCOS), pp. 1–5. Srivilliputtur, India. [Google Scholar]
17. Wang, Y., Xu, J., Zhou, G. (2018). Uniform discrete iterative mapping model and stability study of voltage-based control SIDO CCM Buck converters. Chinese Journal of Electrical Engineering, 38(9), 2717–2727+2841 (In Chinese). [Google Scholar]
18. Liao, X., Ran, M., Yu, D., Lin, D., Yang, R. (2022). Chaos analysis of Buck converter with non-singular fractional derivative. Chaos, Solitons & Fractals, 156, 111794. [Google Scholar]
19. Li, P., Jiang, P., Liao, Z., Fan, R. (2018). Study on nonlinear dynamic behavior and stable operation region of single-phase photovoltaic inverter. IOP Conference Series: Materials Science and Engineering, 439(5), 052033. [Google Scholar]
20. Li, S., Liao, Z., Luo, X., Wei, D., Jiang, P. et al. (2020). Nonlinear model and dynamic behavior of photovoltaic grid-connected inverter. Applied Sciences, 32(1), 1–14. [Google Scholar]
21. Yu, Y., Zhang, C. (2021). Bifurcation analysis of cascaded H-bridge converter controlled by proportional resonant. International Journal of Electrical Power & Energy Systems, 125, 106476. [Google Scholar]
22. Chen, X., Long, X., Hu, W., Xie, B. (2021). Bifurcation and chaos behaviors of Lyapunov function controlled PWM boost converter. Energy Reports, 7, 2352–4847. [Google Scholar]
23. Zamani, N., Ataei, M., Niroomand, M. (2015). Analysis and control of chaotic behavior in boost converter by ramp compensation based on Lyapunov exponents assignment: Theoretical and experimental investigation. Chaos, Solitons & Fractals, 81, 20–29. [Google Scholar]
24. Barrueto, A., Diaz, M., Chavez, H. (2021). An overview of challenges related to power-electronics based power systems. 2021 IEEE International Conference on Automation/XXIV Congress of the Chilean Association of Automatic Control (ICA-ACCA), pp. 1–7. Valparaíso, Chile. [Google Scholar]
Cite This Article
 Copyright © 2024 The Author(s). Published by Tech Science Press.
This work is licensed under a Creative Commons Attribution 4.0 International License , which permits unrestricted use, distribution, and reproduction in any medium, provided the original work is properly cited.
 Downloads
 Citation Tools