
 Submit a Paper
 Propose a Special lssue
 Open Access
ARTICLE

Calculation of Commutation Failure Overvoltage in High-Voltage Direct Current Transmission Terminal Systems with Grid-Forming Renewable Energy Sources
1 Mechanical and Electrical Engineering, Chizhou University, Chizhou, 247000, China
2 NARI Technology Co., Ltd., Nanjing, 210003, China
3 Electrical Engineering, Southeast University, Nanjing, 210018, China
4 State Grid Ningxia Electric Power Co., Ltd., Wuzhong Power Supply Company, Wuzhong, 751199, China
* Corresponding Author: Bo Yao. Email:
Energy Engineering 2025, 122(10), 4225-4243. https://doi.org/10.32604/ee.2025.066738
Received 16 April 2025; Accepted 12 August 2025; Issue published 30 September 2025
 View Full Text
 Download PDF
Abstract
The integration of large-scale new energy and high-capacity DC transmission leads to a reduction in system inertia. Grid-forming renewable energy sources (GF-RES) has a significant improvement effect on system inertia. Commutation failure faults may cause a short-term reactive power surplus at the sending end and trigger transient overvoltage, threatening the safe and stable operation of the power grid. However, there is a lack of research on the calculation method of transient overvoltage caused by commutation failure in high-voltage DC transmission systems with grid-forming renewable energy sources integration. Based on the existing equivalent model of high-voltage DC transmission systems at the sending end, this paper proposes to construct a model of the high-voltage DC transmission system at the sending end with grid-forming renewable energy sources. The paper first clarifies the mechanism of overvoltage generation, then considers the reactive power droop control characteristics of GF-RES, and derives the transient voltage calculation model of the DC transmission system with GF-RES integration. It also proposes a calculation method for transient overvoltage at the sending-end converter bus with GF-RES integration. Based on the PSCAD/EMTDC simulation platform, this paper builds an experimental simulation model. By constructing three different experimental scenarios, the accuracy and effectiveness of the proposed transient overvoltage calculation method are verified, with a calculation error within 5%. At the same time, this paper quantitatively analyzes the impact of grid strength, new energy proportion, and rated transmission power on transient overvoltage from three different perspectives.Keywords
Compared to traditional direct current (DC) transmission methods, high-voltage direct current (HVDC) power transmission demonstrates significant advantages, including extended transmission distances, reduced line losses, and enhanced transmission capacity, making it widely adopted in long-distance, high-capacity power transmission projects [1]. Commutation failures represent a common fault in HVDC transmission systems [2]. During such failures, substantial fluctuations occur in the reactive power exchange between the converter and power grid, resulting in transient overvoltage at the converter bus, which poses serious risks to the power grid’s safe and stable operation [3].
The existing literature primarily addresses transient overvoltage suppression methods in response to commutation failure-induced issues. Reference [4] proposed a fault suppression strategy for commutation failure in HVDC systems. This strategy centers on the disturbance of the AC bus voltage within the converter station, revealing a significant correlation between the instantaneous voltage disturbance of the AC bus caused by faults and commutation failure in HVDC transmission systems. Reference [5] establishes mathematical correlations among rectifier reactive power consumption, DC voltage, and DC current during commutation failures, examining the mechanisms of transient overvoltage generation and proposing a constant reactive power control method. This approach enhances rectifier reactive power consumption while reducing alternating current (AC)-DC system reactive power exchange, effectively suppressing transient overvoltage. Additional research focuses on minimizing rectifier reactive power absorption through various perspectives, simultaneously increasing the inverter turn-off angle’s minimum value to prevent potential commutation failures [6]. Reference [7] proposed a collaborative optimization method for DC and wind power control parameters, analyzed the influence mechanism of DC and wind power control parameters on the instantaneous voltage at the sending end, studied the impact of control parameters on the DC control system, and constructed a multi-objective and multi-device collaborative optimization model for high-voltage DC transmission systems considering the grid connection of large-scale wind power. The validity and accuracy of the method have been verified. Furthermore, Reference [8] constructed a four-machine two-area system, which included a direct-drive wind turbine unit. By establishing different fault models, it studied the dynamic characteristics and “virtual” attack angle characteristics of the wind turbine system during high-voltage penetration under various conditions, and by studying the “virtual” power angle of the phase-locked loop (PLL), it investigated the transient stability of the entire system. Reference [9] analyzed the mechanism of overvoltage caused by commutation failure and established the power operation area of the sending-end hybrid cascaded high-voltage direct current transmission system considering the transient overvoltage constraint. Thus, a transient overvoltage suppression strategy was proposed, which can fundamentally reduce the reactive power surplus of the sending-end system and ultimately suppress the transient overvoltage. Reference [10] proposed a quantitative calculation and suppression strategy, derived a calculation method for transient overvoltage at the sending end, based on the upper limit of transient overvoltage at the sending end, obtained the minimum values of DC current and reactive power consumption of the rectifier, and designed a coordinated control strategy for suppressing overvoltage, effectively suppressing the transient overvoltage while avoiding subsequent commutation failures. Reference [11] analyzed the transient voltage characteristics of the rectifier station on the inverter side in case of commutation failure, and examined the influence of high-voltage direct current transmission on the AC bus voltage of the rectifier station. Thus, a dynamic model of the AC bus voltage of the rectifier station under the coupling of AC/DC systems was established, effectively suppressing the transient overvoltage.
To control transient overvoltage during commutation failures, accurate calculation of the transient overvoltage is essential. Consequently, the calculation of transient overvoltage caused by DC commutation failures has garnered significant scholarly attention. Reference [12] examines the reactive power change characteristics of the sending-end converter during commutation failure recovery based on the traditional equivalent model of sending-end DC systems, derives the transient overvoltage calculation formula, and quantitatively analyzes its influencing factors. Additionally, some researchers have simplified the equivalent model of sending-end systems, considering the voltage-dependent characteristics of reactive power compensation devices to calculate transient overvoltage during faults [13]. Reference [14] develops an equivalent model of the ultra-high voltage direct current (UHVDC) sending end with wind turbines, thoroughly analyzes power change characteristics among the converter station, filter bank, and wind turbine, and derives the transient overvoltage calculating formula. Reference [15] based on the structural characteristics of actual AC/DC hybrid power transmission projects in China, through simplifying the four-machine two-area system, summarized the characteristics of transient overvoltage, derived the calculation formula for transient overvoltage, described the fault crossing characteristics, and proposed a fast calculation method for transient overvoltage trajectories based on network transformation and improved Euler method.
Few studies address the calculation method for transient overvoltage caused by DC blocking. Reference [16] presents a calculation method for converter bus transient overvoltage at DC blocking initiation based on sub-transient power flow analysis of phase modifier suppression. Furthermore, Reference [17] establishes the relationship between transient overvoltage and resonance frequency based on post-DC blocking resonance circuits, addressing the potential absence of real solutions in transient overvoltage calculations under extremely low short-circuit ratio conditions. Reference [18] proposed a peak expression for transient overvoltage caused by DC blocking and commutation failure. The proposed method does not require modeling of the complex AC-DC system, but it neglects the interaction between the high-voltage DC system and the other systems.
With the integration of large-scale renewable energy sources and high-capacity DC power transmission, system equivalent inertia decreases, reducing resilience to fault impacts such as commutation failures. Grid-forming renewable energy sources (GF-RES) can enhance system resilience to reactive power impacts through active voltage and frequency support. However, current research rarely examines DC commutation failure-induced transient overvoltage in systems connected to GF-RES.
This paper initially explains the generation mechanisms of commutation failures and transient overvoltage, establishes a DC system equivalent model at the sending end incorporating GF-RES, considers the reactive power-voltage droop characteristics of GF-RES, and proposes a calculation method for converter bus transient overvoltage in sending-end DC systems with GF-RES. The paper concludes with model verification using the PSCAD/EMTDC simulation platform to validate the accuracy and effectiveness of the proposed calculation method, followed by an analysis of transient overvoltage influencing factors.
2 Equivalent Model of the HVDC Sending-End System
2.1 Generation Mechanism of Transient Overvoltage
In a converter, commutation failure occurs when either the valve intended for turn-off fails to recover its blocking capability under reverse voltage within a specified period, or when commutation remains incomplete, resulting in backward commutation from the intended conducting valve to the intended blocking valve upon positive valve voltage [19]. This phenomenon is characterized by an extinction angle γ falling below the preset minimum limit γmin.
During commutation failure events, the sending-end converter station consumes significant reactive power, causing voltage reduction in the sending-end AC system [20]. During recovery, the controller regulation decreases the triggering angle, reducing the converter station’s reactive power consumption. Simultaneously, operational AC filters introduce excessive reactive power into the AC grid, creating an imbalance that generates transient overvoltage at the sending end [21].
2.2 Equivalent Modeling of HVDC Sending-End System
Traditional transient overvoltage calculation models typically represent the AC system as a voltage source with internal impedance, while AC filters connect in parallel to the converter bus [22], as shown in Fig. 1.
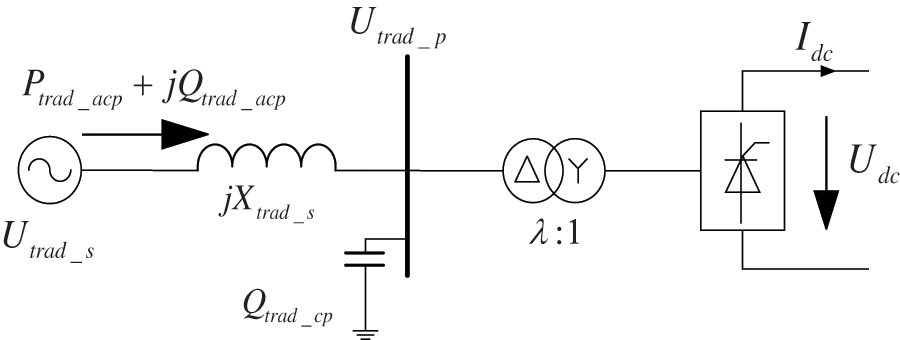
Figure 1: Traditional HVDC terminal equivalent circuit model
In Fig. 1:
• Utrad_s represents the root mean square (RMS) value of the ideal voltage source phase voltage;
• Xtrad_s represents the equivalent system reactance;
• Utrad_p represents the RMS value of the converter bus phase voltage;
• Qtrad_cp represents the reactive power compensation capacity;
• Ptrad_acp and Qtrad_acp represent the active and reactive power on the transmission line;
• Udc represents the DC voltage;
• Idc represents the DC current.
Fig. 1 illustrates the calculation method for transient overvoltage in conventional HVDC transmission systems. However, the integration of grid-forming renewable energy systems presents unique control characteristics that cannot be adequately modeled using synchronous generator equivalents. Consequently, this paper implements an alternative transient overvoltage calculation model.
3 Grid-Forming Integrated HVDC Sending-End Equivalent Model
The integration of grid-forming renewable energy sources introduces rapid reactive power and voltage regulation capabilities that differ fundamentally from traditional synchronous generators’ excitation voltage regulation systems. Furthermore, the reactive voltage control of grid-forming sources exhibits dynamic interactions with transient overvoltage fluctuations. As depicted in Fig. 2, the equivalent model of the HVDC sending-end system incorporating grid-forming sources represents the grid-forming renewable energy source as an independent voltage source with droop characteristics, while maintaining consistency with the conventional model for other components.
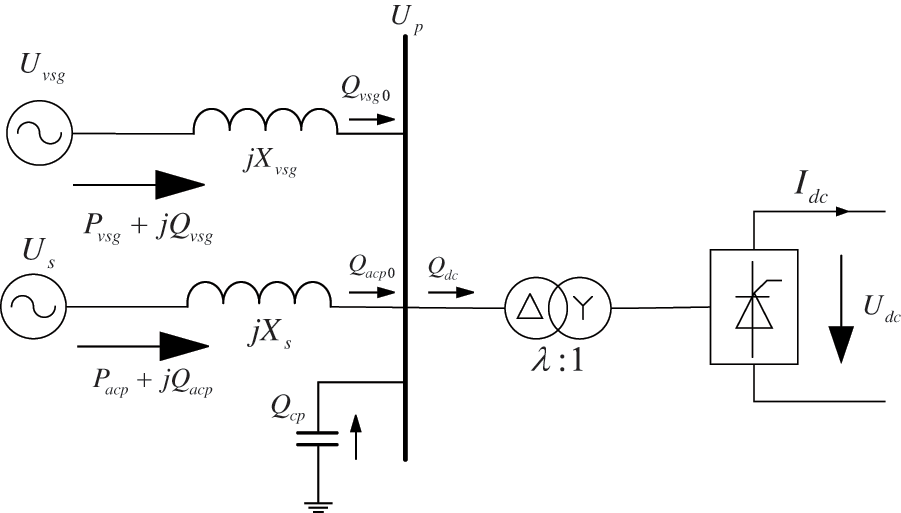
Figure 2: Equivalent circuit model of the HVDC feeder for grid-forming renewable energy access
3.1 Steady-State Voltage Calculation
The calculation of transient overvoltage requires the initial determination of the steady-state voltage under normal system operation. The calculation circuit is shown in Fig. 2.
In Fig. 2:
• Us and Uvsg represent the effective phase voltages for the equivalent AC power source branch and the grid-forming renewable energy branch, respectively;
• Xs and Xvsg denote the equivalent reactances of the AC power source branch and the grid-forming renewable energy branch, respectively;
• Up indicates the effective value of phase voltage at the converter bus;
• Qcp corresponds to the reactive power compensation capacity;
• Pacp and Qacp are the active and reactive power transmitted through the AC power source branch;
• Pvsg and Qvsg represent the single-phase active and reactive power transmitted through the grid-forming renewable energy branch;
• Qacp0 and Qvsg0 refer to the reactive power injected into the system from the AC power source branch and the grid-forming renewable energy branch, respectively.
During ideal steady-state operation, the reactive power Qcp generated by the reactive power compensation device in the rectifier station maintains approximate equilibrium with the reactive power Qdc consumed in the rectifier station. Consequently, the reactive power exchange capacity between the DC system and the AC system at the sending end typically approaches zero [23], resulting in:
The reactive power loss occurring in the equivalent reactance of both the equivalent AC power source branch and grid-forming renewable energy branch can be calculated using the following formula:
In Eqs. (2) and (3), ΔQvsg and ΔQacp denote the reactive power losses in the equivalent reactances of the grid-forming renewable energy branch and the AC power source branch, respectively. Consequently, Eq. (1) can be expressed as:
By substituting Eqs. (2) and (3) into Eq. (4), the following expression is obtained:
During steady-state operation, when the HVDC transmission power reaches significant levels, the reactive power consumed by the equivalent reactances on the branches becomes considerable. Consequently, the voltage drop resulting from this reactive power consumption requires attention. Under these conditions, the converter bus voltage can be expressed through the following equations when analyzing the grid-forming source branch and the equivalent AC power source branch independently:
Combining Eqs. (5)–(7) yields a system of simultaneous equations:
In this system of equations, the known parameters include: the effective AC power supply voltage Us, the effective grid-forming renewable energy voltage Uvsg, the equivalent reactance Xs on the AC power supply branch, and the equivalent reactance Xvsg on the grid-forming renewable energy branch. The variables to be determined are the single-phase reactive power Qacp transmitted through the AC power supply branch, the single-phase reactive power Qvsg transmitted through the grid-forming renewable energy branch, and the steady-state voltage Up of the converter bus. The simultaneous solution of these equations determines the steady-state voltage Up of the converter bus.
3.2 Transient Overvoltage Calculation
During commutation failure-induced transient overvoltage, the system experiences substantial changes in voltage and reactive power. To better illustrate the physical quantities during this transient process, Fig. 2 is redrawn as Fig. 3. Here:
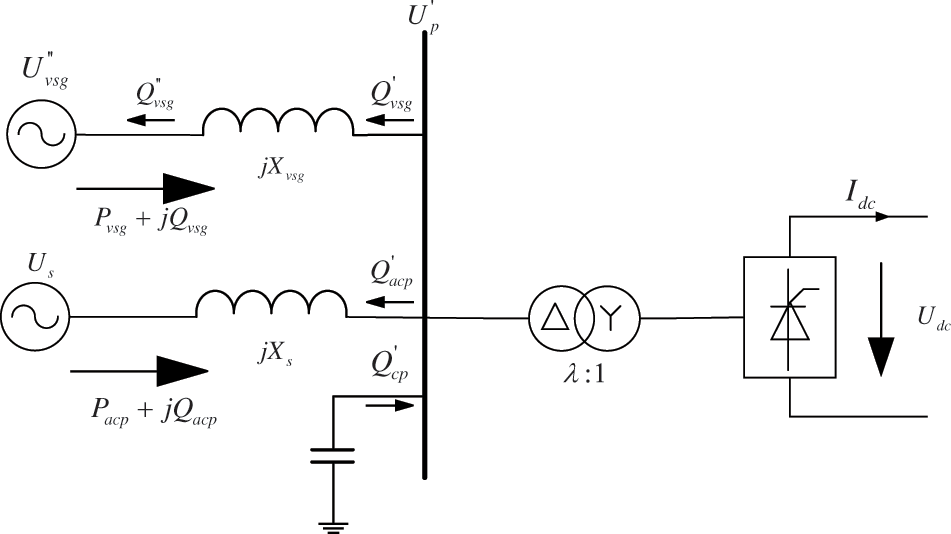
Figure 3: Equivalent model of the HVDC commutation failure terminal with renewable energy grid access
• Q′cp represents the reactive power supplied by the reactive power compensation device during commutation failure.
• Q′vsg indicates the reactive power flowing from the grid-forming renewable energy branch to Xvsg during commutation failure.
• Q′′vsg denotes the reactive power absorbed by GF-RES during commutation failure.
Additionally, owing to the reactive power droop characteristics of grid-forming sources, the voltage of grid-forming units varies during transient conditions. Specifically, U′′vsg is defined as the transient overvoltage of grid-forming renewable energy during commutation failure.
Under transient conditions, the voltage-reactive power relationship for grid-forming renewable energy branches can be expressed considering their voltage-reactive power droop characteristics [24]:
where:
• K represents the reactive power droop coefficient;
• Uvsgn indicates the rated voltage of the grid-forming renewable energy source;
• Q′′vsg signifies the reactive power absorbed by the grid-forming renewable energy source during commutation failure;
• Qvsgn denotes the reactive power setpoint of the grid-forming renewable energy source.
Given that GF-RES connections typically operate with zero reactive power output (i.e., their reactive power setpoint equals 0), Eq. (9) can be simplified into:
The reactive power generated by the system’s reactive power compensation device exhibits variation in response to voltage fluctuations. When the voltage at the converter bus increases, the reactive power output from the compensation device increases proportionally [25]. Consequently, during a commutation failure fault in the system, the mathematical expression for the reactive power output of the compensation device can be represented as:
In the equation:
• Up represents the transient overvoltage value at the converter bus;
• Up denotes the steady-state voltage value at the converter bus;
• Qcp indicates the reactive power generated by capacitors under steady-state conditions.
During transient processes, the reactive power consumed by the equivalent reactance of the grid-forming renewable energy branch is expressed as:
For grid-forming renewable energy branches, the reactive power balance equation is:
In the equation:
• Q′vsg represents the reactive power flowing towards Xvsg from the grid-forming renewable energy branch during the commutation failure process;
• Q′′vsg denotes the reactive power absorbed by the grid-forming renewable energy source during the commutation failure process.
During the commutation failure event, the system’s reactive power maintains an equilibrium equation:
In the equation:
• Q′acp represents the reactive power flow from the AC power supply branch to Xs during commutation failure;
• Q′cp indicates the reactive power generated by the reactive power compensation devices during commutation failure;
• Q′r represents the minimum reactive power consumed by the rectifier station during commutation failure, where Q′r = 0.4Qcp [12].
Through the substitution of Eqs. (10)–(13) into Eq. (14), the reactive power balance equation for the system can be expressed as follows:
During transient processes, the converter bus voltage can be calculated independently through the grid-forming power source branch and the AC grid branch. Specifically, the grid-forming renewable energy branch yields:
The translation may be expressed as:
In the equation:
• ΔU′′vsg and ΔUs represent the longitudinal voltage drop components along the two branches;
• δU′′vsg and δUs indicate the transverse voltage drop components along the two branches.
During transient processes, power transfer between the converter station and the AC system remains minimal. For computational simplification, the transverse voltage components can be disregarded. Under these circumstances, the transient overvoltage calculation formula for the converter bus in the grid-forming renewable energy branch simplifies from Eq. (16) to:
The computational expression for transient overvoltage at the converter bus in the AC power supply branch is subsequently modified to:
Through simultaneous solution of Eqs. (13) and (18), we obtain:
The transient overvoltage U′′vsg of the grid-forming power source can be derived from Eq. (20) as:
Through the combination of Eqs. (15), (19), and (21), the following system of simultaneous equations emerges:
In this system of equations, the known quantities comprise: the effective AC power supply voltage Us, the effective steady-state voltage Uvsg of the grid-forming renewable energy branch, the equivalent reactance Xs on the AC power supply branch, the equivalent reactance Xvsg on the grid-forming renewable energy branch, the reactive power droop coefficient K, the steady-state voltage Up of the converter bus, the voltage set-point Uvsgn of the grid-forming renewable energy branch, and the reactive power compensation capacity Qcp. The three unknown quantities are the transient overvoltage U′′vsg of the grid-forming renewable energy branch during the commutation failure, the reactive power Q′acp flowing into the AC power supply branch during the commutation failure, and the transient overvoltage U′p of the converter bus. Based on these three equations, the transient overvoltage value of the converter bus can be determined.
We rearrange Eq. (22) into the form of a quartic equation in one variable:
The corresponding expressions for each term are presented as follows:
This study employs the Tianheng Formula methodology to solve Eq. (22). The discriminant for multiple roots in the Tianheng Formula is:
The general discriminant of the Tianheng Formula can be expressed as:
For Δ > 0, the analytical expression is represented by:
For cases where Δ < 0, the analytic expression is represented by:
Following the derivation of the transient overvoltage expression through the Tianheng Formula, an analysis of various parameter influences on transient overvoltage becomes possible, enabling a quantitative assessment of transient overvoltage characteristics.
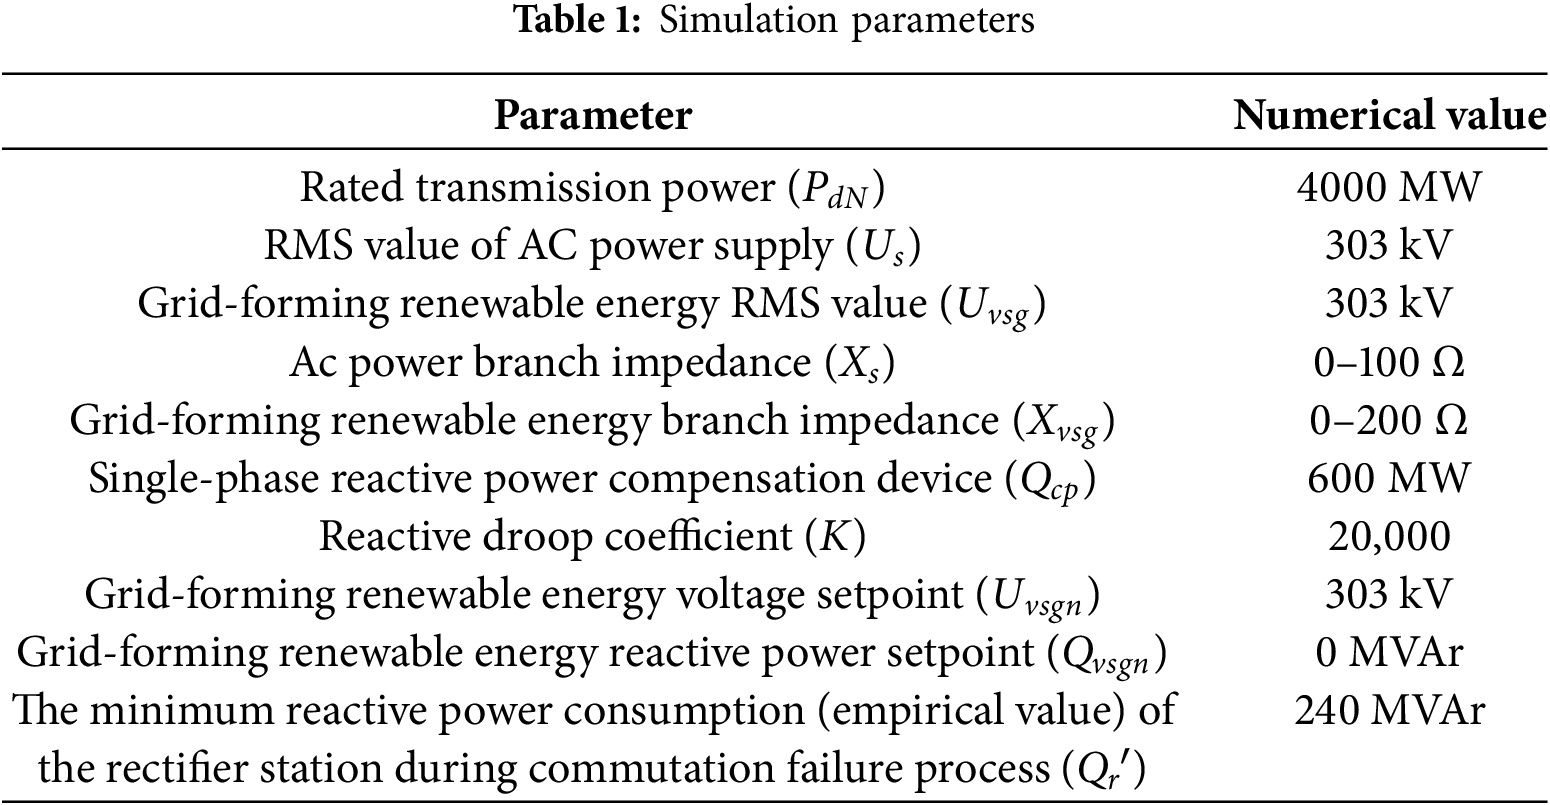
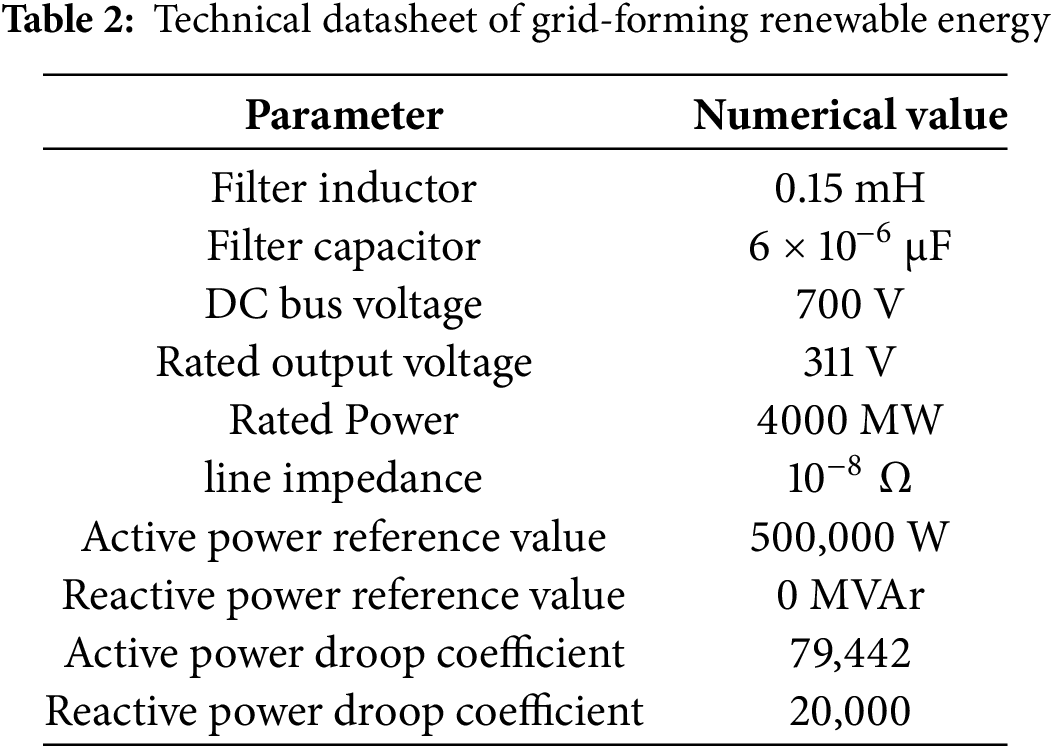
To verify the accuracy and reliability of the proposed transient overvoltage calculation method, a simulation model was developed in PSCAD/EMTDC. The steady-state operation validation results are presented in Fig. 4. The system’s rated transmission capacity is set to 4000 MW, with a simulation step size configured at 50 × 10−6 s. The compilation environment utilizes Intel® Visual Fortran Compiler XE 12.0.5.221. For high-voltage direct current (HVDC) transmission, the LCC-HVDC (Line-Commutated Converter HVDC) configuration is selected. A phase-A ground fault is introduced at the inverter side exit for 100 ms to simulate commutation failure under fault conditions. The detailed simulation parameters are documented in Tables 1 and 2.
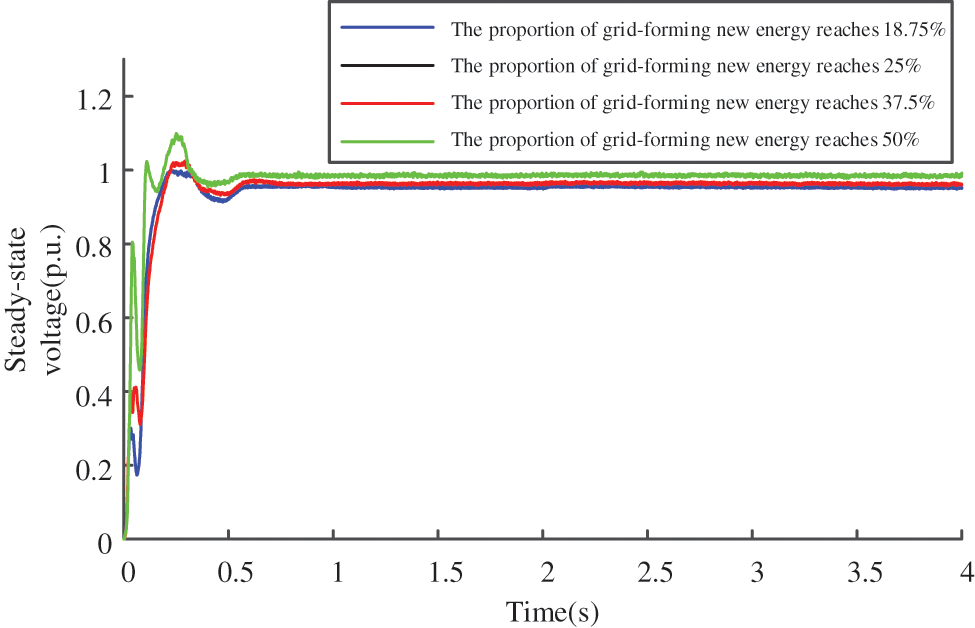
Figure 4: System steady-state operation verification diagram
The accuracy of the formula was verified through three distinct experimental scenarios.
Scenario 1: The impedance Xs of the AC source branch was configured at 30 Ω, while the rated transmission power was maintained at 4000 MW. The base voltage values for both the AC power supply and GF-RES were established at 525 kV. The experimental data set was expanded by modifying the proportion of GF-RES. Fig. 5 displays the resulting commutation failure voltage waveforms, with different colored curves representing various proportions of GF-RES.
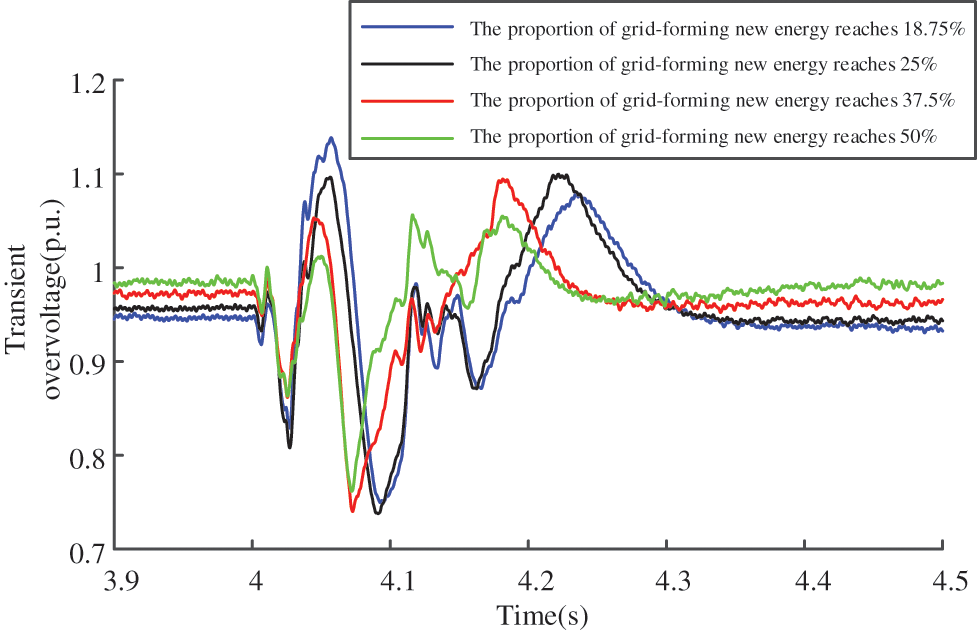
Figure 5: Voltage waveform of the system during commutation failure in Scenario 1
The maximum voltage during the transient process was extracted from Fig. 5. Table 3 presents the error comparison between the simulated and analytically calculated values of the transient overvoltage.

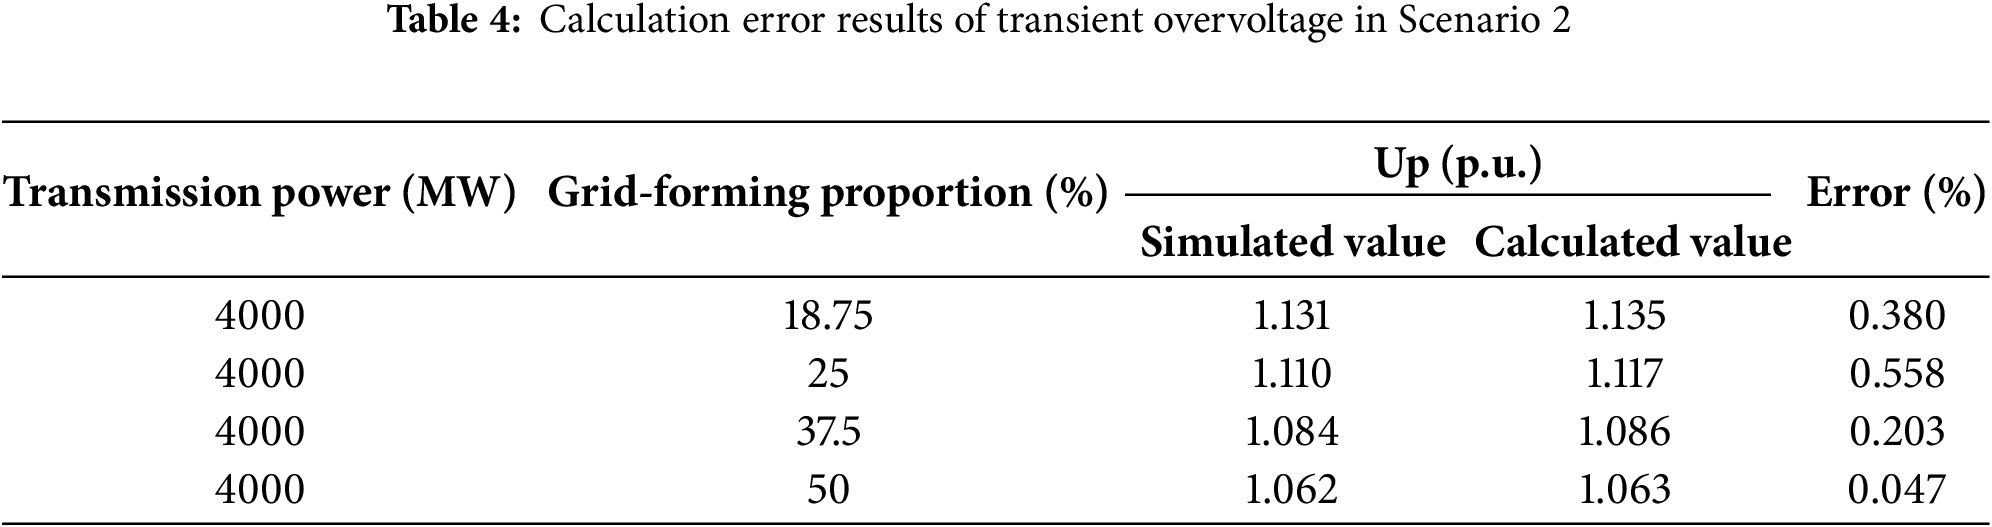
Scenario 2: The impedance Xs of the AC source branch was configured at 28 Ω, while other parameters were consistent with Scenario 1. The commutation failure voltage waveforms are illustrated in Fig. 6, where distinct color curves represent different proportions of GF-RES.
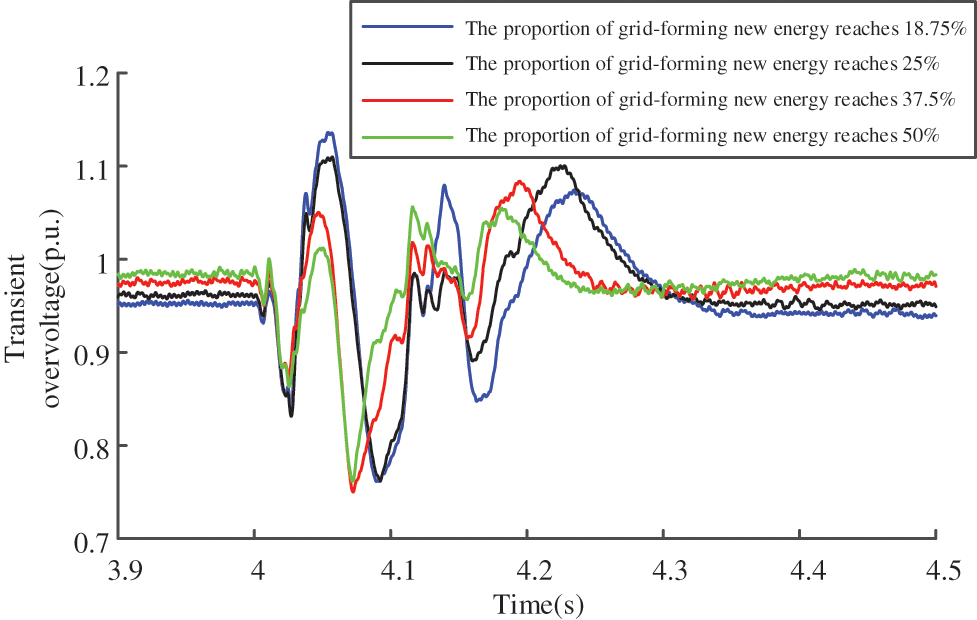
Figure 6: Voltage waveform of the system during commutation failure in Scenario 2
The peak voltage during the transient process was extracted from Fig. 6. Table 4 presents the comparative analysis between the simulated and analytically calculated values of the transient overvoltage, including their error margins.
Scenario 3: With the AC power supply branch impedance maintained at Xs = 25 Ω and the base values of the AC power supply and the grid-forming renewable energy system fixed at 525 kV, the experimental investigation was expanded by modifying the rated transmission power. The voltage waveforms observed during commutation failure are illustrated in Fig. 7, where distinct colored curves represent different rated transmission power conditions.
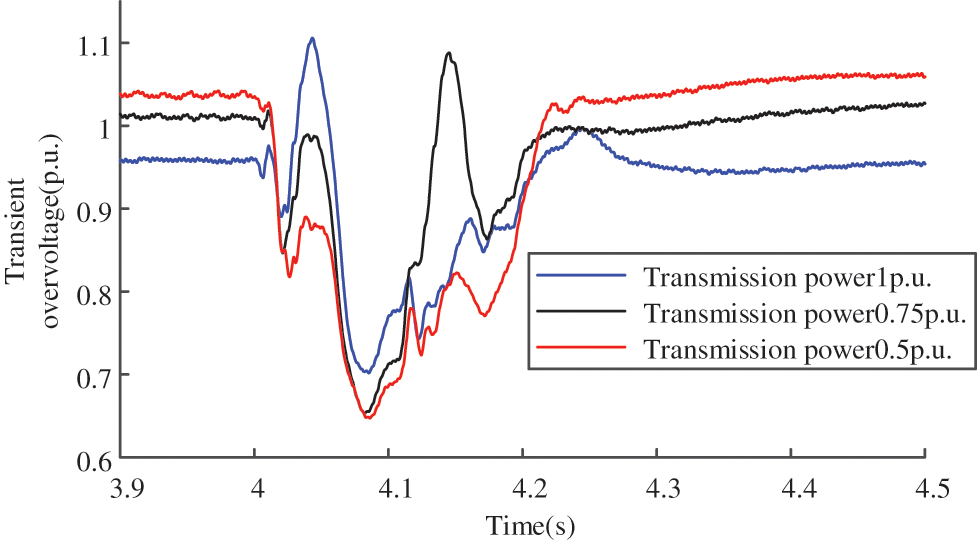
Figure 7: Voltage waveform of the system during commutation failure in Scenario 3
The peak voltage during the transient process was extracted from Fig. 7. A comparative analysis of the error between simulated and analytically calculated transient overvoltage values is summarized in Table 5.
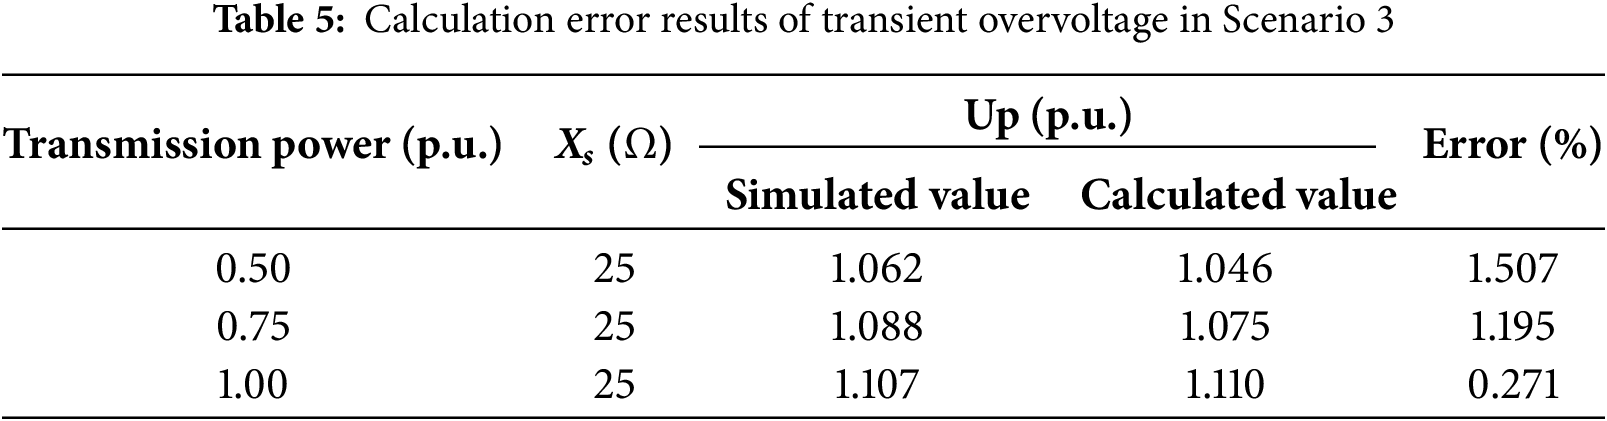
As demonstrated in Tables 3–5, all computational errors remain within 3%, validating both the accuracy and precision of the proposed transient overvoltage calculation methodology.
Based on the transient overvoltage calculation Formula (22) established in this paper, the calculated transient overvoltage values are influenced by parameters including the AC power source branch impedance, proportion of grid-forming-based renewable energy units, and rated transmission power capacity. This study examines different scenarios by adjusting these three parameters to analyze their effects on transient overvoltage characteristics.
4.1 Transient Overvoltage Analysis of Converter Bus under Different Grid Strength Conditions
Select scenarios with fixed penetration levels of grid-forming renewable energy (e.g., 18.75%, 25%, 37.5%, 50%, and 75%). Under each penetration level, vary the branch reactance (grid strength) of AC power supply paths [20] to analyze its influence on transient overvoltage.
As illustrated in Fig. 8, under five different penetration levels of GF-RES, higher reactances in the AC source branch correspond to weaker system strengths, resulting in more severe transient overvoltage during commutation failure. Conversely, lower reactance values produce milder transient overvoltage under identical fault conditions.
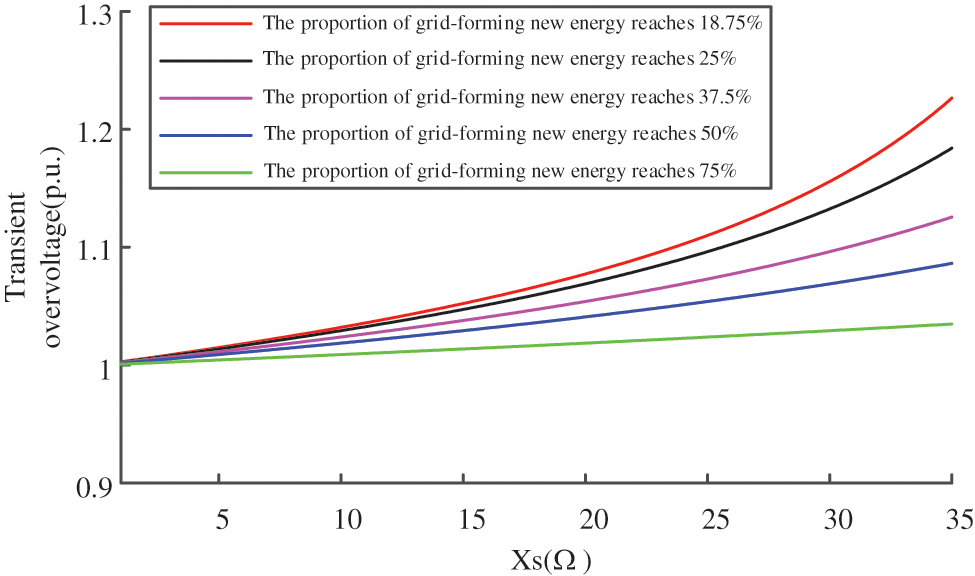
Figure 8: Transient overvoltage waveform diagram under different conditions of AC power supply branch impedance
4.2 Transient Overvoltage Analysis of Converter Bus under Different Penetration Levels of GF-RES
In scenarios where the AC power source branch impedance (Xs) is set to specific values (e.g., 30, 28, 25, 22, and 19 Ω), the impact of penetration levels of grid-forming renewable energy on transient overvoltage requires systematic analysis. For each fixed Xs value, the proportion of GF-RES (such as inverter-based resources with grid-forming capabilities) should be adjusted to evaluate their dynamic interactions and transient overvoltage responses under different network configurations. This analysis should focus on quantifying overvoltage magnitudes, durations, and spatial distribution patterns caused by renewable energy penetration variations.
As shown in Fig. 9, with increasing proportions of GF-RES, the transient overvoltage magnitude caused by commutation failure events decreases. This demonstrates that grid-forming renewable energy provides voltage support to the power grid, thereby enhancing the system’s resilience against reactive power impacts.
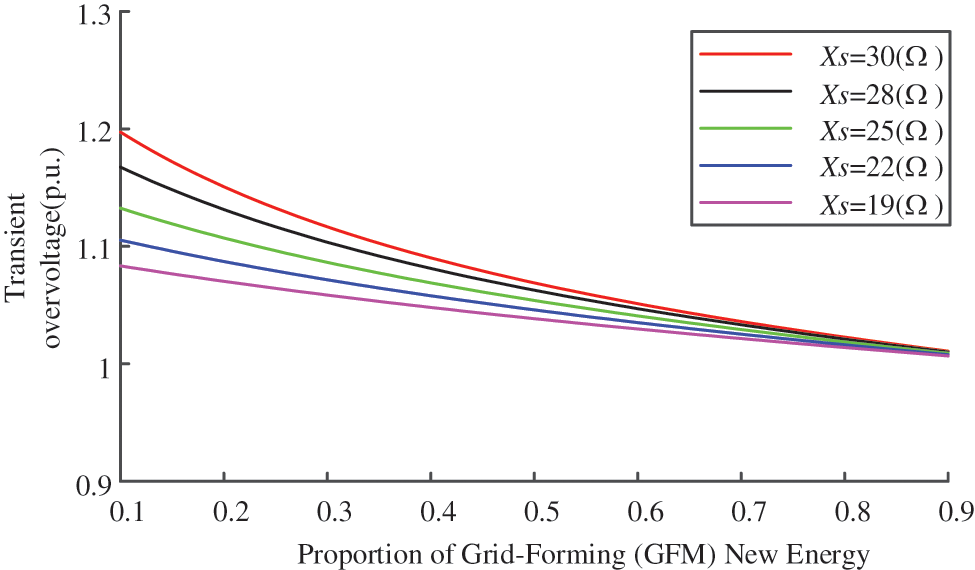
Figure 9: Transient overvoltage waveform under different conditions of grid-forming renewable energy
4.3 Analysis of Transient Overvoltage on Converter Bus under Different Rated Transmission Power Levels
Under a constant proportion of GF-RES (18.75%) and fixed AC source branch impedance (with reactance values Xs of 30, 28, 25, 22, and 19 Ω), transient simulation experiments were conducted at varying rated transmission power levels. The analysis examined the impact of different rated power capacities on transient overvoltage phenomena.
As shown in Fig. 10, when the rated transmission power increases while maintaining a constant proportion of GF-RES and fixed AC source branch impedance, the transient overvoltage exhibits a positive correlation with the power level. Higher DC transmission power requires more reactive power compensation from filters. During commutation failure recovery periods, the surplus reactive power remaining in the filter system leads to increased reactive power influx into the AC grid, thereby exacerbating the transient overvoltage caused by commutation failures. Consequently, under weak system strengths, selecting appropriate rated transmission power parameters is crucial.
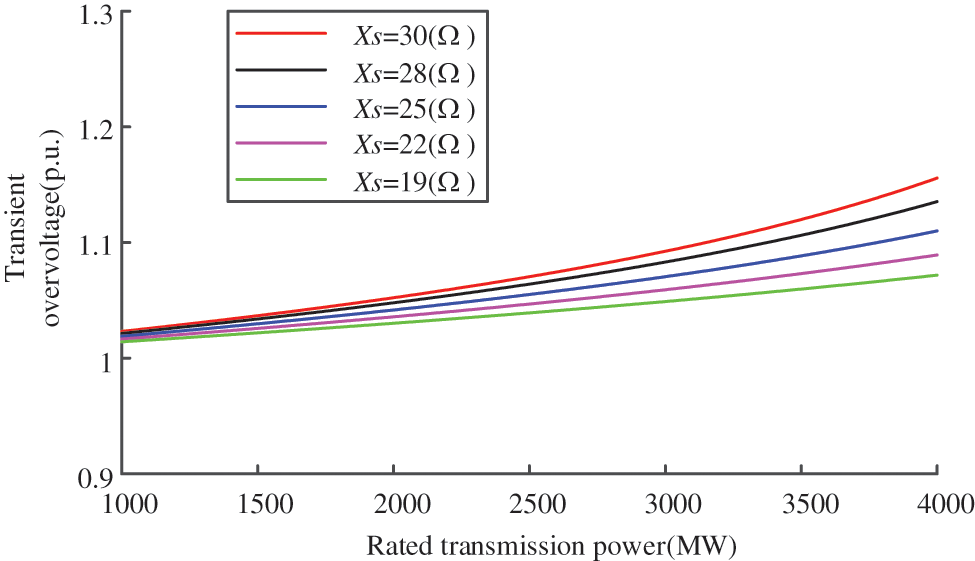
Figure 10: Transient overvoltage waveform under different rated transmission power
This paper proposes a calculation method for transient overvoltage caused by commutation failure in the high-voltage direct current transmission system for grid-connected new energy. The transient characteristics of reactive power consumption changes of the filter and converter station during the commutation failure process are considered in the paper, the drooping control characteristics of grid-connected new energy are taken into account, and the influencing factors of transient overvoltage in the high-voltage direct current system for grid-connected new energy are quantitatively analyzed. The conclusions obtained are as follows:
(a) Under conditions where the proportion of grid-forming renewable energy transmitted power remains constant, increases in AC source branch impedance result in weaker grid strengths. This leads to greater reactive power impacts during commutation failures and thus more pronounced transient overvoltage phenomena in the system.
(b) Under constant AC source branch impedance, when the proportion of renewable energy transmission power increases, the magnitude of transient overvoltage resulting from commutation failure decreases, while the system’s overall resilience to reactive power disturbances is enhanced.
(c) When the transmission power of grid-forming renewable energy systems and the impedance of AC power supply branches remain constant, an increase in rated transmission power during commutation failure leads to greater residual reactive power compensation from filters being transferred to the AC system, consequently intensifying the overvoltage severity.
Acknowledgement: The work presented in this paper gratefully acknowledges technical support from the School of Electrical and Mechanical Engineering at Chizhou College (Anhui Province), the School of Electrical Engineering at Southeast University (Jiangsu Province), State Grid Nari Technology Co., Ltd. and State Grid Ningxia Electric Power Co., Ltd. Wuzhong Power Supply Company.
Funding Statement: This work was supported by Key Natural Science Research Projects of Colleges and Universities in Anhui Province (2022AH051831).
Author Contributions: The authors confirm contribution to the paper as follows: Formal analysis, methodology, software, validation, visualization, writing—original draft and writing—review & editing: Weibing Xu; Conceptual ization, data curation, funding acquisition, methodology, project administration, supervision: Bo Yao; Methodology and project administration: Xiangjun Quan; Funding acquisition and project administration: Xunyou Zhang; Software, funding acquisition and writing—original draft: Ning Zou; Formal analysis and software: Shuo Liu; Funding acquisition and supervision: Jia Wang; Funding acquisition and data analysis: Jiansuo Zhang. All authors reviewed the results and approved the final version of the manuscript.
Availability of Data and Materials: The authors confirm that the data supporting the findings of this study are available within the article.
Ethics Approval: Not applicable.
Conflicts of Interest: The authors declare no conflicts of interest to report regarding the present study.
Nomenclature
| Utrad_s | Effective root mean square (RMS) value of phase voltage in alternating current (AC) power supply |
| Xtrad_s | Equivalent reactance |
| Utrad_p | RMS value of the bus phase voltage |
| Qtrad_cp | Reactive compensation capacity |
| Ptrad_acp | Active power on transmission lines |
| Qtrad_acp | Reactive power on transmission lines |
| Udc | Direct current (DC) voltage |
| Idc | DC current |
| Us | RMS value of the equivalent AC power supply phase voltage |
| Uvsg | RMS value of the phase voltage of grid-forming renewable energy |
| Xs | Equivalent reactance on the AC power supply branch |
| Xvsg | Equivalent reactance on grid-forming renewable energy branch circuits |
| Qcp | Reactive compensation capacity |
| Pacp | Active power on transmission lines |
| Qacp | Reactive power on transmission lines |
| Pvsg | Active power transmitted on the branch lines of grid-forming renewable energy |
| Qvsg | Reactive power transmitted on the branch lines of grid-forming renewable energy |
| Qacp0 | Reactive power flowing into the system from the AC power supply branch |
| Qvsg0 | Reactive power flowing into the system from the grid-forming renewable energy branch circuits |
| ΔQvsg | Reactive power loss of equivalent reactance on the grid-forming renewable energy branch circuits |
| ΔQacp | Reactive power loss of equivalent reactance on the AC power supply branch |
| Q′cp | Reactive power generated by the reactive power compensation device during the com-mutation failure process |
| Q′vsg | Reactive power flowing to Xvsg on the grid-forming renewable energy branch during the commutation failure process |
| Q′′vsg | Reactive power absorbed by grid-forming renewable energy during the commutation failure process |
| U′′vsg | Transient voltage of grid-forming renewable energy during the commutation failure process |
| K | Reactive power sag coefficient |
| Uvsgn | Voltage rating of grid-forming renewable energy |
| Q′′vsg | Reactive power absorbed by grid-forming renewable energy during the commutation failure process |
| Qvsgn | Reactive power setting values for grid-forming renewable energy |
| U′p | Transient voltage value of the converter busbar |
| Up | Steady-state voltage value of the converter busbar |
| Q′acp | Reactive power flowing to Xs on the AC power supply branch during the commutation failure process |
| Q′r | Minimum reactive power consumed by the rectifier station during the commutation failure process |
| ΔU′′vsg | Longitudinal component of the voltage drop on the grid-forming renewable energy branch during the commutation failure process |
| ΔUs | Longitudinal component of the voltage drop on the AC power branch during the com-mutation failure process |
| δU′′vsg | Transverse component of the voltage drop on the grid-forming renewable energy branch during the commutation failure process |
| δUs | Transverse component of the voltage drop on the AC power branch during the com-mutation failure process |
References
1. Wang Q, Liu K, Wang L. Suppression measures of commutation failure in MIDC transmission systems. J Eng. 2019;2019(16):1328–32. doi:10.1049/joe.2018.8757. [Google Scholar] [CrossRef]
2. Rahimi E, Gole AM, Davies JB, Fernando IT, Kent KL. Commutation failure analysis in multi-infeed HVDC systems. IEEE Trans Power Deliv. 2011;26(1):378–84. doi:10.1109/TPWRD.2010.2081692. [Google Scholar] [CrossRef]
3. Mirsaeidi S, Dong X, Said DM. A fault current limiting approach for commutation failure prevention in LCC-HVDC transmission systems. IEEE Trans Power Deliv. 2019;34(5):2018–27. doi:10.1109/TPWRD.2019.2907558. [Google Scholar] [CrossRef]
4. Zhao D, He S, Huang H, Han Z, Cui L, Li Y. Strategy for suppressing commutation failures in high-voltage direct current inverter station based on transient overvoltage. Energies. 2024;17(5):1094. doi:10.3390/en17051094. [Google Scholar] [CrossRef]
5. Yin C, Li F. Reactive power control strategy for inhibiting transient overvoltage caused by commutation failure. IEEE Trans Power Syst. 2021;36(5):4764–77. doi:10.1109/TPWRS.2021.3063276. [Google Scholar] [CrossRef]
6. Liang W, Shen C, Sun H, Xu S. Overvoltage mechanism and suppression method for LCC-HVDC rectifier station caused by sending end AC faults. IEEE Trans Power Deliv. 2024;39(2):1299–302. doi:10.1109/TPWRD.2022.3184121. [Google Scholar] [CrossRef]
7. Li Y, Zeng Y, Zhang W, Qin C. Coordinated optimization method for suppressing transient overvoltage caused by HVDC commutation failure considering large wind power integration. Energy Rep. 2023;9(2):1171–82. doi:10.1016/j.egyr.2022.12.037. [Google Scholar] [CrossRef]
8. Liu X, Zhang C, Lin Y, Zhu Y. Analysis of the influence of high voltage ride-through characteristics on transient stability of wind turbines. In: Second International Conference on Energy, Power, and Electrical Technology (ICEPET 2023); 2023 Mar 10–12; Kuala Lumpur, Malaysia. 203 p. doi:10.1117/12.3004614. [Google Scholar] [CrossRef]
9. Liu J, Li F, Yin C, Chen R, Han L, Shi Y. Power operation region modeling and transient overvoltage suppression strategy of hybrid cascaded HVDC. Int J Electr Power Energy Syst. 2025;169(1):110803. doi:10.1016/j.ijepes.2025.110803. [Google Scholar] [CrossRef]
10. Liu D, Li F, Liu T, Zhang S, Jiang S. Quantitative calculation method and its overvoltage suppression strategy for sending-end transient voltage of LCC-HVDC under commutation failure. Energy Rep. 2025;13(2):3418–29. doi:10.1016/j.egyr.2025.02.057. [Google Scholar] [CrossRef]
11. Ouyang J, Chen Y, Pan X, Diao Y. An improved suppression method of AC transient overvoltage for line commuted converter based high voltage direct current considering AC-DC system coupling. Electronics. 2024;13(10):1844. doi:10.3390/electronics13101844. [Google Scholar] [CrossRef]
12. Sun JH, Wang XX, Li GH, Li K, Zhang X. Commutation failure caused by quantitative calculation and influencing factors of the sending power grid of overvoltage. J Electr Power Syst Automat. 2020;32(12):62–8. (In Chinese). doi:10.1109/cieec47146.2019.cieec-2019667. [Google Scholar] [CrossRef]
13. Wang F, Liu TQ, Ding YY, Zeng Q, Li XY. Calculation method of transient overvoltage caused by DC blocking and analysis of its influencing factors. Pow System Technol. 2016;40(10):3059–65. (In Chinese). doi:10.19783/j.cnki.pspc.200214. [Google Scholar] [CrossRef]
14. Xue A, Yue L, Zhang J, Cui J, Li Z, Li Y, et al. A new quantitative analysis method for overvoltage in sending end electric power system with UHVDC. IEEE Access. 2020;8:145898–908. doi:10.1109/access.2020.3015267. [Google Scholar] [CrossRef]
15. Li B, Chao P, Li W, Xu S, Li Z. Fast calculation method for the transient voltage trajectories of a hybrid AC/DC transmission system integrated with large-scale renewable energy. CSEE J Power Energy Syst. 2025:1–10. doi:10.17775/CSEEJPES.2024.03750. [Google Scholar] [CrossRef]
16. Zhao L, Ke DP, Sun YZ, Xu J, Chang HJ, Liu FS. High efficient reactive power planning for converter stations in feed-end networks considering DC latching transient overvoltage constraints. South Pow Grid Technol. 2022;7:10–21. (In Chinese). doi:10.13648/j.cnki.issn1674-0629.2022.07.002. [Google Scholar] [CrossRef]
17. Yin CY, Li FT, Zhou SY, Chen WW. DC lock-in transient overvoltage calculation method based on reactive power short-circuit ratio. Automat Elect Pow Syst. 2019;43(10):150–4+161. (In Chinese). doi:10.7500/AEPS20181114006. [Google Scholar] [CrossRef]
18. Yin C, Li F. Analytical expression on transient overvoltage peak value of converter bus caused by DC faults. IEEE Trans Power Syst. 2021;36(3):2741–4. doi:10.1109/TPWRS.2021.3062218. [Google Scholar] [CrossRef]
19. Zhou H, Yao W, Ai X, Li D, Wen J, Li C. Comprehensive review of commutation failure in HVDC transmission systems. Electr Power Syst Res. 2022;205(B):107768. doi:10.1016/j.epsr.2021.107768. [Google Scholar] [CrossRef]
20. Saleh SA, Jewett D, Al-Durra A, Kanukollu S, Cardenas-Barrera J, Valdes ME, et al. Experimental assessment of grounding system impacts on ground currents and transient overvoltage. IEEE Trans Ind Applicat. 2022;58(5):5987–6001. doi:10.1109/tia.2022.3189614. [Google Scholar] [CrossRef]
21. Paul D. Phase-ground fault current analysis and protection of a high-resistance grounded power system. IEEE Trans Ind Appl. 2020;56(4):3306–14. doi:10.1109/TIA.2020.2990116. [Google Scholar] [CrossRef]
22. He GQ, Wang WS, Liu C, Li GH, Nian H. Phase commutation failure of UHVDC transmission system of wind power base (1transient reactive voltage modeling of wind turbine at the transmission end. Proc CSEE. 2022;42(12):4391–405. (In Chinese). doi:10.13334/j.0258-8013.pcsee.210043. [Google Scholar] [CrossRef]
23. Khazaei J, Beza M, Bongiorno M. Impedance analysis of modular multi-level converters connected to weak AC grids. IEEE Trans Power Syst. 2018;33(4):4015–25. doi:10.1109/TPWRS.2017.2779403. [Google Scholar] [CrossRef]
24. Zhang L, Harnefors L, Nee HP. Power-synchronization control of grid-connected voltage-source converters. IEEE Trans Power Syst. 2010;25(2):809–20. doi:10.1109/TPWRS.2009.2032231. [Google Scholar] [CrossRef]
25. Li T, Zhao T, Lv M, Zou L, Zhang L. The mechanism and solution of the anomalous commutation failure of multi-infeed HVDC transmission systems. Int J Electr Power Energy Syst. 2020;114(4):105400. doi:10.1016/j.ijepes.2019.105400. [Google Scholar] [CrossRef]
Cite This Article
 Copyright © 2025 The Author(s). Published by Tech Science Press.
This work is licensed under a Creative Commons Attribution 4.0 International License , which permits unrestricted use, distribution, and reproduction in any medium, provided the original work is properly cited.
 Downloads
 Citation Tools