
 Submit a Paper
 Propose a Special lssue
 Open Access
ARTICLE

Low-Carbon Operation Optimization of Integrated Energy System Considering Multi-Equipment Coordination and Multi-Market Interaction
1 College of Electrical Engineering and New Energy, China Three Gorges University, Yichang, 443002, China
2 Hebei Electric Power Transmission Transformation Co., State Grid Hebei Electric Power Company, Shijiazhuang, 050000, China
* Corresponding Author: Cheng Peng. Email:
Energy Engineering 2025, 122(11), 4579-4602. https://doi.org/10.32604/ee.2025.067704
Received 10 May 2025; Accepted 07 July 2025; Issue published 27 October 2025
 View Full Text
 Download PDF
Abstract
Integrated energy systems (IES) are widely regarded as a key enabler of carbon neutrality, enabling the coordinated use of electricity, heat, and gas to support large-scale renewable integration. Yet their practical deployment still faces major challenges, including rigid thermoelectric coupling, insufficient operational flexibility, and fragmented carbon and certificate market mechanisms. To address these issues, this study proposes a low-carbon economic dispatch model for integrated energy systems (IES) that reduces emissions and costs while improving renewable energy utilization. A coordinated framework integrating carbon capture, utilization, and storage, two-stage power-to-gas, combined heat and power, and ground-source heat pump technologies enhances multi-energy complementarity and overcomes the heat-led constraints of traditional combined heat and power systems. A unified carbon emission trading and green certificate trading mechanism is designed to balance economic and environmental goals through cross-market synergy. To address uncertainty, a distributionally robust chance-constrained model based on Kullback–Leibler divergence is introduced in Scenario 8. The model is solved using the GUROBI solver under multiple scenarios. Simulation results show a cost reduction from $56,166.66 to $25,840.32, carbon emission cuts from 801.38 to 440.90 t, and wind/photovoltaic utilization rates reaching 98%, which fully demonstrates the effectiveness of the proposed framework in achieving cost-efficient low-carbon operation of IES.Graphic Abstract
Keywords
Climate change, energy insecurity, and the depletion of fossil fuels have triggered a global push toward low-carbon and integrated energy solutions. In response, many countries have established long-term carbon neutrality targets. China, for instance, has pledged to reach peak carbon emissions by 2030 and achieve carbon neutrality by 2060 [1]. To meet these goals, it is essential to enhance the efficiency, flexibility, and sustainability of energy infrastructure. The concept of Integrated Energy Systems (IES), which enables the coordinated operation of electricity, gas, heat, and other energy carriers, has emerged as a promising approach to drive this transformation [2–4]. By leveraging synergistic energy flows and multi-energy coupling, IES improves resource utilization, reduces operational costs, and supports high renewable energy penetration. Consequently, it has become a focal point in contemporary academic and engineering research [5,6].
The advancement of Carbon Capture, Utilization, and Storage (CCUS) technologies has facilitated low-carbon economic operations in integrated energy systems (IES). Ref. [7] proposes transforming conventional thermal power plants into carbon capture power plants and integrating them with gas systems via electricity-gas coordination. Ref. [8] examined the structural model of carbon capture-based power plants, analyzed their internal energy distribution, and highlighted their favorable flexibility in dynamic operation. Ref. [9] explored representative operational strategies of carbon capture power plants, and their findings indicated that, compared to the diversion-based mode, the liquid storage approach significantly expands the feasible operational range. Ref. [10] developed a coordinated operation framework between wind turbines and carbon capture power plants, revealing the enhanced potential of integrating carbon capture power plants with renewable energy systems.
Power-to-Gas (P2G), which converts surplus electricity into hydrogen or methane via electrolysis and methanation, has also become a promising solution for energy storage and sector coupling. Ref. [11] identifies two core stages in P2G operations: hydrogen production via electrolysis and methanation. Ref. [12] presented a detailed model of hydrogen storage tanks, refining the Power-to-Gas process into an electrolyzer and a methanation reactor (MR), which cooperates with hydrogen fuel cells to manage supply-demand imbalances in integrated energy systems. Ref. [13] proposed a novel approach combining renewable energy and P2G technology to enhance energy efficiency under high renewable penetration. Ref. [14] advocates leveraging hydrogen’s multifaceted advantages for cleaner production. Despite the growing adoption of IES as a strategy for carbon neutrality, its practical deployment encounters significant barriers—chief among them are effective carbon regulation and the coordination of diverse energy forms.
With increasing complexity in energy system operation, coordinated scheduling of multiple technologies has become a key trend in the design of integrated energy systems. Ref. [15] proposed an integrated scheduling approach combining carbon capture power plants and Power-to-Gas (P2G) technologies, showing that their coordinated operation improves renewable energy utilization and contributes to carbon reuse. Ref. [16] integrates Carbon Capture and Storage with Power-to-Gas (P2G) and combined heat and power (CHP) systems to alleviate operational constraints caused by the heat-led power dispatch of CHP units. Ref. [17] developed an IES economic dispatch model integrating carbon capture with bidirectional electricity-hydrogen-gas conversion, but overlooked the interdependencies between CO2 regeneration and absorption processes. Ref. [18] employs CCUS-captured CO2 as the carbon source for P2G processes.
Ground Source Heat Pumps (GSHPs), utilizing electricity to drive heat exchange between subsurface resources and buildings, support renewable integration and reduce energy consumption by 40%–60% compared to air-source heat pumps. Ref. [19] integrates GSHPs with IES to improve subsurface resource utilization. However, current studies often examine CCUS, Power-to-Gas (P2G), and geothermal-based technologies in isolation, lacking a unified framework to capture their integrated value within market-oriented low-carbon dispatch strategies for integrated energy systems.
From a market-oriented perspective, carbon emission trading (CET) has emerged as an effective policy instrument for reducing global greenhouse gas emissions [20], while green certificate trading (GCT) serves as a promising incentive scheme to support the integration of renewable electricity into power markets [21,22]. Ref. [23] established a carbon-embedded IES model, while Ref. [24] designed emission reduction indices to enhance carbon market efficiency. Ref. [25] proposed an optimal scheduling model that incorporates a combined CHP system, electricity-to-gas conversion, and carbon capture under a carbon emission trading mechanism. The simulation results indicate that carbon trading can effectively reduce the overall operational cost of coal-fired power plants by promoting low-carbon dispatch. Ref. [26] integrated solar thermal plants with P2G-enabled IES under a CET mechanism. However, conventional mechanisms fail to support structural decarbonization. Emerging studies adopt stepped CET mechanisms: Ref. [27] pioneered tiered incentives to enhance user engagement, and Ref. [28] applied it for internal carbon balance. Yet, they overlook the impacts of base prices and growth rates on operational flexibility. For GCT, Ref. [29] analyzes price effects on renewable integration. Ref. [30] developed a bilateral trading model between distribution companies and renewable energy producers based on cooperative game theory and the green certificate trading mechanism. Ref. [31] develops a dual-mechanism dispatch model but does not consider a coordinated mechanism between carbon emission trading and green certificate trading (CET-GCT). These limitations underscore the need for a unified market-driven framework that couples CET and GCT, fostering more flexible and economically viable IES dispatch—an area this study aims to explore.
In recent years, uncertainty-aware optimization techniques such as stochastic optimization, robust optimization, and distributionally robust optimization (DRO) have become increasingly central to integrated energy system (IES) scheduling. Traditional stochastic programming relies heavily on known probability distributions, which may result in biased or misleading outcomes when the true distribution deviates. To address this issue, robust optimization has emerged. Ref. [32] applies a robust optimization approach, designed to handle worst-case scenarios within predefined uncertainty sets. However, it often yields conservative results due to the neglect of distributional structure. To strike a better balance between performance and robustness, distributionally robust optimization has attracted increasing attention. DRO does not assume a fixed probability distribution; instead, it evaluates performance over a set of plausible distributions surrounding a nominal distribution, offering enhanced flexibility and reliability. Refs. [33,34] adopt a DRO framework to improve adaptability under distributional uncertainty. Among various DRO approaches, the distributionally robust chance constraint (DRCC) formulation offers a rigorous method to ensure high-probability constraint satisfaction across all distributions within the ambiguity set. In this work, we incorporate a DRCC model based on Kullback-Leibler divergence, which is particularly suitable for finite-sample environments and allows for tractable reformulations. This formulation strengthens the system’s robustness to renewable generation forecast errors while mitigating the over-conservatism typical of worst-case approaches. Since this study primarily focuses on coordinating multi-energy devices and the interaction of carbon and green certificate markets, the proposed framework prioritizes modeling flexibility and market coupling rather than comprehensive uncertainty treatment. Therefore, a DRO model is used only in Scenario 8, extending from the baseline of Scenario 7, to improve result reliability under uncertainty.
To address the gaps identified in the above research, this paper makes the following specific contributions:
(1) Dual-dimensional coupling framework
This study proposes an innovative electro-thermal-gas-geothermal integrated modeling framework that systematically incorporates CCUS, two-stage P2G, CHP, and GSHP technologies. The proposed framework breaks the traditional “heat-led” constraint of CHP systems and significantly enhances the flexible integration of renewable energy, thereby reducing the reliance on traditional fossil-fueled units and achieving CO2 emission reduction. Moreover, CCUS is employed to capture the carbon dioxide generated by coupled units, further contributing to system-wide carbon mitigation.
(2) Unified CET-GCT market mechanism
A mutual recognition mechanism is established between CET and GCT, enabling the offsetting of carbon emissions across the two schemes. Unlike previous studies that model CET and GCT separately, this unified market mechanism simultaneously addresses economic and environmental objectives, where CET directly constrains carbon emissions and GCT promotes renewable energy integration, both working in synergy to support low-carbon operation and optimize system dispatch.
(3) DRCC optimization for enhanced resilience
To mitigate dispatch risks caused by renewable generation forecast errors, we incorporate a DRCC model based on Kullback-Leibler divergence in Scenario 8. This approach effectively avoids performance degradation caused by overly conservative robust optimization and the distortion of results under distribution-dependent stochastic models, achieving a balance between resilience and flexibility.
(4) Multi-scenario validation of model effectiveness
Eight representative dispatch scenarios are designed to comprehensively evaluate the joint effects of multi-device integration and dual-market coordination. Results show that under the proposed multi-technology framework, the unified CET-GCT mechanism, and DRCC-based optimization, the system’s total operating cost is reduced from $56,166.66 to $25,840.32, and carbon emissions are lowered from 801.38 t to 440.90 t. Meanwhile, the combined utilization rate of wind and PV power increases significantly to 98%. These outcomes confirm the effectiveness and practicality of the proposed model in achieving low-carbon, multi-objective operation.
2 IES Model with CCUS-P2G-CHP Integration
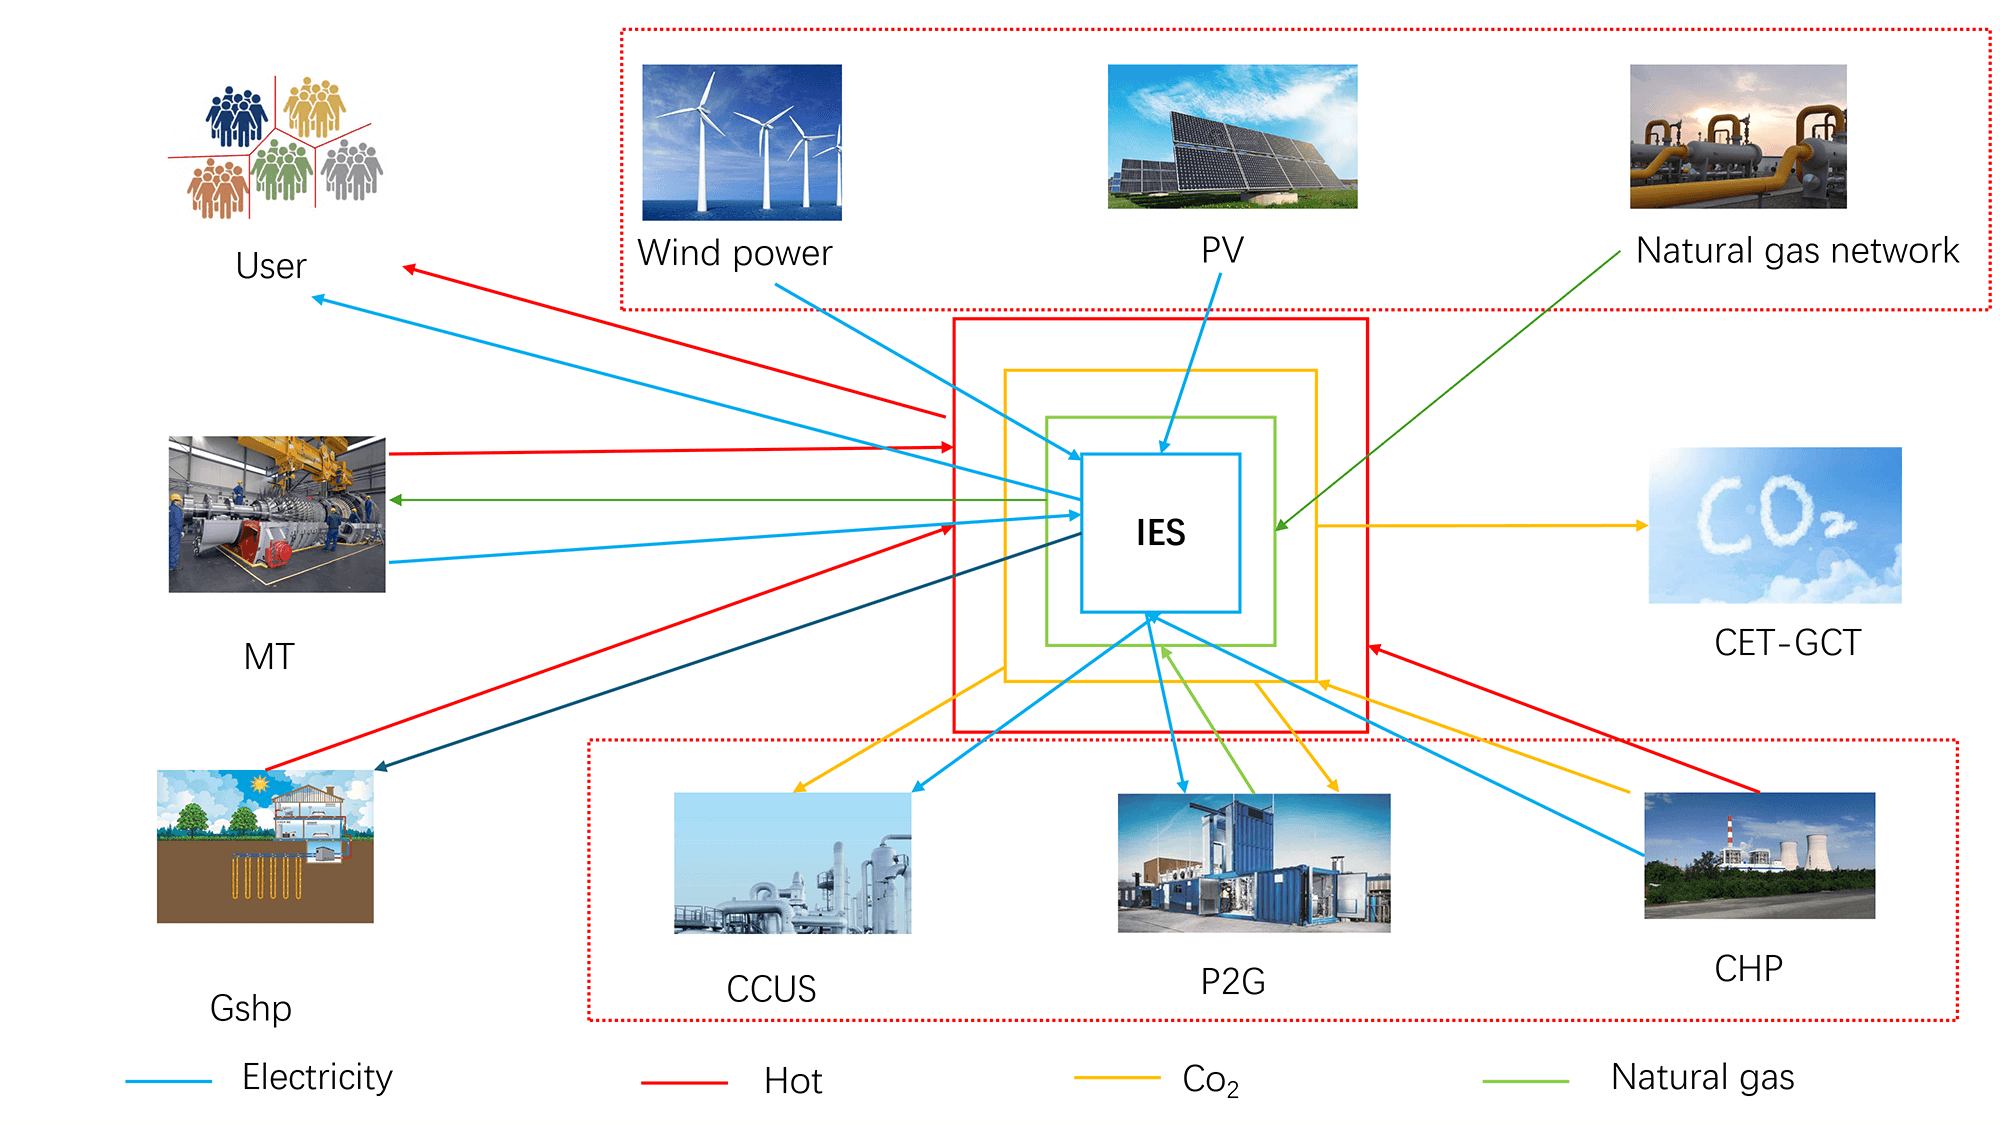
This paper presents an integrated energy system (IES) model incorporating CCUS, P2G, and CHP technologies. The system consists of a wind farm, photovoltaic (PV) power plant, CCUS facility, two-stage P2G unit, CHP plant, Micro Gas Turbine (MGT), ground source heat pump (GSHP), natural gas network, and integrated heat, electricity, and gas loads. Fig. 1 illustrates the system architecture. The CHP unit supplies electricity to both the P2G and CCUS subsystems. The electrolyzer splits water into hydrogen (H2) and oxygen (O2). A portion of the hydrogen is directed to a hydrogen fuel cell, which generates electricity to power the electrolyzer. The remaining hydrogen flows into a methane reactor (MR), where it reacts with CO2 captured by the CCUS system to synthesize methane for gas load supply. Any excess hydrogen is stored in a dedicated hydrogen tank for future use.
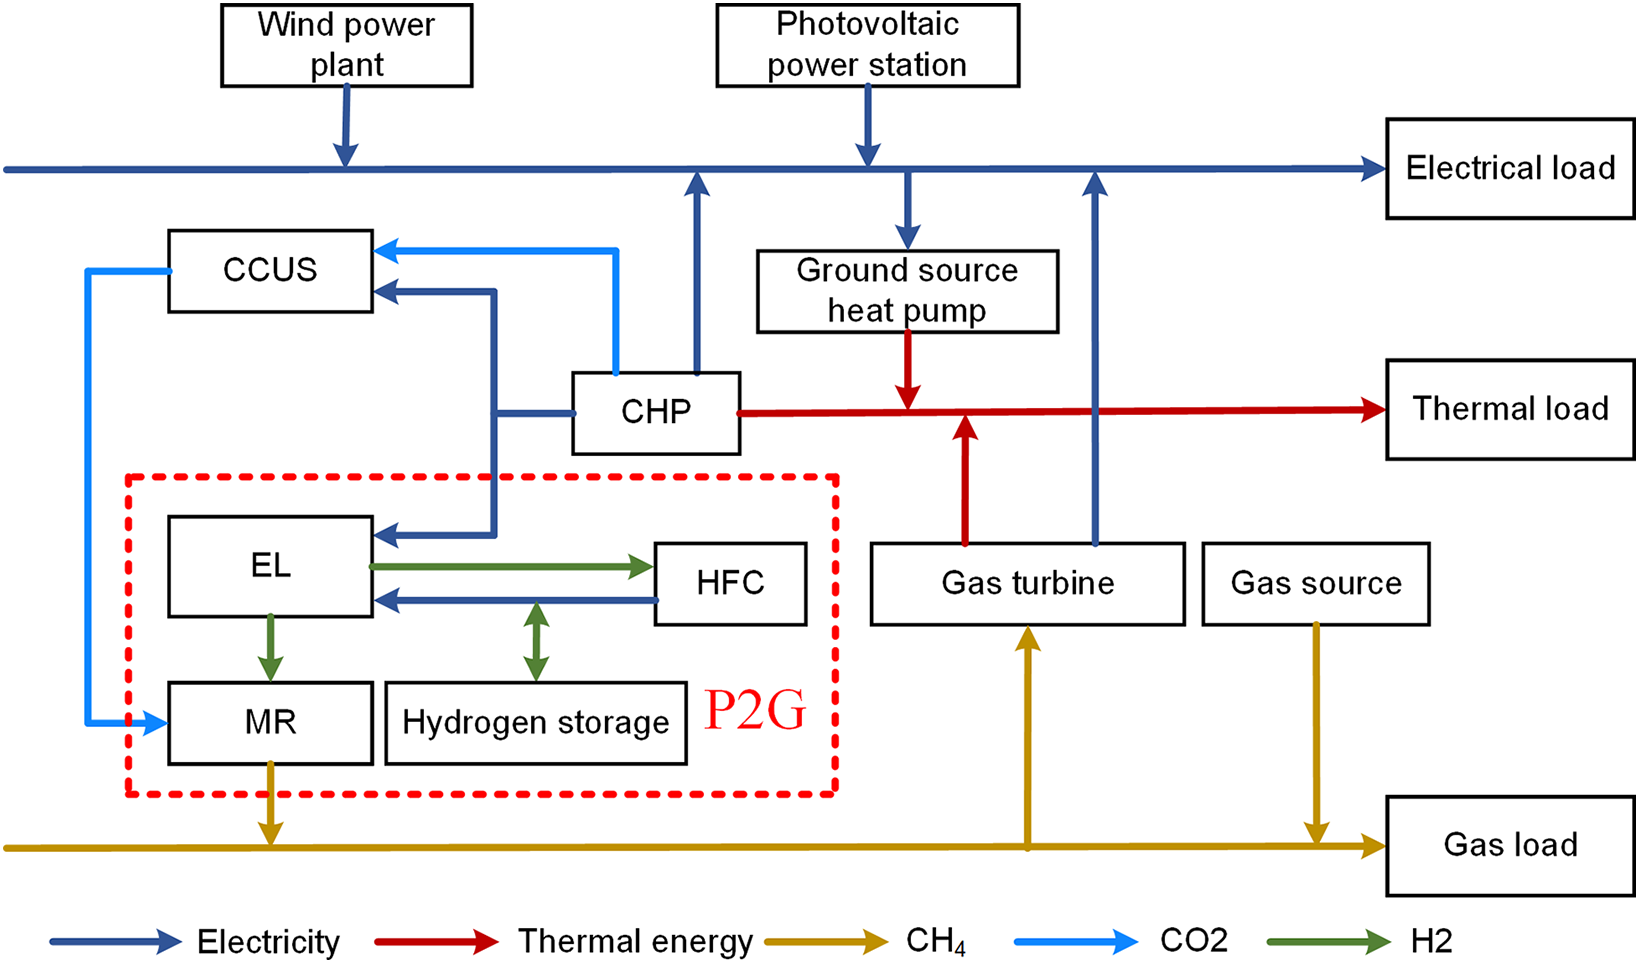
Figure 1: IES operation structure
In the CCUS-P2G-CHP coupling model, electric power
where:
The gas produced by the P2G system meets the gas load demand, with any surplus natural gas being stored in the gas pipeline network. The relationship between CHP power consumption and gas energy output is mathematically expressed as follows:
where:
The CO2 required by MR is given by the equation below:
where:
The CCUS system captures CO2 from the CHP unit and transports it to the MR. The captured CO2 amount is proportional to the CCUS system’s power consumption, defined by the following equation:
where:
The CHP operates under the “heat-led power” constraint, with its thermoelectric coupling constraint described by the following inequality:
where:
The thermal and electrical outputs of CHP, along with the electrical power supplied to P2G and CCUS systems, must adhere to their operational limits. These power constraints are described by the following equation:
From Eqs. (1) and (6), the CHP-P2G-CCUS coupled model electric power constraint can be derived as:
Based on Eqs. (1), (5) and (6), the thermoelectric operational constraints of the CHP-P2G-CCUS coupled model can be derived as shown in the following equation:
Based on Eqs. (7) and (11), the gas power constraint for CHP-P2G-CCUS system is derived as shown in the equation below:
Based on Eqs. (6)–(10), the coupled electric-heat-gas constraints for the CHP-P2G-CCUS model are constructed as follows:
3 Green Certificate—Carbon Coupling Mechanism
3.1 Stepped Carbon Emission Mechanism
CET, as an environmental policy instrument, incentivizes participants to reduce carbon emissions in a cost-effective manner by enabling the creation and trading of carbon allowances in the market. Under this mechanism, if a participant’s emissions are lower than the allocated allowances, the surplus can be sold for profit. Conversely, if emissions exceed the allowances, the participant must purchase additional allowances to fulfill compliance obligations. The operational principle of CET is illustrated in Fig. 2.
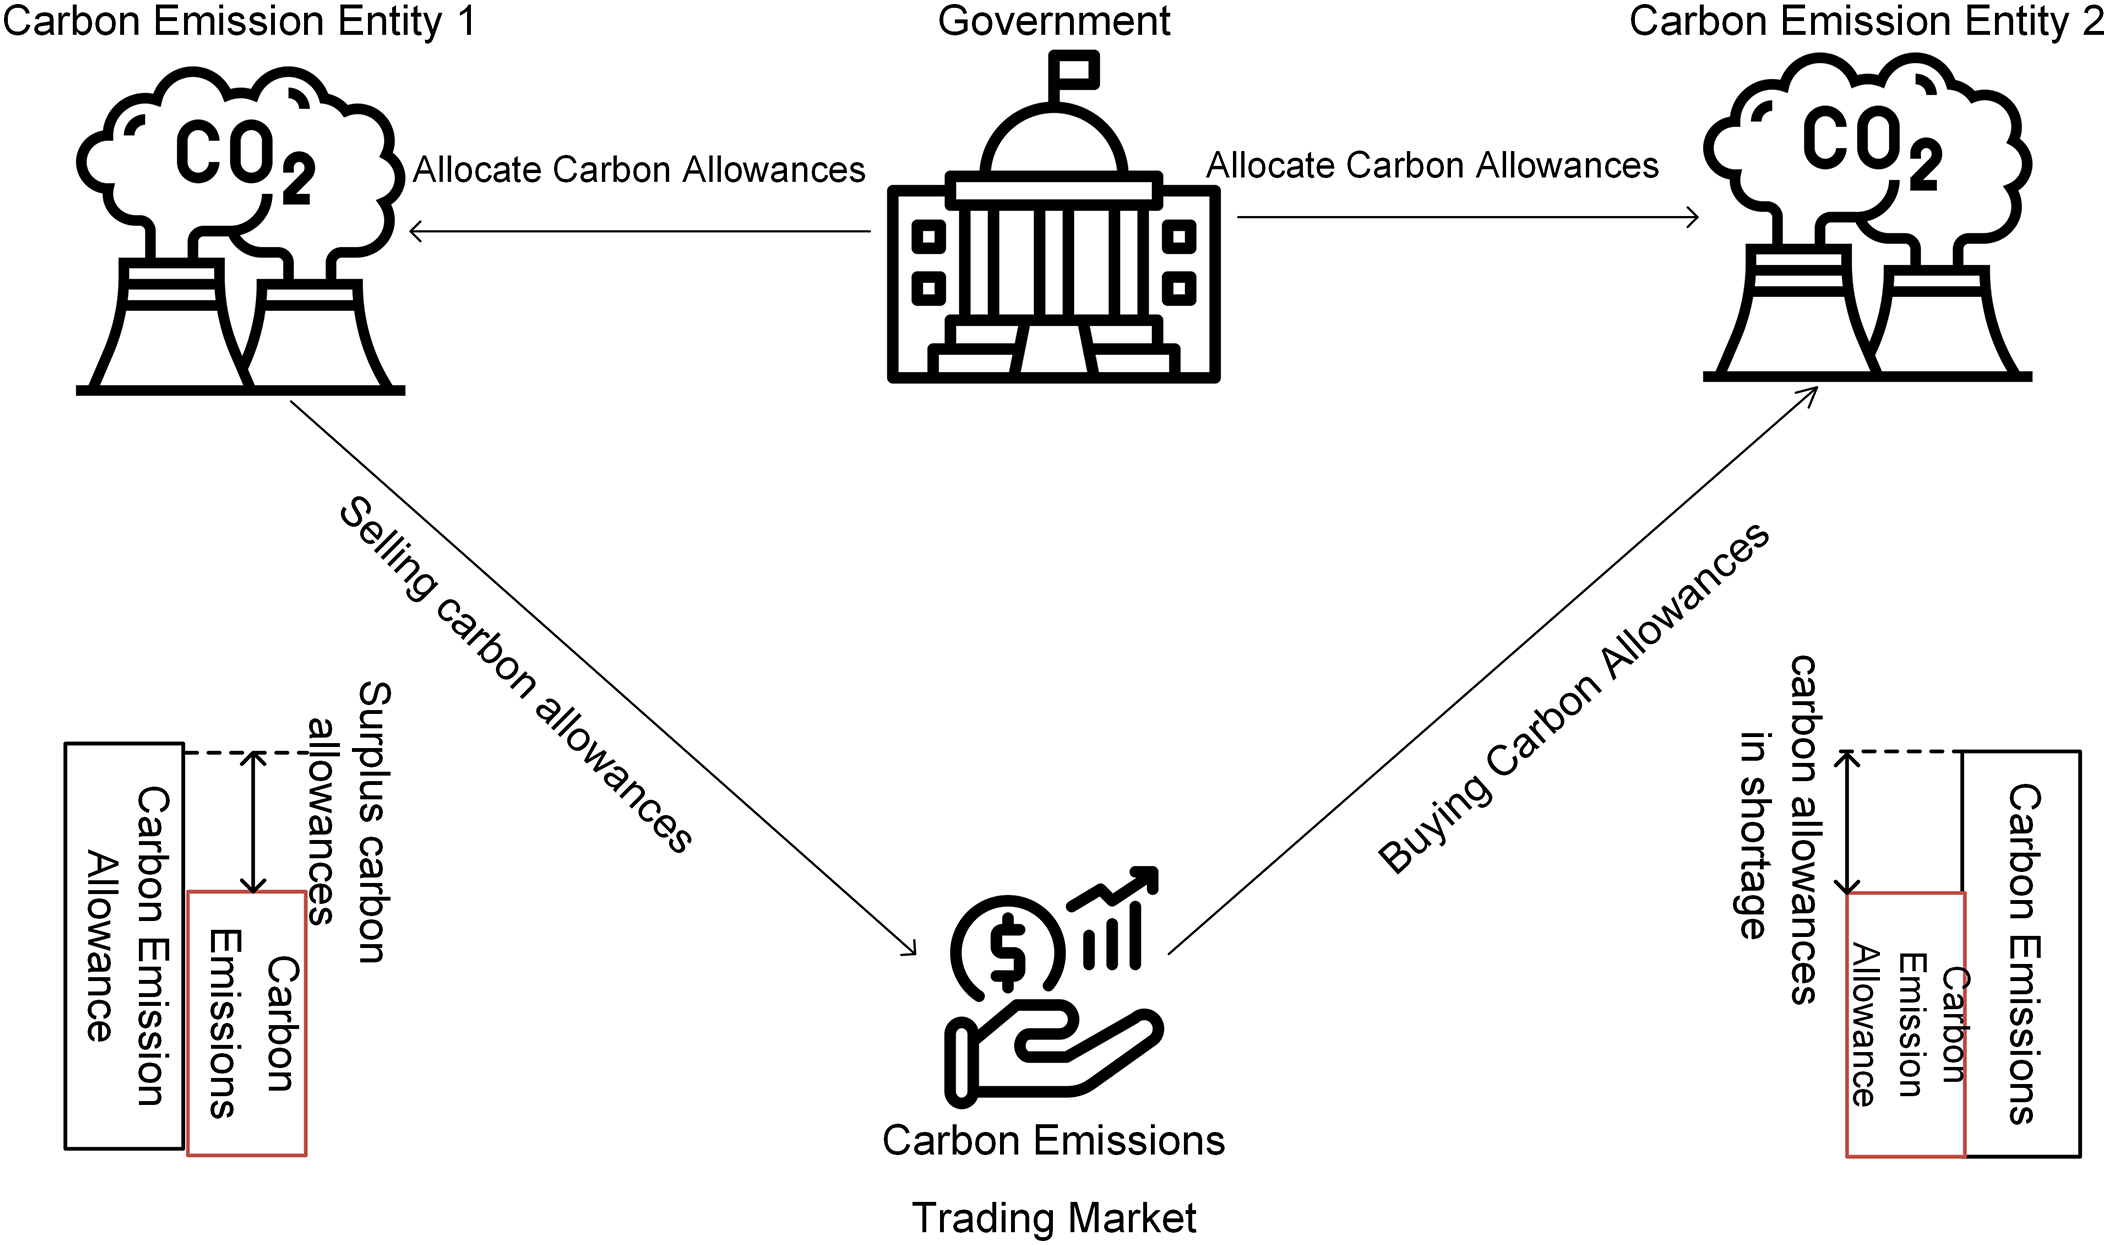
Figure 2: CET principle
Stepped CET divides the system’s carbon allowance trading volume into multiple tiers according to a tiered pricing mechanism: As the total trading volume increases, the system moves into higher pricing tiers, each associated with a higher carbon price. This structure imposes stricter constraints on system-wide carbon emissions. Compared to uniform CET markets, stepped CET markets are more effective in encouraging market participation and serve as a stronger incentive mechanism for carbon reduction in IES.
Currently, China’s free carbon allowance allocation approaches primarily include the benchmarking method, the historical intensity method, and the historical emissions method. Given the stable output characteristics of carbon-emitting units in the IES, this study adopts the benchmarking method for carbon allowance allocation:
where:
The CHP carbon emission is expressed as follows:
where:
After incorporating P2G and CCUS models, the carbon emission
The carbon emissions within the IES system can be expressed as:
where:
After determining the carbon emission allowance and actual carbon emissions of IES, the carbon emission trading volume in the carbon market is given by:
The stepped pricing mechanism defines multiple allowance tiers; the larger the volume of carbon credits to be purchased, the higher the price within the corresponding tier. The stepped CET cost is expressed as:
where:
3.2 Green Certificate Trading Mechanism
Green Certificates are issued by the National Energy Administration and serve as the official certification of the green power attributes of renewable electricity. They also provide the sole proof for electricity consumers of renewable energy usage. The GCT mechanism operates through China’s Green Power Certificate Trading Platform. When the number of Green Certificates acquired from renewable energy generation exceeds the required compliance quota, the system can sell the surplus certificates to generate revenue. Conversely, if the number falls short, additional certificates must be purchased to fulfill regulatory requirements. The operational principle of the Green Certificate mechanism is illustrated in Fig. 3.
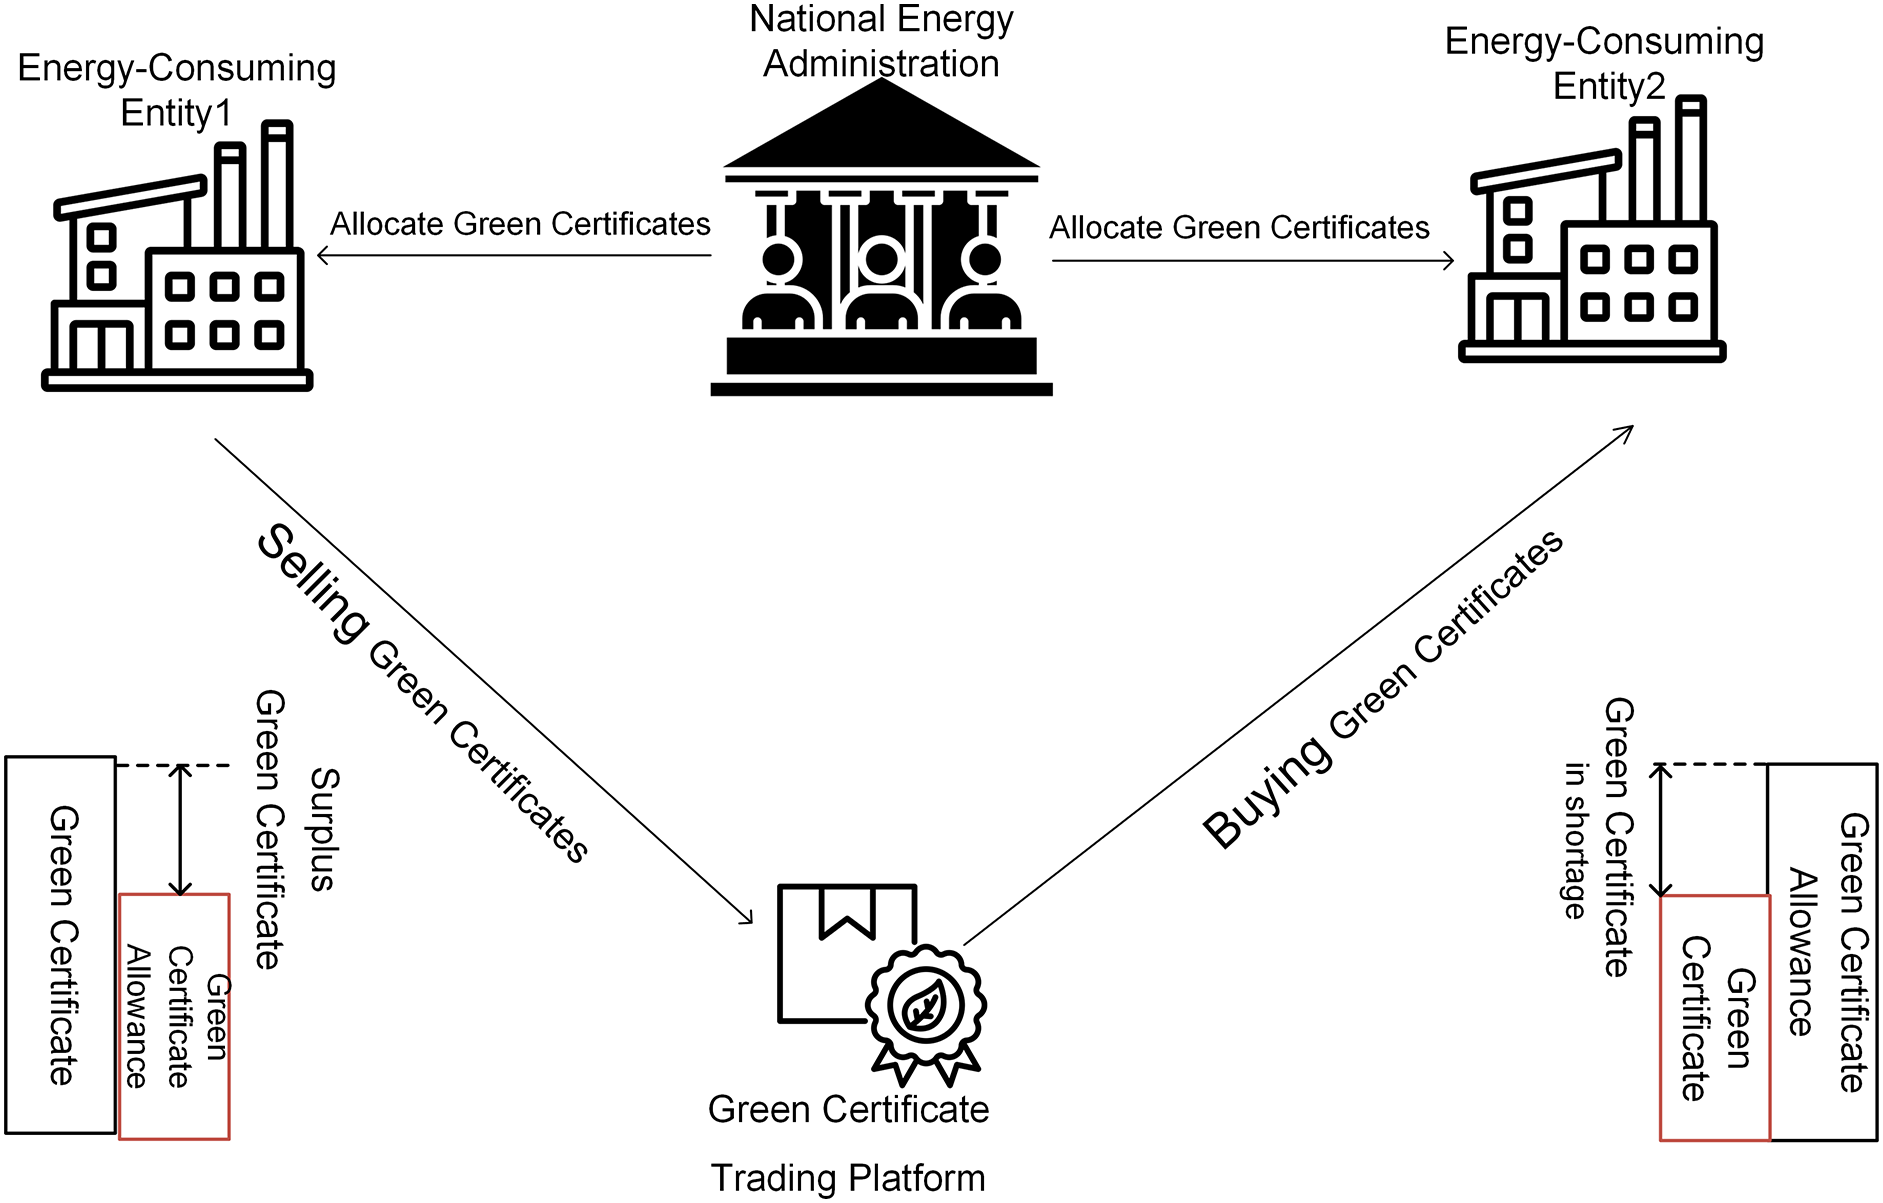
Figure 3: GCT principle
The GCT cost of IES can be expressed as:
where:
3.3 Interaction Mechanism of CET and GCT
A Green Certificate serves as verification of both the production and consumption of green electricity. Utilizing green electricity reduces dependence on fossil fuel-based energy sources, thereby decreasing CO2 emissions. Accordingly, Green Certificates quantify the fossil fuel-based electricity displaced by renewables within the system. This displacement can be used to calculate corresponding carbon emission reductions, which are then converted into carbon allowances—facilitating mutual recognition and offsetting between green certificates and carbon allowances. The mutual recognition mechanism between CET and GCT is illustrated in Fig. 4.
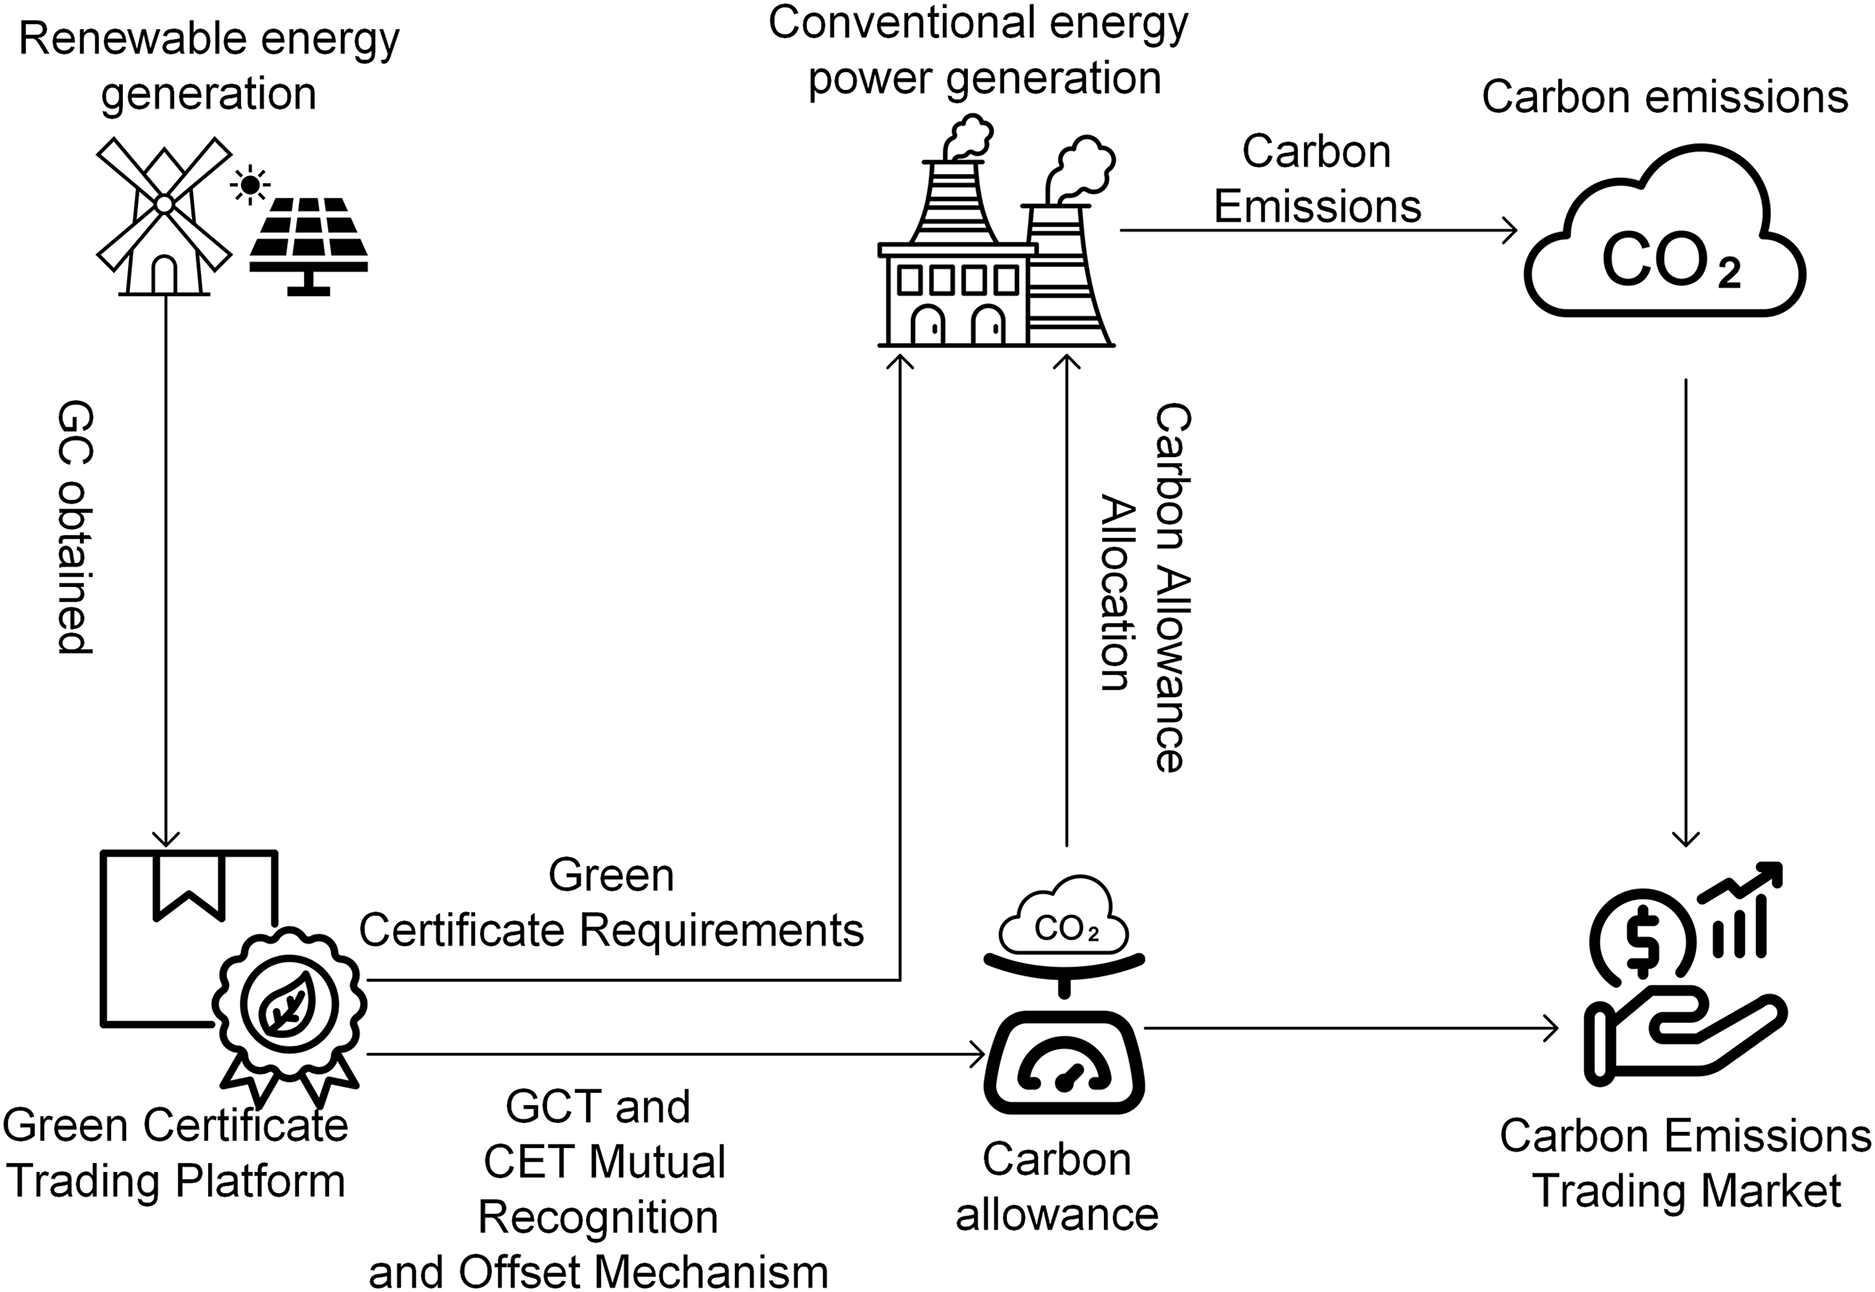
Figure 4: CET-GCT principle
Its core lies in the equivalence between China Certified Emission Reductions (CCER) and Green Certificates in achieving carbon reductions, establishing a framework of reciprocal recognition. As a formal instrument for certifying emission reduction outcomes, CCER can offset carbon allowances in the CET market on a one-to-one basis, thereby enabling the quantification of carbon allowances represented by Green Certificates.
As outlined in the 2013 “Integrated Baseline Methodology for Grid-connected Renewable Energy Generation Projects”, the emissions savings per MWh of renewable electricity generation are calculated based on the regional grid baseline emission factor. This factor provides the fundamental reference for quantifying carbon reductions under the GCT mechanism.
The calculation formula for converting Green Certificates to carbon allowances is:
where:
Taking into account the carbon emissions associated with green certificates directly influences the carbon emissions of the Integrated Energy System (IES), as demonstrated in:
Under the CET-GCT interaction mechanism, the more renewable energy is generated, the more green certificates are obtained, and the greater the carbon reductions from green electricity under the stepped CET mechanism. This fully motivates the enthusiasm for renewable energy power production.
4 Integrated Energy System Optimization Scheduling Model
The low-carbon dispatch of the integrated energy system considering CHP-P2G-CCUS and GSHP operating in synergy aims to minimize total operating cost while managing compliance risks with carbon emission constraints during dispatch. The total system operating costs include CHP-P2G-CCUS operating costs
here: T is the number of dispatch periods within the scheduling cycle. a, b, c, d, e, f are operating cost coefficients for CHP-P2G-CCUS;
The CHP-P2G-CCUS coupled model constraints are shown in Eqs. (11)–(15), in addition to the climb constraints shown in the following equation:
where:
The amount of CO2 produced during CHP operation is not less than the amount of CO2 captured by the CCUS.
The MGT output is constrained by the climb and its own upper and lower power limits.
where:
GSHP and air-sources are subject to their own upper and lower power limits.
where:
During the IES dispatch cycle, the electrical output and power consumption must match the electrical load; the thermal output of each device must remain constant with the thermal load; and due to the inertial property of the gas network, the imbalance between the gas output of each device and the demand can be maintained within a defined range. The electric, thermal, and gas power constraints for the integrated energy sources are shown in the following equation:
where:
5 Multi-Scenario Dispatch Results Analysis
This study focuses on an integrated energy resource located in North China. The structure is depicted in Fig. 1. The data prediction graph is shown in Fig. 5. The simulation parameters are listed in Tables 1 and 2. The overall research flow of this study is shown in Fig. 6, covering modeling, market design, scenario setup, and solution process. To verify the effectiveness of the cooperative operation model for CHP-P2G-CCUS and GSHP, four scenarios are designed to employ the GUROBI solver on the MATLAB-YALMIP platform for simulation and analysis. Scenario 1: Consider only CHP without GSHP; Scenario 2: Consider CHP model with GSHP; Scenario 3: Consider CHP-P2G coupled model with GSHP; Scenario 4: Consider CHP-P2G-CCUS coupled model with GSHP.
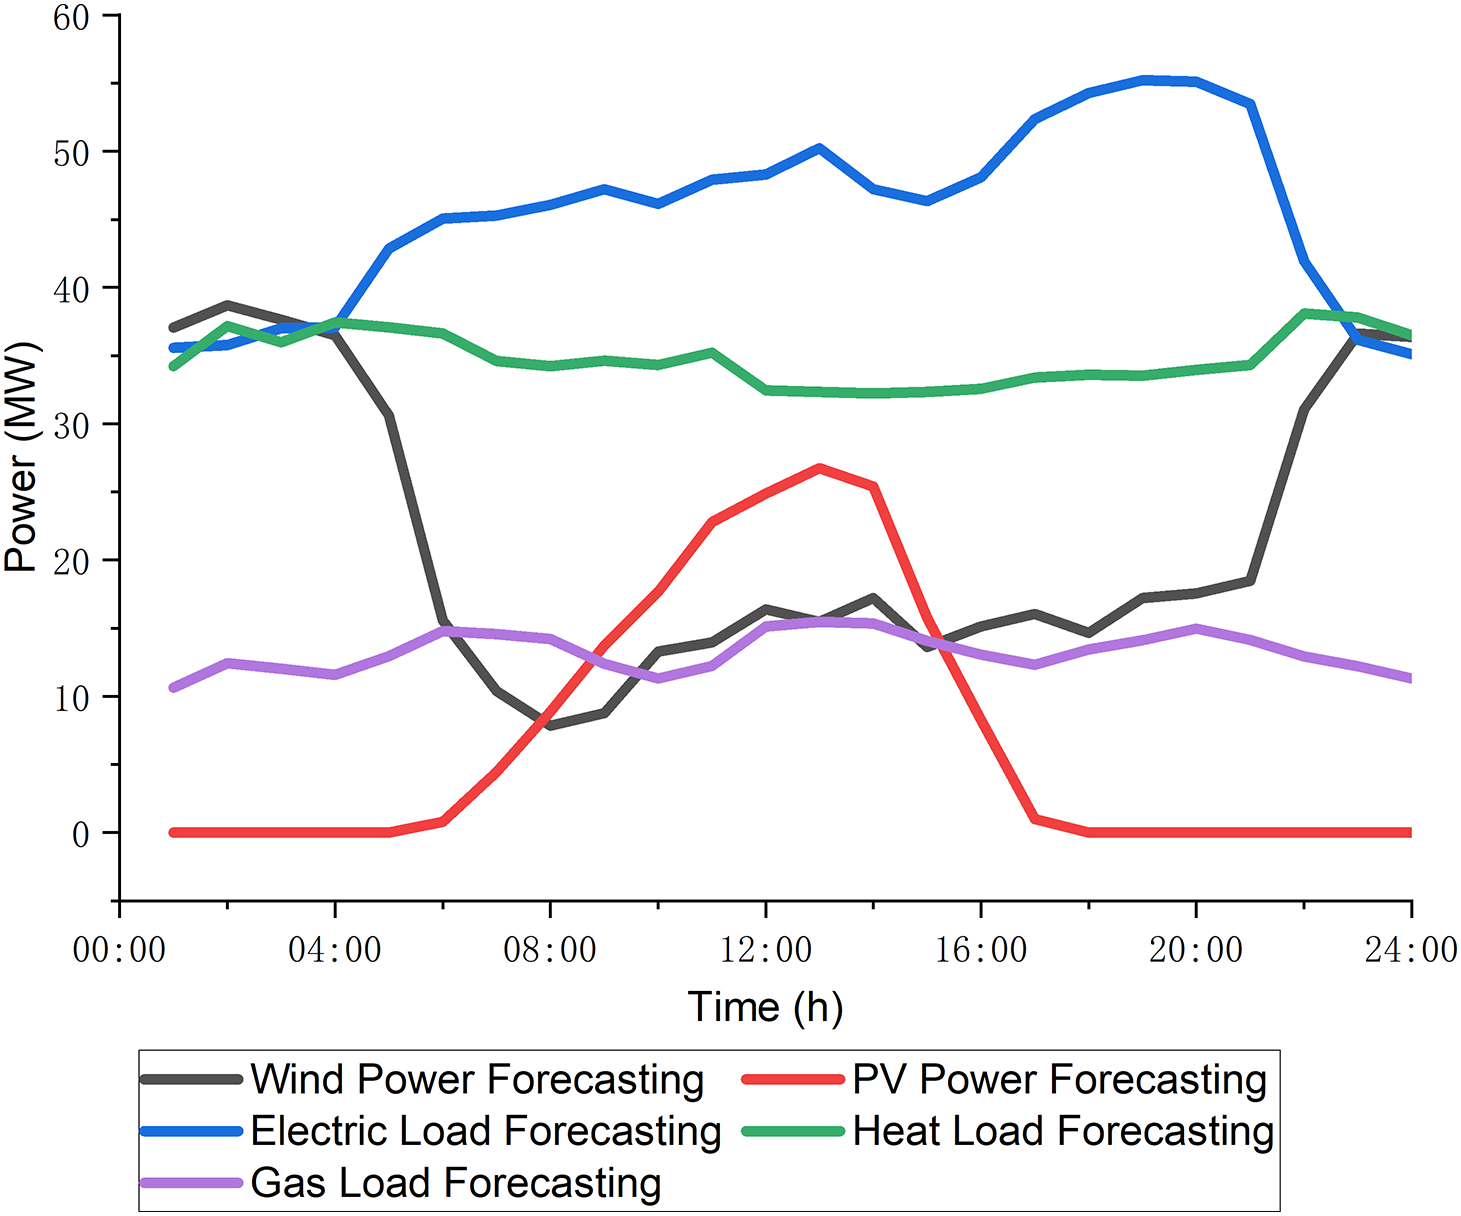
Figure 5: Wind-photovoltaic power and load forecasting diagram


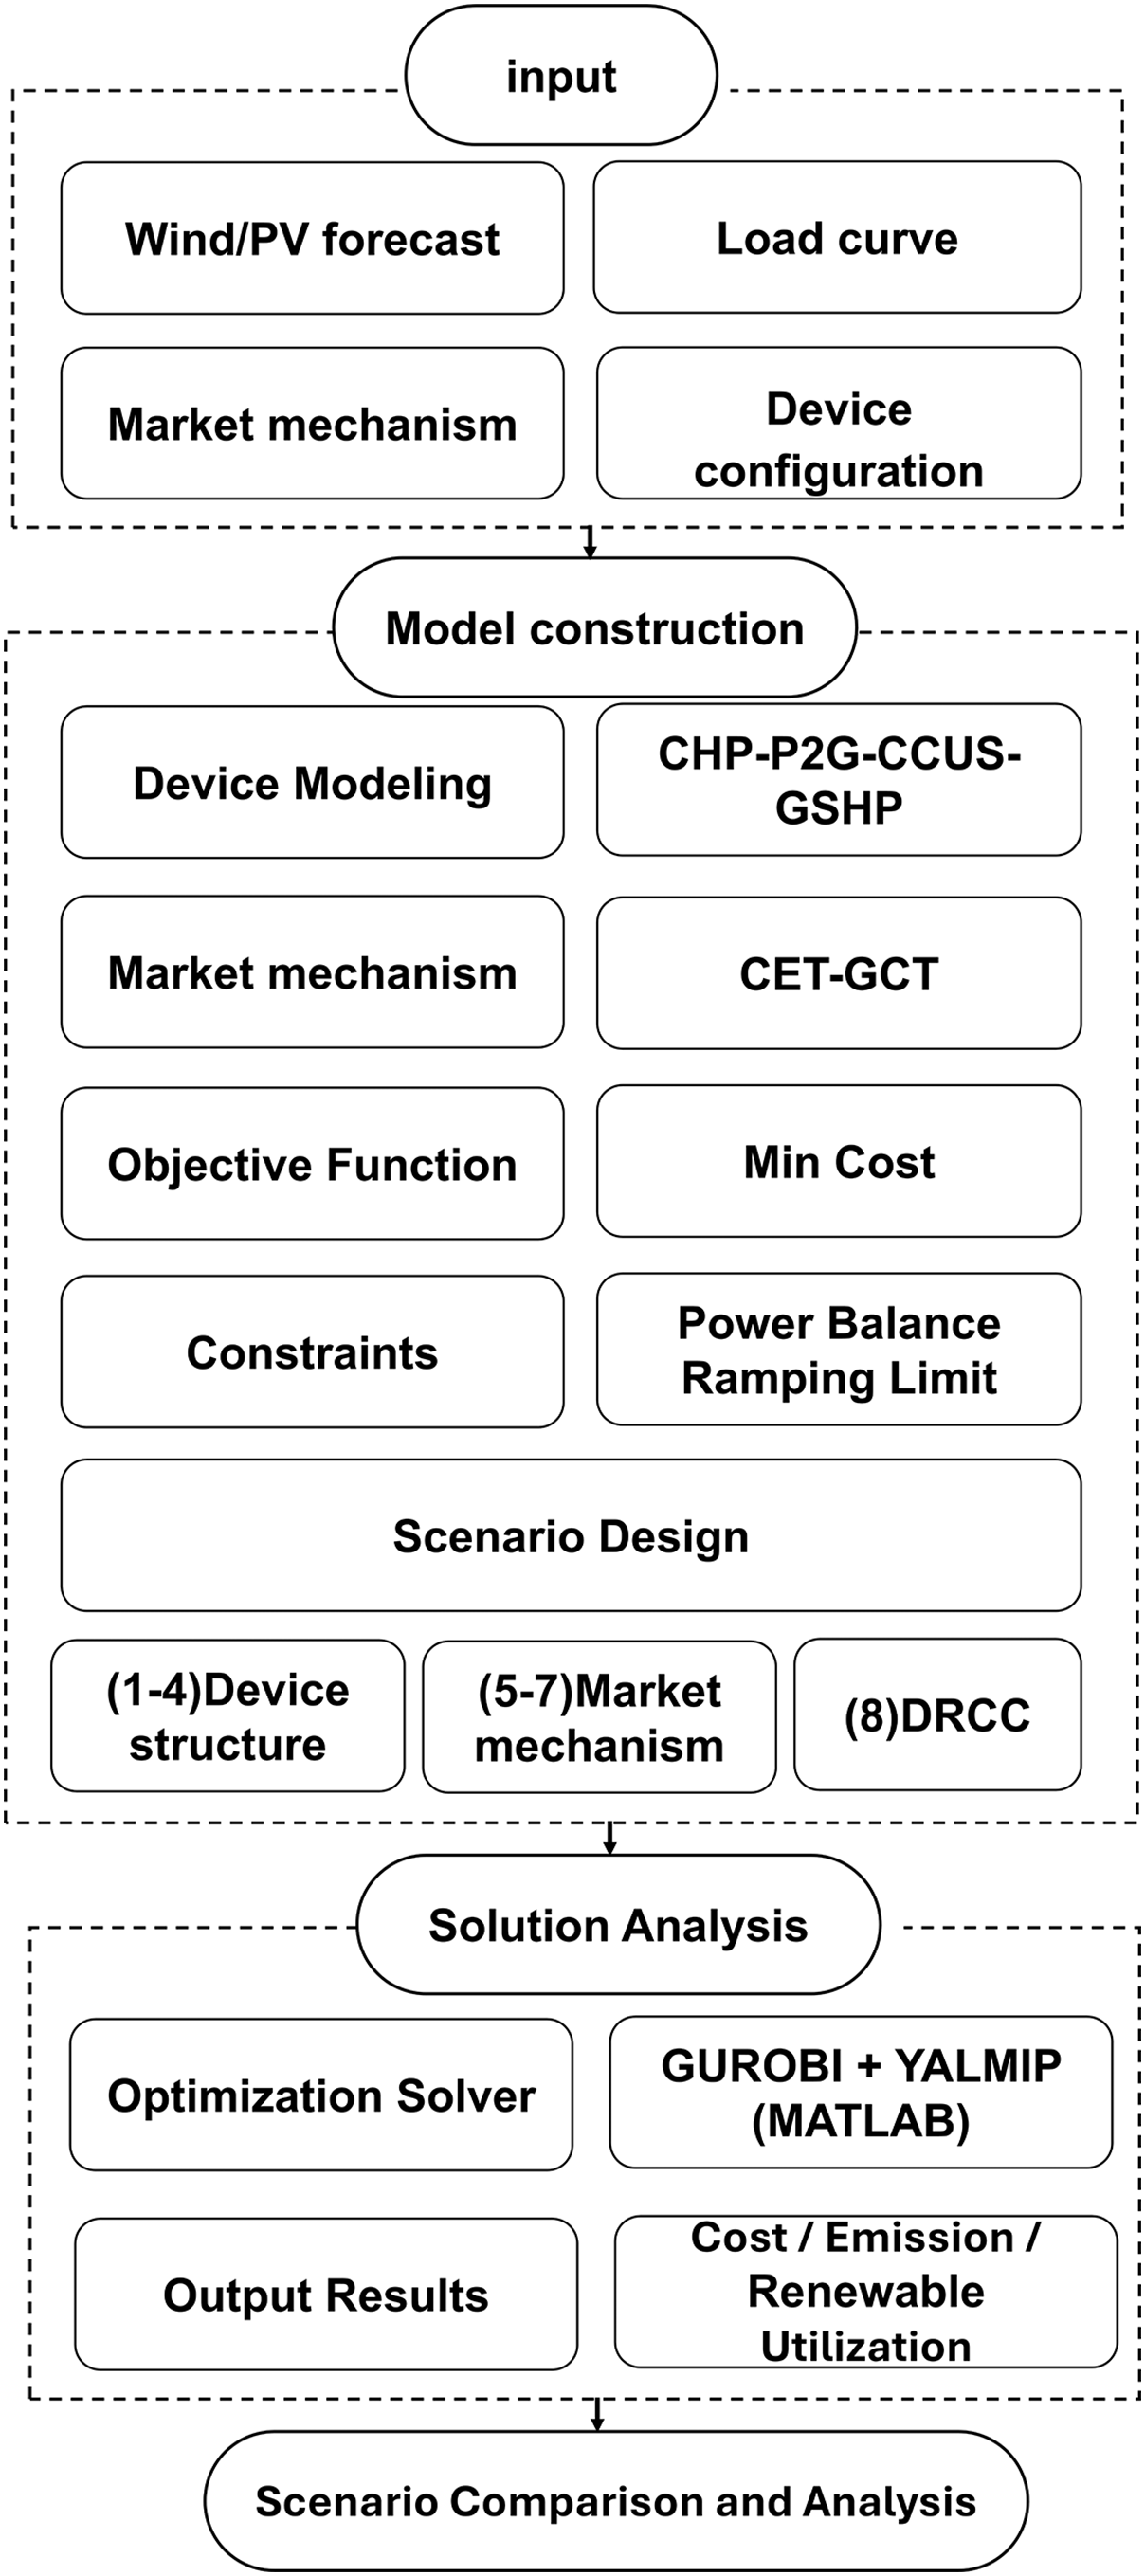
Figure 6: Methodological flowchart
5.1 Four-Scenario Scheduling Result
In Scenario 1, which only considers CHP, the IES electric load during the dispatch cycle is jointly met by wind, PV, CHP, and micro gas turbines. The heat load is supplied by CHP and MGTs, and the gas load is met by the gas source and its MGTs. Under the “heat-led power generation” operation mode, CHP’s power output varies with the change of heat output and loses its self-regulation capability. This leads to serious photovoltaic and wind power curtailment within the IES, resulting in high scheduling costs.
In Scenario 2, after adding the GSHP model, the heat load within the IES system is met by GSHP, CHP, and MGTs. As a result, CHP’s heat output is reduced, and its electricity output decreases accordingly. This increases grid access for wind power and PV, reduces photovoltaic and wind power curtailment, and cuts down the scheduling cost within the system.
For Scenario 3, with the CHP–P2G coupling model, the gas load is met by CHP–P2G, the gas source, and MGTs. The heat-led constraint of CHP is decoupled. With the same heat output as in Scenario 2, CHP–P2G’s electrical output is lower due to P2G’s power consumption. This further increases the opportunities for wind and solar power grid connection and reduces the scheduling costs.
The scheduling results of Scenario 4 are presented in Fig. 7. In the IES, the electrical load is shared by wind power, photovoltaic, CHP–P2G–CCUS, MGT, and GSHP. The heat load within the system is met by GSHP, CHP–P2G–CCUS, and MGT, while the gas load is met by the gas source, CHP–P2G–CCUS, and MGT. CHP–P2G–CCUS and GSHP can operate in a synergistic manner, expanding the grid integration capacity for wind power and photovoltaic. Simultaneously, the reduction in the output of other equipment decreases the penalties associated with photovoltaic and wind power curtailment. As a result, the total scheduling costs are reduced. Moreover, the carbon emissions within the system are significantly decreased.
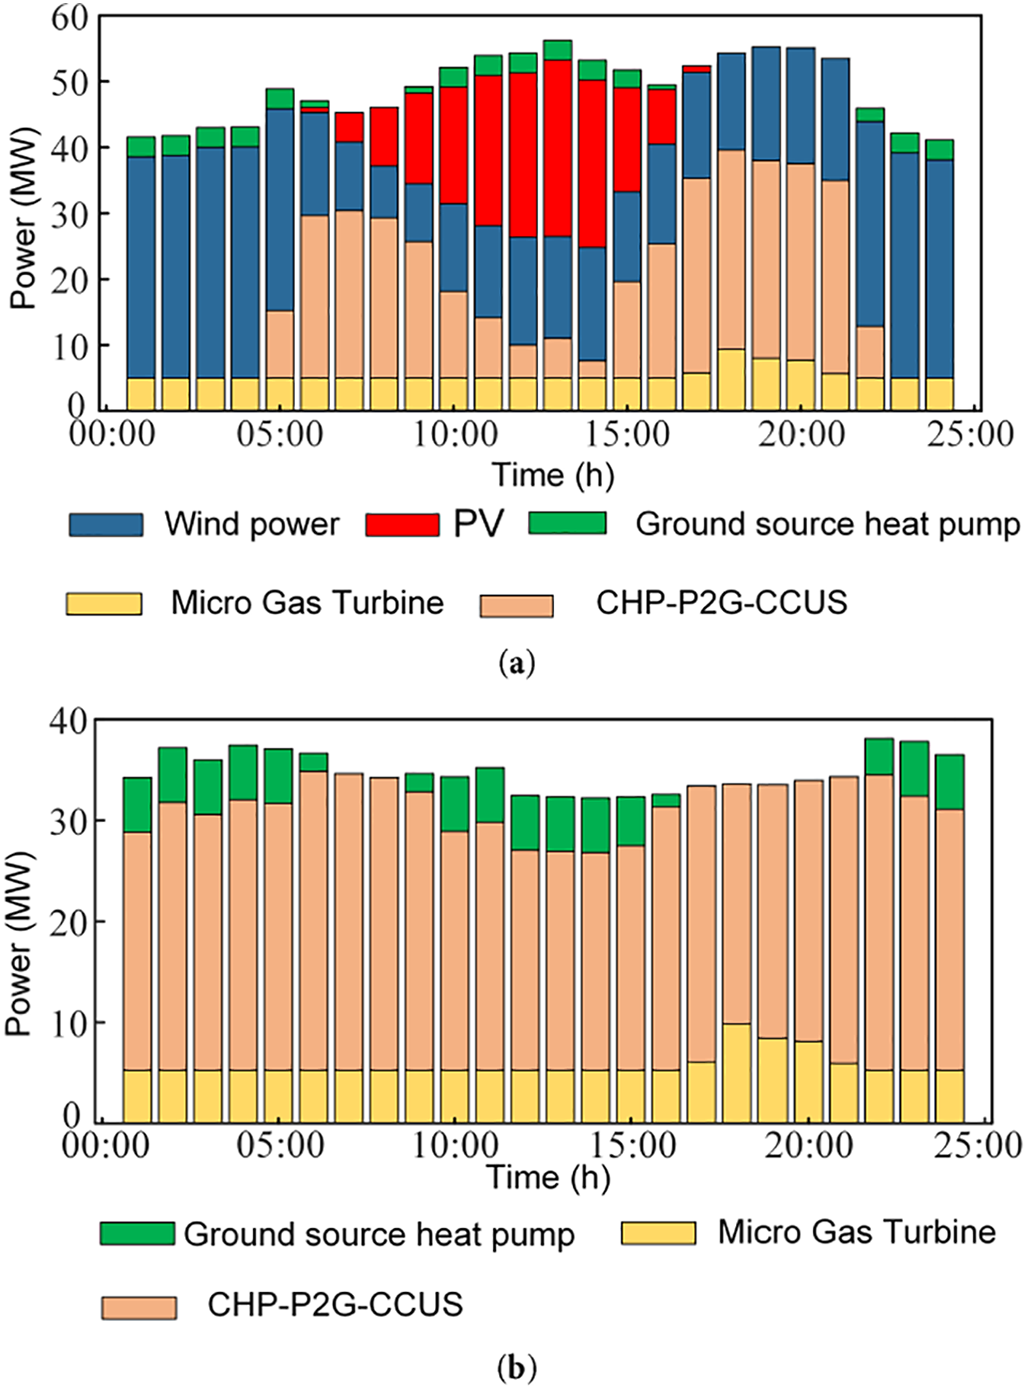
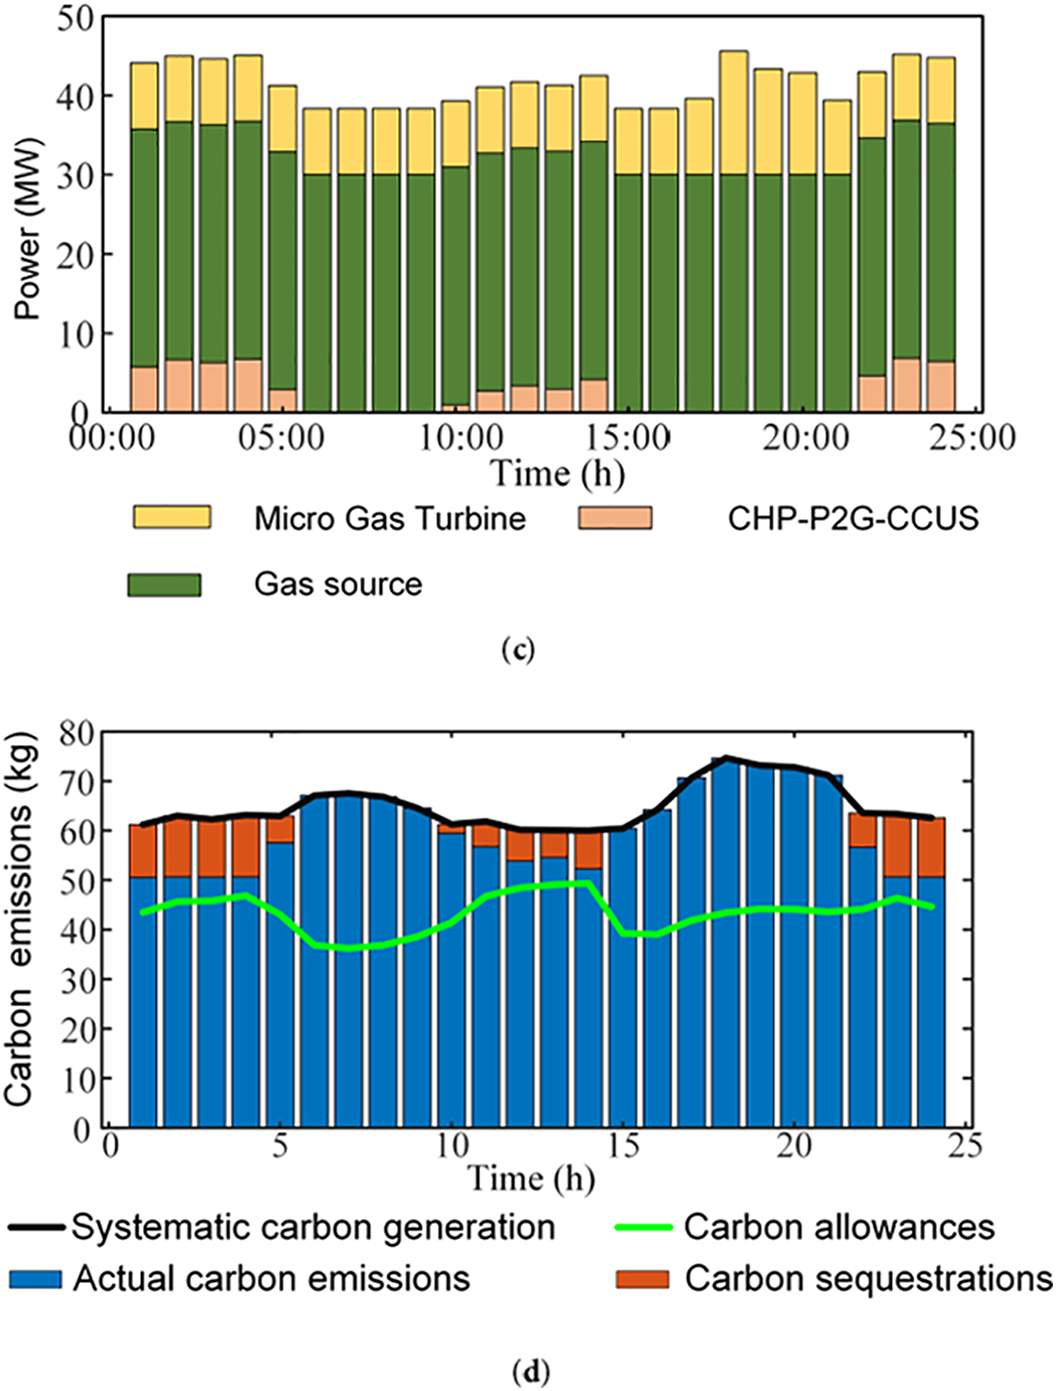
Figure 7: Scenario 4 scheduling results. (a) Electrical power balance diagram; (b) Thermal power balance diagram; (c) Gas power balance diagram; (d) Carbon dioxide balance dragiam
5.2 Analysis of New Energy Consumption
Fig. 8 shows wind energy consumption across the four scenarios. During peak wind power generation (01:00–05:00 and 21:00–24:00):

Figure 8: Wind power consumption comparison
Scenario 1 vs. 2: GSHP converts electricity to heat, reducing CHP heating and power generation, expanding the grid integration of wind power.
Scenario 2 vs. 3: P2G converts electricity to natural gas, enhancing wind energy utilization.
Scenario 3 vs. 4: Scenario 4 further improves wind power integration due to:
1. CCUS provides CO2 to P2G, lowering P2G operating costs and indirectly facilitating higher wind energy uptake.
2. The process of capturing and utilizing CO2 by CCUS involves electrical energy consumption.
The photovoltaic consumption for the four scenarios is shown in Fig. 9.
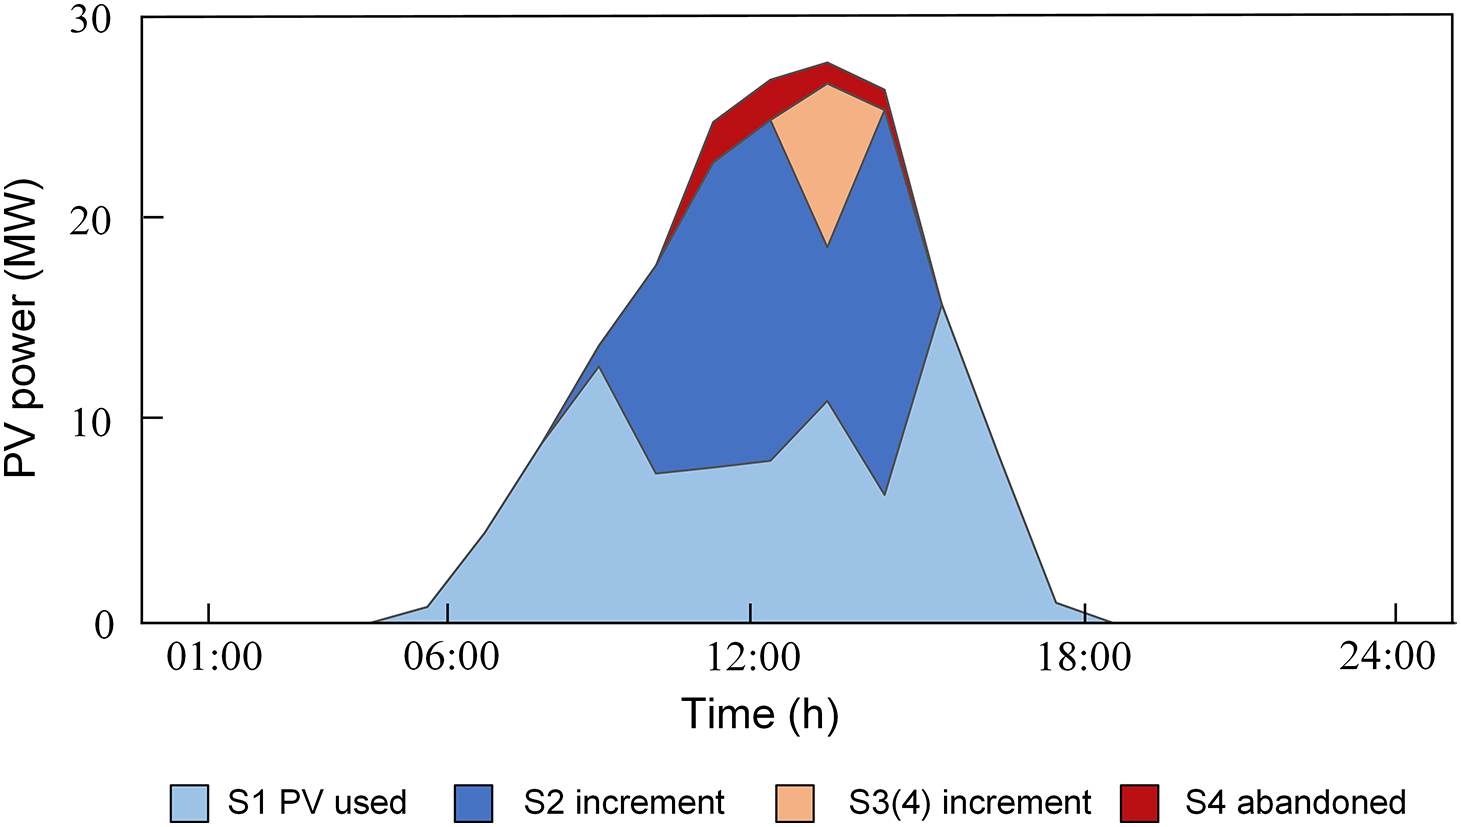
Figure 9: PV power consumption comparison
Scenarios 1 vs. 2: Photovoltaic consumption capacity is improved with the inclusion of GSHP. Fig. 7 shows that during peak PV generation hours (10:00–15:00), GSHP power consumption peaks, expanding PV grid integration and enhancing system-level PV utilization.
Scenarios 2 vs. 3: adding P2G provides flexible energy buffering, improving PV integration efficiency.
Scenarios 3 vs. 4: adding CCUS doesn’t improve PV accommodation capability, mainly because: During peak PV generation hours (10:00–15:00), system heat demand is relatively low. Reduced CHP heat supply leads to decreased electricity supply. CHP-P2G-CCUS is limited by maximum power output, resulting in insufficient power from CHP to CCUS. At this time, CCUS neither promotes P2G conversion nor enhances PV consumption capacity.
5.3 Analysis of IES Carbon Emissions and Operating Costs
Table 3 compares data from the four scenarios. When comparing Scenarios 1 and 2, the total cost decreases by $13,549.84 due to:

1. The addition of GSHP reduces CHP’s heat and electricity output, expanding the grid integration of renewable energy.
2. Reduced wind and PV curtailment penalty costs.
Increasing renewable energy penetration reduces the system’s carbon emissions by 49.55 t. Similarly, P2G enhances renewable energy consumption, leading to a $14,425.09 cost reduction in Scenario 3 compared to Scenario 2. However, carbon emissions remain unchanged as CHP unit power in Scenario 2 equals CHP–P2G unit power in Scenario 3.
Although CHP–P2G–CCUS unit power in Scenario 4 equals CHP–P2G unit power in Scenario 3, CCUS captures and utilizes CO2, reducing carbon emissions in the IES by 110.49 t. CCUS also increases renewable energy usage, lowering the overall system cost by $1605.20.
5.4 Analysis of the Roles of CET-GET
Information on each scenario is shown in Tables 4 and 5. Compared with Scenario 4, Scenario 5 achieves a 91.1-t reduction in carbon emissions, but the overall operating cost rises by $1857 due to the inclusion of CET costs. The findings from Scenario 5 suggest that relying solely on a stepwise CET mechanism fails to strike a balance between economic efficiency and low-carbon objectives, while also exerting minimal influence on renewable energy integration. By contrast, Scenario 6 introduces a GCT mechanism: the system earns green certificates by integrating wind and solar power and earns revenue by selling surplus certificates, improving cost-effectiveness. This mechanism also improves renewable energy integration, reducing wind curtailment by 0.90% and solar curtailment by 1.30%. However, due to continued CET charges, the system’s economic performance still falls short of that in Scenario 4. Scenario 7 features a GCT-linked carbon allowance mechanism under which emissions fall below allocated limits. This configuration cuts costs by $1333.62 compared to Scenario 4 and further improves renewable utilization and emission reductions over Scenario 6—validating the CET-GCT synergy proposed in this study.


5.5 Benefit Analysis under Different CET Mechanism Parameters
Fig. 10 illustrates the operating costs of the IES under varying green certificate and baseline CET prices in Scenario 7. As shown, an increase in green certificate prices exerts a more pronounced effect on the IES: the system actively incorporates more renewable energy to earn certificate-related revenue, thereby reducing electricity purchases and lowering overall operating costs. Similarly, as the baseline CET price rises, the system’s operating costs gradually decline. This occurs because the linked trading mechanism between green certificates and carbon allowances results in allocated allowances exceeding actual emissions, thereby allowing the system to generate revenue through the sale of surplus permits. Higher baseline carbon prices amplify these gains, incentivizing the system to further reduce emissions in pursuit of greater profits. However, in Scenario 7, the per-unit revenue from carbon allowance trading is lower than that from green certificate trading, indicating that green certificate prices exert a more substantial influence on total system costs. Although adjusting the baseline CET price can help regulate costs, once the price reaches $25 in the IES modeled in this study, the carbon reduction potential of the system’s power generation units becomes marginal. Further increases in the baseline price diminish the marginal effect on emission reduction, resulting in limited additional cost savings.
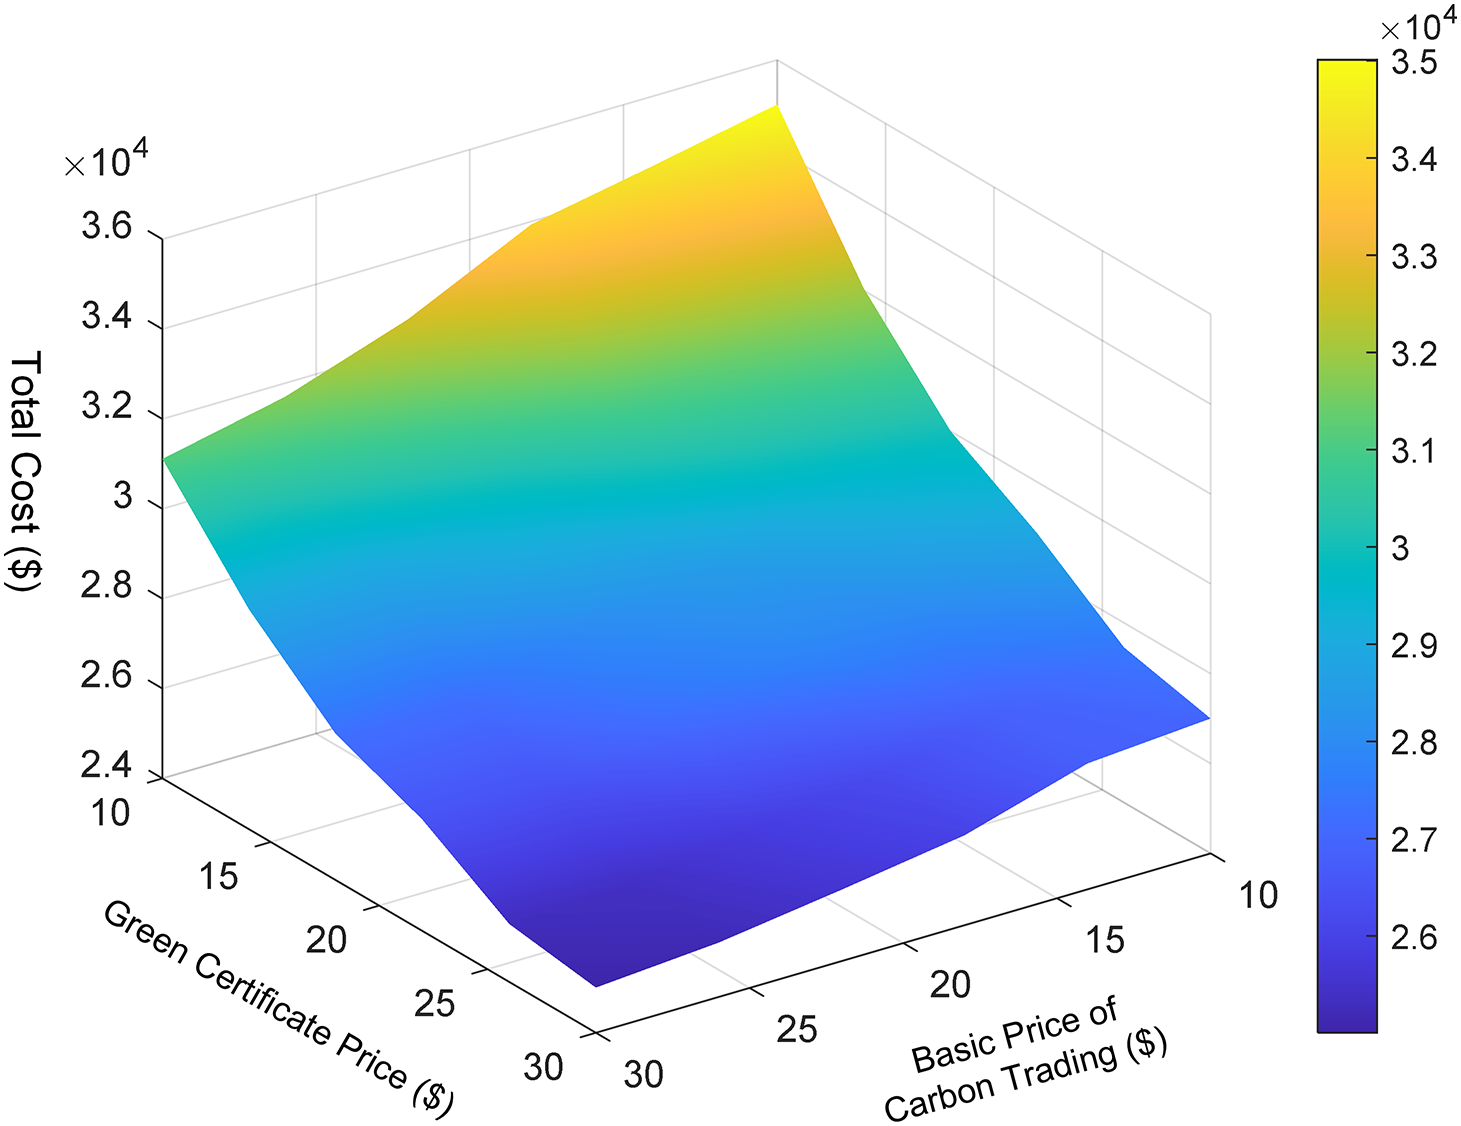
Figure 10: The impact of parameters on total cost
5.6 Distributionally Robust Chance Constraints
To enhance the practical reliability of the proposed scheduling framework and improve its robustness to renewable generation forecast errors, we extend Scenario 7 by incorporating a DRCC approach. This formulation addresses the challenge that the true probability distributions of wind and PV forecast errors are often uncertain in real-world applications. By constructing an ambiguity set based on the Kullback–Leibler divergence around a nominal distribution, the DRCC model ensures that operational constraints are satisfied with a high probability across all plausible distributions. This approach strengthens the model’s adaptability while avoiding the over-conservatism of worst-case methods. The detailed modeling process, along with the sensitivity analysis of risk preferences, is provided in Appendix A. It is worth noting that in this study, the DRCC model is applied exclusively to the uncertainty in wind and PV power generation. Electricity and heat demands are assumed to be deterministic values. This modeling assumption aligns with common practice in related literature, as renewable generation typically represents the primary source of short-term uncertainty in integrated energy systems.
The comparison results between Scenario 7 and Scenario 8 are presented in Table 6. This table highlights the trade-offs introduced by incorporating the distributionally robust chance constraint approach. Although Scenario 8 slightly increases the total cost and carbon emissions compared to Scenario 7, it maintains a comparable level of renewable energy utilization. These results suggest that while the DRCC method enhances system robustness under uncertainty, it does so at a modest economic and environmental cost, providing a more risk-resilient scheduling strategy.

This research proposes an innovative method for the low-carbon economic dispatch of IES, integrating CCUS, CHP, and P2G technologies in conjunction with a unified CET-GCT market mechanism.
The following key contributions are presented:
1. A coupled CCUS–P2G–CHP framework integrated with GSHPs is developed to significantly improve the operational flexibility and efficiency of IES. By eliminating the “heat-led” constraint inherent in traditional CHP systems, the model facilitates higher renewable energy integration, reduces the reliance on fossil-fueled generation, and enables significant reductions in carbon emissions.
2. A coordinated CET–GCT trading mechanism is established, achieving simultaneous cost and carbon emission reductions. Unlike previous studies that model CET and GCT separately, the integrated approach leverages carbon pricing and renewable energy incentives, promoting low-carbon dispatch. Compared to using CET alone, the unified mechanism improves economic performance, achieving a cost saving of $3130.91, a 1.70% increase in wind integration, a 1.60% rise in solar integration, and a 98.13-t decrease in emissions.
3. The influence of CET and GCT parameters on dispatch outcomes is evaluated, offering guidance for policy parameterization. Results suggest that setting both certificate and baseline carbon prices near $25 effectively minimizes total costs.
4. To address uncertainties in renewable generation, a distributionally robust chance-constrained model based on Kullback–Leibler divergence is introduced in Scenario 8. This approach enhances scheduling reliability without excessive conservatism or over-reliance on specific probability distributions.
5. Numerical results confirm the effectiveness of the proposed strategy. In particular, a comparison between Scenario 1 (baseline CHP-dominated structure) and Scenario 8 (the fully coordinated scenario proposed in this study) demonstrates that total system cost decreases significantly from $56,166.66 to $25,840.32, carbon emissions are reduced from 801.38 t to 440.90 t, and renewable energy utilization increases to 98%. These outcomes validate the synergistic benefits of coordinating multiple energy devices and market mechanisms in achieving low-carbon and cost-efficient operation.
Despite the demonstrated advantages, several limitations should be acknowledged:
1. Temporal granularity: The model employs a 24-h day-ahead horizon and lacks multi-period or seasonal dynamics. Future studies could adopt a rolling horizon or hierarchical timescale to better capture real-world dispatch behavior.
2. Parameter stationarity: Energy efficiency, carbon capture rates, and renewable output profiles are treated as fixed. These may vary with temperature, aging, or demand volatility—future work should explore adaptive or scenario-based modeling.
3. Centralized decision-making: The framework assumes centralized optimization, overlooking the strategic behavior of market participants. Incorporating bilevel or game-theoretic models would better reflect stakeholder interactions under coupled energy-carbon trading schemes.
Acknowledgement: Not applicable.
Funding Statement: The authors received no specific funding for this study.
Author Contributions: Cheng Peng was mainly responsible for writing the full manuscript and handling the grammatical review. Hao Qi provided the conceptual inspiration for the article. All authors participated in the revision and content verification of the manuscript. All authors reviewed the results and approved the final version of the manuscript.
Availability of Data and Materials: The data that support the findings of this study are available from the Corresponding Author, upon reasonable request.
Ethics Approval: Not applicable.
Conflicts of Interest: The authors declare no conflicts of interest to report regarding the present study.
Abbreviations
| CET | Carbon Emission Trading |
| GCT | Green Certificate Trading |
| CHP | Combined heat and power |
| GSHPs | Ground Source Heat Pumps |
| P2G | Power-to-Gas |
| CCUS | Carbon Capture, Utilization, and Storage |
| MR | Methane reactor |
| PV | Photovoltaic |
| IES | Integrated Energy System |
| MGT | Micro Gas Turbine |
| CCER | China Certified Emission Reductions |
| CET-GCT | A coordinated mechanism between carbon emission trading and green certificate trading |
| DRCC | Distributionally Robust Chance-Constrained |
| DRO | Distributionally Robust Optimization |
The prediction errors of wind and photovoltaic (PV) power are treated as random variables. Assuming that these prediction errors follow a normal distribution, the chance constraints for their prediction errors can be expressed as:
where
The distributionally robust optimization formulation for integrated energy systems (IES) is shown in Eq. (A3). It ensures that the constraints hold with at least a (
here,
The ambiguity set of probability distributions is defined using the Kullback-Leibler divergence between the actual distribution P and a nominal reference distribution
In this context,
Since the true distribution of the uncertain parameters in Eq. (2) is unknown, solving it directly is highly challenging. However, when the Kullback-Leibler divergence is used to characterize distributional uncertainty, Eq. (A3) can be reformulated into a tractable chance-constrained model under the known reference distribution P0, as shown in Eq. (A6).
In this formulation, “sup” denotes the supremum function, and w is a positive auxiliary variable. Eq. (A6) ensures that the constraint holds with at least probability (
In this approximation,
In distributionally robust optimization, the decision-maker’s risk preference primarily depends on two parameters: the confidence level (

The risk preference of the decision-maker determines the dispatch cost of the IES system. As shown in Table A1, when the confidence level (
References
1. Xu G, Schwarz P, Yang H. Adjusting energy consumption structure to achieve China’s CO2 emissions peak. Renew Sustain Energy Rev. 2020;122(7):109737. doi:10.1016/j.rser.2020.109737. [Google Scholar] [CrossRef]
2. Zhang G, Wang W, Chen Z, Li R, Niu Y. Modeling and optimal dispatch of a carbon-cycle integrated energy system for low-carbon and economic operation. Energy. 2022;240:122795. doi:10.1016/j.energy.2021.122795. [Google Scholar] [CrossRef]
3. Yang M, Liu Y. Research on multi-energy collaborative operation optimization of integrated energy system considering carbon trading and demand response. Energy. 2023;283:129117. doi:10.1016/j.energy.2023.129117. [Google Scholar] [CrossRef]
4. Duan Y, Gao C, Xu Z, Ren S, Wu D. Multi-objective optimization for the low-carbon operation of integrated energy systems based on an improved genetic algorithm. Energies. 2025;18(9):2283. doi:10.3390/en18092283. [Google Scholar] [CrossRef]
5. Lei QY, Peng JY. Modeling and optimization of an integrated energy system for combined cooling, heating, and power. In: Proceedings of the 2024 China Automation Congress (CAC); 2024 Nov 1–3; Qingdao, China. Piscataway, NJ, USA: IEEE; 2024. p. 3494–8. doi:10.1109/CAC63892.2024.10865314. [Google Scholar] [CrossRef]
6. Li J, Wang M, Wu Z, Tian G, Zhang N. Optimal operation strategy of electricity-hydrogen regional energy system under carbon-electricity market trading. Energy Eng. 2024;121(3):619–41. doi:10.32604/ee.2023.044862. [Google Scholar] [CrossRef]
7. Tang J, Xu Y, Qian B, Hou H, Zhang M, Ou J, et al. Economic operation strategy of an electricity-heat coupling system considering complementary low-carbon characteristics of source-load. Front Energy Res. 2024;12:1456151. doi:10.3389/fenrg.2024.1456151. [Google Scholar] [CrossRef]
8. Hasan MMF, Zantye MS, Kazi MK. Challenges and opportunities in carbon capture, utilization and storage: a process systems engineering perspective. Comput Chem Eng. 2022;166(2):107925. doi:10.1016/j.compchemeng.2022.107925. [Google Scholar] [CrossRef]
9. Wang T, Jin Y, Li Y. Optimization scheduling of carbon capture power systems considering energy storage coordination and dynamic carbon constraints. Processes. 2025;13(6):1758. doi:10.3390/pr13061758. [Google Scholar] [CrossRef]
10. Tan ZF, Yang JC, Li FQ, Zhao HC, Li XD. Cooperative operation model of wind turbine and carbon capture power plant considering benefit distribution. Sustainability. 2022;14(18):11627. doi:10.3390/su141811627. [Google Scholar] [CrossRef]
11. Tao Y, Qiu J, Lai S, Zhao J, Xue Y. Carbon-oriented electricity network planning and transformation. IEEE Trans Power Syst. 2021;36(2):1034–48. doi:10.1109/TPWRS.2020.3016668. [Google Scholar] [CrossRef]
12. Ju LW, Yin Z, Zhou QQ, Li QC, Wang P, Tian WX, et al. Nearly-zero carbon optimal operation model and benefit allocation strategy for a novel virtual power plant using carbon capture, power-to-gas, and waste incineration power in rural areas. Appl Energy. 2022;310(29):118540. doi:10.1016/j.apenergy.2022.118540. [Google Scholar] [CrossRef]
13. Son YG, Choi S, Aquah MA. Systematic planning of power-to-gas for improving photovoltaic acceptance rate: application of the potential RES penetration index. Appl Energy. 2023;349(2):121611. doi:10.1016/j.apenergy.2023.121611. [Google Scholar] [CrossRef]
14. Hu Y, Tang Y, Wang K, Yang X. Low carbon and economic dispatching of electric-gas integrated energy system with liquid storage carbon capture equipment. Front Energy Res. 2022;10:986646. doi:10.3389/fenrg.2022.986646. [Google Scholar] [CrossRef]
15. Huang X, Zhong J, Xiao M, Zhu Y, Zheng H, Zheng B. Optimal and sustainable scheduling of integrated energy system coupled with CCS-P2G and waste-to-energy under the “green-carbon” offset mechanism. Sustainability. 2025;17(11):4873. doi:10.3390/su17114873. [Google Scholar] [CrossRef]
16. Qin L, Ma H, Huang C, Li H, Wu S, Wang G. Low-carbon operation optimization of integrated energy system considering CCS-P2G and multi-market interaction. Front Energy Res. 2024;11:1337164. doi:10.3389/fenrg.2023.1337164. [Google Scholar] [CrossRef]
17. Lu A, Zhou J, Qin M, Liu D. Considering carbon-hydrogen coupled integrated energy systems: a pathway to sustainable energy transition in China under uncertainty. Sustainability. 2024;16(21):9256. doi:10.3390/su16219256. [Google Scholar] [CrossRef]
18. Fan J, Zhang J, Yuan L, Yan R, He Y, Zhao W, et al. Deep low-carbon economic optimization using CCUS and two-stage P2G with multiple hydrogen utilizations for an integrated energy system with a high proportion of renewable energy. Sustainability. 2024;16(13):5722. doi:10.3390/su16135722. [Google Scholar] [CrossRef]
19. Zhang ZL, Zhang HJ, Xie B, Zhang XT. Energy scheduling optimization of the integrated energy system with ground source heat pumps. J Clean Prod. 2022;371(3):133668. doi:10.1016/j.jclepro.2022.133668. [Google Scholar] [CrossRef]
20. Liao Z, Zhu X, Shi J. Case study on initial allocation of Shanghai carbon emission trading based on Shapley value. J Clean Prod. 2015;103(4):338–44. doi:10.1016/j.jclepro.2014.06.045. [Google Scholar] [CrossRef]
21. Morthorst PE. The development of a green certificate market. Energy Policy. 2000;28(15):1085–94. doi:10.1016/S0301-4215(00)00094-X. [Google Scholar] [CrossRef]
22. Guo H, Chen Q, Xia Q, Kang C. Modeling strategic behaviors of renewable energy with joint consideration on energy and tradable green certificate markets. IEEE Trans Power Syst. 2020;35(3):1898–910. doi:10.1109/TPWRS.2019.2953114. [Google Scholar] [CrossRef]
23. Dong H, Yun Y, Ma Z. Low-carbon optimal operation of integrated energy system considering multi-energy conversion and concentrating solar power plant participation. Power Syst Technol. 2020;44(10):3689–700. (In Chinese). doi:10.1109/icpsasia55496.2022.9949692. [Google Scholar] [CrossRef]
24. Du X, Liang K, Li D. Matching model of carbon emission reduction rewards and punishments and carbon trading in power industry based on blockchain technology. Autom Electr Power Syst. 2020;44(19):29–35. (In Chinese). [Google Scholar]
25. Ma Y, Wang H, Hong F, Yang J, Chen Z, Cui H, et al. Modeling and optimization of combined heat and power with power-to-gas and carbon capture system in integrated energy system. Energy. 2021;236(5):121392. doi:10.1016/j.energy.2021.121392. [Google Scholar] [CrossRef]
26. Feng Z, Zhang J, Lu J, Zhang Z, Bai W, Ma L, et al. Low-carbon economic dispatch strategy for integrated energy systems under uncertainty counting CCS-P2G and concentrating solar power stations. Energy Eng. 2025;122(4):1531–60. doi:10.32604/ee.2025.060795. [Google Scholar] [CrossRef]
27. Zhang S, Li W, Li Z, Zhang X, Lu Z, Ge X. Two-stage low-carbon economic dispatch of integrated demand response-enabled integrated energy system with ladder-type carbon trading. Energy Eng. 2022;120(1):181–99. doi:10.32604/ee.2022.022228. [Google Scholar] [CrossRef]
28. Yan N, Ma G, Li X, Guerrero JM. Low-carbon economic dispatch method for integrated energy system considering seasonal carbon flow dynamic balance. IEEE Trans Sustain Energy. 2023;14(1):576–86. doi:10.1109/TSTE.2022.3220797. [Google Scholar] [CrossRef]
29. Wang Y, Qiu J, Tao Y, Zhao J. Carbon-oriented operational planning in coupled electricity and emission trading markets. IEEE Trans Power Syst. 2020;35(4):3145–57. doi:10.1109/TPWRS.2019.2953114. [Google Scholar] [CrossRef]
30. Fan W, Tan Q, Zhang A, Ju L, Wang Y, Yin Z, et al. A bi-level optimization model of integrated energy system considering wind power uncertainty. Renew Energy. 2022;202(12):973–91. doi:10.1016/j.renene.2022.12.007. [Google Scholar] [CrossRef]
31. Chen H, Wu H, Li H, Chen F, Shui S, Li Z. Bi-level optimal scheduling of integrated energy systems considering incentive-based demand response and green certificate-carbon trading mechanisms. Energy Rep. 2025;11(23):450–68. doi:10.1016/j.egyr.2024.12.008. [Google Scholar] [CrossRef]
32. Liu F, Bie Z, Wang X. Day-ahead dispatch of integrated electricity and natural gas system considering reserve scheduling and renewable uncertainties. IEEE Trans Sustain Energy. 2019;10(2):646–58. doi:10.1109/TSTE.2018.2843121. [Google Scholar] [CrossRef]
33. Lu X, Chan KW, Xia S, Zhou B, Luo X. Security-constrained multiperiod economic dispatch with renewable energy utilizing distributionally robust optimization. IEEE Trans Sustain Energy. 2019;10(2):768–79. doi:10.1109/TSTE.2018.2847419. [Google Scholar] [CrossRef]
34. Wang G, Wu Y, Qian X, Zhao Y. Distributed robust scheduling optimization of wind-thermal-storage system based on hybrid carbon trading and Wasserstein fuzzy set. Energy Eng. 2024;121(11):3417–35. doi:10.32604/ee.2024.052268. [Google Scholar] [CrossRef]
Cite This Article
 Copyright © 2025 The Author(s). Published by Tech Science Press.
This work is licensed under a Creative Commons Attribution 4.0 International License , which permits unrestricted use, distribution, and reproduction in any medium, provided the original work is properly cited.
 Downloads
 Citation Tools