
 Submit a Paper
 Propose a Special lssue
 Open Access
ARTICLE

Energy-Based Approach for Short-Term Voltage Stability Analysis and Assessment
1 School of Electrical Engineering, Northeast Electric Power University, Jilin, 132012, China
2 State Grid Shanxi Electric Power Company, Taiyuan, 030002, China
3 State Grid Shanxi Electric Power Company Electric Power Research Institute, Taiyuan, 030002, China
* Corresponding Author: Zhichong Cao. Email:
(This article belongs to the Special Issue: Integration of Renewable Energies with the Grid: An Integrated Study of Solar, Wind, Storage, Electric Vehicles, PV and Wind Materials and AI-Driven Technologies)
Energy Engineering 2025, 122(11), 4733-4754. https://doi.org/10.32604/ee.2025.068683
Received 04 June 2025; Accepted 16 July 2025; Issue published 27 October 2025
 View Full Text
 Download PDF
Abstract
With the increasing penetration of renewable energy in power systems, grid structures and operational paradigms are undergoing profound transformations. When subjected to disturbances, the interaction between power electronic devices and dynamic loads introduces strongly nonlinear dynamic characteristics in grid voltage responses, posing significant threats to system security and stability. To achieve reliable short-term voltage stability assessment under large-scale renewable integration, this paper innovatively proposes a response-driven online assessment method based on energy function theory. First, energy modeling of system components is performed based on energy function theory, followed by analysis of energy interaction mechanisms during voltage instability. To address the challenge of traditional energy functions in online applications, a convolutional neural network-long short-term memory (CNN-LSTM) hybrid artificial Intelligence approach is introduced. By quantifying the contribution of each energy component to voltage stability, key energy terms are identified. The measurable electrical quantities corresponding to these key energies serve as inputs, while the energy at the voltage unstable equilibrium point (UEP) obtained from offline simulations is used as both the energy threshold and the output of the artificial intelligence model, enabling the construction of an artificial intelligence model for energy threshold prediction. The measurable electrical quantities corresponding to these key energies serve as inputs, while the energy at the unstable equilibrium point (UEP) obtained from offline simulations acts as the output, enabling the construction of an artificial intelligence model for energy threshold prediction. Real-time response data are fed into the model to predict the system’s instantaneous energy threshold, which is then compared with the transient energy at fault clearance to evaluate stability. Validation on both a 3-machine, 10-bus system and the New England 10-machine, 39-bus system confirms the method’s adaptability and accuracy. The simulation results demonstrate that the proposed short-term voltage stability assessment model outperforms other methods in both accuracy and computational efficiency.Keywords
The large-scale integration of renewable energy into power systems has brought unprecedented voltage stability challenges. Firstly, the substantial penetration of renewables significantly weakens the system’s voltage support capability, adversely affecting its dynamic characteristics under disturbances [1,2]. Secondly, when abrupt power fluctuations from renewable generation trigger cascading congestion events, conventional voltage control devices may fail to respond swiftly enough to match these rapid dynamics, potentially exacerbating voltage instability risks [3–5]. Severe voltage incidents could have profound socio-economic consequences. However, accurate short-term voltage stability assessment can provide crucial decision-making support for control measures during the initial stages of faults, which holds vital strategic significance for ensuring secure and stable grid operation.
Short-term voltage stability assessment methods can be broadly classified into two categories: model-driven and data-driven approaches. The model-based methods, which are grounded in well-defined physical mechanisms, primarily include the Thevenin equivalent method, energy function-based analysis, and induction motor slip-rate-based assessment. Fundamental research in references [6,7] has elucidated the physical essence of voltage instability, establishing that its root cause stems from the system’s inability to meet load power demand. Based on this theory, the Thevenin equivalent method is proposed. This method suggests that when the Thevenin equivalent impedance matches the load equivalent impedance, the system reaches its maximum power transfer limit, at which point voltage instability occurs [8,9]. While this method offers a clear physical interpretation, its assessment accuracy heavily depends on the precision of system equivalent parameters. The energy function theory not only demonstrates unique advantages in rotor angle stability analysis by enabling stability margin determination through energy difference calculation, but has also been innovatively extended to voltage stability assessment. Reference [10] made an innovative contribution by applying this theory to voltage stability analysis, proposing a novel identification method based on the controlling unstable equilibrium point (UEP). This approach enables voltage stability evaluation by comparing transient energy against a precisely calculated threshold energy derived from voltage-dominant UEP identification. However, traditional energy function methods require meticulous system equivalencing for critical energy computation, where modeling inaccuracies can significantly impact stability assessment results. Regarding motor load analysis, studies [11–13] have thoroughly investigated induction motor dynamic response characteristics, revealing that stalling effects following system disturbances trigger substantial reactive power demand, leading to severe voltage collapse [14–16]. Building on this finding, reference [17] innovatively established the motor slip rate as a stability criterion, developing a comprehensive voltage stability assessment framework based on critical clearing time (CCT). Although these methods possess well-defined physical mechanisms, practical implementation in power grid operations faces challenges due to the difficulty in obtaining accurate real-time slip rate measurements from system response data.
The rapid development of wide-area measurement systems (WAMS) has provided robust technical support for data-driven short-term voltage stability assessment. Current data-driven approaches primarily consist of two categories: the maximum Lyapunov exponent (MLE) method and artificial intelligence-based methods. Specifically, Reference [18] proposed using the maximum Lyapunov exponent to characterize the convergence/divergence properties of voltage dynamics, with the zero-crossing of the exponent serving as the criterion for judging voltage trajectory stability. While computationally efficient and straightforward to implement, this method essentially represents an alternative mathematical characterization of voltage magnitude variations without substantial physical mechanism support. In contrast, machine learning-based approaches can directly extract features from massive datasets without requiring precise system modeling, leading to their widespread application in power system stability assessment. References [19,20] transformed the voltage stability problem into a binary classification task, achieving stability assessment through offline training and online application phases. Although the trained models can achieve high evaluation accuracy, these methods not only demand extensive offline training data but also struggle to provide physically interpretable explanations for voltage instability processes [21–23]. While both approaches demonstrate satisfactory assessment accuracy, they share the common limitation of lacking clear physical interpretability.
In summary, while traditional energy function methods possess clear physical mechanisms, their critical energy calculation relies heavily on precise system modeling, which significantly limits their practical application for online stability assessment. In contrast, data-driven approaches can establish the mapping relationship between historical disturbance data and energy thresholds without requiring system modeling, enabling rapid threshold prediction and offering new perspectives for physically interpretable stability assessment. Therefore, this paper innovatively integrates energy function theory with CNN-LSTM to propose a response-driven online short-term voltage stability assessment method based on energy function theory. The main contributions are:
(1) Established energy function models for system components based on energy function theory, analyzed post-fault energy interaction mechanisms, and identified key energy components.
(2) Addressed the computational challenges of traditional energy threshold methods by introducing a CNN-LSTM network that uses measurable electrical quantities corresponding to key energies as inputs and energy thresholds as outputs, constructing an artificial intelligence model capable of accurate threshold prediction.
(3) Real-time calculation of transient energy values from response data, enabling precise short-term voltage stability assessment by comparing these values with CNN-LSTM predicted thresholds.
(4) Comprehensive testing on both a 3-machine 10-bus system and the New England 10-machine 39-bus system demonstrated the method’s superior accuracy and computational efficiency compared to existing approaches.
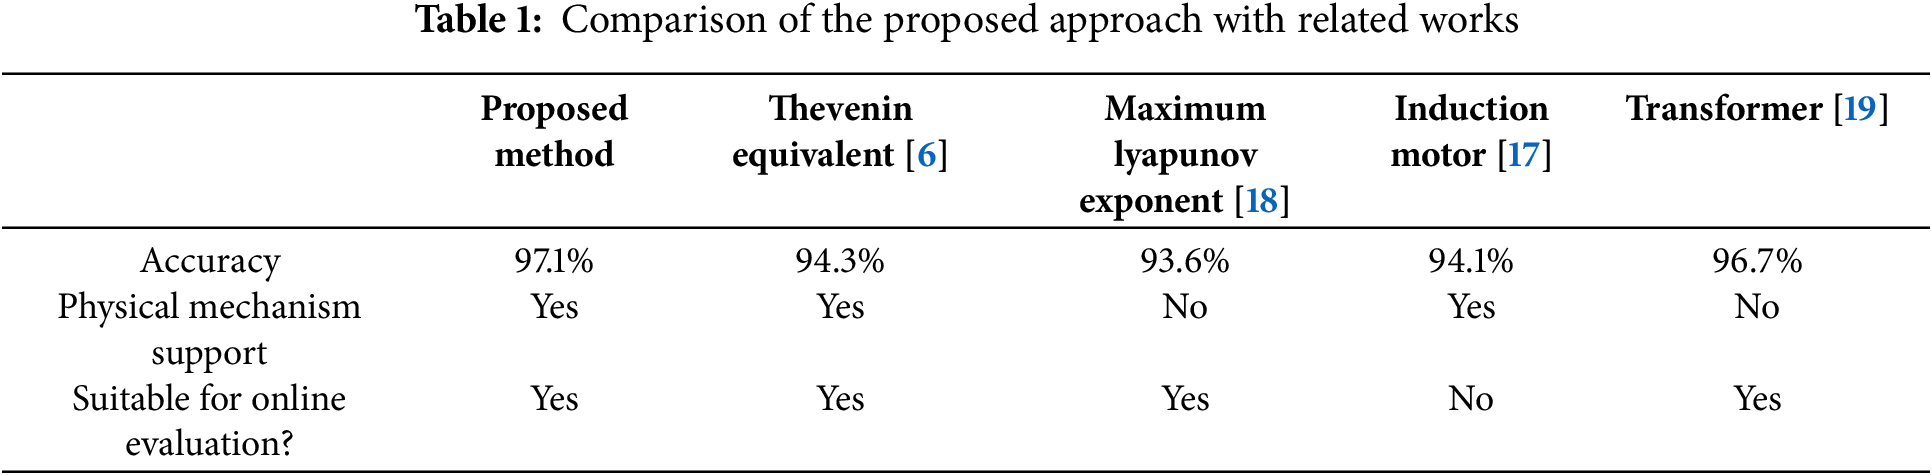
To delineate the contributions of the proposed work, a comprehensive comparison with other methods and recent studies has been conducted, as presented in Table 1.
This paper is organized as follows: Section 2 details the power system energy function formulation. Section 3 presents the computation methodology for critical energy thresholds. The proposed online short-term voltage stability assessment framework is described in Section 4, while Section 5 validates the approach through two test cases. Concluding remarks are provided in Section 6.
2 The Detailed Energy Function Construction of the Power System
2.1 Energy Function Construction of the Power System
For a multi-bus network, according to Kirchhoff’s law, the current balance equation of the node can be expressed as:
where IG is the current vector injected by the generator, the direction of the injection network is defined as the positive direction, IL is the current vector absorbed by the load from the network, Ybus is the admittance matrix of the system node, and Ubus is the voltage vector of all nodes in the system.
The energy of the power system can be expressed as the complex integral of the current and voltage phasors, which can be expressed as:
Compute the complex integrals of both sides of the bus current Eq. (1). The power system energy function can be expressed as:
where Ui = Uiejθi, dUi = ejθidUi + jUiejθidθi, Ui, Uj represent the voltage magnitude at bus i and j. θi denotes the voltage phase angle relative to the system reference. Yij is the value of the admittance between nodes i and j. IGi is the current vector of the i generator, ILi is the current vector of the i load. Vnet represents the potential energy of the network. VGi represents the energy of generator i. VLi represents the potential energy at the ith load node.
In summary, the system energy is composed of network, generator, and load-related energy. The classical second-order state equations of the generator are expressed as:
where δ represents the rotor angle of the generator. ω represents the angular speed of the generator. Pm and Pe are respectively the mechanical power and electromagnetic power of the generator. M is the generator inertia time constant and D is the damping coefficient.
The energy of the generator can be described by Eq. (5).
where the subscripts x and y represent the corresponding x, y axis components.
The power system network is composed of transmission lines and transformers. The model of transmission lines and transformers is represented by Π-type equivalent circuits. Assume the network is lossless, namely Gij = 0. Therefore, the network energy can be expressed as:
The load part is usually composed of a ZIP load and a dynamic load. The load energy of the motor can be calculated based on the port energy theory. For any port in the system, port energy can be used to represent the transient energy of all components inside the port. So the transient energy of the dynamic load and ZIP load is as follows:
where PLi, QLi, ULi, and θLi are respectively active power, reactive power, bus voltage, and phase angle at the load port.
If it is a wind turbine, the energy calculation method is used to account for the impact of renewable energy generation on the power system. The energy of a wind turbine is expressed as:
where Pw, Qw, Ui, and θi are respectively active power, reactive power, bus voltage, and phase angle at the wind power port.
Assuming that the network is lossless, according to the Eqs. (5)–(8), the total energy of the system can be expressed as Eq. (9).
According to the node current balance equation, the energy satisfies the conservation law. The system energy curve after the system is disturbed is shown in Fig. 1. Eq. (9) shows the conservation of total energy in the system. If damping is taken into account for the system, the derivatives of the total kinetic and potential energy should be negative. Energy in the system is dissipated, causing a reduction in the combined kinetic and potential energy of the system.
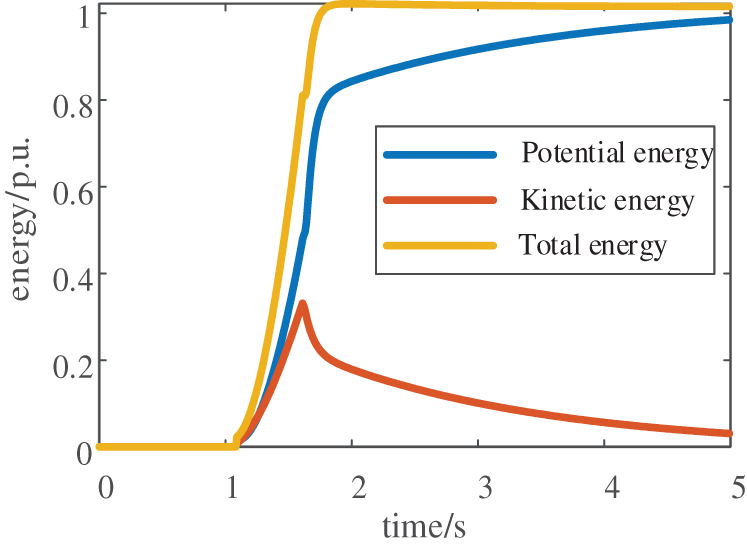
Figure 1: The post-disturbance energy curve of the system
2.2 Application of Energy Function in Voltage Stabilization
According to the theory of the structure preservation model, the power system can be viewed as an energy system. In the absence of external forces, its energy is conserved. When the system is disturbed, the generator suffers unbalanced torque, and the network structure changes, resulting in a significant alteration of both transient kinetic energy and potential energy. When the fault is removed, the network structure undergoes further changes. Once the fault is removed, energy initiates a transfer between the generator and the grid, resulting in a mutual conversion of kinetic and potential energy. The stability of the system is evaluated by its ability to absorb and dissipate the transient energy injected during faults. When the system operating trajectory crosses the rotor angle-based unstable equilibrium boundary, transient energy transfer becomes constrained, leading to progressive energy accumulation and consequent rotor angle instability. Conversely, exceeding the voltage-based unstable equilibrium boundary causes system energy to surpass its stability limit, ultimately inducing voltage collapse.
The critical procedure for voltage stability assessment via energy function methodology involves determining the system energy at the voltage-dominant unstable equilibrium condition. The value at the voltage-dominant UEP is defined as the energy threshold Vcr. The transient energy value Vcl is computed according to the response data when the fault is removed. The short-term voltage stability is evaluated by comparing the energy levels of the two. The system will be stable if the energy is met Vcl < Vcr. On the contrary, the system will be unstable if the energy meets Vcl > Vcr.
3 Calculation of Critical Energy
3.1 Traditional Method of Calculating Critical Energy
First, a Thevenin equivalent is constructed for all system components except the load buses, and the initial iteration values are calculated based on system model parameters. Using these initial values, the stability region of the system is determined through iterative computation. Finally, following the methodology described in Reference [10], the voltage-dominant unstable equilibrium point (UEP) is identified, and its corresponding energy is computed as the critical energy threshold. The detailed flow diagram is illustrated in Fig. 2. Although possessing clear physical mechanisms, the accuracy of this method depends critically on the precision of modeling parameters. With the increasing complexity of modern power systems, the demand for fine-grained modeling has grown significantly. Traditional equivalent methods tend to amplify computational errors, making it increasingly difficult to meet contemporary accuracy requirements.
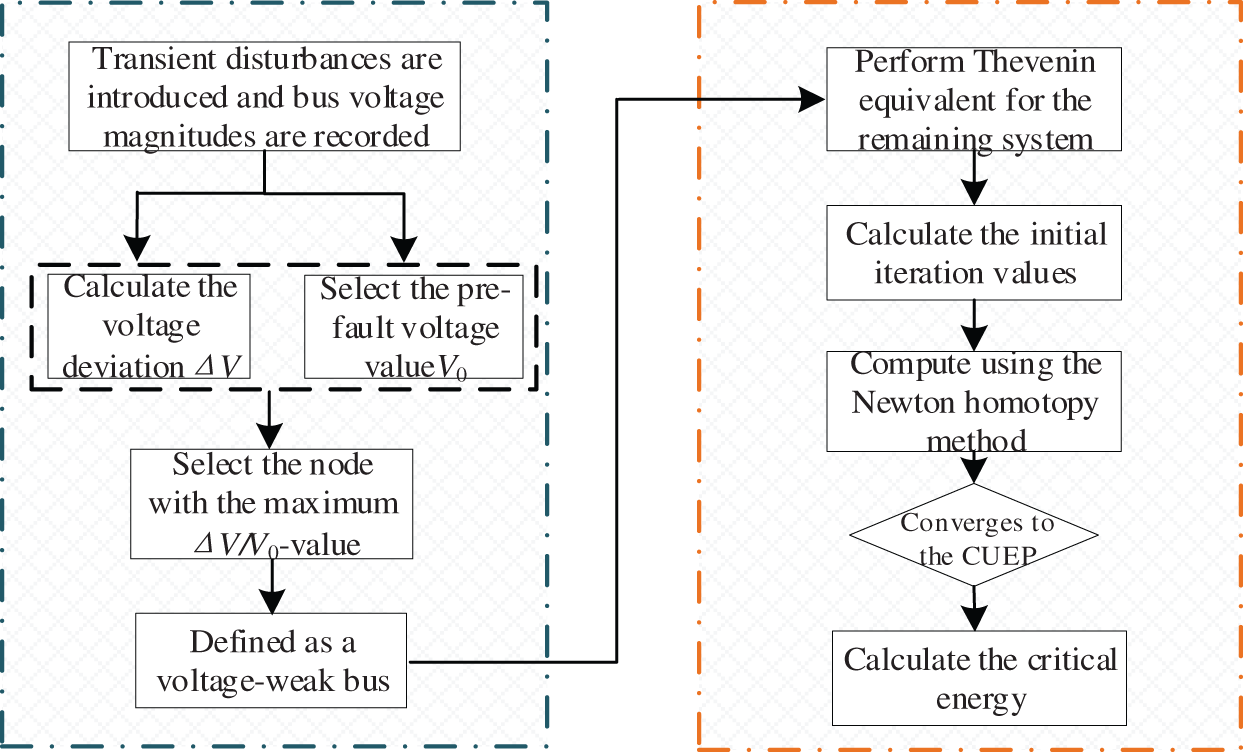
Figure 2: Flowchart of traditional critical energy threshold calculation
3.2 Calculation of Critical Energy Based on Artificial Intelligence
Considering the complexity of renewable energy modeling, Ref. [24] proposed a method to find critical states through grid response data. The critical energy calculated using the energy function derived from UEP is very close to the energy value obtained by simulating the system state of the fault critical removal time, which makes it possible to accurately calculate the critical energy from the response data. However, it is difficult to apply this method to calculate critical energy and evaluate voltage stability online.
The continuous advancement of artificial intelligence technology in recent years has made it increasingly applicable to the power system, owing to its ability to extract data features. The artificial intelligence model is trained using the offline-calculated critical energy value as the output and the measurable electrical quantity during the fault period as the input. Through extensive offline training, the accurate online prediction of system critical energy can be achieved by utilizing power system response data.
Neural network architectures have gained significant attention for time-series forecasting applications. CNN-LSTM utilizes the advantages of CNN in extracting data features and LSTM in analyzing time series data, which has higher accuracy and robustness than LSTM [25,26]. Fig. 3 shows the CNN-LSTM model for predicting time series data.
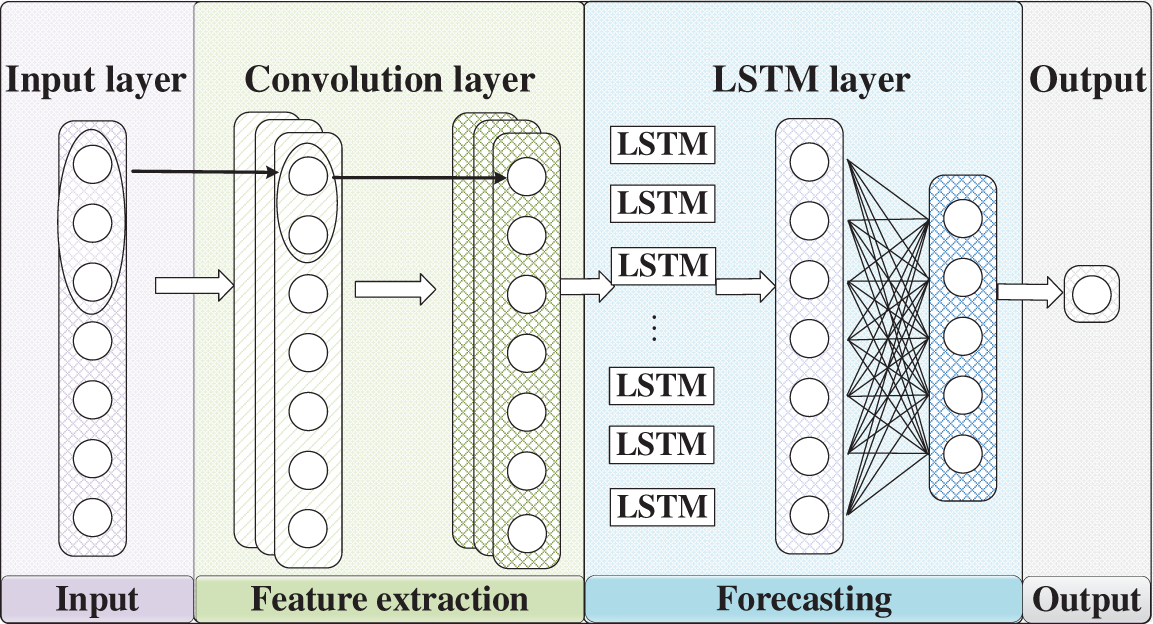
Figure 3: CNN-LSTM model
The CNN architecture consists of convolutional layers and pooling layers, as illustrated in the Fig. 4. The convolutional layers are responsible for extracting features from the data and transforming them into feature maps. Pooling layers can reduce the dimensionality of feature vectors, reduce model parameters, and control overfitting. Based on the above, CNN has good feature extraction ability for time series data and improves accuracy.
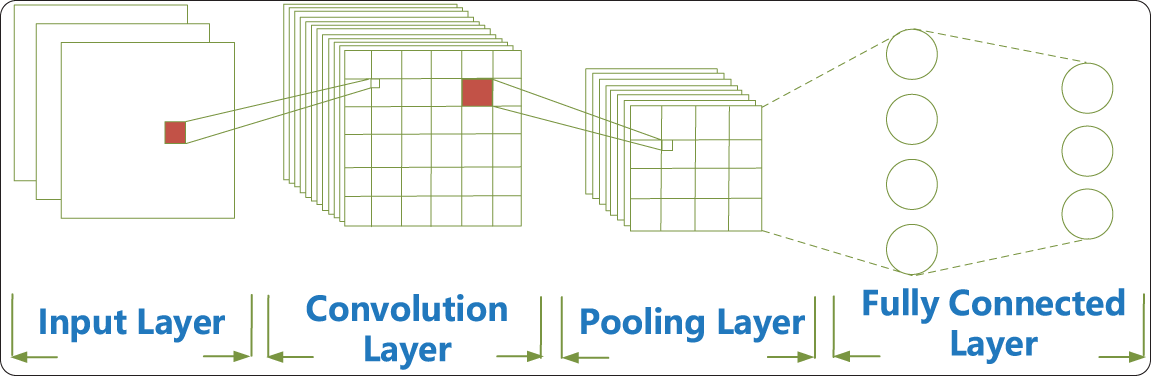
Figure 4: CNN model
The LSTM model consists of a forget gate, input gate, and output gate, as illustrated in Fig. 5. Detailed descriptions of the LSTM architecture are provided in Appendix A.
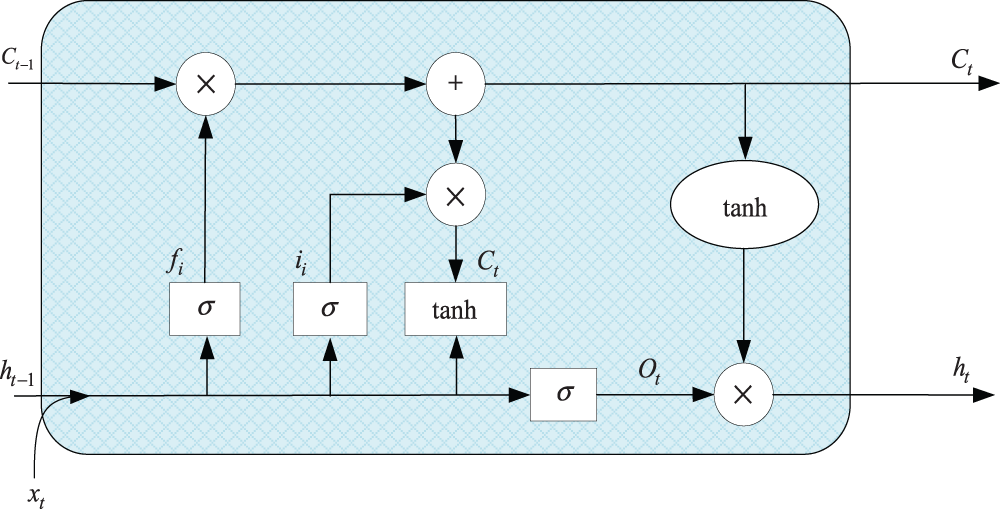
Figure 5: LSTM model
4 Online Assessment of the STVS Framework Based on the Energy Function
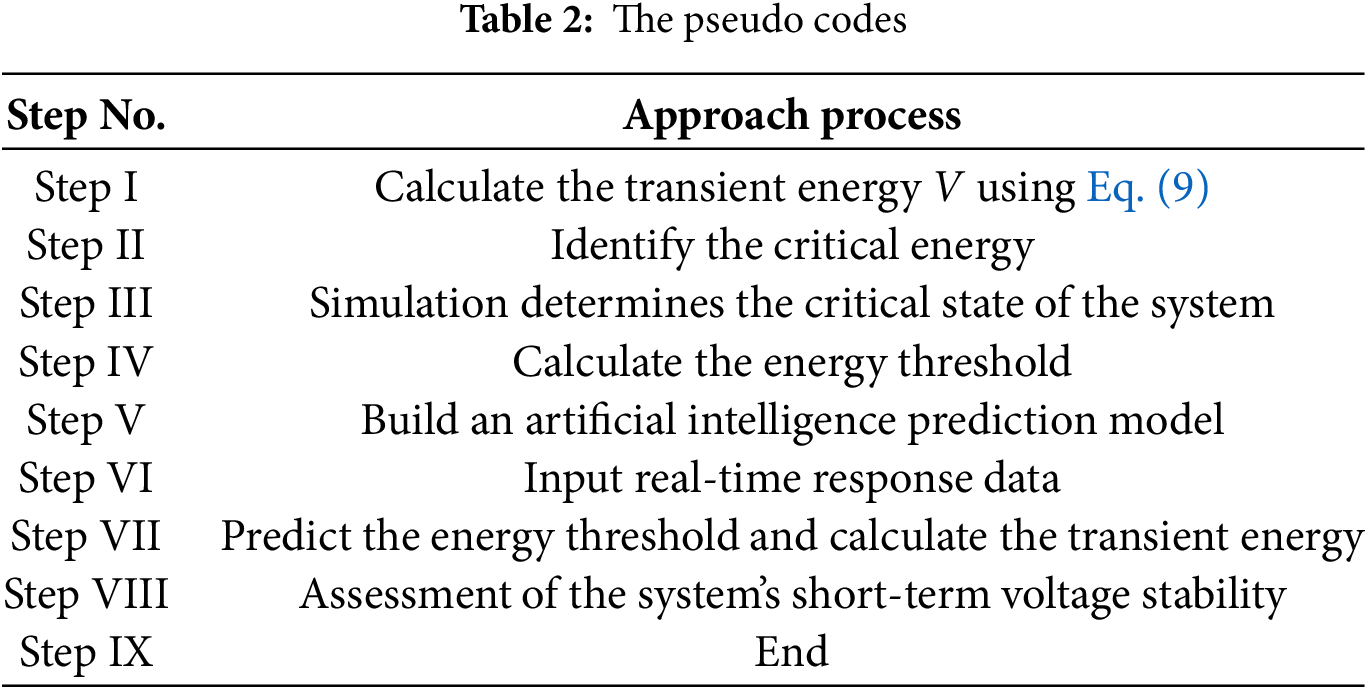
To achieve online stability evaluation based on energy function, a method for short-term voltage stability online assessment is proposed. The overall scheme for evaluating short-term voltage stability is illustrated in Fig. 6. The pseudo code of the proposed scheme is presented in Table 2, with its core execution steps summarized as follows:
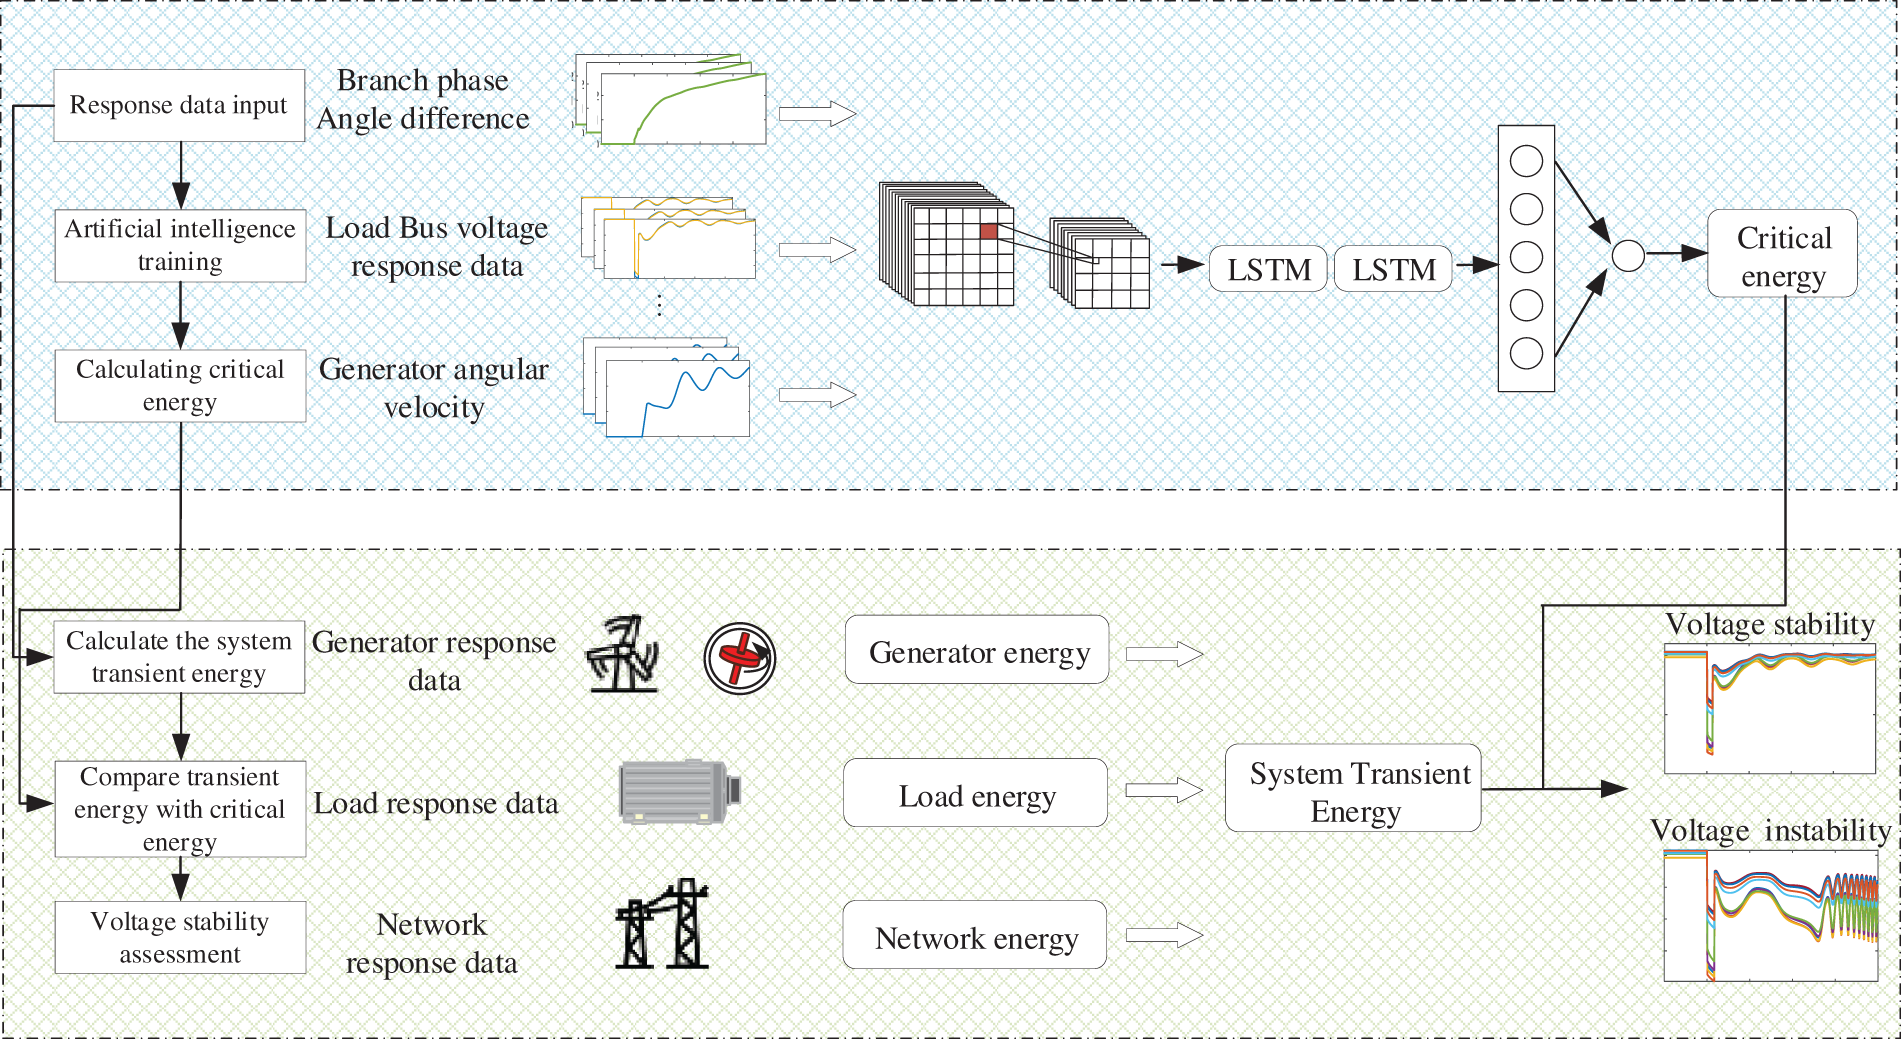
Figure 6: Process of short-term voltage stability evaluation scheme
Offline training: The energy of each part of the system is calculated according to the energy function theory, and the electrical quantity that constitutes the largest energy is defined as the key electrical quantity. The critical state of the system is obtained by actual offline data and simulation, and the system energy value under the critical state of voltage is taken as the energy threshold. A large amount of offline training is carried out with the measured electrical quantity during the fault period as the input of artificial intelligence, and the critical energy value under such working conditions as the output.
Online application: After the system is disturbed, the actual grid response data is input into the trained CNN-LSTM model to predict the energy threshold of the system under this condition. Meanwhile, the transient energy is determined using the system’s response data. This transient energy is then compared with the system’s energy threshold to assess the short-term voltage stability.
5.1 The 3-Generator 10-Bus System
To validate the effectiveness of the proposed method, a 3-machine, 10-bus test system is selected as the case study. Generator G3 is replaced with a wind turbine of equivalent capacity, with bus 7 serving as a static load and bus 10 configured with a composite load comprising induction motors and static loads. The system configuration is illustrated in Fig. 7.
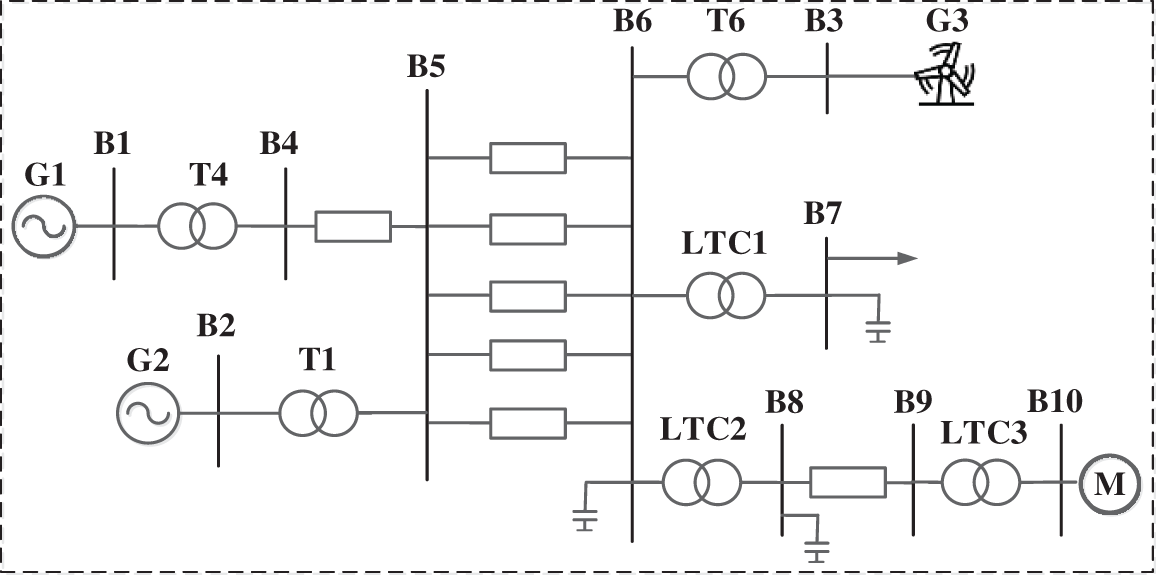
Figure 7: 3-generator 10-bus system
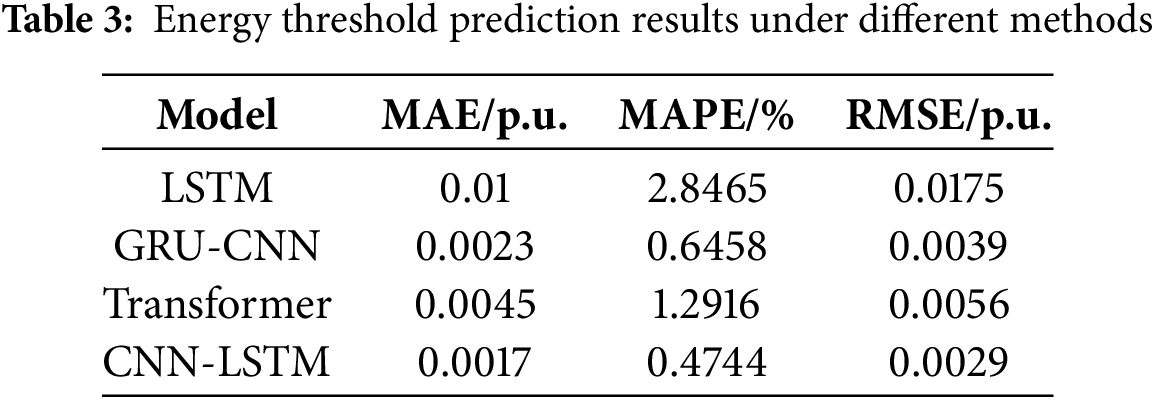
A three-phase fault is applied to line 5–6. The post-fault voltage profile and energy trajectory are shown in Figs. 8 and 9, respectively. As demonstrated in Fig. 8, the system voltage experiences a dip during the fault but rapidly recovers to stability after fault clearance, thanks to adequate power reserves. Fig. 9 reveals that while the total system energy increases during the fault, the post-fault period exhibits energy conservation through continuous kinetic-potential energy conversion. Through systematic energy composition analysis, key stability-influencing energy components are identified, with their corresponding electrical quantities serving as artificial intelligence input features. Extensive offline simulations determined the system’s critical states, enabling calculation of critical energy thresholds using Eq. (9) as model outputs. The test system comprises 13 transmission lines in total. To collect sufficient training data, faults with varying clearing times are applied at different locations along these lines, ultimately generating a comprehensive dataset of 2600 cases. Following extensive offline training, an artificial intelligence model capable of accurately predicting critical energy thresholds has been successfully developed. As illustrated in Fig. 10, the CNN-LSTM generates a time-series output that progressively converges toward the actual values. To ensure prediction reliability, the output at t = 0.2 s is ultimately selected as the system’s energy threshold for subsequent stability assessment. To accurately quantify the accuracy of the artificial intelligence method in predicting the critical energy, metrics such as mean absolute error (MAE), mean absolute percentage error (MAPE), and root mean square error (RMSE) have been introduced. The comparative studies are conducted between this paper’s prediction model and alternative approaches, with the quantitative results presented in Table 3. The simulation outcomes demonstrate that this paper’s methodology achieves superior accuracy.
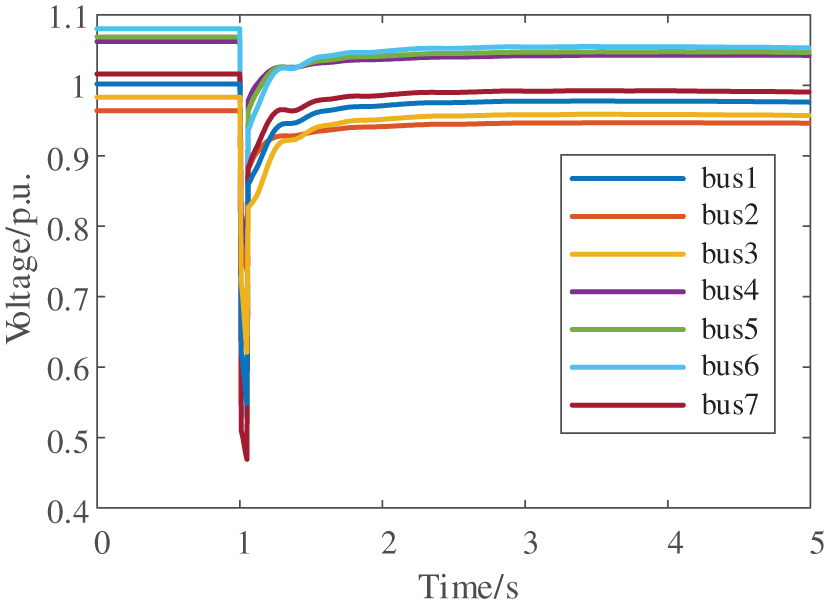
Figure 8: Voltage response after disturbance
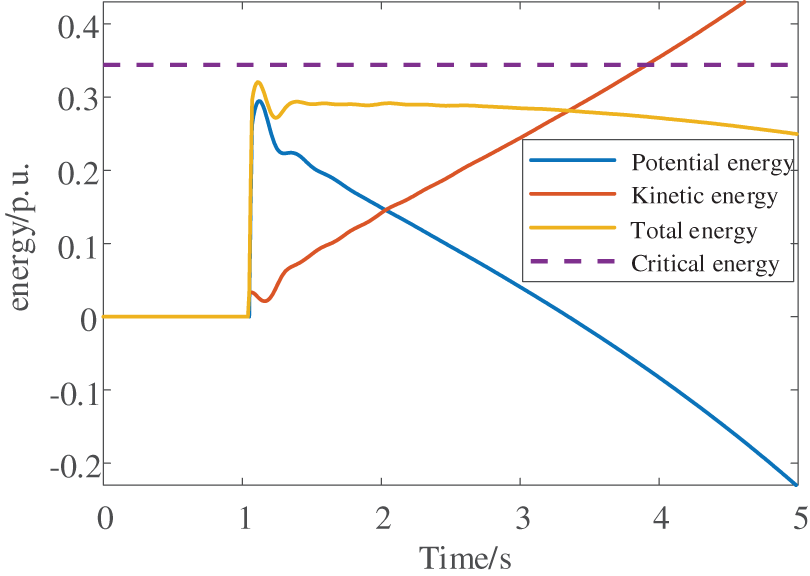
Figure 9: System energy after disturbance
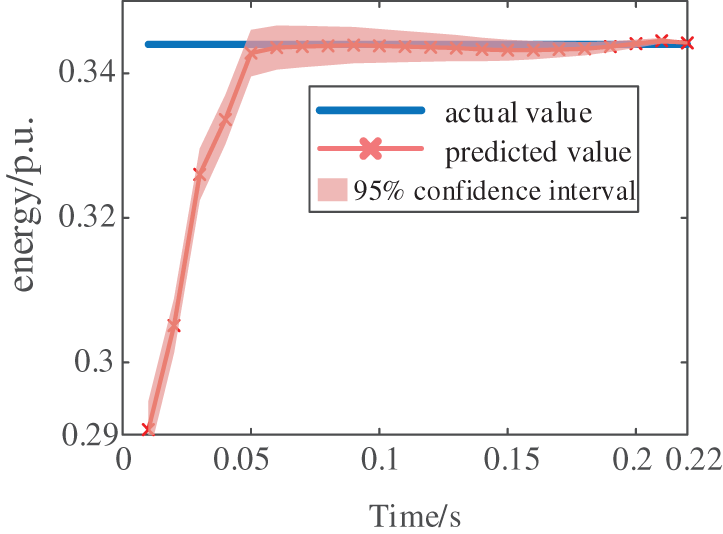
Figure 10: The predicted energy threshold value by CNN-LSTM
As shown in Fig. 10, the artificial intelligence predicted that the critical energy threshold is 0.344 p.u. Based on the system response data, the transient energy at fault clearance is calculated as 0.32 p.u. According to energy function theory, the system will recover to a stable state, which aligns with the actual response observed in Fig. 8. This consistency validates the effectiveness of the proposed method for voltage stability assessment.
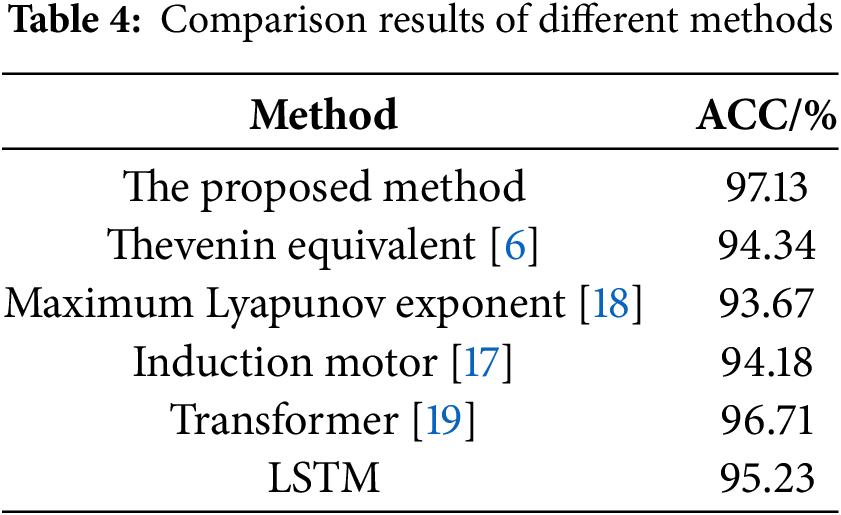
The proposed voltage stability assessment scheme is further validated under voltage instability conditions. When Line 4–5 experienced a severe disturbance, the system’s nodal voltages and energy trajectories are shown in Figs. 11 and 12, respectively. After fault clearance, the voltages remained depressed while the reactive power absorption of induction motors increased significantly. The sudden surge in load-side reactive power demand exacerbated the voltage decline and eventually led to rotor angle instability. The artificial intelligence predicted energy threshold converged to 0.358 p.u. as shown in Fig. 13, while the transient energy at fault clearance is calculated as 0.411 p.u. based on energy function theory. According to the theory, the system had crossed the stability boundary, resulting in voltage instability—a conclusion consistent with the actual voltage collapse observed in Fig. 11, further verifying the method’s effectiveness. To further validate the effectiveness of the proposed method, comparative studies are conducted against other approaches. The prediction accuracy of different methods is summarized in Table 4, with simulation results demonstrating the superior performance of this paper’s approach.
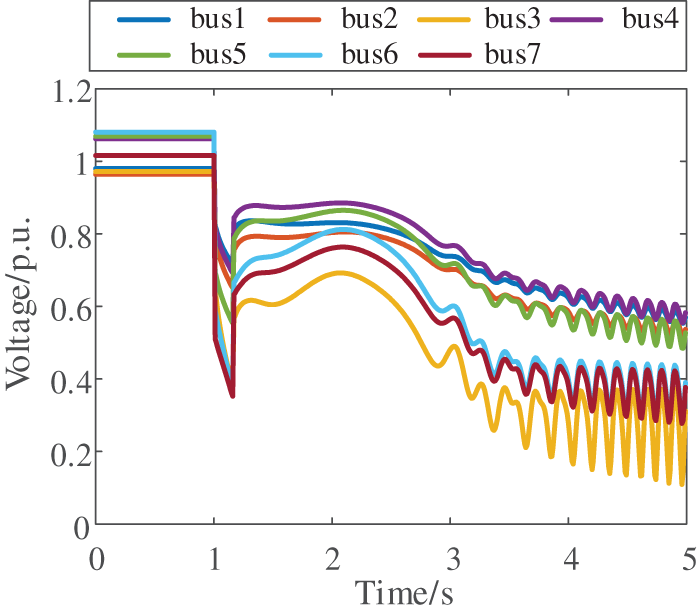
Figure 11: Voltage response after disturbance
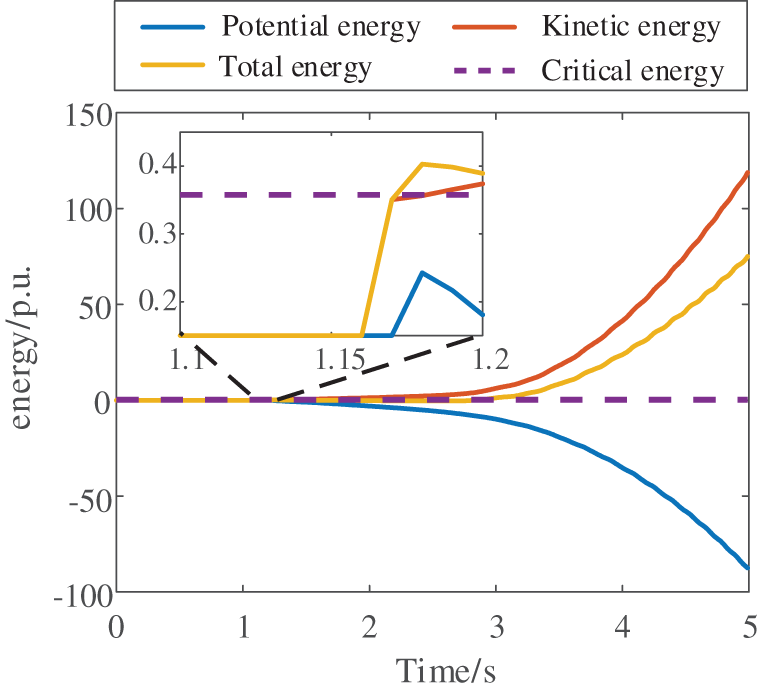
Figure 12: System energy after disturbance
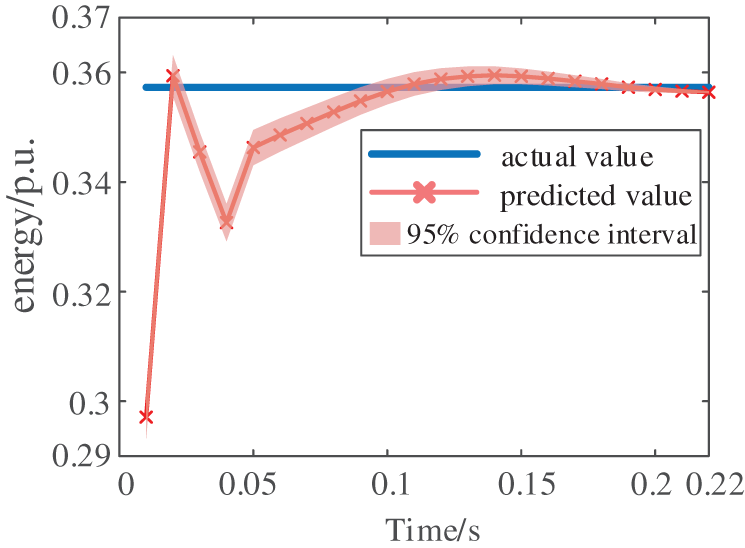
Figure 13: The predicted energy threshold value by CNN-LSTM
5.2 The New England 39-Bus Test System
5.2.1 Low Penetration Rate of New Energy Systems
This study further validates the method’s effectiveness in a larger-scale New England 10-machine 39-bus test system, where Generator G10 is replaced with a wind turbine of equivalent capacity to simulate power grid characteristics under low renewable energy penetration. The system configuration is illustrated in Fig. 14. To ensure robustness, 4140 sample cases are generated by applying disturbances at different locations across the system’s 46 branches. These samples are divided into training and testing sets at an 8:2 ratio. Using electrical quantities corresponding to dominant energy components as inputs and precomputed energy thresholds from extensive offline simulations as outputs, an offline artificial intelligence model is trained to accurately predict system critical energy thresholds.
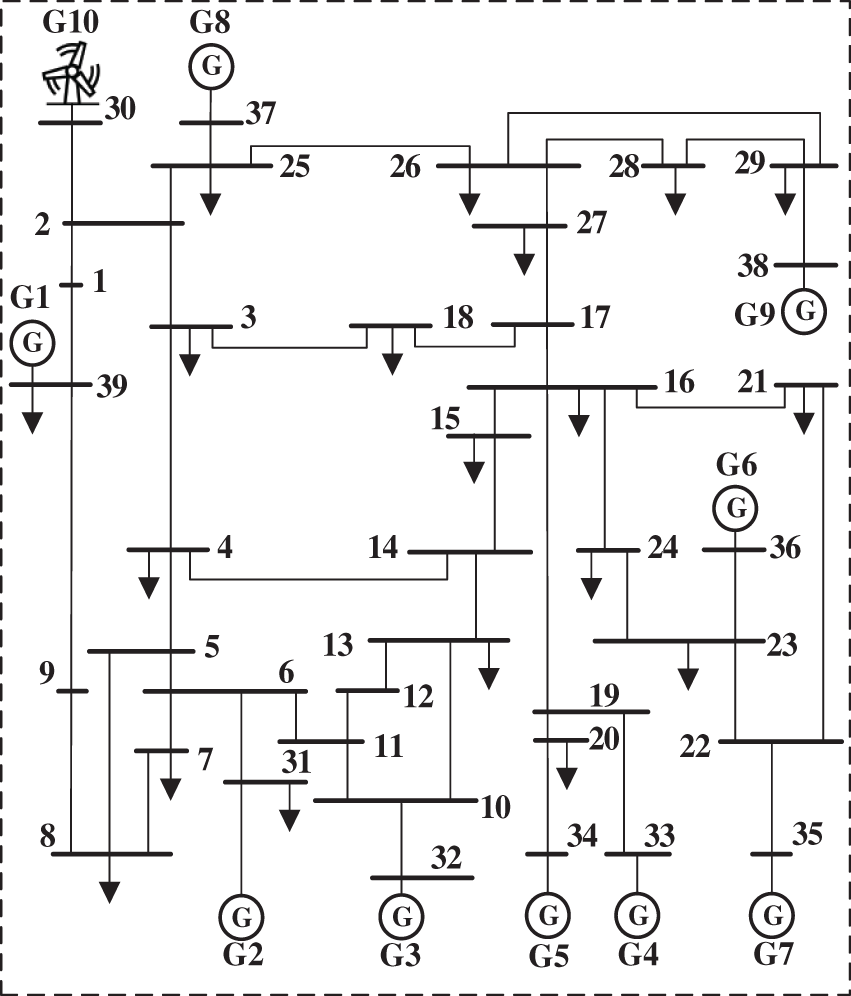
Figure 14: The New England 39-bus test system
To validate the effectiveness of the proposed short-term voltage stability assessment method, a three-phase fault is applied to Line 1–2. The resulting system voltage profiles and energy distributions are shown in Figs. 15 and 16, respectively. To validate the effectiveness of the proposed method in predicting energy thresholds, comparative studies are conducted against other state-of-the-art approaches, with the results summarized in Table 5. The simulation results demonstrate that the proposed method achieves superior performance in energy threshold prediction. As demonstrated in Fig. 17, the artificial intelligence model’s predicted energy threshold ultimately converges to 34.7713 p.u. Based on the response data, the transient energy at fault clearance is calculated as 26.7924 p.u. The simulation results confirm that the transient energy value is significantly lower than the predicted threshold, indicating that the system will recover voltage stability. This prediction aligns perfectly with the actual voltage recovery process observed in Fig. 15, thereby fully verifying the applicability and accuracy of the proposed method for large-system voltage stability conditions.
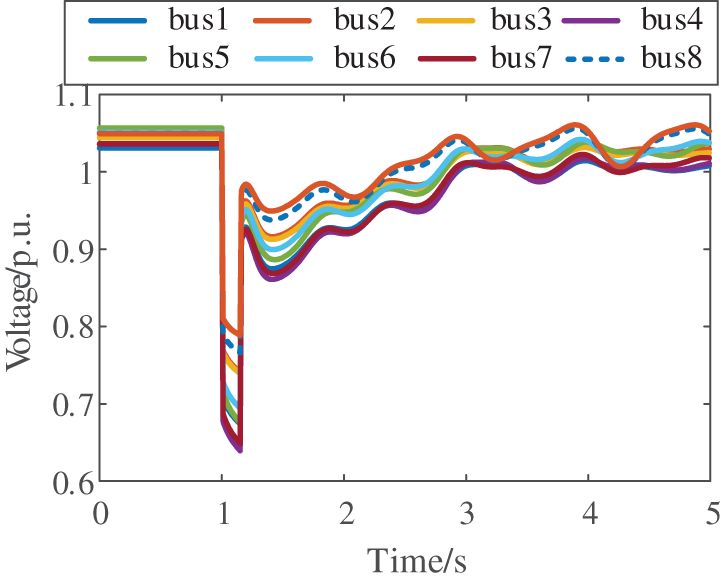
Figure 15: Voltage response after disturbance
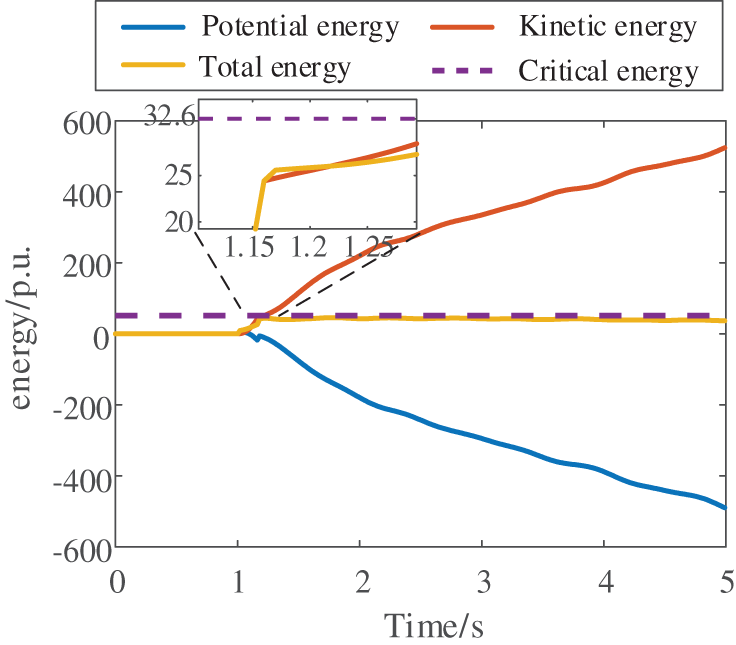
Figure 16: System energy after disturbance
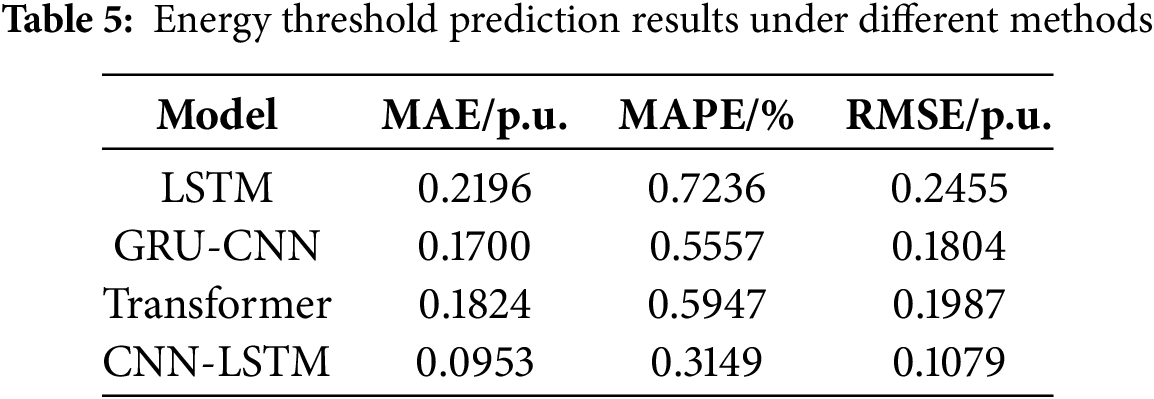
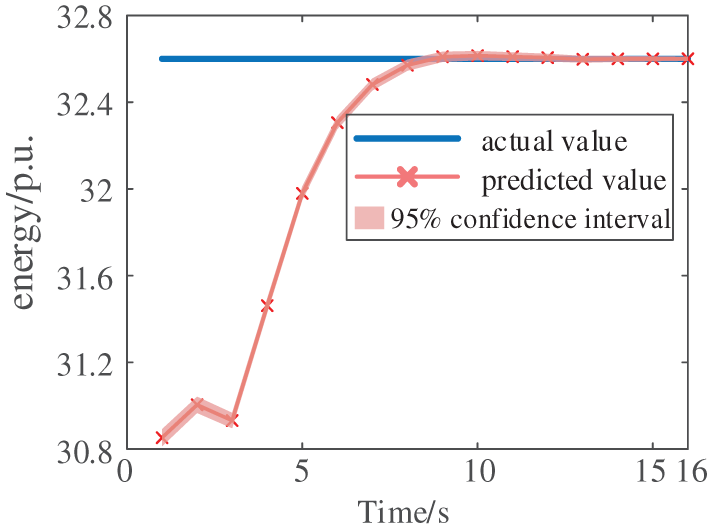
Figure 17: The predicted energy threshold value by CNN-LSTM
The proposed method is further validated under voltage instability conditions. Figs. 18 and 19 respectively demonstrate the system’s voltage response and transient energy evolution following a severe fault on Line 3–18. As shown in Fig. 20, the artificial intelligence-based assessment model predicted a critical energy threshold of 35.8338 p.u., while the measured transient energy at fault clearance reached 36.7182 p.u. The exceedance of transient energy over the critical threshold indicates impending voltage instability. This prediction shows perfect agreement with the actual voltage collapse observed in Fig. 18, thereby confirming the method’s effectiveness under voltage instability conditions.
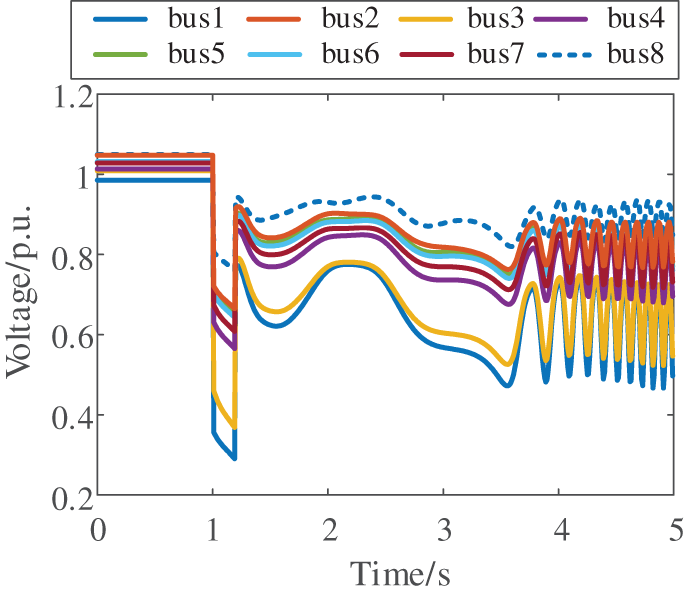
Figure 18: Voltage response after disturbance
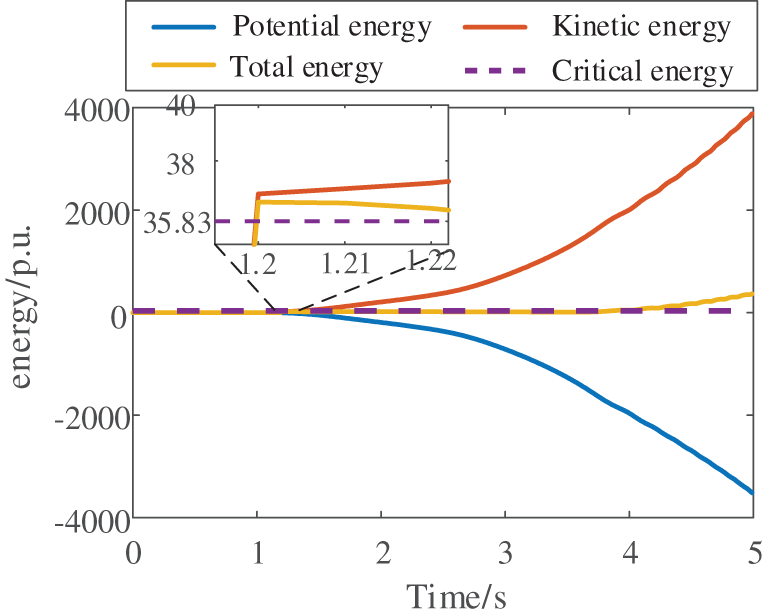
Figure 19: System energy after disturbance
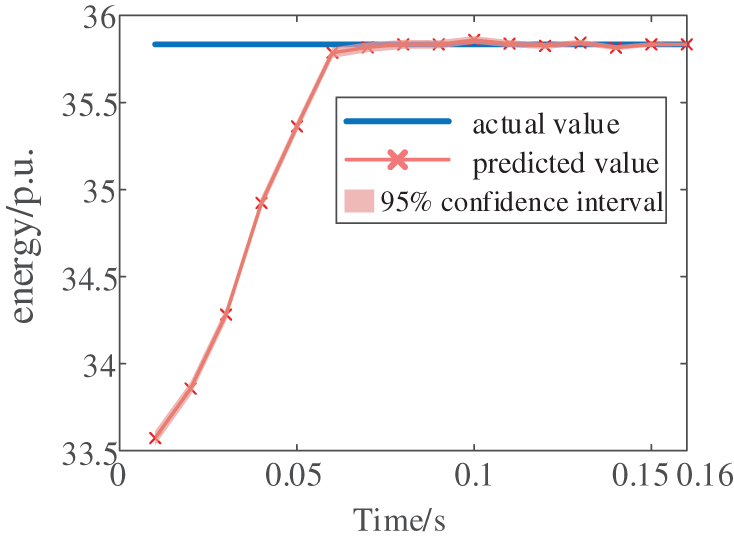
Figure 20: The predicted energy threshold value by CNN-LSTM
5.2.2 High Penetration Rate of New Energy Systems
To thoroughly validate the effectiveness of the proposed method, additional testing is conducted under higher renewable energy penetration scenarios. The study employed the same 10-machine 39-bus system, with Generators G8, G9, and G10 replaced by wind turbines of equivalent capacity, as illustrated in Fig. 21. Following a short-circuit fault on Line 16–21, the system’s voltage and energy responses are shown in Figs. 22 and 23, respectively. Comparative analysis of Figs. 15 and 22 reveals that increased renewable penetration exacerbates post-disturbance voltage fluctuations. After extensive offline training, the method’s performance is evaluated using 40 representative samples, with the relative and absolute errors presented in Figs. 24 and 25. As shown in Fig. 26, the predicted energy threshold for this scenario is 34.7532 p.u., while the transient energy at fault clearance is calculated to be 31.7504 p.u. According to energy function theory, the system maintains voltage stability—a conclusion consistent with the actual voltage response observed in Fig. 22.
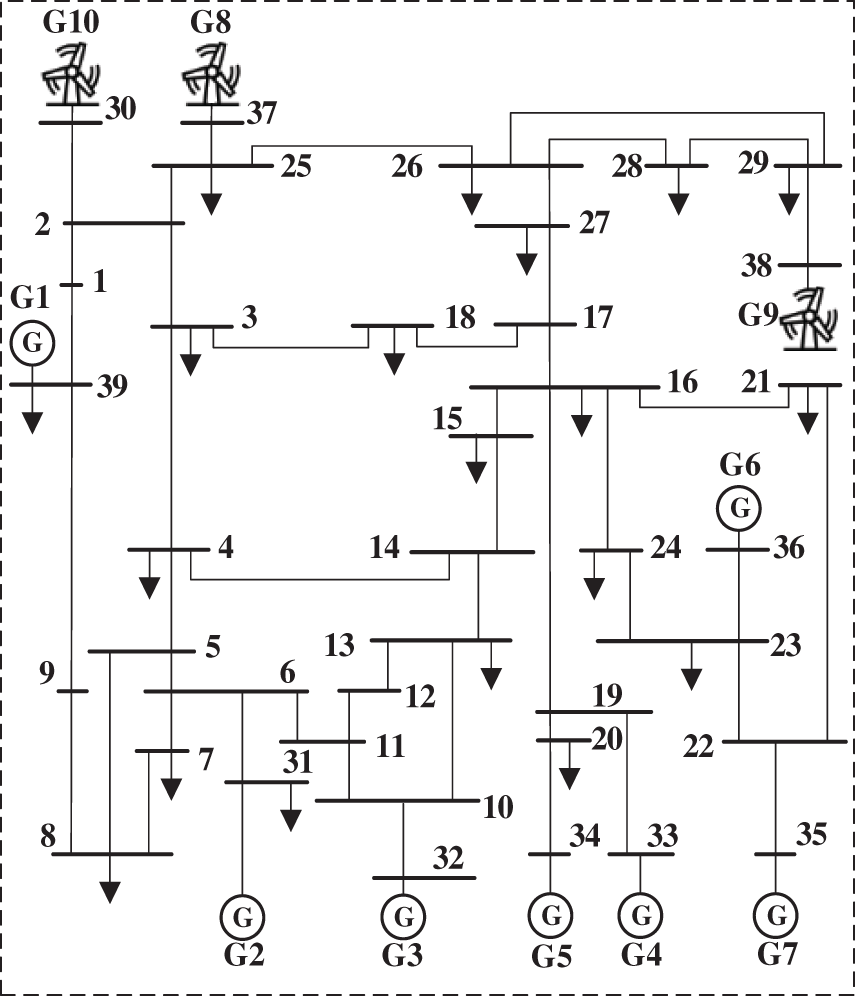
Figure 21: The New England 10-generator 39-bus test system
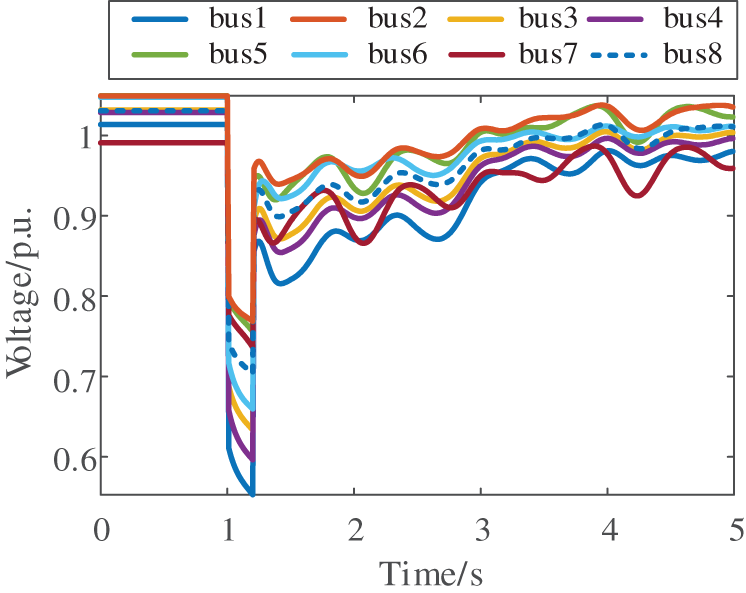
Figure 22: Voltage response after disturbance
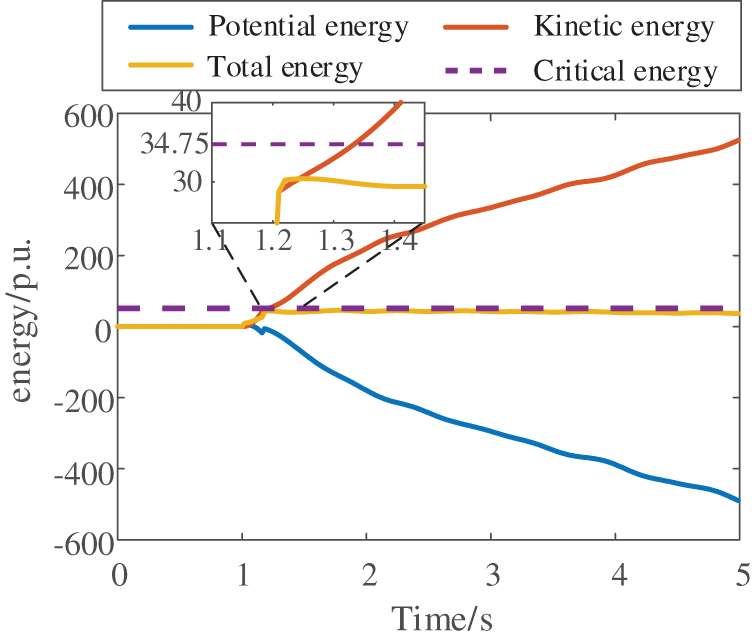
Figure 23: System energy after disturbance
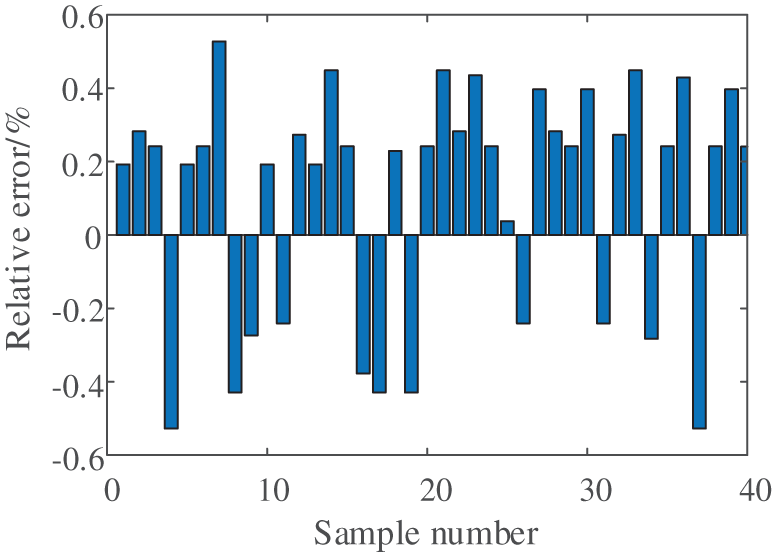
Figure 24: The relative error of the predicted critical energy
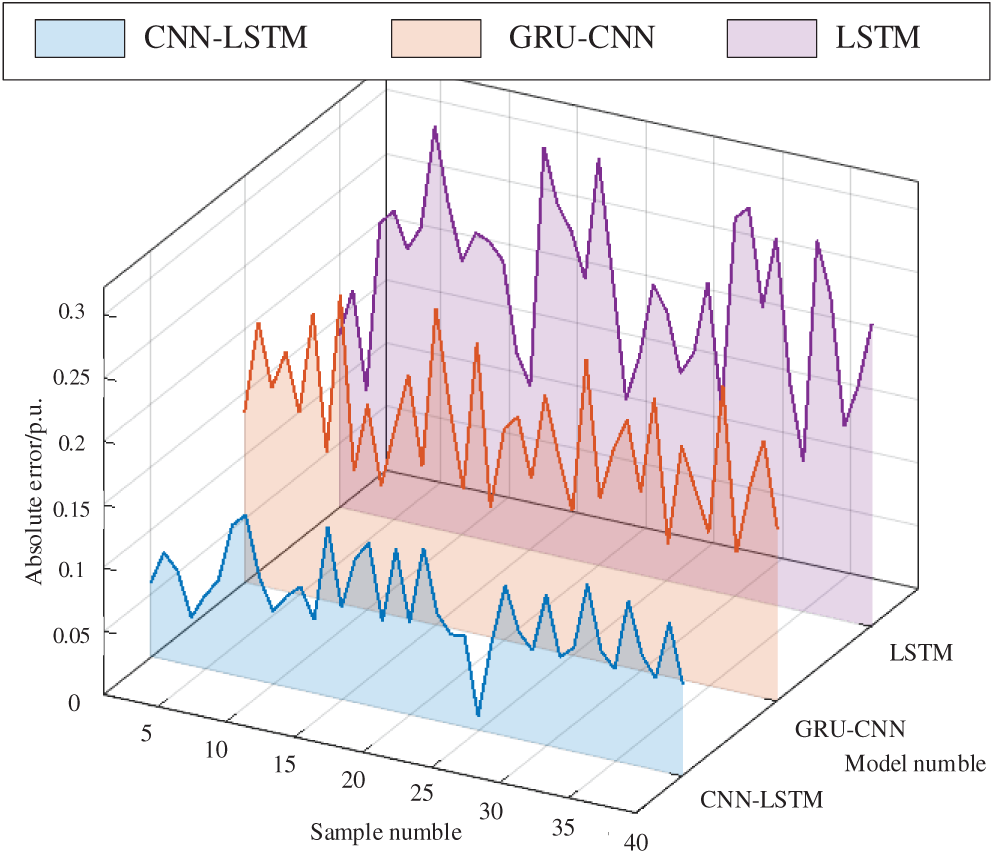
Figure 25: The absolute error of the predicted critical energy
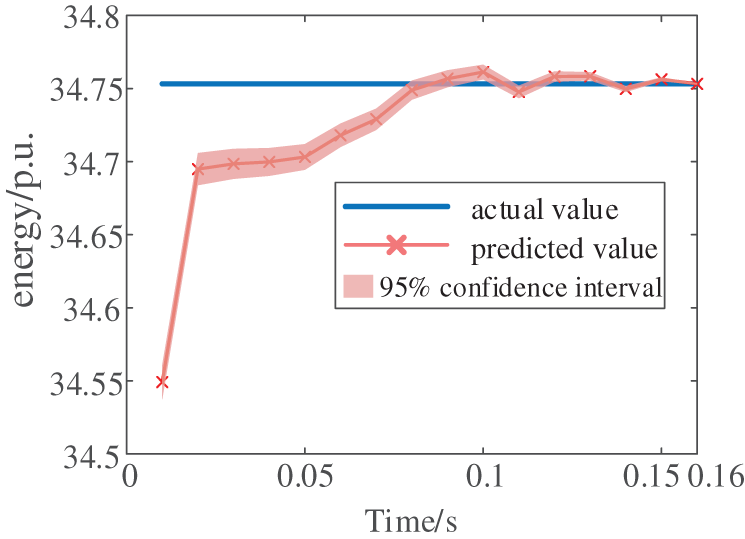
Figure 26: The predicted energy threshold value by CNN-LSTM
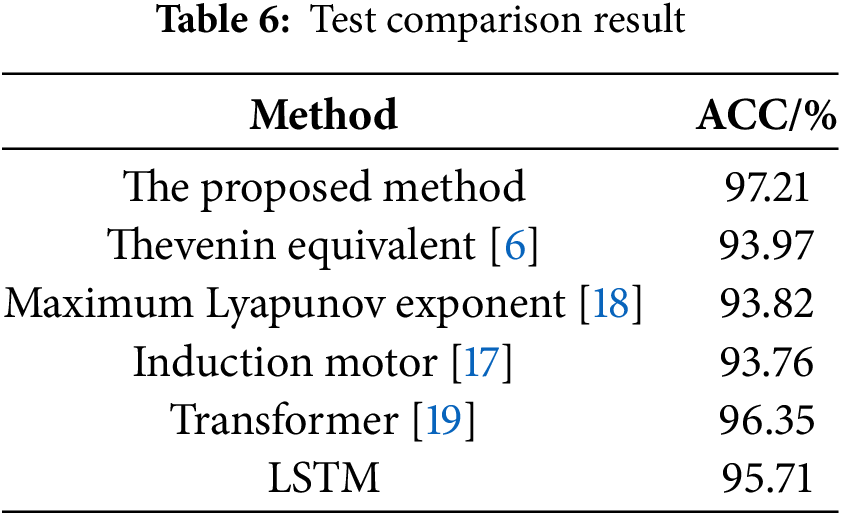
The method’s effectiveness is further verified under voltage instability conditions by applying a more severe disturbance on Line 23–24. The resulting voltage profiles and energy trajectories are shown in Figs. 27 and 28, respectively. As demonstrated in Fig. 29, the artificial intelligence model’s predicted energy threshold converges to 28.8994 p.u., while the transient energy calculated from response data at fault clearance reaches 35.0393 p.u. The exceedance of transient energy over the critical threshold confirms impending voltage instability—a prediction that aligns perfectly with the actual voltage collapse observed in Fig. 27. Comparative studies against other voltage stability assessment methods are presented in Table 6. The simulation results demonstrate that the proposed method maintains high accuracy while preserving physical interpretability, enabling reliable online voltage stability assessment in practical power grids.
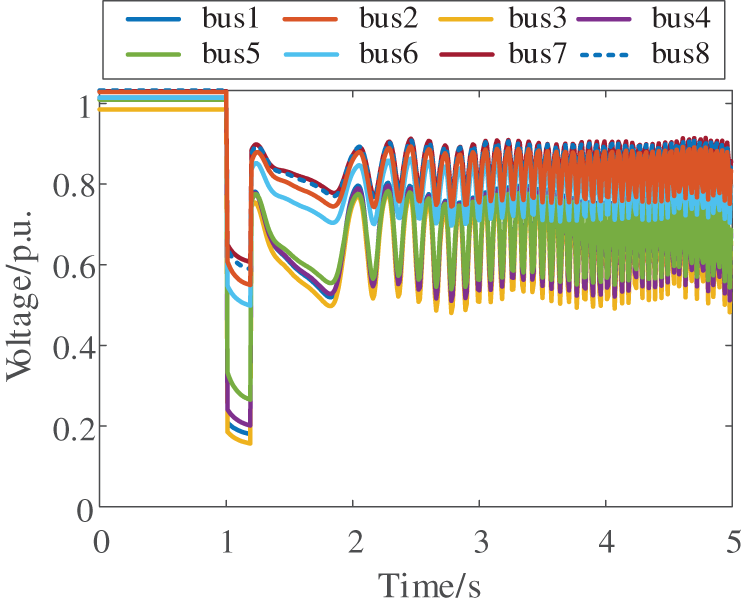
Figure 27: Voltage response after disturbance
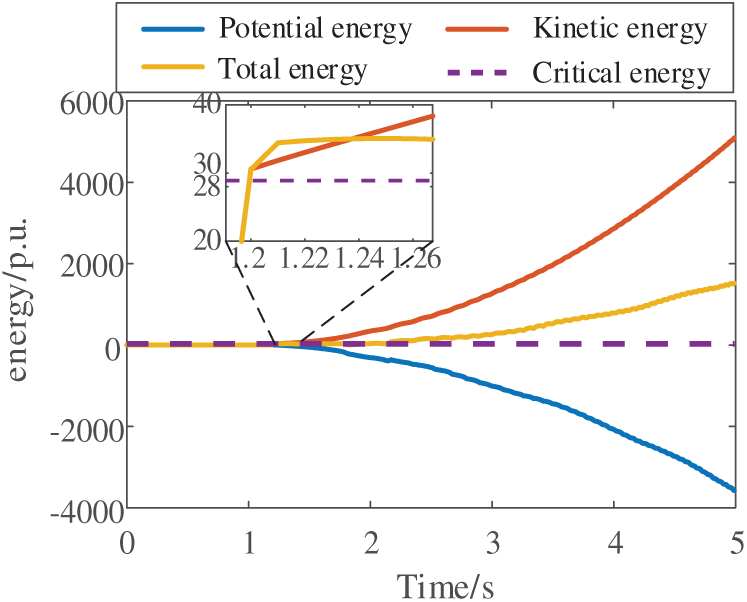
Figure 28: System energy after disturbance
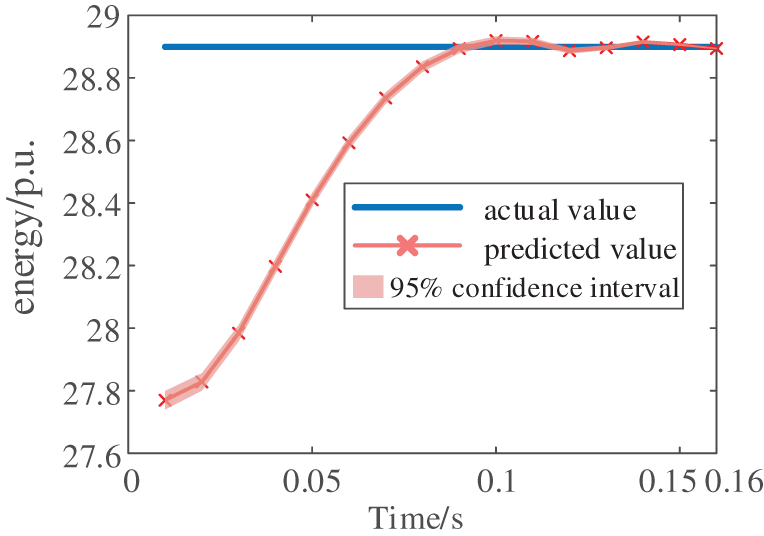
Figure 29: The predicted energy threshold value by CNN-LSTM
This paper proposes an innovative short-term voltage stability assessment method that effectively combines physically interpretable energy functions with high-accuracy artificial intelligence techniques. The methodology first establishes energy functions for various system components to analyze energy interaction mechanisms during voltage instability events from an energy perspective. To overcome the challenge of online energy threshold calculation inherent in conventional methods, this paper introduces a CNN-LSTM hybrid artificial intelligence approach. First, based on the energy contribution ratio of each component, the dominant energy terms are identified as key energy components. Subsequently, the electrical quantities corresponding to these key energies under disturbance conditions are used as inputs, while the offline-calculated system energy thresholds serve as outputs for extensive offline training, thereby establishing the corresponding offline model. By inputting the key features during the post-disturbance period, the model can predict the corresponding energy threshold, enabling voltage stability assessment through comparison between the predicted threshold and the transient energy magnitude. Comprehensive validation conducted on both a 3-generator 10-bus system and the New England 39-bus test system confirms that the CNN-LSTM model achieves superior accuracy in energy threshold prediction for renewable-integrated power systems, while the proposed method provides precise short-term voltage stability evaluation specifically for wind power integration scenarios. However, the current implementation requires substantial training data which may limit its immediate application to large-scale power systems. Therefore, the next research phase will focus on identifying more effective voltage stability features for large-scale power systems, with the objective of developing a short-term voltage stability assessment method suitable for larger renewable-integrated power systems.
Acknowledgement: The authors would like to express special thanks to State Grid Shanxi Electric Power Company.
Funding Statement: This work was supported by the State Grid Shanxi Electric Power Company Science and Technology Project “Smart distribution network with a high proportion of distributed wind storage adaptability assessment and improvement strategy research” (520530230024).
Author Contributions: The authors confirm their contribution to the paper as follows: Conceptualization: Zhichong Cao and Wenbiao Li. Methodology: Zhichong Cao and Rundong Tian. Software: Zhichong Cao, Rundong Tian and Wenbiao Li. Validation: Zhichong Cao and Wenbiao Li. Formal analysis: Yuxin Shi and Zhengyu Li. Investigation: Wenbiao Li and Zhengyu Li. Resources: Cheng Liu. Data curation: Zhichong Cao and Cheng Liu. Writing—original draft preparation: Zhichong Cao and Cheng Liu. Writing—review and editing: Zhichong Cao, Wenbiao Li and Cheng Liu. Visualization: Zhichong Cao, Cheng Liu, Rundong Tian and Zhengyu Li. Supervision: Zhichong Cao, Wenbiao Tao, Yuxin Shi and Cheng Liu. Funding acquisition: Cheng Liu. All authors reviewed the results and approved the final version of the manuscript.
Availability of Data and Materials: Data available on request from the authors. The data that support the findings of this study are available from the Corresponding Author, Zhichong Cao, upon reasonable request.
Ethics Approval: Not applicable.
Conflicts of Interest: The authors declare no conflicts of interest to report regarding the present study.
The LSTM model consists of a forget gate, input gate, and output gate. Step 1, the forget gate is used to filter and remember the information from the last time state Ct−1 and the current time state Ct. The expression is as follows:
Step 2, the input gate has 2 modules for the update of information, and the expression is as follows:
Step 3, after determining the cell status
Step 4, the tanh function determines the output decision for the current cell state, as shown in Eqs. (A5) and (A6).
where xt, Ct, and ht represent the network input value, the cell state of the LSTM, and the LSTM output value at the current time, respectively. ht−1, Ct−1 represent the LSTM output value and the cell state value at the previous time moment, respectively. Tanh representative activation function.
References
1. Seyedi Y, Karimi H, Mahseredjian J. A data-driven method for prediction of post-fault voltage stability in hybrid AC/DC microgrids. IEEE Trans Power Syst. 2022;37(5):3758–68. doi:10.1109/TPWRS.2022.3142110. [Google Scholar] [CrossRef]
2. Yang H, Li N, Sun Z, Huang D, Yang D, Cai G, et al. Real-time adaptive UVLS by optimized fuzzy controllers for short-term voltage stability control. IEEE Trans Power Syst. 2021;37(2):1449–60. doi:10.1109/TPWRS.2021.3105090. [Google Scholar] [CrossRef]
3. Ogunwole EI, Krishnamurthy S. Transmission congestion management using generator sensitivity factors for active and reactive power rescheduling using particle swarm optimization algorithm. IEEE Access. 2022;10:122882–900. doi:10.1109/access.2022.3224060. [Google Scholar] [CrossRef]
4. Hrgović I, Pavić I. Sizing and implementation of phase-shifting transformer for congestion management in renewable-rich regions: a case study of the Croatian power grid. IEEE Trans Power Syst. 2025;40(4):3465–73. doi:10.1109/TPWRS.2025.3526264. [Google Scholar] [CrossRef]
5. Krommydas KF, Stratigakos AC, Dikaiakos CN, Papaioannou GP, Jones MG, McLoughlin GC. A novel modular mobile power flow controller for real-time congestion management tested on a 150 kV transmission system. IEEE Access. 2022;10:96414–26. doi:10.1109/access.2022.3205589. [Google Scholar] [CrossRef]
6. Abdi P, Hamedani-Golshan ME, Alhelou HH, Milano F. A PMU-based method for on-line Thévenin equivalent estimation. IEEE Trans Power Syst. 2022;37(4):2796–807. doi:10.1109/TPWRS.2021.3125007. [Google Scholar] [CrossRef]
7. England BS, Alouani AT. Real time voltage stability prediction of smart grid areas using smart meters data and improved Thevenin estimates. Int J Electr Power Energy Syst. 2020;122(3):106189. doi:10.1016/j.ijepes.2020.106189. [Google Scholar] [CrossRef]
8. Cai G, Cao Z, Liu C, Yang H, Cheng Y, Terzija V. Online assessment of short-term voltage stability based on hybrid model and data-driven approach. Int J Electr Power Energy Syst. 2024;158:109930. doi:10.1016/j.ijepes.2024.109930. [Google Scholar] [CrossRef]
9. Zhang D, Wang Q, Guo Y, Yu J, Xu Y. Norton’s current theorem based online voltage stability analysis for wind connected power grid. Int J Electr Power Energy Syst. 2022;138(5):107962. doi:10.1016/j.ijepes.2022.107962. [Google Scholar] [CrossRef]
10. Du Z, Huang C, Chen Z, Zhan F, Zhang W. Research on transient voltage stability analysis based on controlling UEP method. Electr Meas Instrum. 2022;59(12):64–70. (In Chinese). doi:10.19753/j.issn1001-1390.2022.12.008. [Google Scholar] [CrossRef]
11. Aoun RM, Zambroni de Souza AC, Passaro MC. The role of load and distributed energy resources modeling in voltage recovery studies. Sustain Energy Grids Netw. 2024;39:101428. doi:10.1016/j.segan.2024.101428. [Google Scholar] [CrossRef]
12. Zhang S, Yu S, Sun Y, Zhou T, Yu S, Zhu Y, et al. Fast classification, aggregation, and modeling of load clusters for transient voltage stability. Int J Electr Power Energy Syst. 2021;124(3):106368. doi:10.1016/j.ijepes.2020.106368. [Google Scholar] [CrossRef]
13. Cheng H, Huang W, Shen C, Peng Y, Shuai Z, Shen ZJ. Transient voltage stability of paralleled synchronous and virtual synchronous generators with induction motor loads. IEEE Trans Smart Grid. 2021;12(6):4983–99. doi:10.1109/TSG.2021.3104655. [Google Scholar] [CrossRef]
14. Pourkeivani I, Khalili K, Abedi M, Hosseinian SH. A new stability index for induction motors three-phase fault recovery in industrial networks based on post-fault slip estimation. IEEE Trans Power Deliv. 2020;36(3):1471–81. doi:10.1109/TPWRD.2020.3009621. [Google Scholar] [CrossRef]
15. Mohammadi AH, Abedini M, Sanaye-Pasand M. Novel relative slip based under-voltage load shedding protection scheme to mitigate FIDVR. IEEE Trans Power Deliv. 2023;38(1):277–86. doi:10.1109/TPWRD.2022.3184356. [Google Scholar] [CrossRef]
16. Kamel M, Li F, Bu S, Wu Q. A generalized voltage stability indicator based on the tangential angles of PV and load curves considering voltage dependent load models. Int J Electr Power Energy Syst. 2021;127(2):106624. doi:10.1016/j.ijepes.2020.106624. [Google Scholar] [CrossRef]
17. Wang Z, Wang X, Chung CY. An analytical method for calculating critical voltage sag clearance time of induction motors. IEEE Trans Power Deliv. 2012;27(4):2412–4. doi:10.1109/TPWRD.2012.2202204. [Google Scholar] [CrossRef]
18. Wei S, Yang M, Qi J, Wang J, Ma S, Han X. Model-free MLE estimation for online rotor angle stability assessment with PMU data. IEEE Trans Power Syst. 2018;33(3):2463–76. doi:10.1109/TPWRS.2017.2761598. [Google Scholar] [CrossRef]
19. Li Y, Zhang S, Li Y, Cao J, Jia S. PMU measurements-based short-term voltage stability assessment of power systems via deep transfer learning. IEEE Trans Instrum Meas. 2023;72:2526111. doi:10.1109/TIM.2023.3311065. [Google Scholar] [CrossRef]
20. Rizvi SMH, Sadanandan SK, Srivastava AK. Data-driven short-term voltage stability assessment using convolutional neural networks considering data anomalies and localization. IEEE Access. 2021;9:128345–58. doi:10.1109/access.2021.3107248. [Google Scholar] [CrossRef]
21. Li Y, Zhang M, Chen C. A Deep-Learning intelligent system incorporating data augmentation for Short-Term voltage stability assessment of power systems. Appl Energy. 2022;308(3):118347. doi:10.1016/j.apenergy.2021.118347. [Google Scholar] [CrossRef]
22. Zhang Y, Xu Y, Dong ZY, Zhang R. A hierarchical self-adaptive data-analytics method for real-time power system short-term voltage stability assessment. IEEE Trans Ind Inform. 2019;15(1):74–84. doi:10.1109/TII.2018.2829818. [Google Scholar] [CrossRef]
23. Zhang X, Wu Z, Sun Q, Gu W, Zheng S, Zhao J. Application and progress of artificial intelligence technology in the field of distribution network voltage control: a review. Renew Sustain Energy Rev. 2024;192:114282. doi:10.1016/j.rser.2024.114282. [Google Scholar] [CrossRef]
24. Jia T, Sun H, Zhao B, Wang Z, Xu S, Wu P. Research on transient stability analysis method of power system based on network structure preserving energy function. Proc CSEE. 2020;40:2819–26. (In Chinese). doi:10.13334/j.0258-8013.pcsee.200302. [Google Scholar] [CrossRef]
25. Minh NQ, Khiem NT, Giang VH. Fault classification and localization in power transmission line based on machine learning and combined CNN-LSTM models. Energy Rep. 2024;12(1):5610–22. doi:10.1016/j.egyr.2024.11.061. [Google Scholar] [CrossRef]
26. Lee G, Park C, Kim DI. Event detection-free framework for transient stability prediction via parallel CNN-LSTMs. IEEE Trans Instrum Meas. 2024;73:9004410. doi:10.1109/TIM.2024.3421429. [Google Scholar] [CrossRef]
Cite This Article
 Copyright © 2025 The Author(s). Published by Tech Science Press.
This work is licensed under a Creative Commons Attribution 4.0 International License , which permits unrestricted use, distribution, and reproduction in any medium, provided the original work is properly cited.
 Downloads
 Citation Tools