
 Submit a Paper
 Propose a Special lssue
 Open Access
ARTICLE

A Power Battery Fault Diagnosis Method Based on Long-Short Term Memory-Back Propagation
School of Automation, Harbin University of Science and Technology, Harbin, 150080, China
* Corresponding Author: Jiahao Song. Email:
(This article belongs to the Special Issue: Advanced Modelling, Operation, Management and Diagnosis of Lithium Batteries)
Energy Engineering 2025, 122(2), 709-731. https://doi.org/10.32604/ee.2024.059021
Received 26 September 2024; Accepted 07 November 2024; Issue published 31 January 2025
 View Full Text
 Download PDF
Abstract
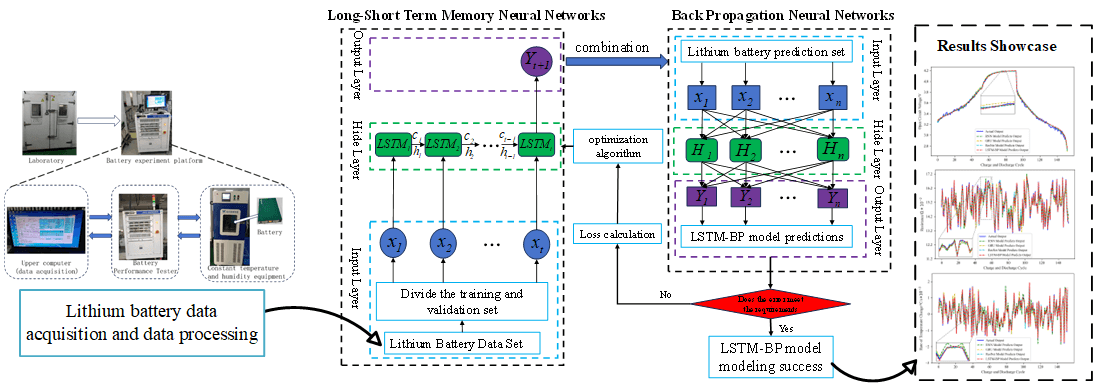
The lithium battery is an essential component of electric cars; prompt and accurate problem detection is vital in guaranteeing electric cars’ safe and dependable functioning and addressing the limitations of Back Propagation (BP) neural networks in terms of vanishing gradients and inability to effectively capture dependencies in time series, and the limitations of Long-Short Term Memory (LSTM) neural network models in terms of risk of overfitting. A method based on LSTM-BP is put forward for power battery fault diagnosis to improve the accuracy of lithium battery fault diagnosis. First, a lithium battery model is constructed based on the second-order RC equivalent circuit and the electro-thermal coupling model, and various lithium battery failures are simulated to examine the fault characteristics. Then, the lithium battery charging and discharging experiments collect, clean, and process the battery data. By constructing a neural network LSTM-BP model, we verified the superiority and accuracy of the LSTM-BP neural network model by comparing the LSTM model and BP model vertically and by comparing the Recurrent Neural Network (RNN) model, the Gated Recurrent Unit (GRU) model, and the Residual Neural Network (ResNet) model of a more advanced architecture horizontally. Finally, the lithium battery fault diagnosis process is summarized through the threshold quantitative criteria, and different faults are diagnosed and analyzed. The results show that the LSTM-BP neural network not only overcomes the limitations of the LSTM neural network and BP neural network but also improves the ability to process sequence data and reduces the risk of overfitting.Graphic Abstract
Keywords
Glossary/Nomenclature/Abbreviations
| LSTM | Long-Short Term Memory |
| BP | Back Propagation |
| ANN | Artificial Neural Network |
| CNN | Convolutional Neural Network |
| RNN | Recurrent Neural Network |
| GRU | Gated Recurrent Unit |
| ResNet | Residual Neural Network |
Lithium batteries have gained popularity in academics and industry due to their environmental benefits, low cost, and smooth discharge. They are frequently employed in electric vehicles, medical equipment, and other applications [1]. However, in actual operation, due to constraints of electrical power, thermal energy, and safety administration technology, lithium batteries may fail in different ways during operation, which can rapidly degrade their performance or even trigger internal short circuits, resulting in safety hazards [2].
The data-driven approach accomplishes the fault diagnosis of lithium batteries by extracting the corresponding features and predicting the output labels from the battery data measured by charging and discharging experiments [3]. This strategy does not involve the construction of sophisticated lithium battery models, and it has a high forecast accuracy [4,5]. Huang et al. indicated a transformer-based lithium battery fault diagnosis, modelling by denoising the converter network and validating the model’s performance using aged battery packs and battery data to verify the validity of the model [6]. The transformer model suffers from the limitations of lack of structured information processing and long model training time. Yang et al. indicated an artificial neural network (ANN) based method around the fueled-by-data strategy for lithium battery problem detection, using only the voltage information to figure out the voltage of the short-circuiting battery. By employing a three-dimensional electro-thermal interface model, the voltage predicts the battery’s internal and external temperature distribution and the battery’s maximum temperature change rate. Ultimately, its stability and accuracy are validated by two experiments: constant voltage charging and constant voltage discharge [7]. ANN has the limitation that the model effect depends on the choice of hyperparameters. Heinrich et al. suggested an original driven-by-data battery health state forecast method based on the actual conducting of battery assessments. A neural network model of the constructed LSTM is used to recreate the electrical reaction through capacity test, incremental capacity study, and peak energy test, which allows the health state estimation with precision in terms of resistance and residual capacity estimation [8]. Hong et al. established an LSTM recurrent neural network for multi-step voltage prediction. For the first time, LSTM was applied to the voltage and fault prediction of lithium batteries [9]. Li et al. proposed a method that combines the LSTM and Convolutional Neural Network (CNN) for thermal runaway prediction modelling. CNN thermal runaway prediction model, the optimized LSTM-CNN model can accurately predict the battery temperature and achieve the prediction of lithium battery thermal runaway failure [10]. The LSTM-CNN model is ineffective in diagnosing other monolithic faults in lithium batteries.
In summary, merging two neural networks to achieve defect detection for a lithium battery has a lot of research potential [11]. This study provides an LSTM-BP-based fault inspection method for power batteries, which combines LSTM and BP. BP is responsible for calculating the gradient of the loss function, which overcomes the limitation of the overfitting risk of LSTM, and LSTM is accountable for dealing with temporal dependence in sequential data, overcoming the limitations of BP, which suffers from gradient vanishing and does not capture temporality effectively [12]. The LSTM-BP model can predict lithium battery output labels faster and more accurately, overcoming the limitations of other neural network models that take too long to train and depend on selecting hyperparameters to diagnose lithium battery faults reliably.
2 Lithium Battery Data Processing and Equivalent Circuit Modeling
2.1 Lithium Battery Experimental Platform Construction and Battery Data Acquisition
In this paper, the capacity of a 21.673 AH ternary lithium battery is placed in the constant temperature and humidity equipment for charging and discharging cycle experiments, data transfer from the battery performance tester to the adjusted parameterized continuous temperature and humidity equipment, the battery experimental platform host computer from the battery performance tester to carry out lithium battery charging and discharging experimental data acquisition, and ultimately exported in excel file format [13]. The lithium battery experiment platform is shown in Fig. 1.
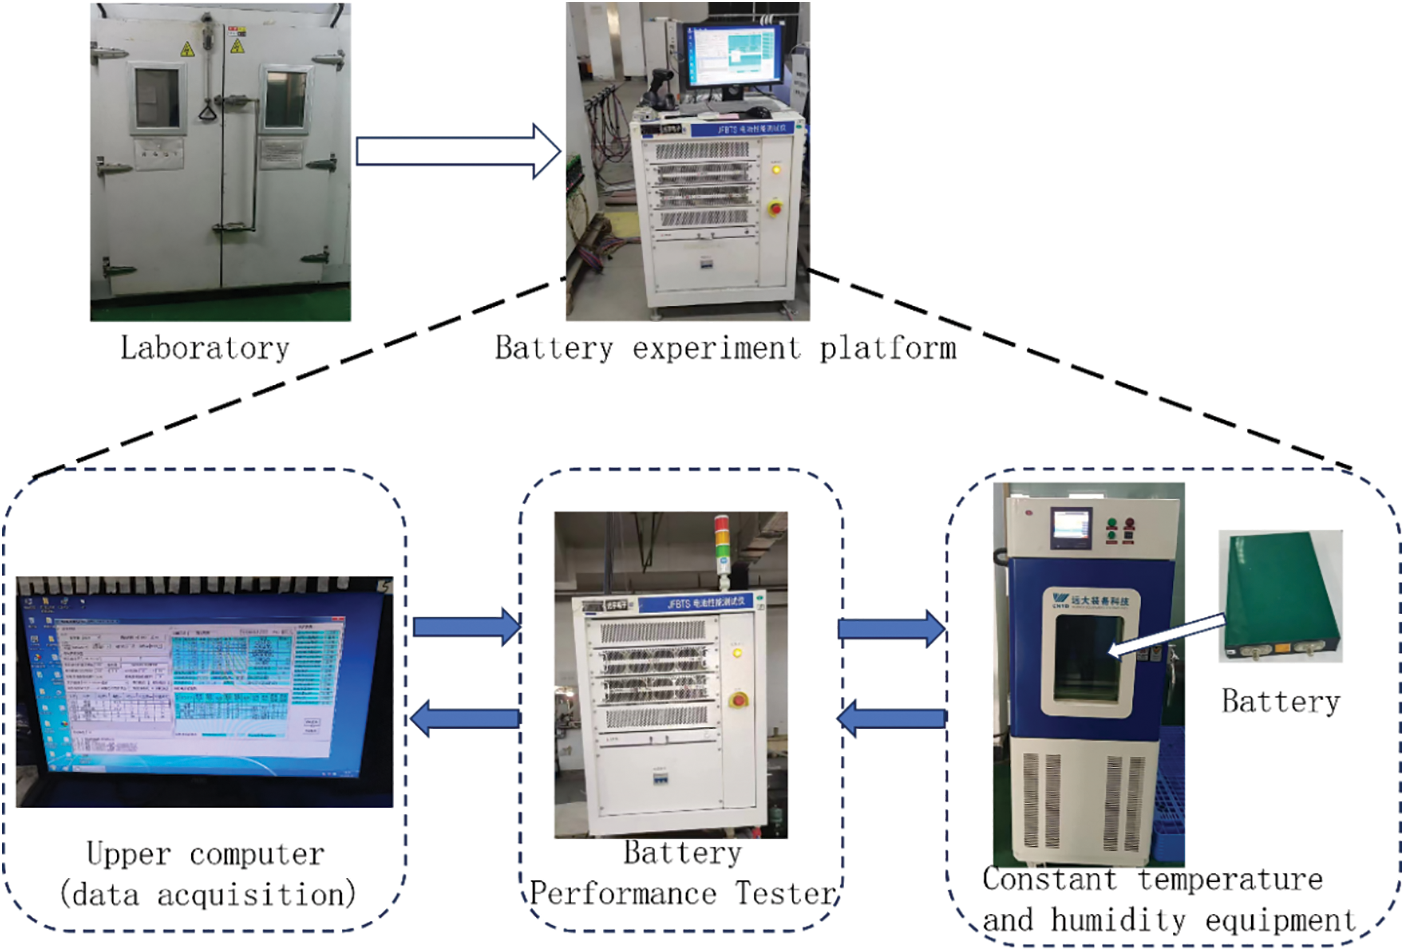
Figure 1: Lithium battery charge/discharge cycle experimental platform
By building a lithium battery charging and discharging cycle experiment platform for lithium battery data collection, this lithium battery charging and discharging cycle experiment started at 10:15 on 04 April 2022, and stopped the experiment at 13:27 on 10 May 2023. The number of battery experimental cycles was 3565, the capacity of lithium batteries decayed from 100% to 80%, and the capacity decayed from 21.673 to 17.057 AH. A total of 596,703 sets of battery charge and discharge data were collected. Partial lithium battery data and column labels are shown in Fig. 2.
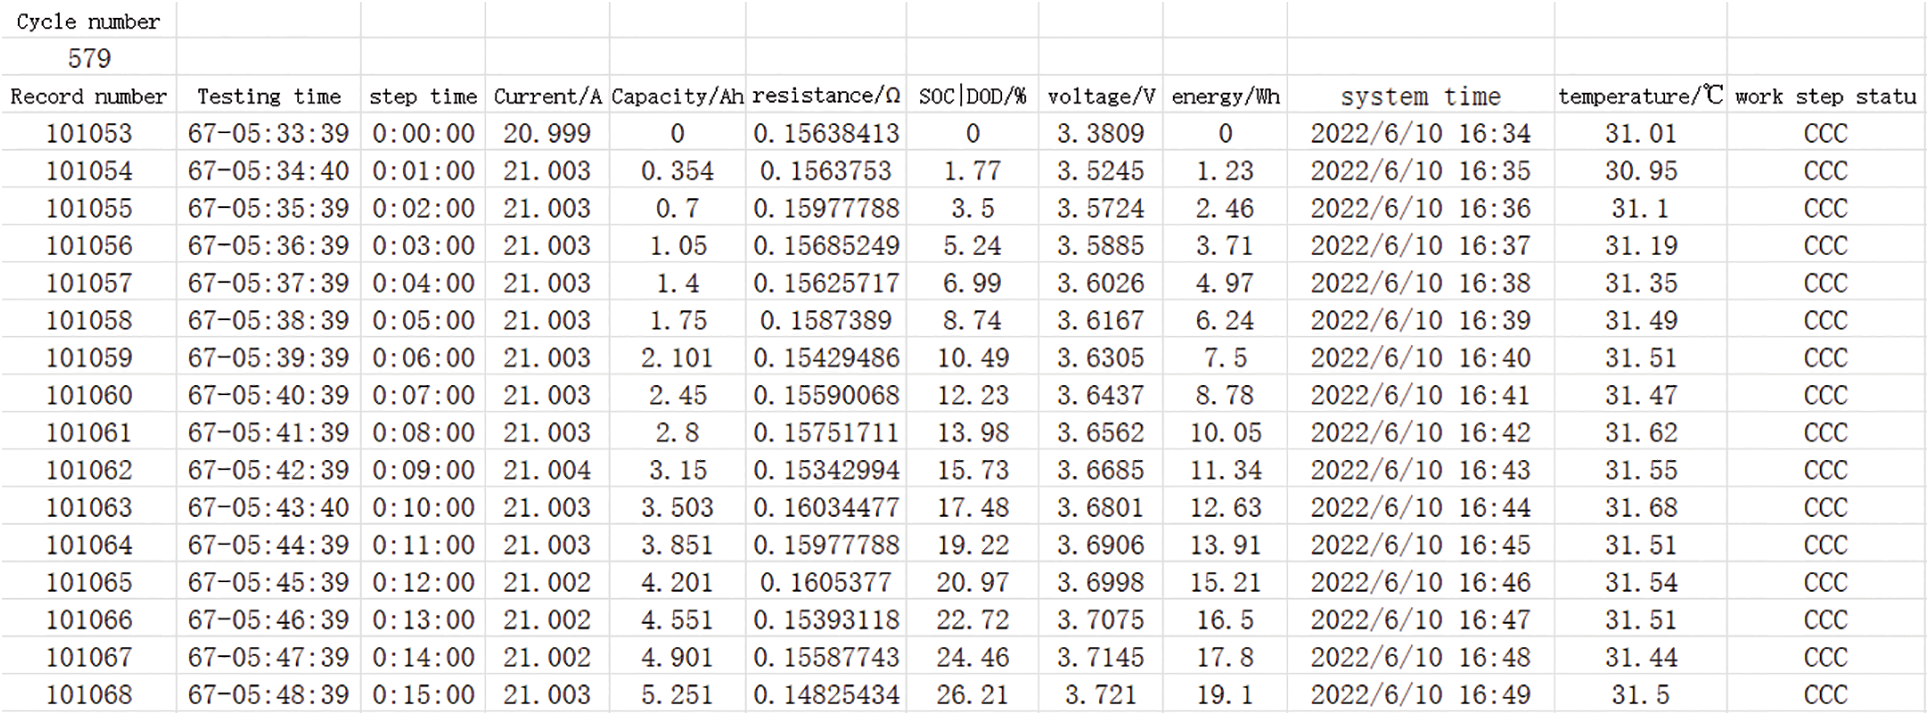
Figure 2: Partial lithium battery data and column labels
2.2 Lithium Battery Data Processing
With the cycle of charging and discharging of lithium batteries, the capacity of lithium batteries will gradually decay, and the battery data will gradually show a certain error. For more effective battery fault diagnosis, this paper uses the battery cycling experiments before the 1775 cycles of battery data. At this time, the capacity of lithium batteries is 18.795 AH, which is 86.7% of the rated capacity of the battery charging and discharging data of 303,349 groups of batteries.
(1) Rate of change of voltage
Calculate the voltage change rate of each cycle according to the test time and voltage in the experimental data [14]. The voltage change rate calculation formula is shown below:
where:
(2) Rate of change of temperature
Based on the test time and temperature in the experimental data of the lithium battery charge/discharge cycle, calculate the temperature change rate for each cycle of the lithium battery charge/discharge cycle [16]. The formula for calculating the temperature change rate is shown below:
where:
(3) Open Circuit Voltage (OCV)
The lithium battery charge/discharge cycle data find the points where the current is 0, and the voltage corresponding to these points is the open-circuit voltage. Screening the data of voltage and SOC when the battery data current is equal to 0, the functional relationship between OCV and SOC is obtained by polynomial fitting [17]. After many attempts, the ninth-degree polynomial has the highest fitting accuracy and can describe the relationship between battery OCV and SOC [18]. The formula of the polynomial is shown below:
The SOC-OCV fitting curves of lithium batteries in charging and discharging states are different. The polynomial values of lithium battery charging state are:
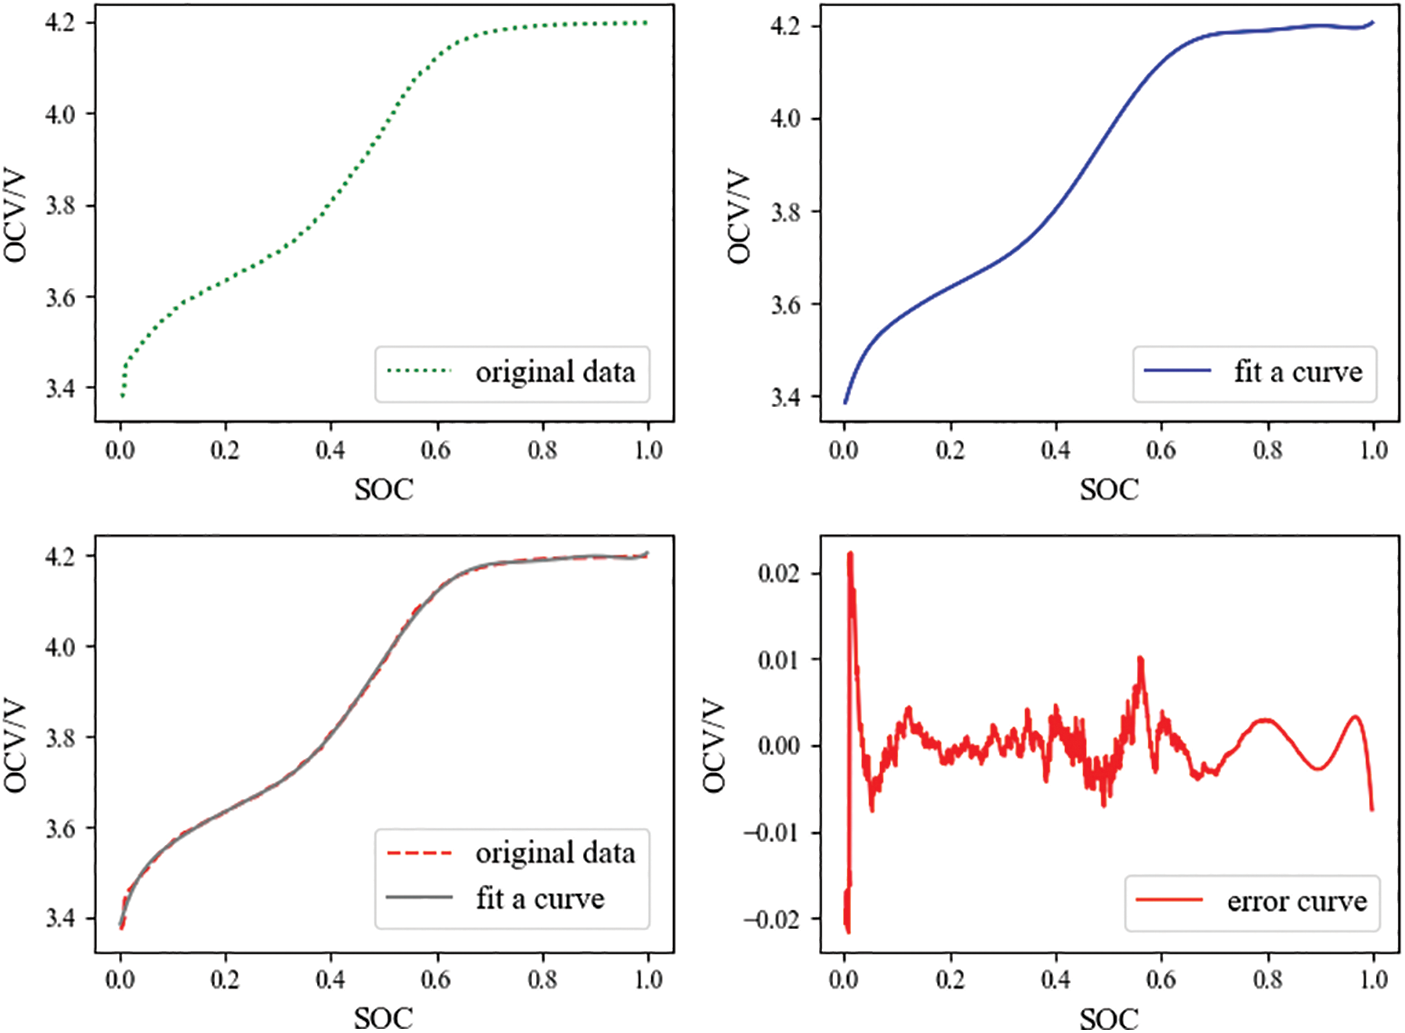
Figure 3: SOC-OCV fitting curves and error curves for lithium batteries in the state of charge
The polynomial values of lithium battery in discharge state are:
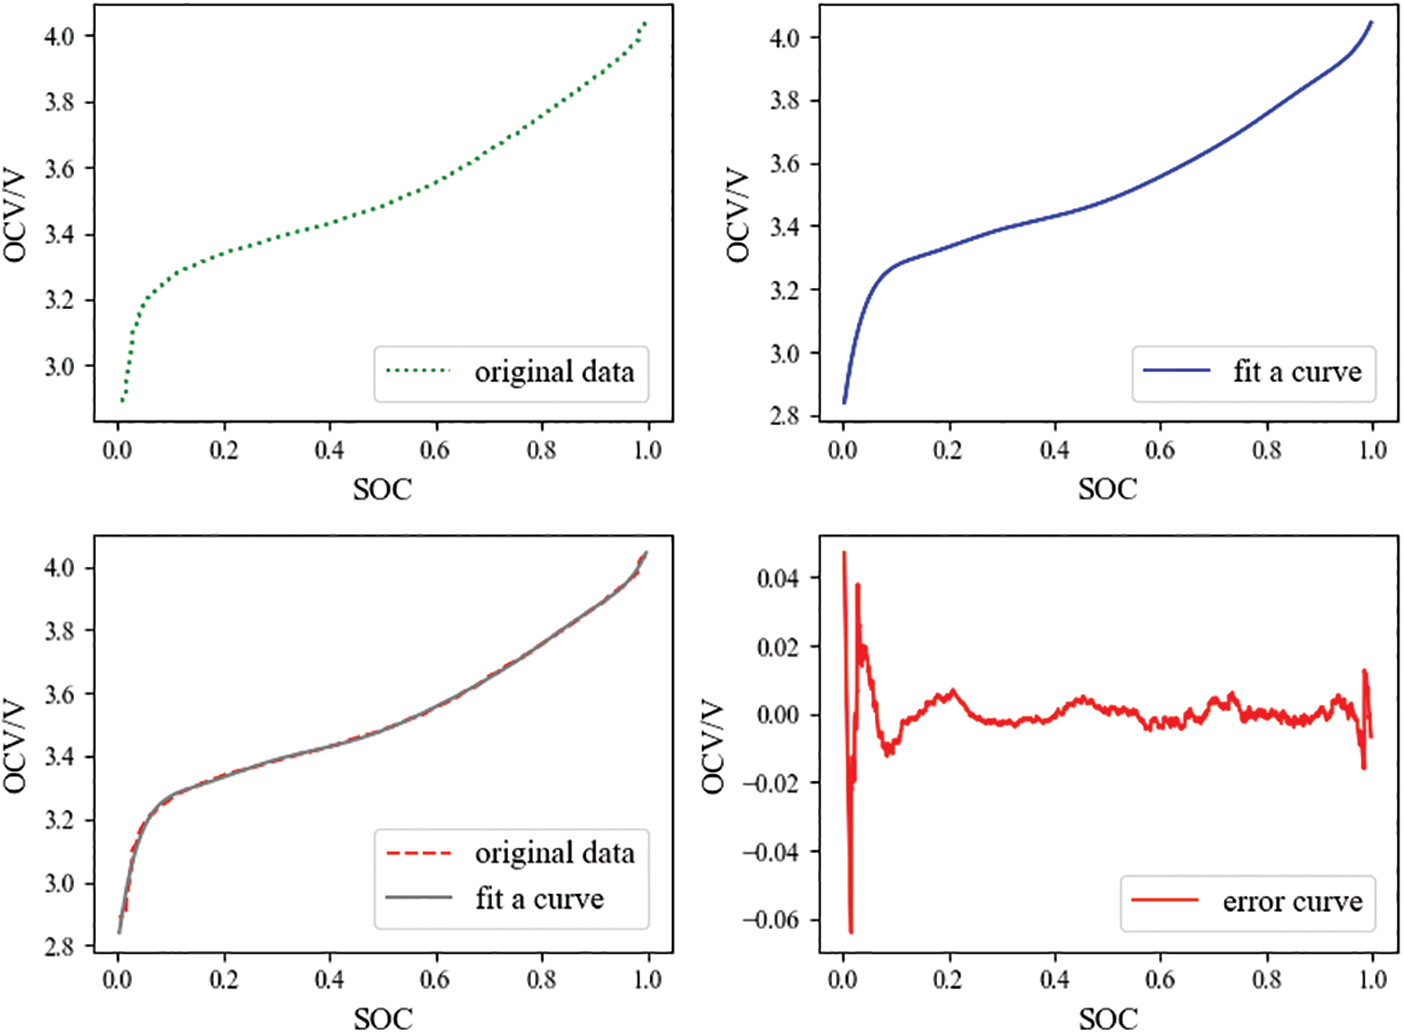
Figure 4: SOC-OCV fitting curves and error curves for lithium batteries in the state of discharge
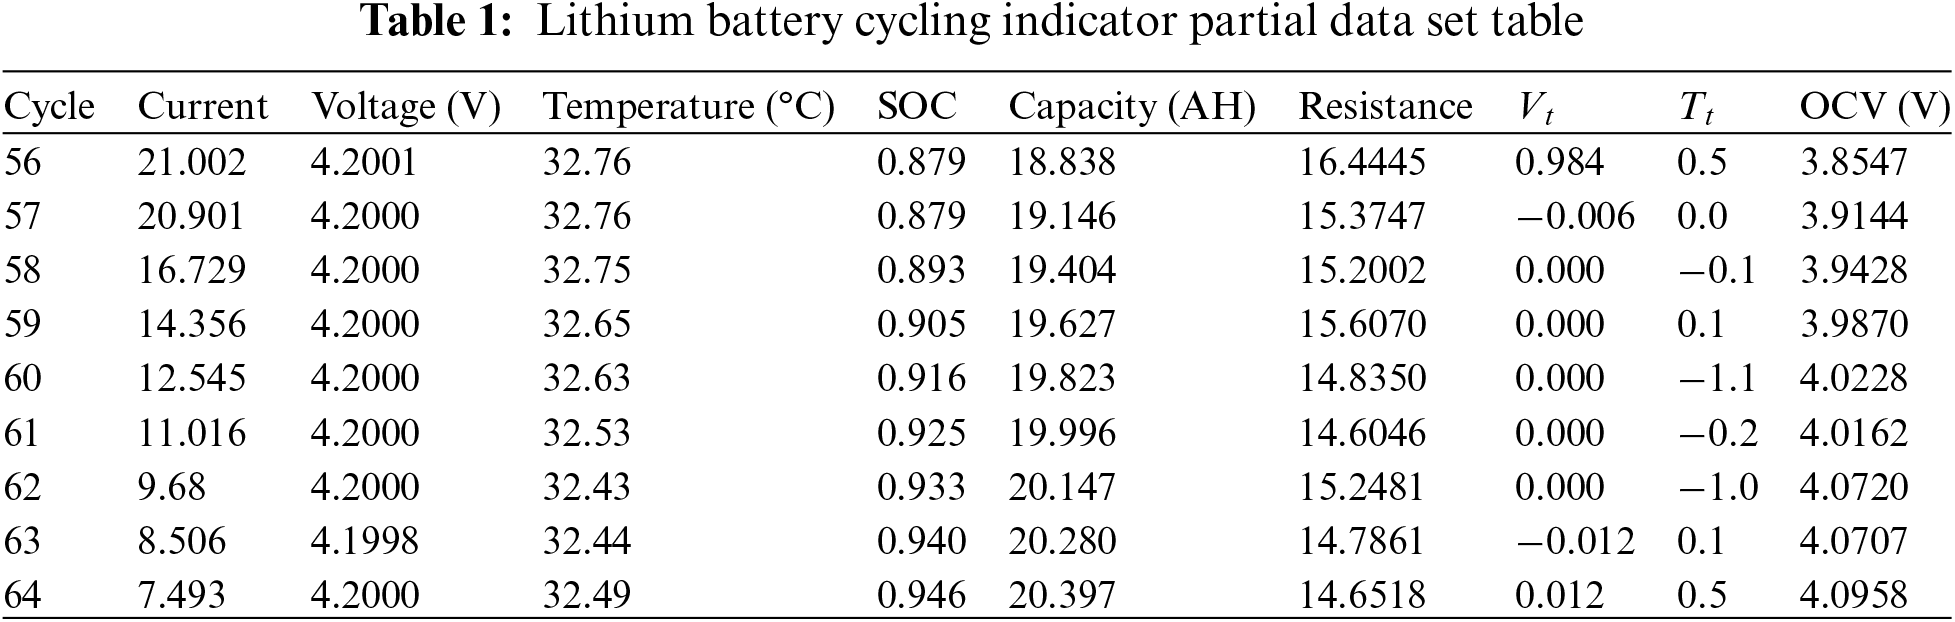
The lithium battery data is preprocessed using the experimental data collected by the battery experimental platform. Some of the experimental data are shown in Table 1.
2.3 Lithium Battery Equivalent Circuit Model
(1) Second-order RC model
The second-order RC model comprises two capacitors and three resistors [19]. The second-order RC equivalent circuit model is shown in Fig. 5.
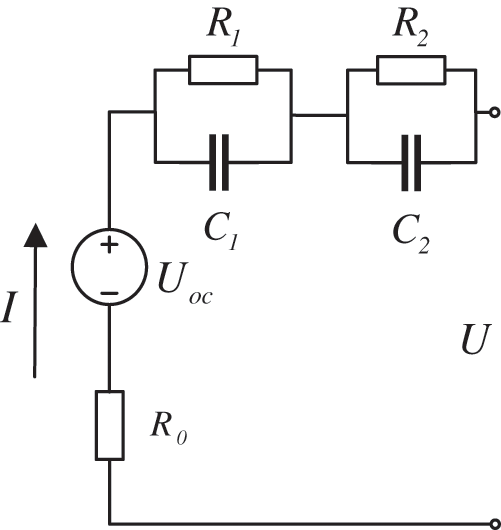
Figure 5: Second-order RC equivalent circuit model
Through the equivalent circuit diagram, the terminal voltage calculation formula is as follows:
where:
The second-order RC model can more accurately simulate the steady state and transient characteristics of the battery during the process, which is closer to the battery’s performance [21]. In this paper, the second-order RC model is constructed, combined with the lithium battery data set after the previous data processing, to conduct the fault simulation analysis of lithium battery overcharging, over-discharging, increasing internal resistance, and decreasing capacity.
(2) Electro-thermal coupling model
The electro-thermal coupling model is based on the relationship between the internal reactions of the battery with different temperature distributions and temperature variations [22]. The thermal model is coupled with the second-order RC equivalent circuit model built in the previous section [23], and the framework of the electro-thermal coupling model is constructed, as shown in Fig. 6.
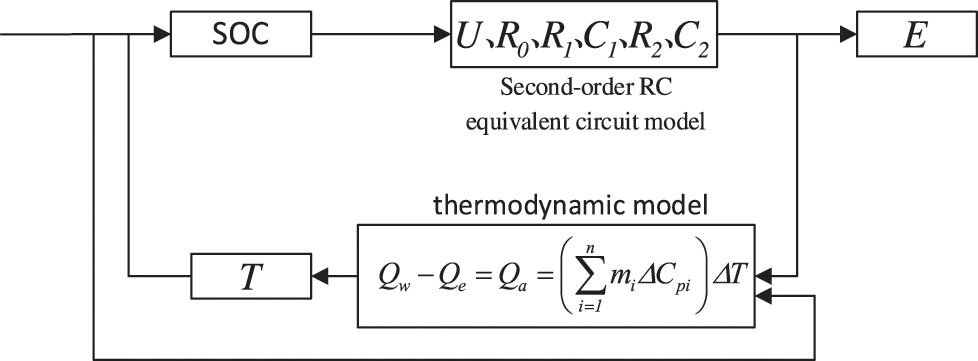
Figure 6: Electro-thermal coupling model
The electro-thermal coupling model is calculated as follows:
where:
Considering the needs of this paper, the electro-thermal coupling model combined with the lithium battery dataset can simulate the lithium battery thermal runaway fault [25], for the lithium battery thermal runaway fault occurs when the lithium battery temperature, voltage, current, and other parameters of the lithium battery can be observed to change.
3 Lithium Battery Failure Analysis
3.1 Lithium Battery Overcharge Failure
The overcharge fault occurs when the lithium battery voltage to the cutoff voltage does not stop charging, so the charging voltage continues to rise. A simulation of the overcharge fault, the lithium battery overcharge voltage change curve, is shown in Fig. 7.
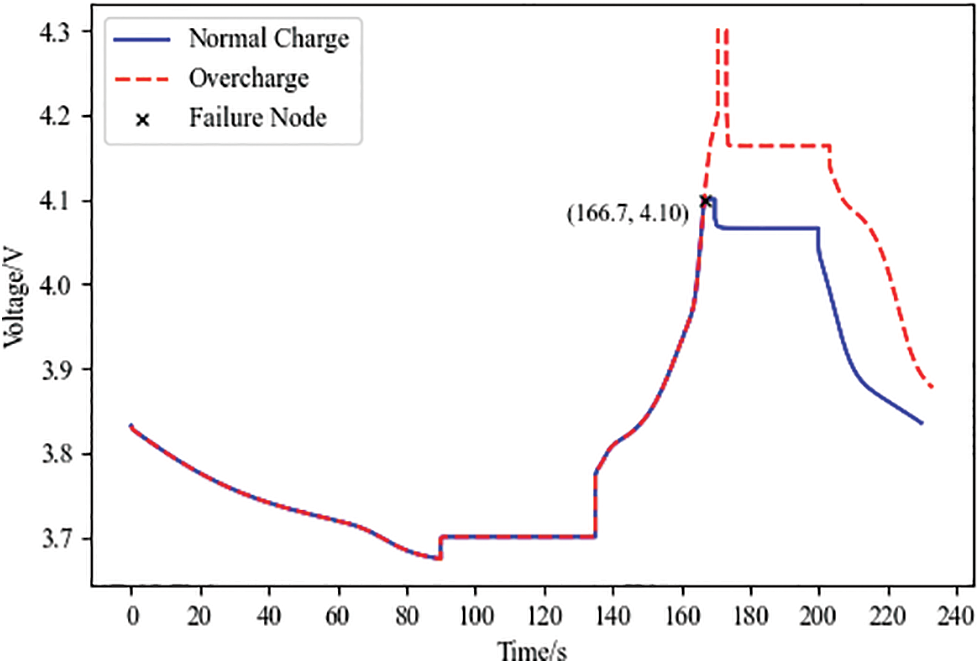
Figure 7: Lithium battery overcharge voltage change curve
Fig. 7 analysis can be obtained. The Failure Node is the crucial point of the overcharge fault simulation, which has a horizontal coordinate of 166.7 and a vertical coordinate of 4.10. The standard battery stops charging after charging up to 4.10 V, and the voltage no longer rises. The overcharge fault battery continues to charge after charging up to 4.10 V, and the voltage continues to increase. The discharge rate of the overcharged faulty battery is higher than that of the standard battery.
3.2 Lithium Battery Over-Discharge Failure
The over-discharge fault is a lithium battery that continues discharging even after being discharged to the cutoff voltage. Over-discharge will make the battery current unstable. The simulation simulates the over-discharge fault and lithium battery over-discharge voltage change curve shown in Fig. 8.
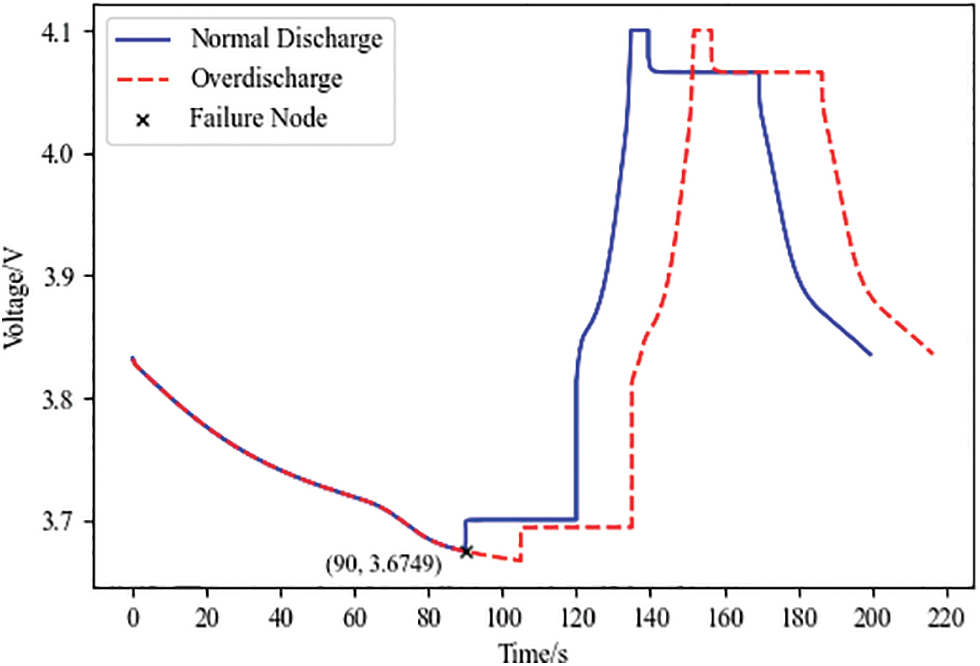
Figure 8: Lithium battery over-discharge voltage change curve
Fig. 8 analysis can be obtained. The Failure Node is the crucial point of the over-discharge fault simulation, which has a horizontal coordinate of 90 and a vertical coordinate of 3.6749. The standard battery stops discharging after discharging up to 3.6749 V. The voltage is no longer decreasing, and the over-discharge fault battery continues to discharge after discharging up to 3.6749 V. The voltage continues to decline. The time it took for the battery to charge to the cutoff voltage showed no significant difference.
3.3 Lithium Battery Internal Resistance Increase Failure
Increased internal resistance failure occurs when the lithium battery use time is too long, resulting in increased resistance and increasing the discharge rate of the lithium battery. Increased internal resistance can raise lithium battery temperature, limiting battery life. Simulation of internal resistance increases fault, and lithium battery internal resistance increases the voltage change curve, as shown in Fig. 9.
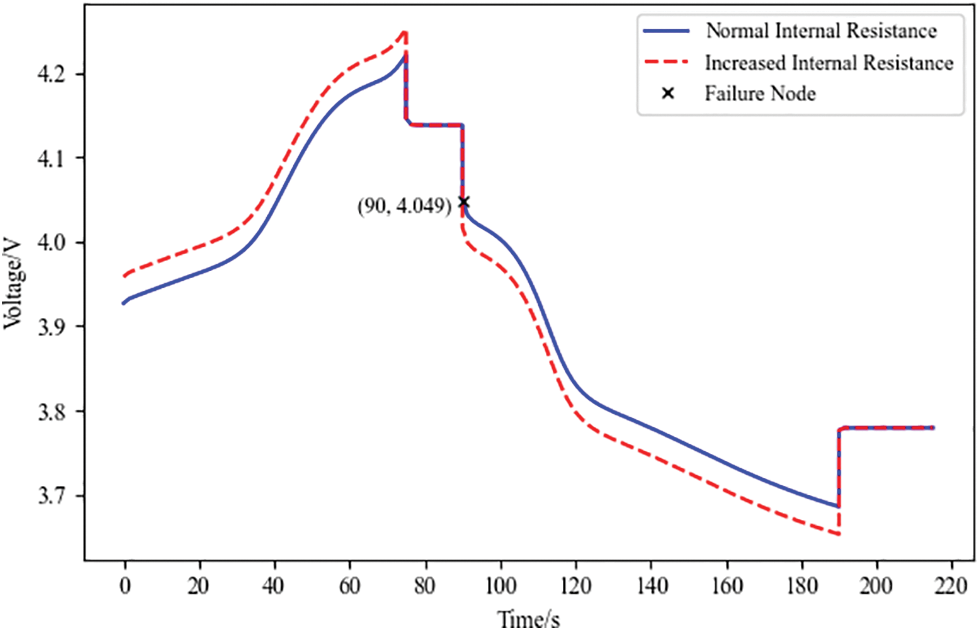
Figure 9: Lithium battery resistance increases the voltage change curve
Fig. 9 analysis can be obtained. The Failure Node is the crucial point for the simulation of the fault of increased internal resistance, and its horizontal coordinate is 90 and vertical coordinate is 4.049. The standard and faulty batteries with increased internal resistance are charged at the same rate, and the charging voltage of the defective battery is more than the standard lithium battery charging voltage. The rate and the discharge cutoff voltage are lower than the standard battery discharge cutoff voltage.
3.4 Lithium Battery Capacity Reduction Failure
Capacity reduction problems are caused by battery age, unregulated use, and self-discharge, all of which contribute to battery capacity deterioration. The decline in battery capacity reduces its range and service life and indirectly causes additional battery issues. The lithium battery capacity reduction voltage change curve is shown in Fig. 10.
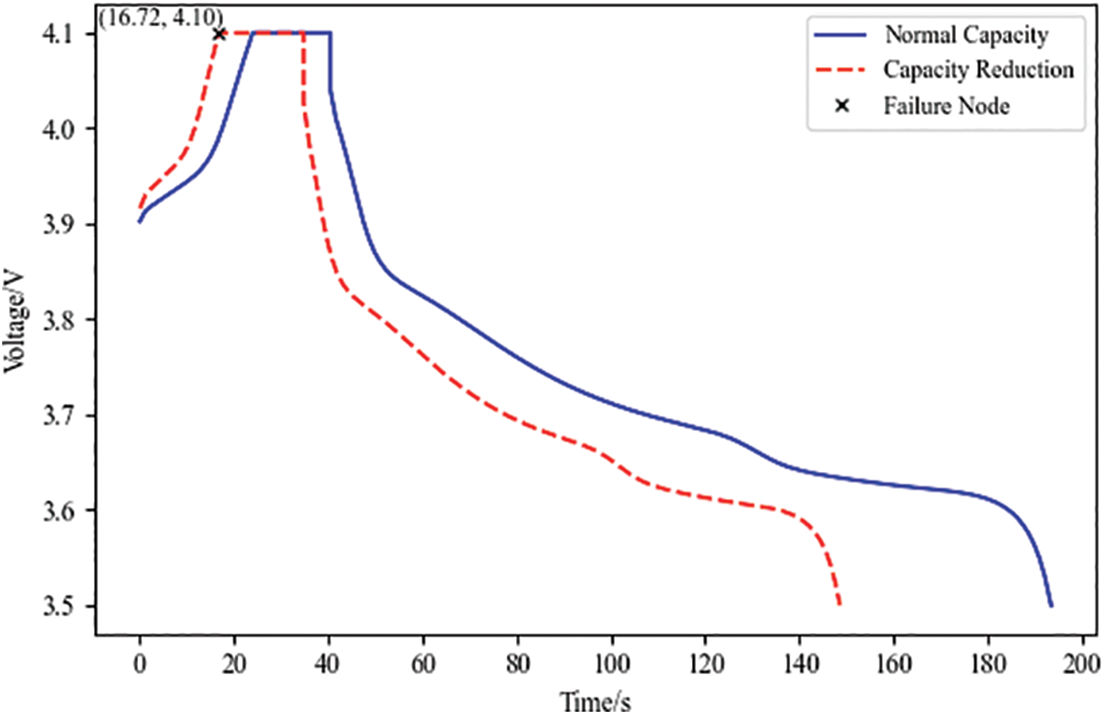
Figure 10: Lithium battery capacity reduction voltage change curve
Fig. 10 analysis can be obtained. The Failure Node is the crucial point of the capacity reduction fault simulation, which has a horizontal coordinate of 16.72 and a vertical coordinate of 4.10. Standard batteries and capacity reduction faulty batteries are charged at the same rate. The defective batteries have a greater charging rate and reach the charging cutoff voltage of 4.10 V faster. After standing for the same amount of time, when discharged, the capacity reduction faulty batteries have a faster discharging rate than the standard battery discharge rate, which is more rapid.
3.5 Lithium Battery Thermal Runaway Failure
Thermal runaway failure is a lithium battery due to electrical, mechanical, and thermal abuse, resulting in rapid changes in the self-temperature rise of the battery. The temperature of the battery rises sharply, resulting in fire, explosion, and other phenomena. Simulation to simulate thermal runaway failure, lithium battery thermal runaway change curve shown in Fig. 11.
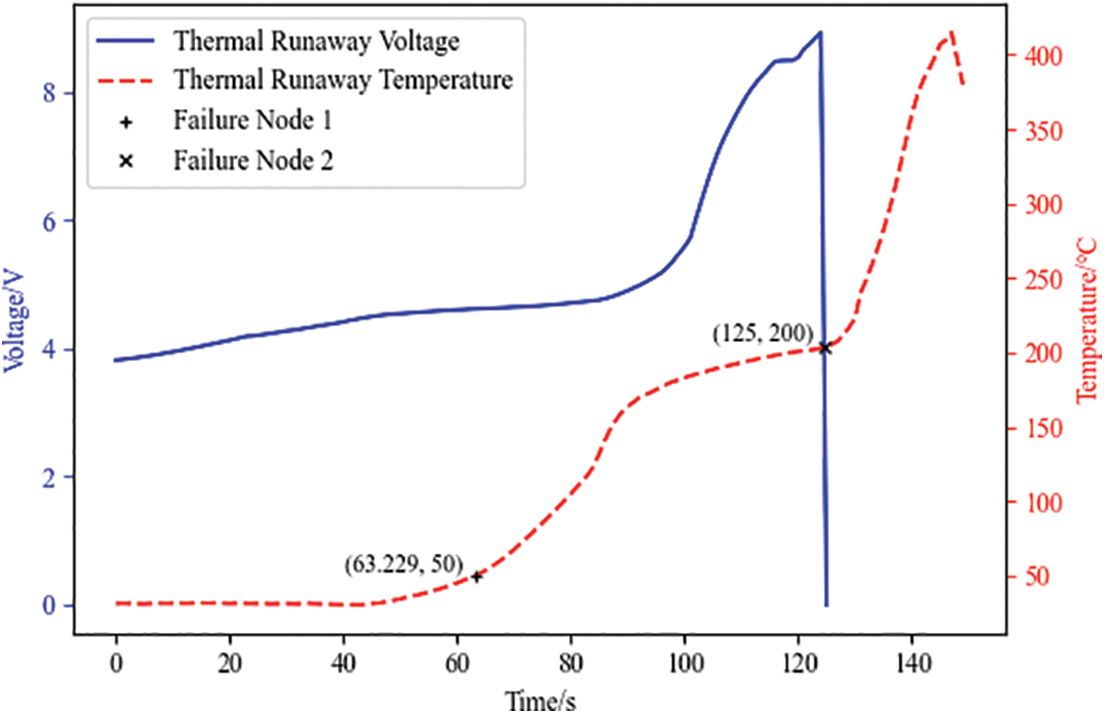
Figure 11: Lithium battery thermal runaway
Fig. 11 analysis can be obtained. Failure Node 1 is the first key point of thermal runaway fault simulation. Its horizontal coordinate is 63.229, the vertical coordinate is 50, and the normal operating temperature of the battery is 20°C to 50°C. When the battery temperature rises to Failure Node 1, the battery begins to enter the thermal accumulation stage, the visible voltage rate of change begins to increase rapidly, and the temperature of the battery starts to rise. Failure Node 2 is the second key point of thermal runaway fault simulation. Its horizontal coordinate is 124, and its vertical coordinate is 200. When the battery temperature rises to Failure Node 2, the battery begins to enter the thermal runaway stage, and the visible voltage instantly drops to 0 V, and the temperature increases rapidly.
4.1 Long Short-Term Memory Neural Networks
LSTM neural network can solve the disadvantages of gradient vanishing [26], short-term memory limitation, and low computational efficiency in Recurrent Neural Network (RNN) [27]. The structure of the LSTM neural network is shown in Fig. 12.
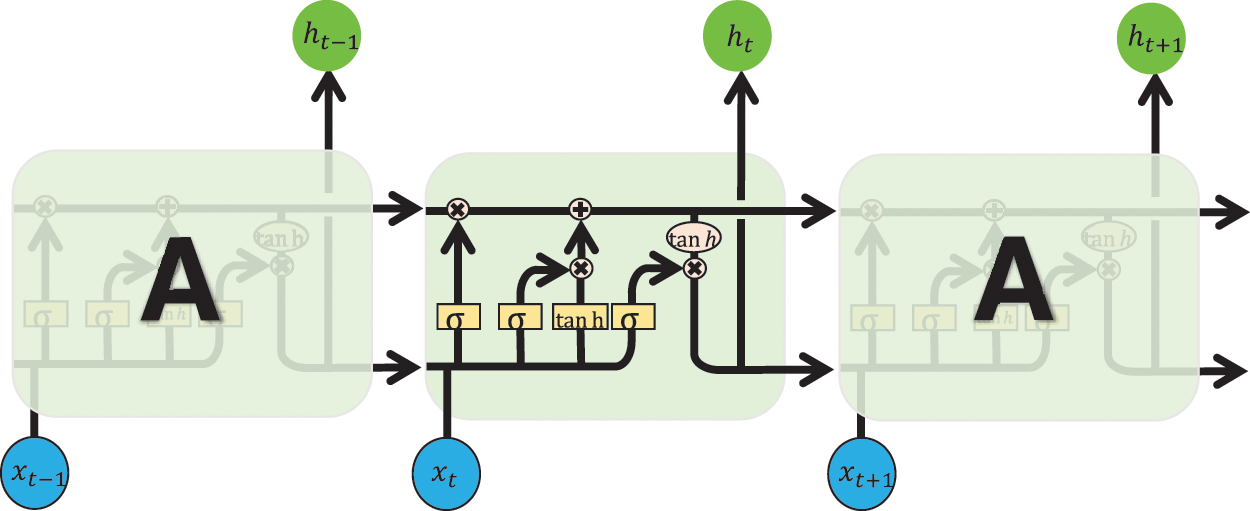
Figure 12: LSTM neural network structure
The computational relational equation for the LSTM is described below:
where:
4.2 Backpropagation Neural Networks
The BP neural network computes the error of the neural network when it propagates forward from the input to the output and adjusts the weights and thresholds when it propagates backwards from the output to the input [29]. The structure of the BP neural network is shown in Fig. 13.
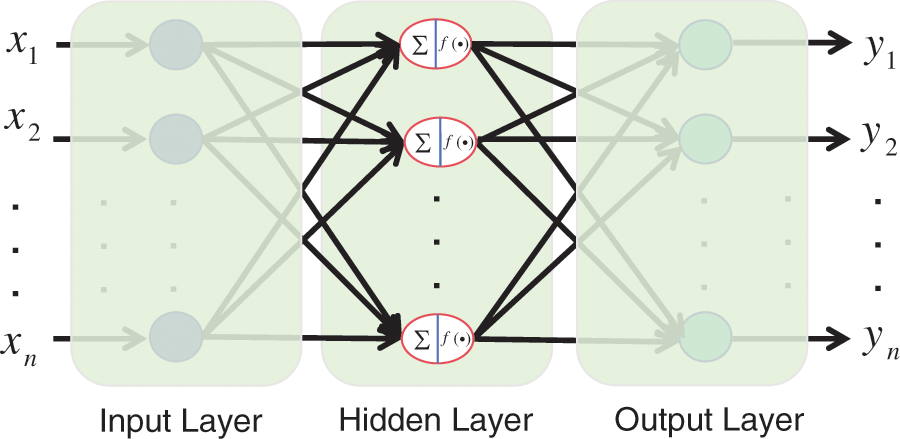
Figure 13: BP neural network structure
The formulae for the BP neural network for the selection of the number of nodes in the hidden layer, the forward transfer process, and the backward transfer process are as follows:
where: m, h, and n are the number of nodes in the input, hidden, and output layers, a is the conditioning constant, E is the error, and
LSTM is used to process the time series data of lithium battery features, and BP is used to process the data of other features. The combination of LSTM and BP can better fit the complex data distribution of lithium batteries, realize the fusion of information between different features, and improve the prediction accuracy of the LSTM-BP model on the complex data of lithium batteries. The design of the LSTM-BP structure is shown in Fig. 14.
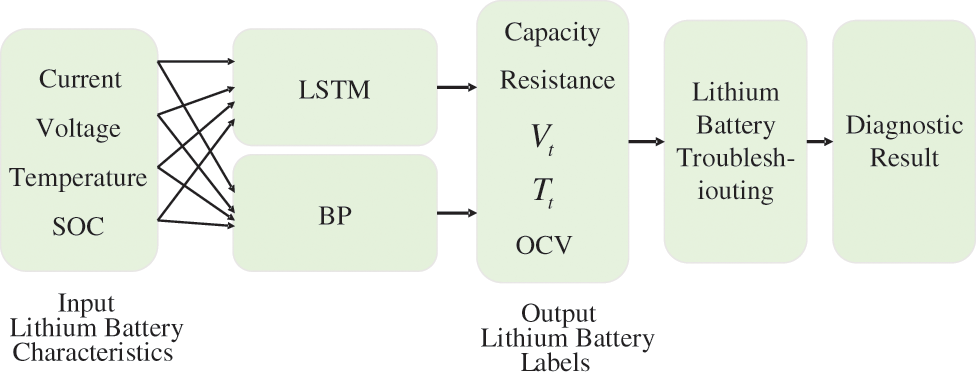
Figure 14: LSTM-BP structure design
LSTM extracts the time series features of the lithium battery dataset using a multi-layer neural network, BP extracts other features of the lithium battery dataset through a fully connected layer and connects LSTM and BP through the fusion layer of the neural network model, and finally generates predicted values through the fully connected layer and carries out the fault diagnosis of lithium battery.
5 Neural Network Model Prediction
5.1 Neural Network Model Parameter Selection and Training
This paper uses the mean absolute error (MAE) to assess the validity of parameter selection. The three indicators of mean square error (MSE) [31], root mean square error (RMSE), and mean absolute error (MAE) are used to assess the validity of the model [32], which is calculated as follows:
where:
In order to prevent the model from over-fitting problems, this paper divides the lithium battery dataset into training, validation, and testing sets according to the ratio of 7:2:1 and selects Adam as the optimizer. Compared with the traditional gradient descent algorithm, this paper chooses the momentum gradient descent algorithm, which can solve the defect of gradient instability. In addition, dropout and batch normalization methods are used to randomly discard some neurons to improve the generalization ability of the model. When the model is trained, the input sequence length is 1, the dropout parameter is 0.3, the number of training iterations is 200, and the batch size is 32, the model works best [33].
The number of neurons and the number of network layers affect the performance of the neural network model. By training the model on the training set, the number of neurons and the number of network layers can be determined. If the number selection is inappropriate, the model will have problems such as over-fitting and gradient explosion [34]. This means that the model can not learn the relationship between data perfectly. We use the initialization cross-validation method for model parameter combination and apply MAE to evaluate and select the optimal parameter combination. The results of different parameter combinations are shown in Table 2.
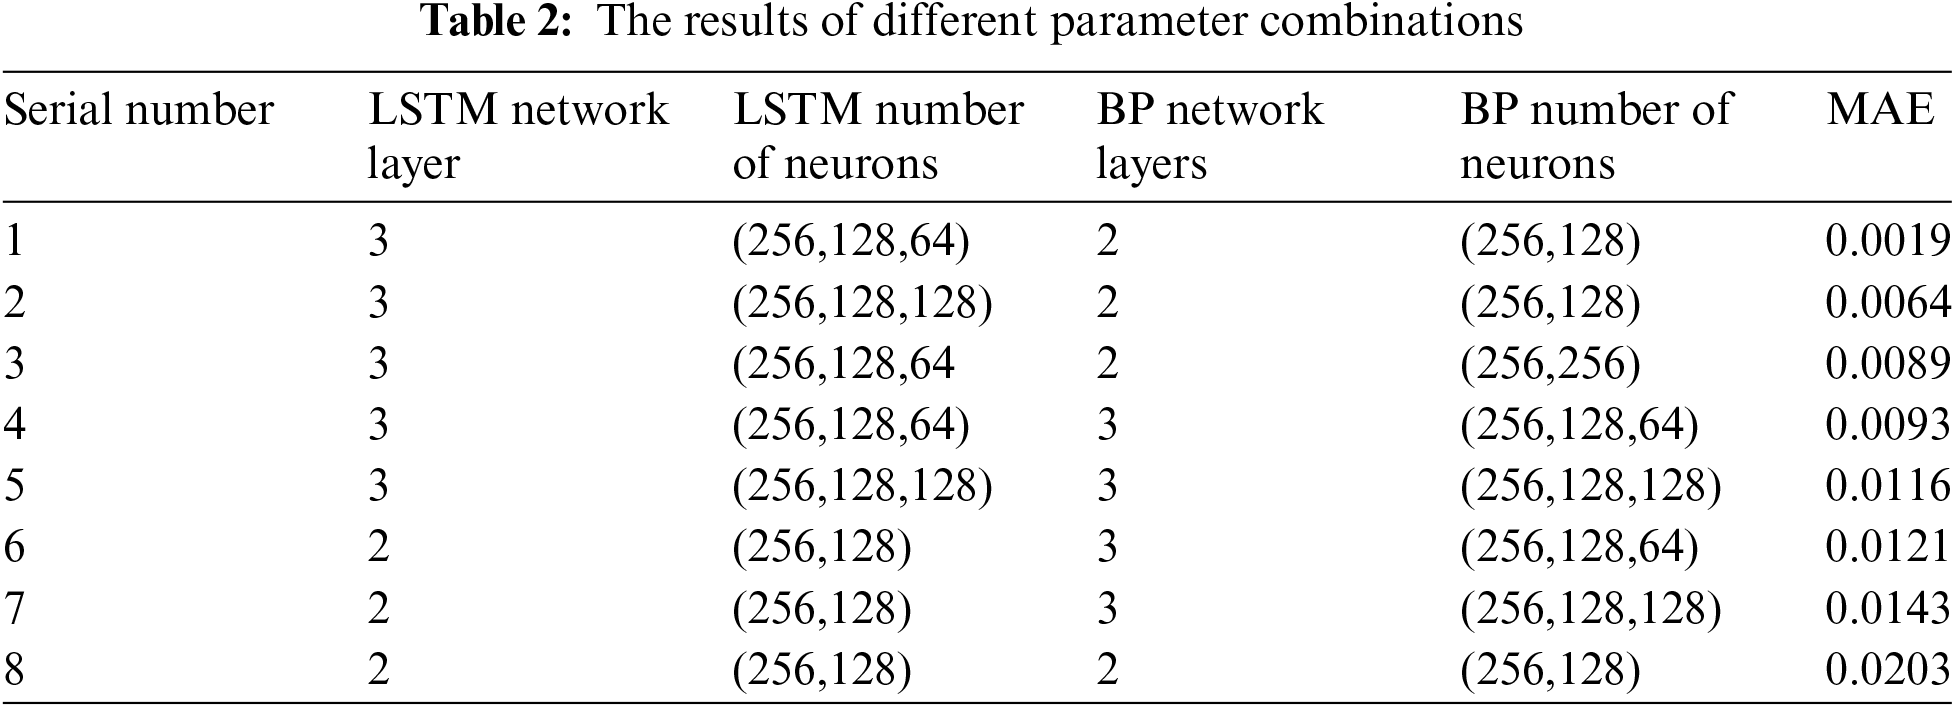
The analysis in Table 2 shows that when the LSTM Network Layers are 3, the LSTM Number of Neurons are 256, 128, and 64, respectively, and the BP Network Layers are 2. The BP Number of Neurons is 256 and 128, respectively. At this time, the MAE is the smallest, and the model has the best training effect.
5.2 Different Neural Network Models Predict Output Labels
Through the collection and processing of lithium battery data, and reasonable training and parameter selection of the neural network model, this paper builds an LSTM-BP model in Python, and uses the LSTM-BP model to compare the LSTM model and the BP model vertically, and compares the more advanced architecture of the RNN model, the GRU model, and the ResNet model horizontally, and utilizes the three indexes of MSE, RMSE and MAE to evaluate the effectiveness of the model. MSE, RMSE, and MAE metrics will be used to evaluate the effectiveness of the model. The different neural network models for capacity prediction are shown in Fig. 15. The different neural network models for open circuit voltage prediction are shown in Fig. 16. The different neural network models for internal resistance prediction are shown in Fig. 17. The predicted rate of temperature change for different neural network models are shown in Fig. 18. The predicted voltage change rate for different neural network models is shown in Fig. 19.
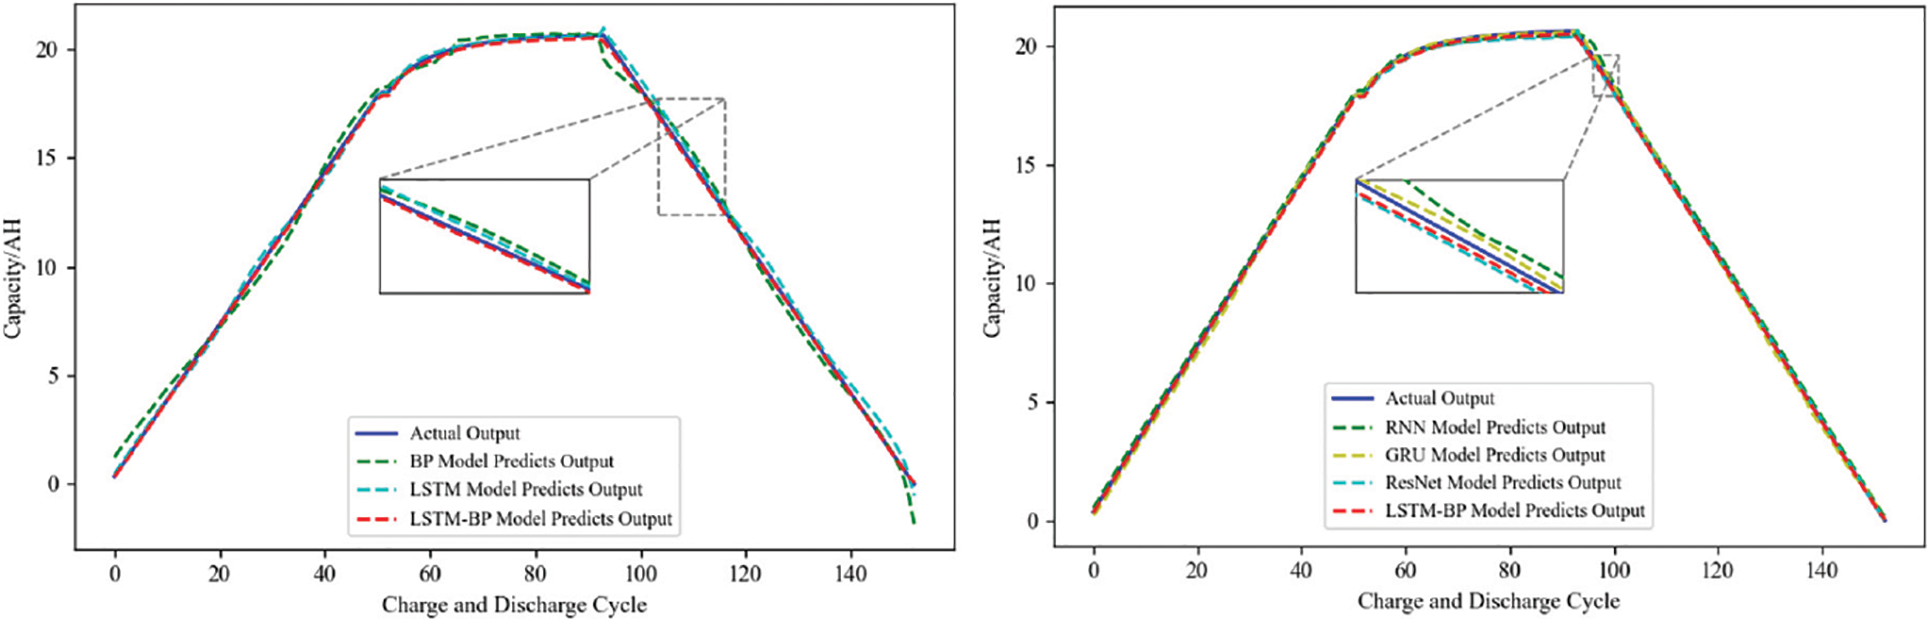
Figure 15: Capacity prediction of different neural network models
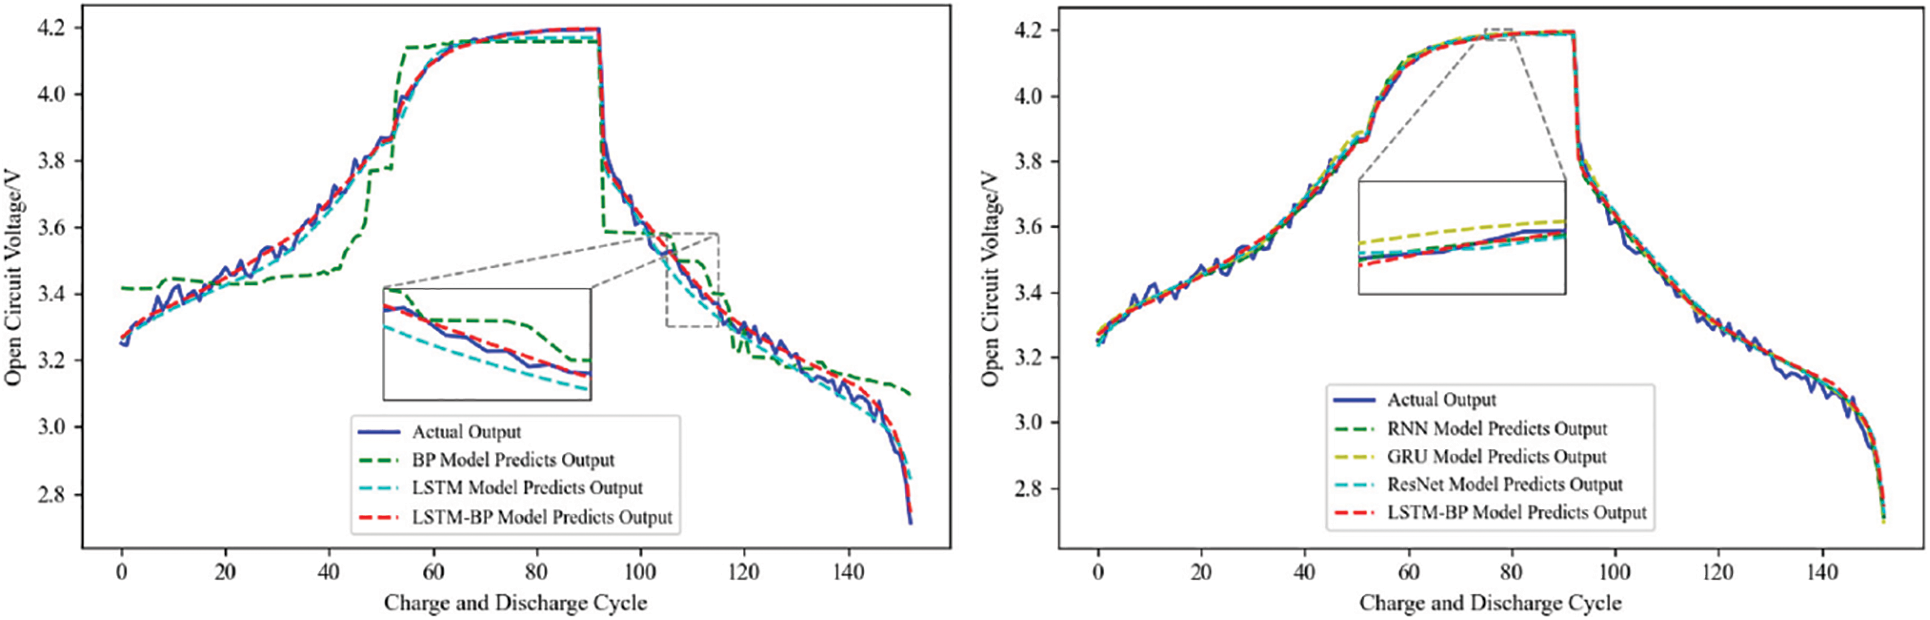
Figure 16: Open circuit voltage prediction of different models
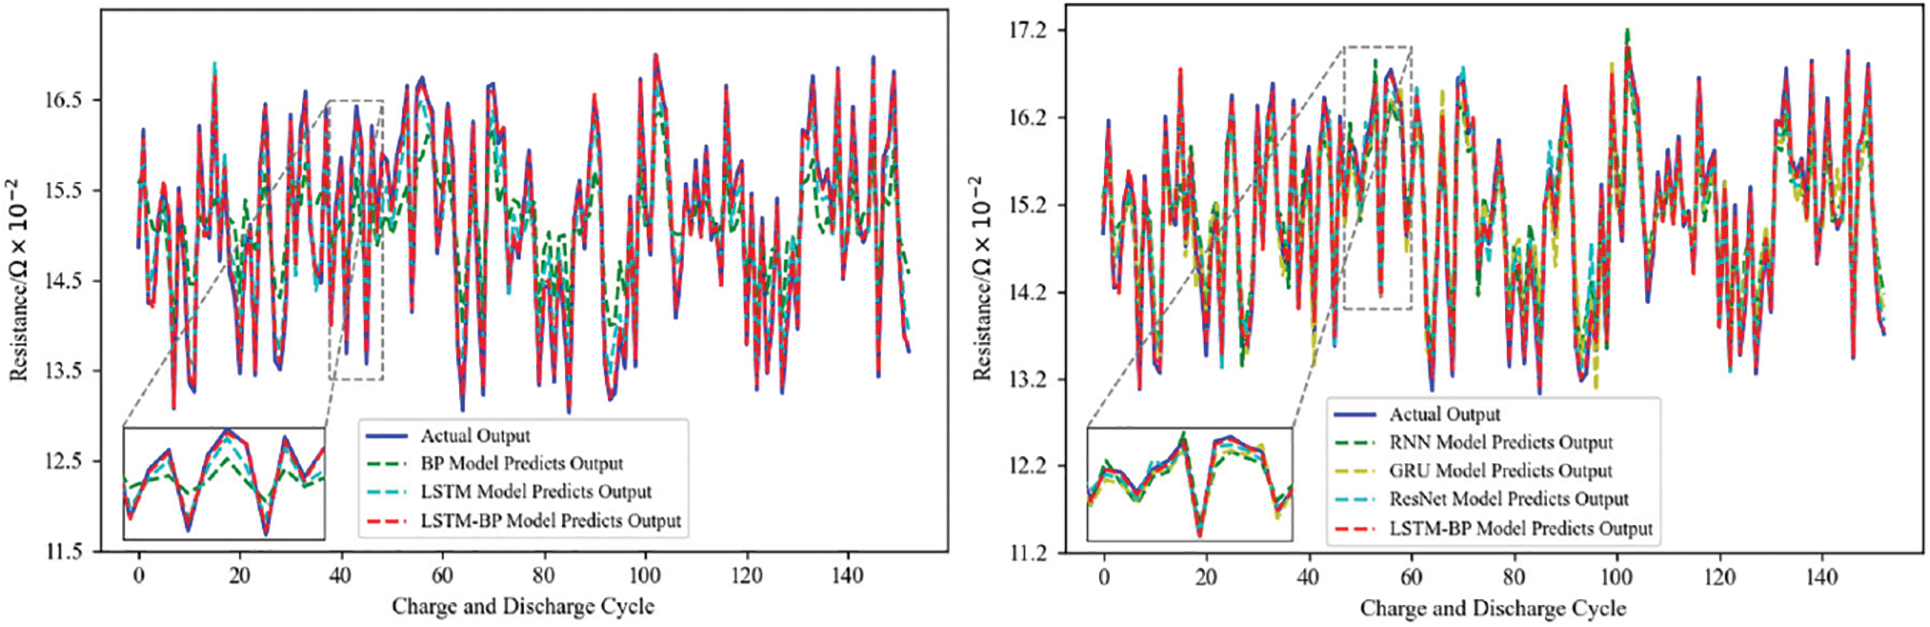
Figure 17: Resistance prediction of different neural network models
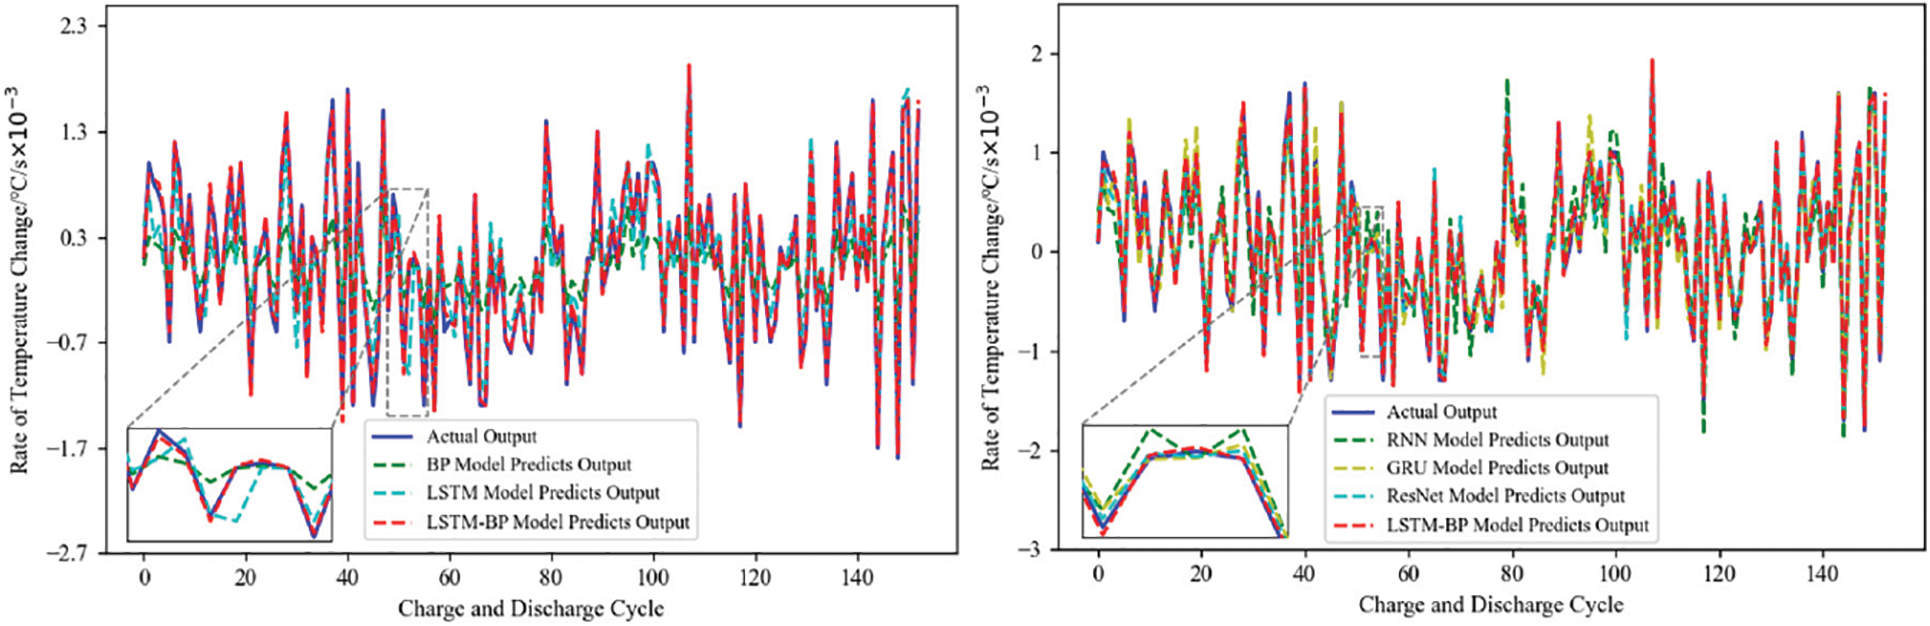
Figure 18: Temperature change rate prediction of different neural network models
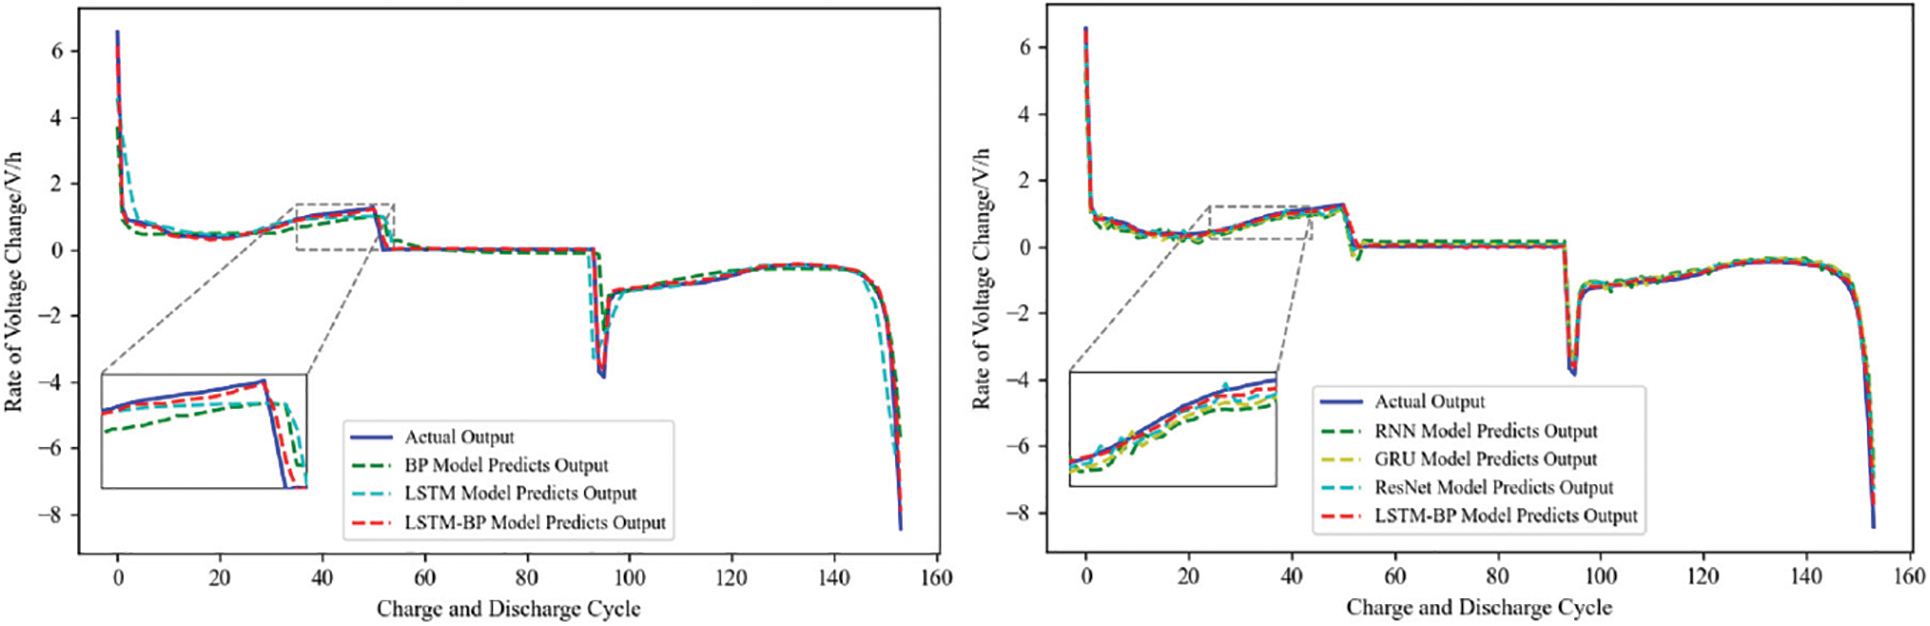
Figure 19: Voltage change rate prediction of different neural network models
The different neural network models were compared horizontally and vertically using the LSTM-BP model, and the effectiveness of the different neural network models was evaluated using three indexes: MSE, RMSE, and MAE. The evaluation indexes of different neural network models are shown in Table 3.
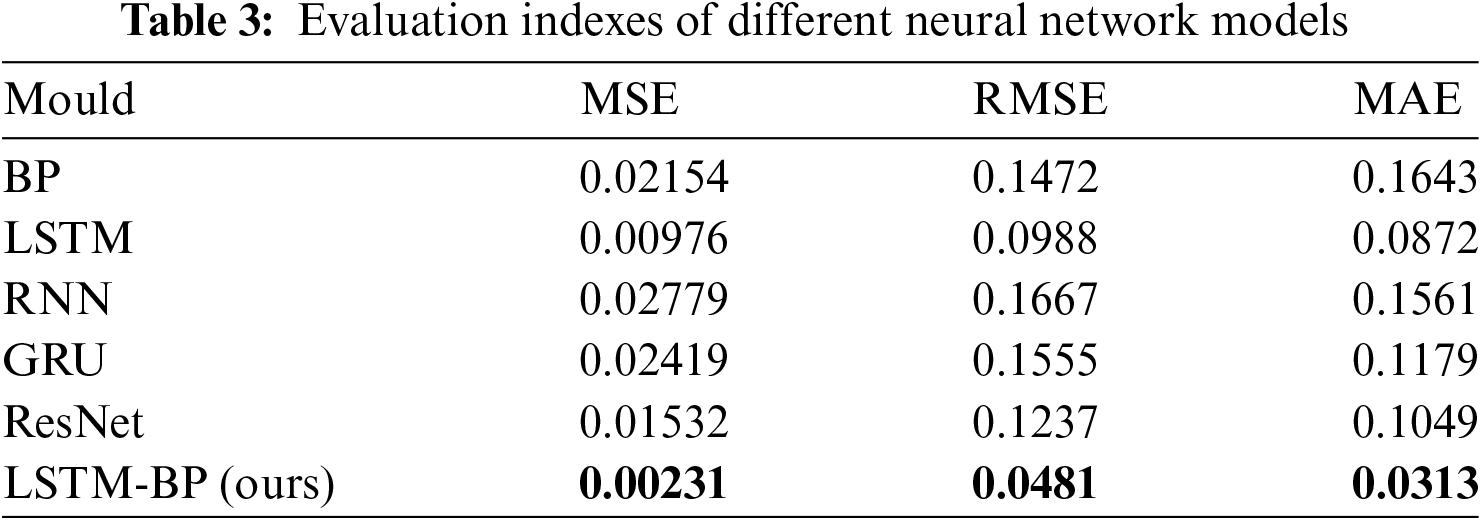
According to the analysis in Table 3, it can be seen that the three evaluation indexes of the LSTM-BP model are smaller than those of other neural network models, which can prove that the LSTM-BP model has higher prediction accuracy and effectiveness.
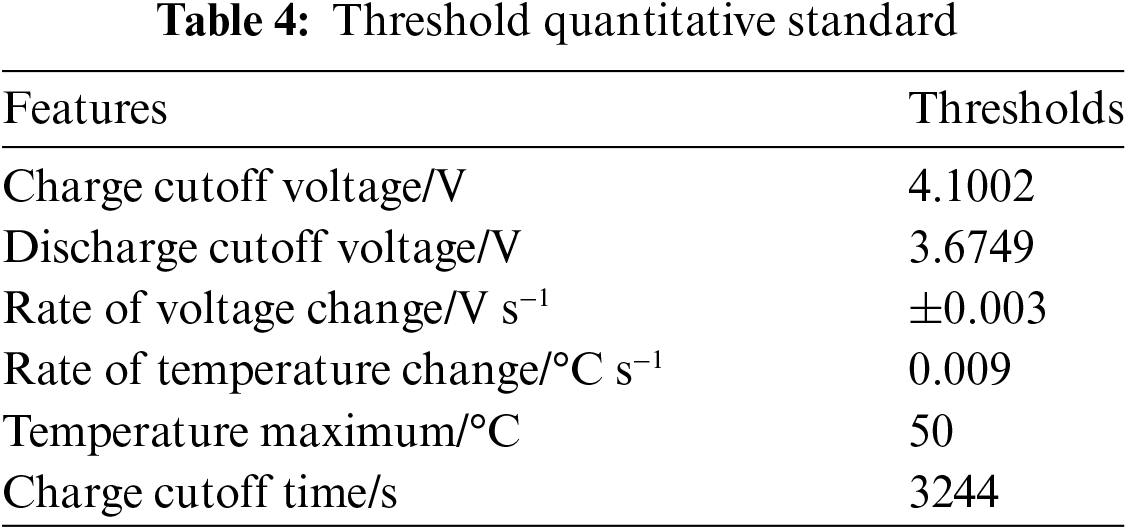
5.3 Threshold Quantitative Criteria
Through the data processing of the lithium battery dataset and equivalent circuit model fault simulation, the battery charging cutoff voltage can be obtained as 4.1002 V, and the discharge cutoff voltage is 3.6749 V. According to the thermal runaway fault simulation, the maximum variation of the voltage change rate can be obtained as 0.003 V/s. The battery enters the thermal accumulation stage at a temperature of 20°C to 50°C with a standard temperature change rate of less than 0.009°C/s [35]. Based on the above conclusions, it is determined that the lithium battery has a single charging and discharging cutoff time of 3244 s. In the accumulation stage, the temperature exceeds 50°C, and the temperature change rate is more significant than 0.009°C/s. Li battery experimental platform for lithium batteries for a single charge and discharge, the charging cutoff time of 3244 s. The charging cutoff time for different models and capacities of lithium batteries is different. The charging cutoff time threshold set in this paper is only for the lithium batteries in this paper and can not be realized for all lithium battery models [36]. Based on the above conclusions, to determine the six characteristics of lithium batteries in this paper threshold. The threshold quantitative criteria are expressed in Table 4.
5.4 Lithium Battery Troubleshooting Process
According to the accuracy of the LSTM-BP neural network model prediction and the set threshold quantitative criteria, the lithium battery fault diagnosis process is summarized as shown in Fig. 20.
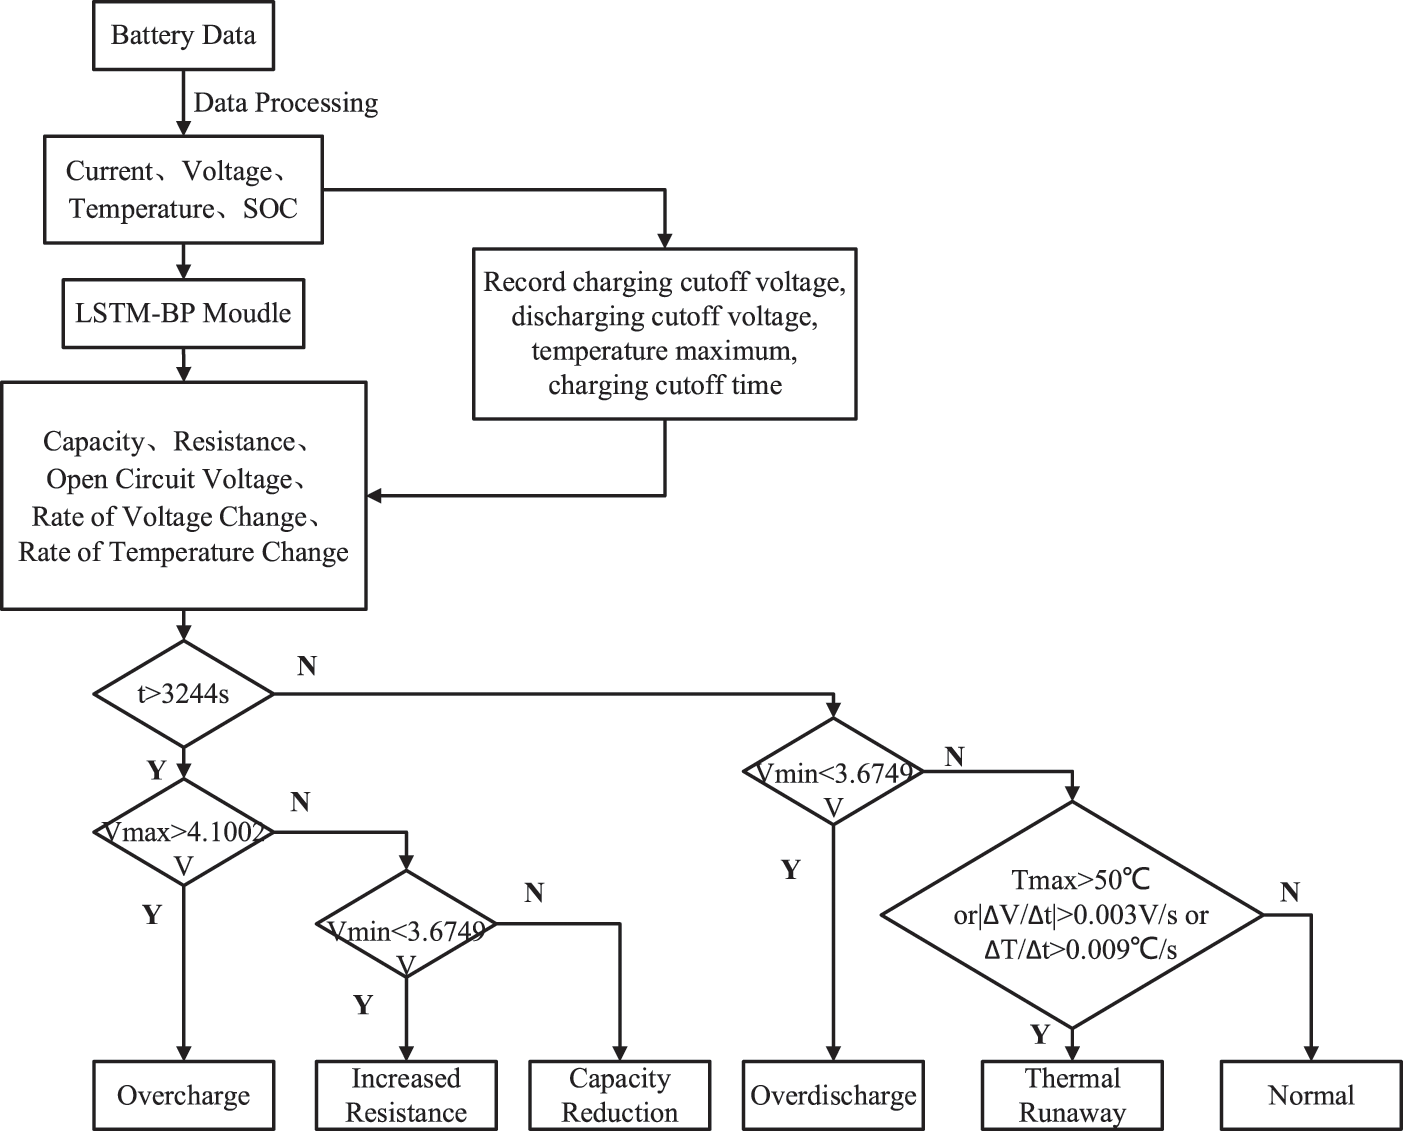
Figure 20: Lithium battery fault diagnosis process
Through the six characteristic thresholds of lithium batteries and the different manifestations of lithium batteries under different faults, you can use the lithium battery fault diagnosis flowchart to diagnose different faults of lithium batteries.
6 Lithium Battery Troubleshooting
Randomly selected lithium battery fault samples and standard samples for comparative diagnostic analysis. The diagnostic analysis of the overcharging fault is shown in Fig. 21.
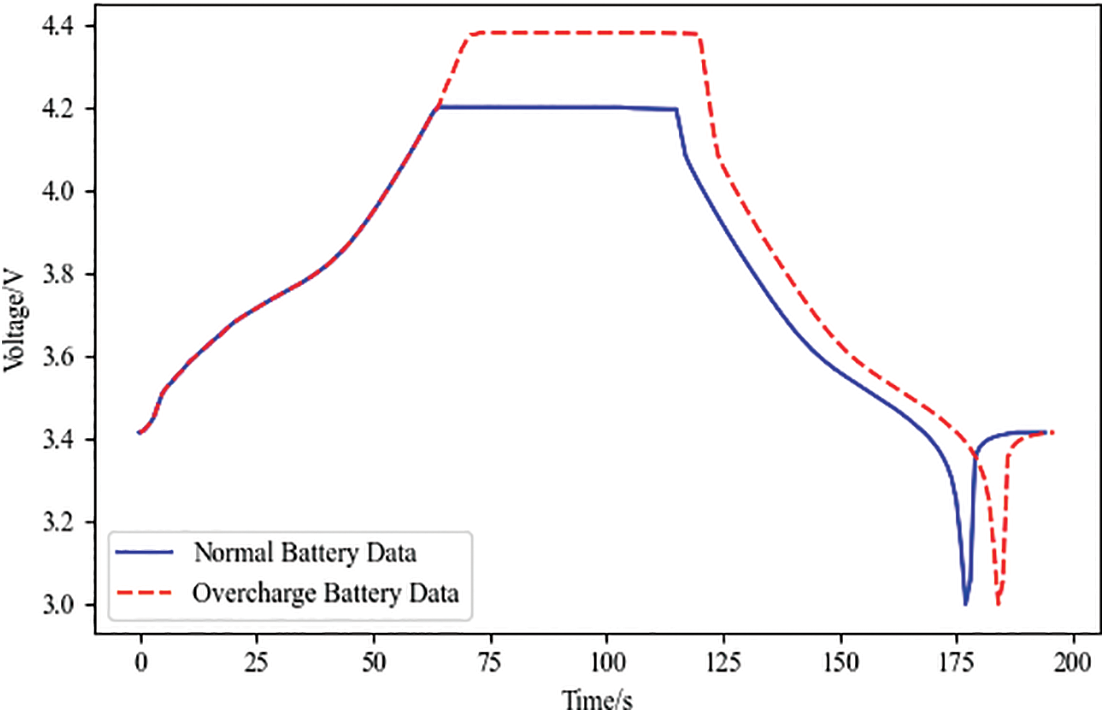
Figure 21: Diagnostic analysis of overcharging faults
According to the diagnostic analysis of the overcharge fault battery data in Fig. 21, it was finally concluded that the charging cutoff voltage was 4.3794 V, with an increase of 4.3%; the discharge cutoff voltage did not show any significant difference; the charging cutoff time was 3667 s, with an increase of 13.0%; and the internal resistance and capacity did not show any significant difference.
The diagnostic analysis of the over-discharge fault is shown in Fig. 22.
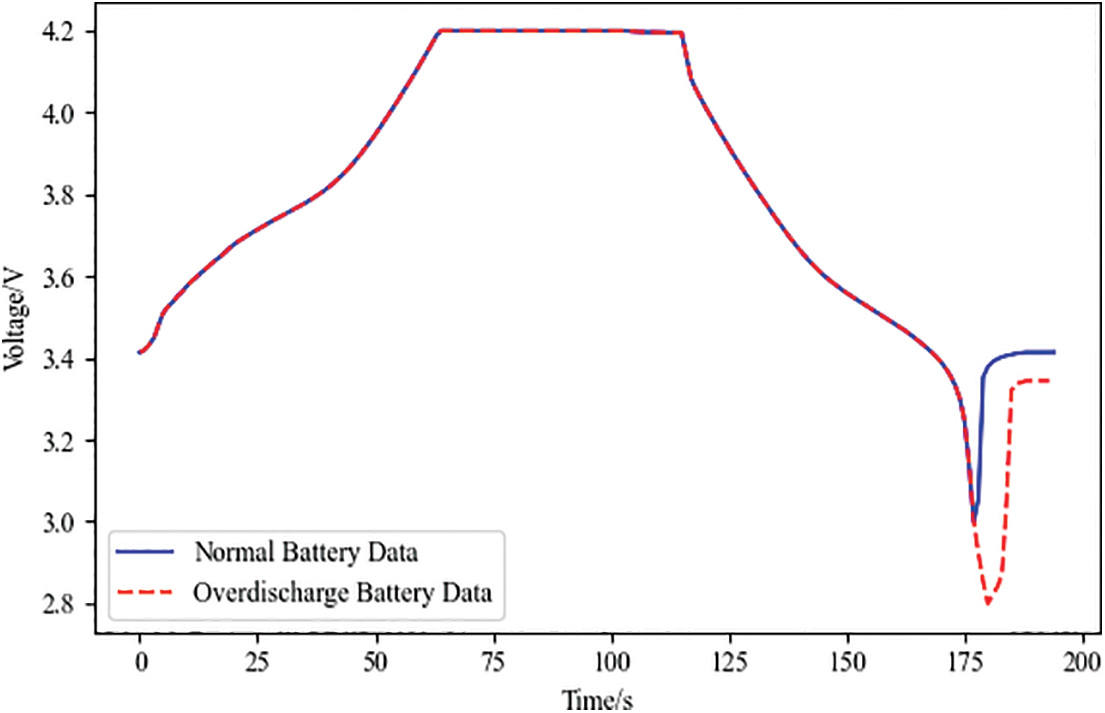
Figure 22: Diagnostic analysis of over-discharge faults
According to the diagnostic analysis of the over-discharge fault battery data in Fig. 22, it was finally concluded that the charging cutoff voltage did not show any significant difference; the discharging cutoff voltage was 2.8000 V, with a reduction of 6.6%; the charging cutoff time did not show any significant difference; and the internal resistance and capacity did not show any significant difference.
The diagnostic analysis of the fault of increased internal resistance is shown in Fig. 23.
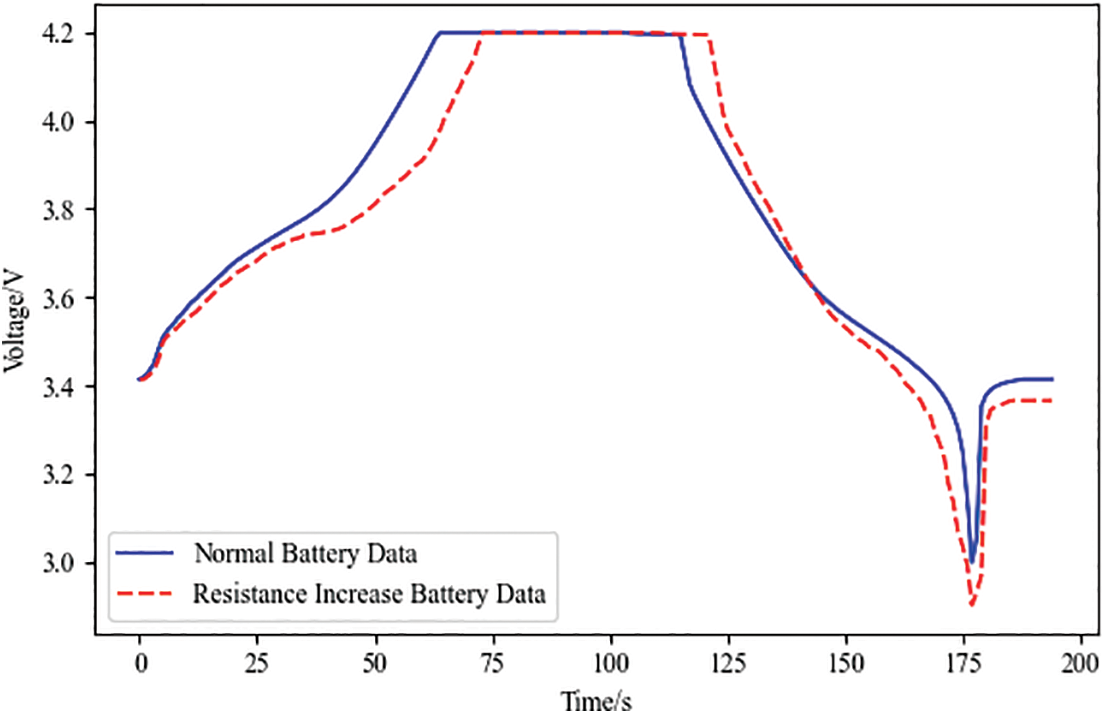
Figure 23: Diagnostic analysis of increased resistance faults
According to the diagnostic analysis of the internal resistance increase fault battery data in Fig. 23, the final result is: the charging cutoff voltage does not appear obvious differences; discharge cutoff voltage 2.903 V, shrinkage of 3.2%; charging cutoff time 3786 s, increase in size of 16.7%; the battery internal resistance of 0.1765 Ω, an increase of 0.0154 Ω, an increase of 10.3%; the capacity of the capacity does not appear obvious differences.
Lithium battery capacity reduction fault diagnostic analysis is shown in Fig. 24.
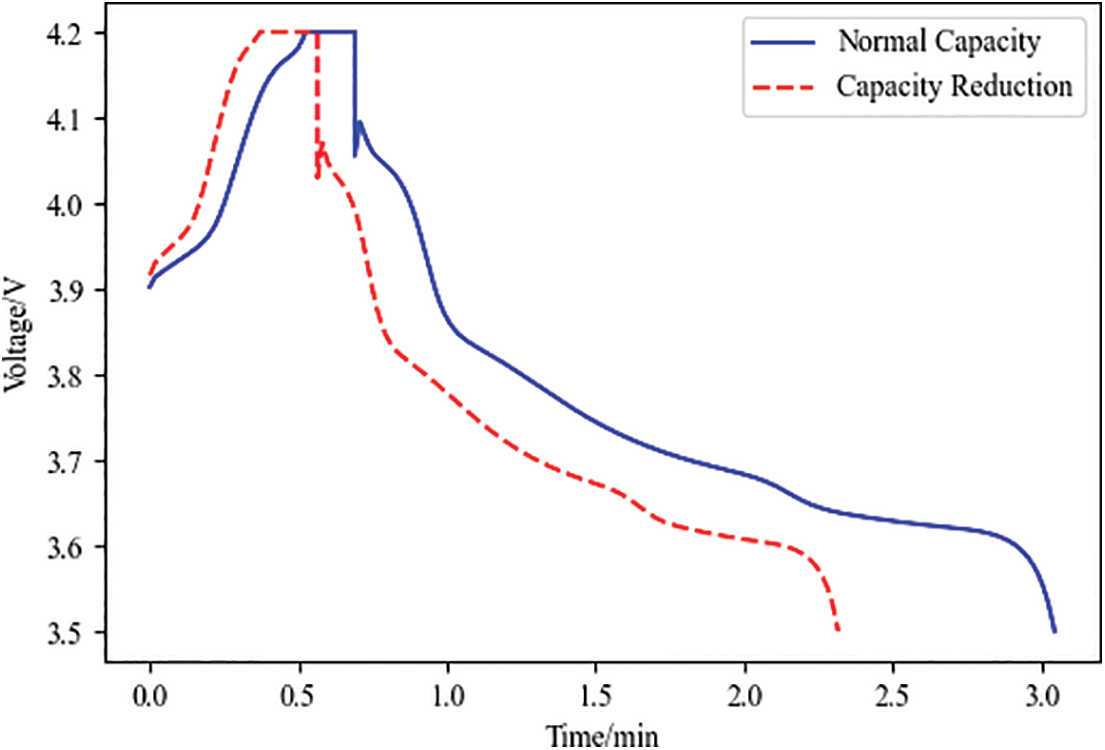
Figure 24: Diagnostic analysis of capacity reduction faults
According to Fig. 24 lithium battery capacity reduction fault battery data diagnostic analysis, the final result: the charging cutoff voltage does not appear to have apparent differences; discharge cutoff voltage does not appear evident differences; charging cutoff time 3605 s, an increase of 11.1%; the battery capacity of 19.75 AH, a reduction of 1.25 AH, reducing the magnitude of 6%; internal resistance does not appear apparent differences.
The thermal runaway fault diagnosis analysis is shown in Fig. 25.
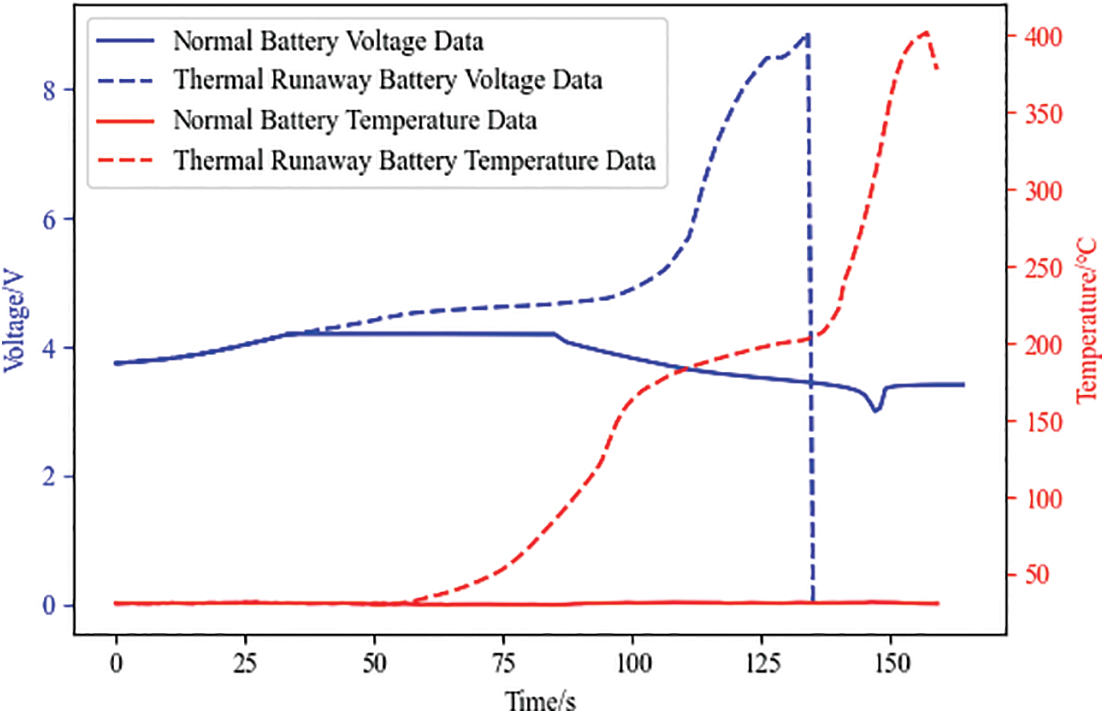
Figure 25: Diagnostic analysis of thermal runaway faults
According to the diagnostic analysis of the thermal runaway faulty battery data, it was finally concluded that when the time to 72 s, the voltage change rate was 0.004 V/s, which exceeded the voltage change rate threshold; when the time to 73 s, the temperature was 51°C, which exceeded the temperature maximum value, and the temperature change rate was 0.1°C/s, which surpassed the temperature change rate limit.
Aiming at the problem of power battery fault diagnosis, compared with the traditional LSTM neural network and BP neural network, this study proposes a power battery fault diagnosis method based on the LSTM-BP neural network. The lithium battery dataset is obtained by processing the data collected from the lithium battery experimental platform. The second-order RC equivalent circuit model and electro-thermal coupling model are constructed to simulate the lithium battery overcharging, over-discharging, internal resistance increase, capacity decrease, and thermal runaway faults and analyze the parameter characteristic changes corresponding to different faults of lithium batteries. Other neural network models are established to predict lithium batteries’ output labels, and the models’ effectiveness is evaluated using three indicators: MAE, RMSE, and MAE. The validation results show that the fault diagnosis method of the LSTM-BP neural network not only overcomes the limitations of the LSTM neural network and BP neural network but also improves the ability to process sequence data and reduces the risk of overfitting. Therefore, the LSTM-BP model has higher accuracy and effectiveness. According to the lithium battery dataset and lithium battery fault simulation analysis, the threshold value of each output label is set, and the fault diagnosis process is designed by setting different threshold values. Finally, different faults are diagnosed and analyzed through the data of standard and faulty lithium batteries to realize lithium battery fault diagnosis.
Due to the existence of coupling between lithium battery faults, the simultaneous occurrence of a single fault does not exclude the occurrence of other faults. This paper is only able to realize the diagnosis of a single lithium battery fault and did not consider in detail the case of multiple faults occurring at the same time, the future for various faults coupled with different faults, and the way of dealing with the more in-depth research, from the different faults to put forward a different solution focusing on the beginning. This paper collects data through the experimental platform, the model is trained and validated for the battery dataset in this paper, and the effectiveness of the fault diagnosis of the battery is very high. However, it does not consider the practicality of the actual operation of the tram, so the model still has a significant challenge in applying the actual tram. In the future, we will conduct in-depth research on the actual operation data of the tram so that the model has high validity. This paper only focuses on the fault diagnosis of lithium batteries and fails to consider the new materials, equipment, and other materials. It will conduct more in-depth and detailed research on batteries made of different new materials in the future, e.g., shuttle-free zinc-iodine batteries have the advantages of low cost and high-efficiency energy storage and long cycle stability, and they have the benefits of high-efficiency energy storage and long cycle stability [37].
Acknowledgement: None.
Funding Statement: The authors received no specific funding for this study.
Author Contributions: The authors confirm contribution to the paper as follows: Study conception and design: Yuheng Yin, Jiahao Song; Data collection: Jiahao Song; Analysis and interpretation of results: Yuheng Yin, Jiahao Song, Minghui Yang; Draft manuscript preparation: Jiahao Song, Minghui Yang. All authors reviewed the results and approved the final version of the manuscript.
Availability of Data and Materials: The data that support the findings of this study are available from the corresponding author, Jiahao Song, upon reasonable request.
Ethics Approval: Not applicable.
Conflicts of Interest: The authors declare no conflicts of interest to report regarding the present study.
References
1. J. C. Fang, Q. S. Xu, and R. C. Tang, “Research on demand management of hybrid energy storage system in industrial park based on variational mode decomposition and Wigner-Ville distribution,” J. Energy Storage, vol. 42, no. 1, Oct. 2021, Art. no. 103073. doi: 10.1016/j.est.2021.103073. [Google Scholar] [CrossRef]
2. F. Li, Y. Min, Y. Zhang, and C. Wang, “A method for abnormal battery charging capacity diagnosis based on electric vehicles operation data,” Batteries, vol. 9, no. 2, Feb. 2023, Art. no. 103. doi: 10.3390/batteries9020103. [Google Scholar] [CrossRef]
3. T. E. Fan, F. Chen, H. R. Lei, X. Tang, and F. Feng, “Fault diagnosis for lithium-ion battery pack based on relative entropy and state of charge estimation,” Batteries, vol. 10, no. 7, Jun. 2024, Art. no. 271. doi: 10.3390/batteries1007021. [Google Scholar] [CrossRef]
4. K. Bhaskar, A. Kumar, J. Bunce, J. Pressman, N. Burkell and C. D. Rahn, “Data-driven thermal anomaly detection in large battery packs,” Batteries, vol. 9, no. 2, Jan. 2023, Art. no. 70. doi: 10.3390/batteries9020070. [Google Scholar] [CrossRef]
5. P. Kurzweil, B. Frenzel, and W. Scheuerpflug, “A novel evaluation criterion for the rapid estimation of the overcharge and deep discharge of lithium-ion batteries using differential capacity,” Batteries, vol. 8, no. 8, Aug. 2022, Art. no. 89. doi: 10.3390/batteries8080086. [Google Scholar] [CrossRef]
6. J-C. Huang, M-H. Shu, H-T. Lin, and J-D. Day, “Transformer-based lithium battery fault diagnosis research for electric vehicles,” J. Intell. Fuzzy Syst., vol. 4, no. 46, pp. 9329–9341, Apr. 2024. doi: 10.3233/JIFS-237796. [Google Scholar] [CrossRef]
7. R. Yang, R. Xiong, S. Ma, and X. Lin, “Characterization of external short circuit faults in electric vehicle li-ion battery packs and prediction using artificial neural networks,” Appl. Energy, vol. 260, no. 10, Feb. 2020, Art. no. 114253. doi: 10.1016/j.apenergy.2019.114253. [Google Scholar] [CrossRef]
8. F. Heinrich and M. Pruckner, “Virtual experiments for battery state of health estimation based on neural networks and in-vehicle data,” J. Energy Stor., vol. 48, no. 116, Apr. 2022, Art. no. 103856. doi: 10.1016/j.est.2021.103856. [Google Scholar] [CrossRef]
9. J. Hong, Z. Wang, and Y. Yao, “Fault prognosis of battery system based on accurate voltage abnormity prognosis using long short-term memory neural networks,” Appl. Energy, vol. 251, no. 4, Oct. 2019, Art. no. 113381. doi: 10.1016/j.apenergy.2019.113381. [Google Scholar] [CrossRef]
10. D. Li et al., “Battery thermal runaway fault prognosis in electric vehicles based on abnormal heat generation and deep learning algorithms,” IEEE Trans. Power Electron., vol. 37, no. 7, pp. 8513–8525, Feb. 2022. doi: 10.1109/TPEL.2022.3150026. [Google Scholar] [CrossRef]
11. Z. Chen, C. Zheng, T. Lin, and Q. Yang, “Multifault diagnosis of Li-ion battery pack based on hybrid system,” IEEE Trans. Transp. Electrification, vol. 8, no. 2, pp. 1769–1784, Jun. 2022. doi: 10.1109/TTE.2021.3121036. [Google Scholar] [CrossRef]
12. J. Yun, Y. Choi, J. Lee, S. Choi, and C. Shin, “State-of-charge estimation method for lithium-ion batteries using extended kalman filter with adaptive battery parameters,” IEEE Access, vol. 11, pp. 90901–90915, Aug. 2023. doi: 10.1109/ACCESS.2023.3305950. [Google Scholar] [CrossRef]
13. T. Wu, J. He, J. Zou, Y. Yao, X. Yan and A. Yang, “Analysis and detection of charge and discharge characteristics of lithium battery based on multi-sensor fusion,” Elect. Eng., vol. 106, no. 3, pp. 2627–2636, Nov. 2023. doi: 10.1007/s00202-023-02083-z. [Google Scholar] [CrossRef]
14. M. S. Hossain Lipu et al., “Smart battery management technology in electric vehicle applications: Analytical and technical assessment toward emerging future directions,” Batteries, vol. 8, no. 11, Nov. 2022, Art. no. 219. doi: 10.3390/batteries8110219. [Google Scholar] [CrossRef]
15. J. H. Lee and I. S. Lee, “Estimation of online state of charge and state of health based on neural network model banks using lithium batteries,” Sensors, vol. 22, no. 15, Jul. 2022, Art. no. 5536. doi: 10.3390/s22155536. [Google Scholar] [PubMed] [CrossRef]
16. Y. B. Yan, C. Y. Zhang, J. Wang, B. Y. Lin, R. Z. Wang and X. F. Yin, “Investigation on the thermal control algorithm of the heat sink temperature regulating system for thermal vacuum tests,” MATEC Web Conf., vol. 179, no. 4, Jan. 2018, Art. no. 7. doi: 10.1051/matecconf/201817901023. [Google Scholar] [CrossRef]
17. M. Amini, M. H. Nazari, and S. H. Hosseinian, “Optimal scheduling and cost-benefit analysis of lithium-ion batteries based on battery state of health,” IEEE Access, vol. 14, pp. 1359–1371, Jan. 2023. doi: 10.1109/ACCESS.2022.3232282. [Google Scholar] [CrossRef]
18. H. Septanto, E. Kurniawan, J. A. Prakosa, S. Hafiz, M. W. S. Atman and O. Sudjana, “Discrete-time Luenberger observer design for lithium-ion battery state-of-charge with stability guarantee,” Int. J. Pow. Electron. Drive Syst., vol. 15, no. 4, pp. 2145–2154, Dec. 2024. doi: 10.11591/ijpeds.v15.i4.pp2145-2154. [Google Scholar] [CrossRef]
19. P. Shen, M. G. Ouyang, L. G. Lu, and J. Q. Li, “State of charge, state of health and state of function co-estimation of lithium-ion batteries for electric vehicles,” in 2016 IEEE Veh. Pow. Propul. Conf. (VPPC), Dec. 2016, pp. 1–5. doi: 10.1109/VPPC.2016.7791782. [Google Scholar] [CrossRef]
20. N. Wang, X. Xia, and X. Zeng, “State of charge and state of health estimation strategies for lithium-ion batteries,” Int. J. Low Carbon Technol., vol. 18, pp. 443–448, Oct. 2017. doi: 10.1093/ijlct/ctad032. [Google Scholar] [CrossRef]
21. Z. Y. Sun et al., “An online data-driven fault diagnosis and thermal runaway early warning for electric vehicle batteries,” IEEE Trans. Power Electron., vol. 37, no. 10, pp. 12636–12646, Oct. 2022. doi: 10.1109/TPEL.2022.3173038. [Google Scholar] [CrossRef]
22. Z. Yan, Y. Zhang, J. Yu, and B. Ran, “Life cycle improvement of serially connected batteries system by redundancy based on failure distribution analysis,” J. Energy Storage, vol. 46, Feb. 2022, Art. no. 103851. doi: 10.1016/j.est.2021.103851. [Google Scholar] [CrossRef]
23. J. Yang, J. Jung, S. Ghorbanpour, and S. Han, “Data-driven fault diagnosis and cause analysis of battery pack with real data,” Energies, vol. 15, no. 5, Feb. 2022, Art. no. 1647. doi: 10.3390/en15051647. [Google Scholar] [CrossRef]
24. F. Li, Y. J. Min, and Y. Zhang, “A novel method for lithium-ion battery fault diagnosis of electric vehicle based on real-time voltage,” Wirel. Commun. Mob. Comput., vol. 2022, May 2022, Art. no. 7277446. doi: 10.1155/2022/7277446. [Google Scholar] [CrossRef]
25. P. Zhi, Y. Qi, W. Wang, H. Qiu, W. Zhu and Y. Yang, “A lifetime optimization method of new energy storage module based on new artificial fish swarm algorithm,” Adv. Mech. Eng., vol. 13, Sep. 2021, Art. no. 9. doi: 10.1177/16878140211050843. [Google Scholar] [CrossRef]
26. L. Yao et al., “An intelligent diagnosis method for battery pack connection faults based on multiple correlation analysis and adaptive fusion decision-making,” Energy, vol. 306, no. 10, Oct. 2024, Art. no. 132573. doi: 10.1016/j.energy.2024.132573. [Google Scholar] [CrossRef]
27. N. Costa, L. Sánchez, D. Anseán, and M. Dubarry, “Li-ion battery degradation modes diagnosis via convolutional neural networks,” J. Energy Storage, vol. 55, no. 1, Nov. 2022, Art. no. 105558. doi: 10.1016/j.est.2022.105558. [Google Scholar] [CrossRef]
28. C. Zhang and T. Yao, “Anomaly detection for wind turbines using long short-term memory-based variational autoencoder Wasserstein generation adversarial network under semi-supervised training,” Energies, vol. 16, no. 19, Oct. 2022, Art. no. 7008. doi: 10.3390/en16197008. [Google Scholar] [CrossRef]
29. C. Hua, E. Zhu, L. Kuang, and D. Pi, “Short-term power prediction of photovoltaic power station based on long short-term memory-back-propagation,” Int. J. Distrib. Sens. Netw., vol. 15, no. 10, Oct. 2019. doi: 10.1177/1550147719883134. [Google Scholar] [CrossRef]
30. L. Tian, C. Dong, Y. Mu, X. Yu, and H. Jia, “Online lithium-ion battery intelligent perception for thermal fault detection and localization,” Heliyon, vol. 10, no. 4, Feb. 2024, Art. no. e25298. doi: 10.1016/j.heliyon.2024.e25298. [Google Scholar] [PubMed] [CrossRef]
31. X. Y. Bai et al., “Three-dimensional electrochemical-magnetic-thermal coupling model for lithium-ion batteries and its application in battery health monitoring and fault diagnosis,” Sci. Rep., vol. 14, no. 1, May 2024, Art. no. 10802. doi: 10.1038/s41598-024-61526-0. [Google Scholar] [PubMed] [CrossRef]
32. H. M. Jia and X. F. Zhou, “Water quality prediction method based on LSTM-BP,” in 2020 12th Int. Conf. Intell. Human-Mach. Syst. Cybernet. (IHMSC), Sep. 2020, pp. 27–30. doi: 10.1109/IHMSC49165.2020.00014. [Google Scholar] [CrossRef]
33. H. Xu, B. Lv, J. Chen, L. Kou, H. Liu and M. Liu, “Research on a prediction model of water quality parameters in a marine ranch based on LSTM-BP,” Water, vol. 15, no. 15, Jul. 2023, Art. no. 2760. doi: 10.3390/w15152760. [Google Scholar] [CrossRef]
34. C. Wu, C. Zhu, and Y. Ge, “A review on fault mechanism and diagnosis approach for li-ion batteries,” J. Nanomat., vol. 2015, no. 1, pp. 1–9, Oct. 2015. doi: 10.1155/2015/631263. [Google Scholar] [CrossRef]
35. Q. Y. Chen, Y. H. He, N. J. Fang, and G. D. Yu, “A combined data-driven and model-based algorithm for accurate battery thermal runaway warning,” Sensors, vol. 24, no. 15, Jul. 2024, Art. no. 4964. doi: 10.3390/s24154964. [Google Scholar] [PubMed] [CrossRef]
36. L. Yao et al., “Fault identification of lithium-ion battery pack for electric vehicle based on GA optimized ELM neural network,” IEEE Access, vol. 10, pp. 15007–15022, Jan. 2022. doi: 10.1109/ACCESS.2022.3147802. [Google Scholar] [CrossRef]
37. J. Q. Sun, Z. S. Wang, J. Zhang, and D. W. Wang, “Shuttle-free zinc-iodine batteries enabled by a cobalt single atom anchored on N-doped porous carbon host with ultra-high specific surface area,” J. Energy Storage, vol. 90, Jun. 2024, Art. no. 111716. doi: 10.1016/j.est.2024.111716. [Google Scholar] [CrossRef]
Cite This Article
 Copyright © 2025 The Author(s). Published by Tech Science Press.
This work is licensed under a Creative Commons Attribution 4.0 International License , which permits unrestricted use, distribution, and reproduction in any medium, provided the original work is properly cited.
 Downloads
 Citation Tools