
 Submit a Paper
 Propose a Special lssue
 Open Access
ARTICLE

The Study of Long-Term Trading Revenue Distribution Models in Wind-Photovoltaic-Thermal Complementary Systems Based on the Improved Shapley Value Method
School of Electrical Engineering, Northeast Electric Power University, Jilin, 132012, China
* Corresponding Author: Chuang Liu. Email:
Energy Engineering 2025, 122(7), 2673-2694. https://doi.org/10.32604/ee.2025.062154
Received 11 December 2024; Accepted 12 February 2025; Issue published 27 June 2025
 View Full Text
 Download PDF
Abstract
Under the current long-term electricity market mechanism, new energy and thermal power face issues such as deviation assessment and compression of generation space. The profitability of market players is limited. Simultaneously, the cooperation model among various energy sources will have a direct impact on the alliance’s revenue and the equity of income distribution within the alliance. Therefore, integrating new energy with thermal power units into an integrated multi-energy complementary system to participate in the long-term electricity market holds significant potential. To simulate and evaluate the benefits and internal distribution methods of a multi-energy complementary system participating in long-term market transactions, this paper first constructs a multi-energy complementary system integrated with new energy and thermal power generation units at the same connection point, and participates in the annual bilateral game as a unified market entity to obtain the revenue value under the annual bilateral market. Secondly, based on the entropy weight method, improvements are made to the traditional Shapley value distribution model, and an internal distribution model for multi-energy complementary systems with multiple participants is constructed. Finally, a Markov Decision Process (MDP) evaluation system is constructed for practical case verification. The research results show that the improved Shapley value distribution model achieves higher satisfaction, providing a reasonable allocation scheme for multi-energy complementary cooperation models.Keywords
The installation of new types of energy such as wind and solar power has been increasing year by year and is becoming a trend to be integrated into the power grid on a large scale [1]. However, the intermittency and uncertainty of new energy output can lead to contract deviations in the medium and long-term markets, limiting the profitability of new energy market players [2]. Equipping new energy with flexible regulation resources is one of the effective approaches to facilitate the absorption of new energy [3,4]. In 2021, the National Development and Reform Commission issued a document [5], which clearly proposed the coordinated interaction between the source, grid, load, and storage at all stages, fully tapping into the system’s flexibility regulation capabilities and demand-side resources, and prioritizing the absorption of new energy power generation systems to build a diversified energy supply and intelligent security system. Pumped storage hydropower plants are often used as large-capacity energy storage stations to complement dispatch due to their low cost. In literature [6], a wind-solar pumped storage joint operation system is constructed based on the complementary characteristics of wind and solar power, and a new strategy for renewable energy participation in the electricity market is proposed. Furthermore, an optimization method for the joint operation of wind power, photovoltaics, and pumped storage under the context of the electricity market is proposed. Literature [7] proposes a control strategy for wind-storage joint power generation systems that accounts for wind power accommodation during valley periods, enhancing the dispatchability of wind farms and the amount of wind power accommodated. However, none of these studies considered that in the northern regions of China, where water resources are scarce, coal-fired units are often used as flexible regulation power sources. Literature [8], aiming to improve the quality of thermal power units’ participation in grid regulation, proposes the flexibility transformation method of applying thermal power units coupled with energy storage systems. The literature [9–11] propose different retrofit technologies for cogeneration units and pure condensing units to meet low-load stable combustion and wide-load denitrification requirements. However, the operating time scale of the units in the above studies is still at the minute level or above, which cannot fully utilize the regulating capability of thermal power units on a shorter time scale.
Literature [12] establishes a shared energy storage leader-follower Stackelberg game-based robust pricing model that considers energy storage participation in frequency regulation, with the shared energy storage operator as the leader and the wind farm as the follower. This model achieves a mutually beneficial win-win situation for both parties in the game. Literature [13] uses fuzzy chance-constrained power balance constraints to characterize the uncertainty of wind and solar power outputs, and constructs a new wind-solar-thermal-pumped storage joint operation system day-ahead optimization dispatch model. Literature [14] proposes a new mode of wind-thermal bundled participation in large user direct purchase transactions, and based on dynamic non-cooperative theory, establishes a bi-level game mode. Thermal power units have been widely applied in the construction of modern new power systems due to their good regulation performance and fast response speed [15,16]. However, the above studies have not focused on the research of thermal power units integrated with new energy stations as a multi-energy complementary system participating in bilateral market transactions. Therefore, there is an urgent need to construct a benefit calculation model for a multi-energy complementary system participating in annual bilateral market transactions.
The operation of a multi-energy complementary system can bring cooperative incremental benefits to the system [17,18]. Formulating a fair cooperative benefit distribution strategy can promote the stable formation of a complementary operation system among multiple energy entities [19]. Regarding the internal benefit distribution problem of wind farms, photovoltaic power stations, and thermal power plants integrated as independent operating entities at the same grid point, the existing mainstream distribution methods all belong to the field of cooperative game theory [20]. The Shapley value method has been applied to logistics network design, comprehensive energy system benefit distribution in industrial parks, and electric heating load cost allocation, among other areas [21–23]. Based on the distribution principle of “openness, justice, and fairness”, literature [24] has constructed a judgment mechanism that considers rewards and punishments, and distributes benefits according to the contribution and punishment of each entity based on subjective factors. Although the considered content is extensive, the subjectivity is relatively strong. Literature [25] proposed an improved Shapley value method that considers the different line losses caused by the different locations of the micro-grid members within the alliance, thereby studying the problem of shared energy storage configuration and cost allocation. Existing benefit distribution strategies are mostly focused on user-side cost allocation, while there is a lack of research on the benefit distribution among multiple entities on the generation side and the characterization of the risk and return borne by each entity.
In response to the above issues, this paper takes a wind-solar-thermal multi-entity complementary power generation system as the research object, and proposes an improved Shapley value allocation model. First, in the second part of the article, a typical scenario revenue calculation model is constructed for the integrated new energy and thermal power units participating in the annual market bilateral transactions. In the third part of the article, the improved K-means algorithm is used to process the historical data, and the particle swarm algorithm is combined to obtain the optimal output values of the units in the typical scenarios of the multi-energy complementary system, and the annual revenue is calculated. In the fourth part of the article, the entropy weight method is used to assign risk factors to each power generation entity within the system. After considering the marginal contribution of each power generation entity to the alliance, the risk factors are combined to make a secondary allocation of the revenue increment. Finally, the MDP index is used to verify the satisfaction of each power generation entity within the multi-energy complementary system under different allocation modes, and a practical case study is used to verify the feasibility of the improved Shapley value allocation method.
2 Multi-Energy Complementary System Shared Benefits Alliance Model
2.1 Construction of a Multi-Energy Complementary System
This paper takes the wind farm, photovoltaic power station, and thermal power plant, which are integrated at the same connection point to form an independent operating alliance trading entity—the multi-energy complementary system, as the research object. This system operates under the guiding principle of “new energy prioritizes providing contract electricity, thermal power units provide ancillary services, and the system as a whole is subject to unified grid regulation”, as shown in Fig. 1. The system, as an independent entity, participates in market competition externally. Unlike traditional micro-grids and distributed power generation systems, the multi-energy complementary system is more applied at the level of large power grids, integrating new energy units and thermal power units into a unified operating entity through a near-electrical network. Currently, the multi-energy complementary system has been widely applied, and China’s “Gurbag” large new energy base, which is based on the integration of “wind, light, fire, and storage”, has been put into production and construction.
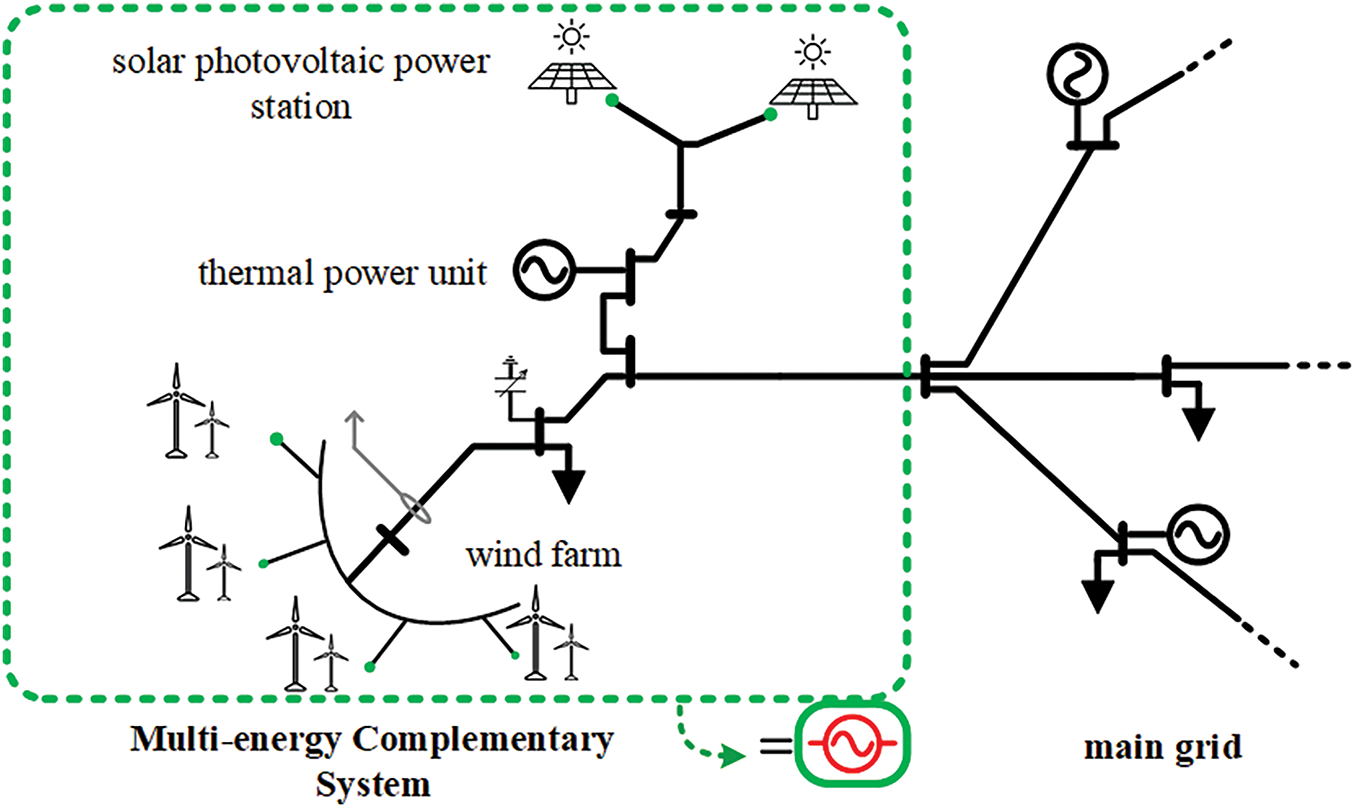
Figure 1: Multi-energy complementary systems under the same grid connection point
The multi-energy complementary system belongs to a sub-alliance form with multiple power generation entities. To perform a refined internal benefit allocation for the overall system efficiency, it is assumed that the system contains m stakeholders, and the overall system is denoted as alliance M (M ∈ S), with a trading cycle of T trading periods. Based on the improved Shapley value allocation model, the overall revenue of alliance M is reasonably allocated to ensure the stable operation of the multi-energy system and fully mobilize the enthusiasm of the power generation entities within the alliance.
2.2 Membership Participation in the Multi-Energy Complementary System Alliance
When the thermal power plant participates in the market trading as an independent entity, facing the new power system with the participation of new energy sources, the thermal power units lose their competitiveness in the trading market due to their high marginal costs. After cooperating with new energy sources to form a multi-energy complementary system, the system as a whole has a unified pricing for external transactions. Since the marginal cost of new energy generation can be neglected [26], the overall system’s pricing coefficient is lower than the pricing when the thermal power unit competes independently.
For the new energy power stations under this grid point, due to the influence of factors such as wind speed and sunshine duration, when operating independently, they need to pay the deviation assessment fee caused by the uncertainty of power output. After being integrated with the thermal power units into a multi-energy complementary system, the thermal power units in this system have a certain regulating role, which can smooth out the short-term power fluctuations of the new energy sources [27]. Compared to the traditional “wind-solar-thermal bundled mode”, the overall system does not need to pay the deviation assessment fee for external transactions.
3 Annual Market Revenue Accounting Model of Multi-Energy Complementary System
This section constructs an annual revenue calculation model for a multi-energy complementary system participating in the trading market. Existing regulations often use the YMD decomposition method to handle the annual contracted electricity volume, but the decomposition coefficients based on historical load data cannot reflect the uncertainty of new energy output, resulting in a large amount of “wind and light abandonment” phenomenon. To accurately determine the annual contracted electricity volume of the multi-energy complementary system, this paper uses an improved K-means algorithm to sequentially process the new energy output data and the historical load data of large users throughout the year, forming 12 typical trading scenarios for the entire year. Then, a specific scenario within the month is selected to simulate the bilevel game process between the multi-energy complementary system and other competing power generation enterprises in the market, with the goal of minimizing the direct purchase electricity cost of the large user and maximizing the benefits of the power generation companies. This determines the final contracted electricity volume under the system’s bilateral trading mode.
3.1 Improved K-Means Clustering Algorithm
The annual output of new energy has high uncertainty and is greatly affected by natural factors, resulting in large fluctuations. For the load data of large users, this paper adopts a fixed-value clustering method based on workdays, holidays, and rest days, and determines the number of clusters to be 3. Due to the high data requirements of the original K-means algorithm and the randomness in the selection of initial clustering centers, the clustering data set is prone to falling into local optimal solutions. Therefore, this paper adopts a density-based clustering method combined with the traditional clustering approach. The multiple typical scenarios obtained through clustering are then assigned weight values based on their frequency of occurrence in the month, in order to obtain the typical output scenario for that month.
The specific steps of the improved K-means algorithm are as follows:
(1) The historical power generation data of the new energy plants and the historical power demand data of the large users under this site are input into the sample set to be clustered. The Euclidean distance di,j between each power generation scenario is then calculated, and the Euclidean distance matrix is sorted. The distance values in the top 2% of the matrix are selected as the truncation distance dc. The local density ri of each scenario within the truncation distance C is expressed as follows:
(2) The power generation scenario with the maximum local density is selected as the first clustering center. The remaining clustering centers are then selected as the initial typical scenarios based on the principle of “farthest from the clustering center and maximum local density”. The initial clustering center set is recorded as (SC1, SC2, ..., SCk).
(3) The initial k typical scenarios are determined, and the optimal k value is evaluated based on the mixed evaluation function M(k), where the k value with the M(k) value closest to 1 is the optimal number of clustering typical scenarios. The specific expression is:
(4) The Euclidean distances between the remaining non-clustering center points and the initial clustering centers are calculated in turn, and the sample set data are divided into the typical scenario sets with the closest distance, i.e., the smaller the difference. The average values of each cluster are recalculated until the clustering centers do not change, and the update of the typical scenarios can be stopped.
3.2 Typical Scenario-Based Power Generation Alliance Game Model
As shown in Fig. 2, taking the multi-energy complementary system as an example, a framework of the alliance’s overall participation in the medium and long-term electricity market trading model is constructed. This system, as an independent operating entity, is in the upper layer of the game with other competing power generation companies in the market, and makes bids to the lower-level power grid companies or large users, respectively. The user side allocates the trading electricity volume based on the bid price.
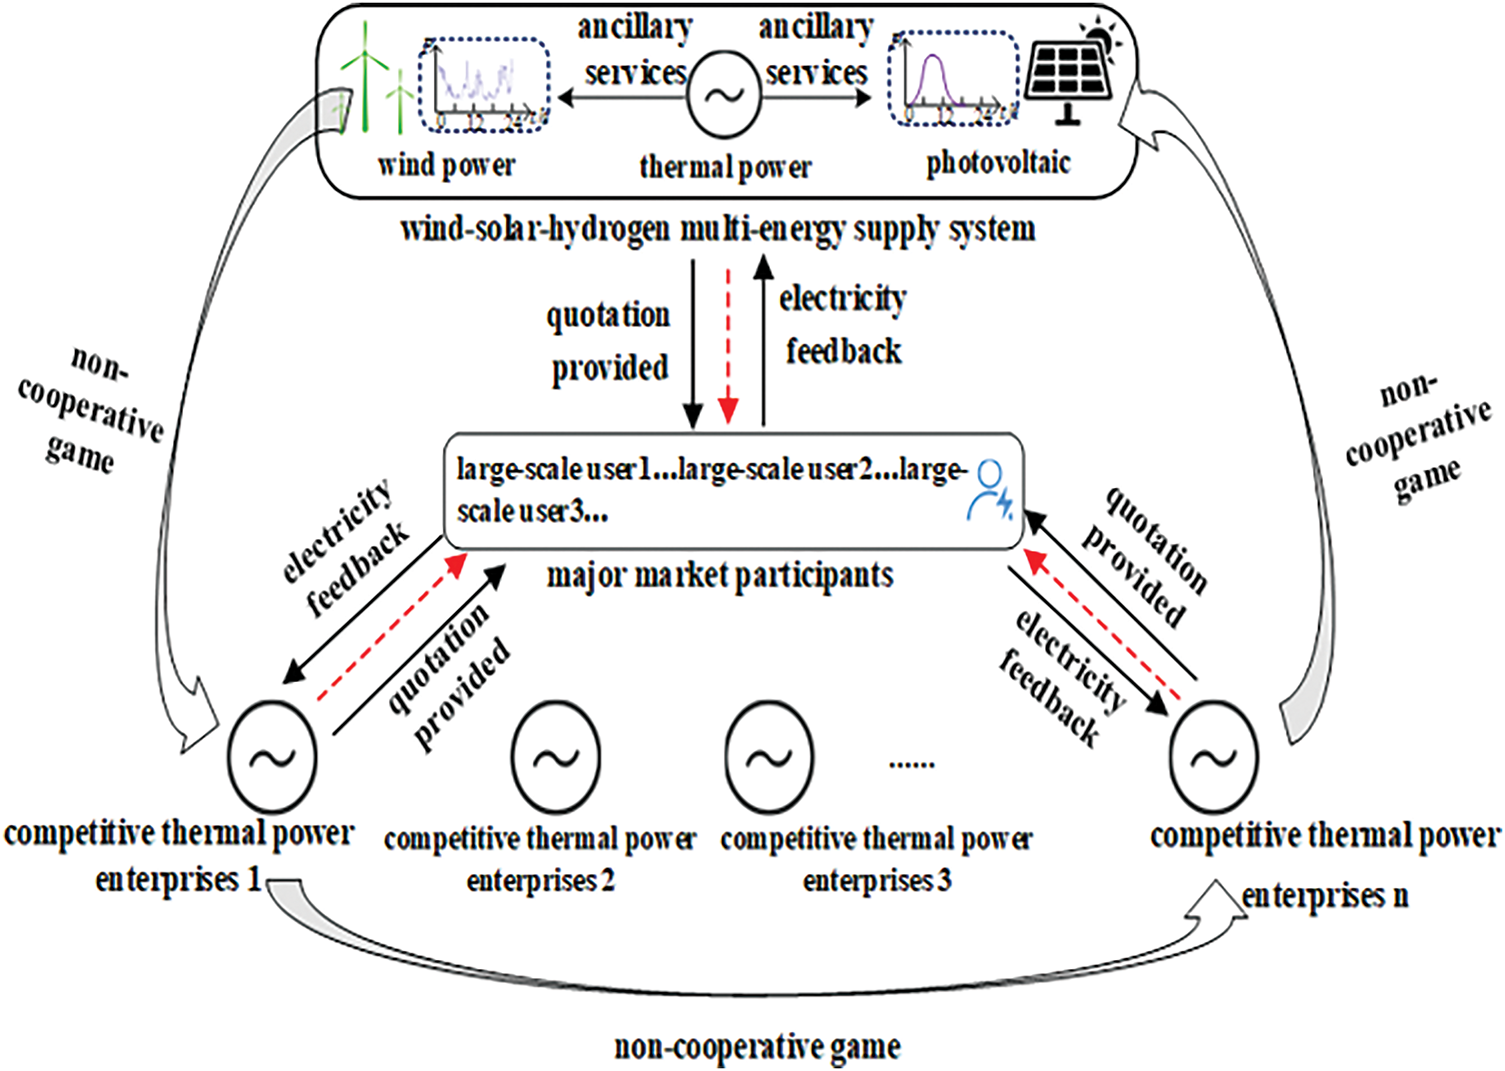
Figure 2: A bidirectional market bidding model incorporating multi-energy complementary systems
Since the multi-energy complementary system is a form of sub-alliance within the power generation alliance, this section establishes a more general profit calculation model for the typical scenario of the power generation alliance, in order to calculate the marginal benefits of each subject within the multi-energy complementary system in the future. The following assumptions are made in this model: There are 24 trading periods in the scenario; Each power plant submits bids according to the bidding curve; The participating parties in the bilateral trading market are the power generation alliance S and a large user integrated from multiple market users; The power supply and demand parties adopt the direct power purchase trading model.
3.2.1 Upper-Level Power Generation Alliance Revenue Model
Since each power plant submits bids according to the bidding curve, the function relationship between the bid price and the trading period can be obtained by interpolation and fitting of the historical bid data. The bid price of the power generation enterprise is the final transaction price. The bid price
In the formula,
Some power generation alliances cover wind farms and photovoltaic power stations, and according to policy requirements, they need to provide generation subsidies to new energy power generation companies within the alliance. The total revenue
In the formula, SW and SP represent the subsidy electricity prices for wind power and photovoltaic power as stipulated by the market;
In terms of cost accounting, due to the different subjects within the power generation alliance, it can be accounted for separately from the aspects of variable costs and fixed costs. The variable costs are related to the unit output data, including the coal consumption costs and environmental surcharges of thermal power units, as well as the additional deviation assessment costs of new energy stations. The allocation of fixed assets within the alliance belongs to the category of fixed costs, and the numerical value is independent of the unit output.
(1) Internal variable costs of the alliance
a. Unit coal consumption cost
The coal consumption cost of thermal power units is often related to the unit’s energy consumption characteristic curve [28]. By data fitting, the correlation coefficient between unit output and power generation cost can be obtained. The coal consumption cost function of the unit is expressed as follows:
In the formula, As, Bs, Ks are the coal consumption characteristic coefficients of the thermal power units within the power generation alliance; ps,t represents the output power of the thermal power units within the alliance at time t.
b. Environmental Costs of Thermal Power Units
Thermal power units generate pollutants such as SO2, NOx during operation. Units are required to equip desulfurization and denitrification devices to reduce pollutant emissions. The cost function is represented as follows:
In the formula, γS and γN correspond to the desulfurization and denitrification cost coefficients per unit of electricity for thermal power units, respectively.
c. New Energy Deviation Assessment Cost
When wind farms and photovoltaic power stations participate in the market competition independently, they need to consider the deviation assessment cost brought by the large-scale development of new energy [29]. In a typical scenario, the output curves of wind power and photovoltaic power stations are selected, and based on the equivalent output principle, the historical output data of the stations are equivalent to the new energy assessment boundary curve consistent with the load curve fluctuation trend. Due to the difference between the actual output curve and the assessment curve, when the large-scale development of new energy occurs, thermal power units need to give up generation space to the new energy stations in the market, and the assessment electricity is shown in the blue area in Fig. 3.
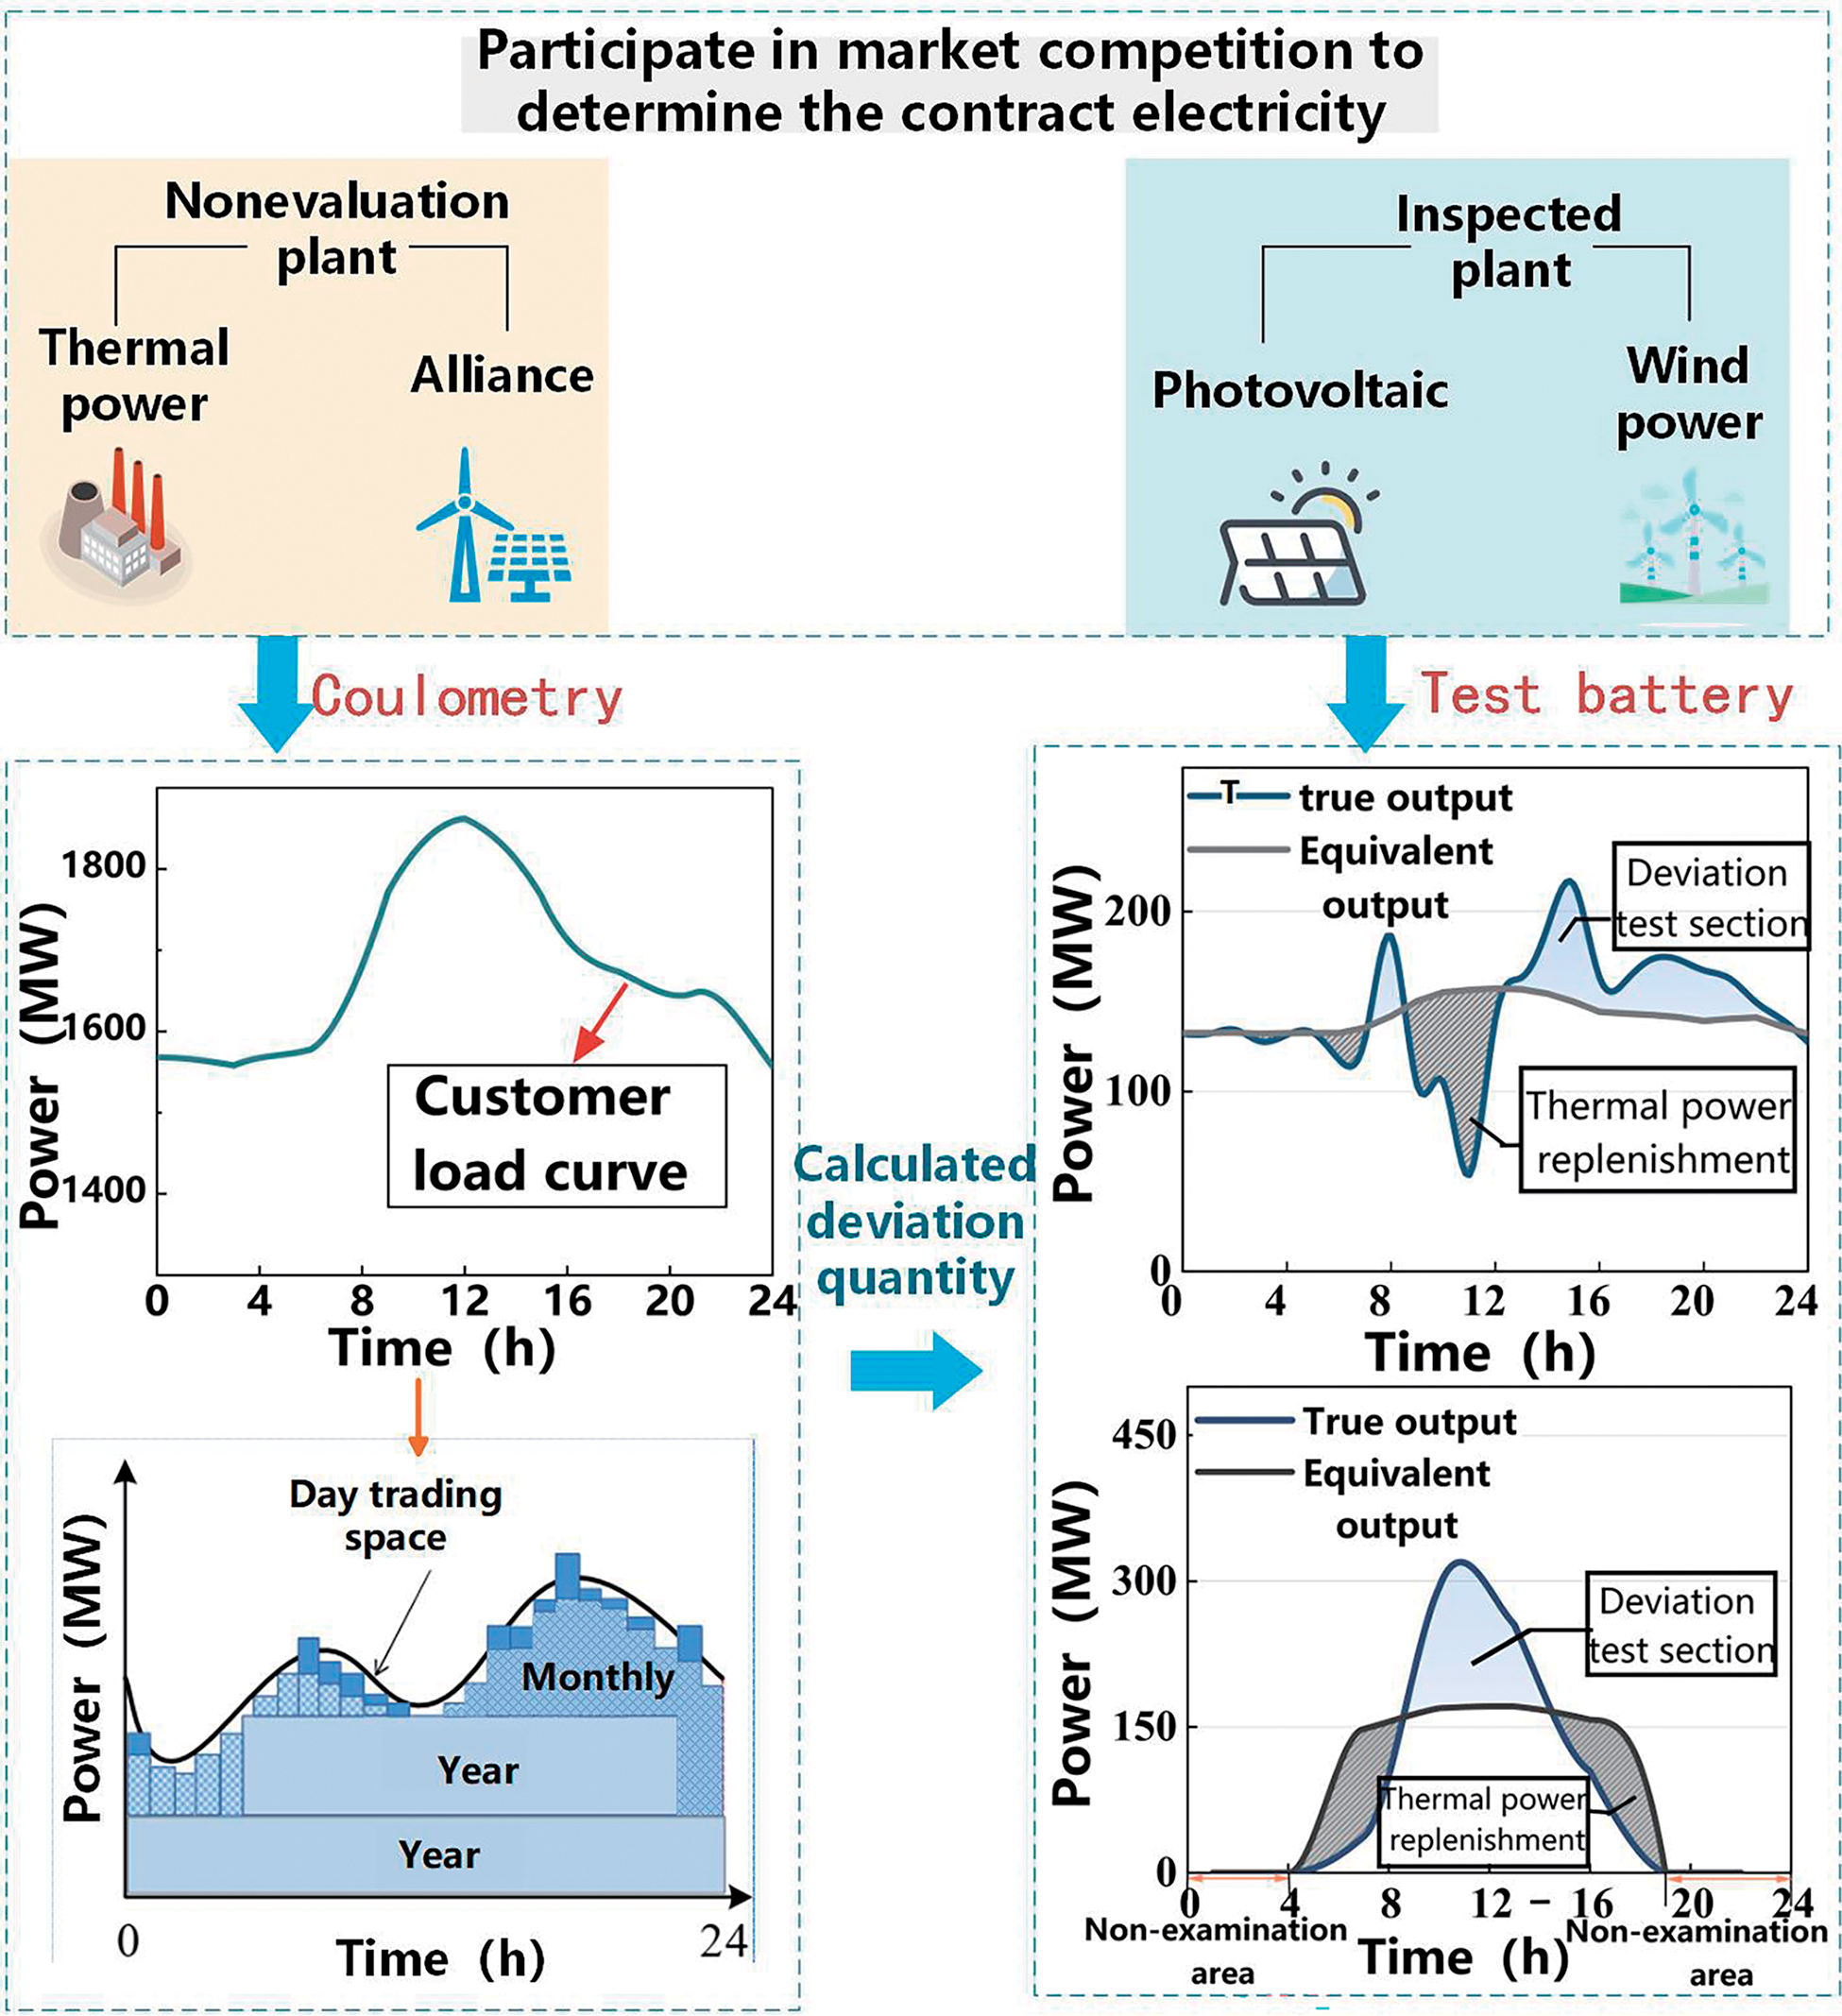
Figure 3: Calculate the flow chart of new energy deviation assessment
The calculation formula for the internal new energy deviation assessment cost of alliance s is as follows:
In the formula, μ is the unit deviation assessment fee per unit of electricity (yuan/MWh);
(2) Internal Fixed Cost Allocation of the Alliance
The cost allocation is carried out using the average operating time method for the units. The calculation formula for the depreciation amount of the alliance units during period T is as follows:
In the formula, Pdy represents the initial investment cost; V% represents the net residual value rate of the unit; N represents the number of years the unit has been in operation; represents the annual depreciation rate of the unit. Since power generation companies sign long-term market contracts, this parameter can be considered a constant; Tsum represents the annual operating hours of the unit.
The power generation alliance, as the upper layer of the game between two parties, often aims to maximize its total revenue by optimizing the internal resource output strategy. The revenue function expression for alliance s during period T is as follows:
3.2.2 Lower-Level Direct Purchase Cost Model for Large Users
In the game, lower-level large users aim to minimize their own direct purchase electricity costs. The electricity purchase cost for large users during period T in a typical scenario is:
In the formula, n represents the total number of power generation companies that have signed transaction contracts with the large user, and
Different power generation alliances and their competing power generation enterprises have bidding constraints, unit installed capacity constraints, and load side demand constraints in the principal-agent game. They are expressed as follows:
(1) Bidding Constraints
The bidding prices reported by each power generation company in the game process must follow certain upper and lower limits. The price range for direct power trading within the province is determined by the relevant power industry units in the province, taking into account factors such as the operation of power generation companies and the affordability of market users’ electricity prices. Power generation companies shall not bid too low in violation of market rules.
In the formula, Fmin and Fmax represent the lower and upper limits of the bidding prices for each power generation company, respectively.
(2) Unit Capacity Constraints
Within the alliance, thermal power units need to follow the principle of prioritizing the consumption of new energy sources. When new energy sources generate less electricity, the shortfall needs to be supplemented. For this purpose, the alliance only needs to impose restrictions on the power generation of its internal thermal power units.
In the formula, ptgn represents the rated power generation capacity of the thermal power units within the alliance at time t.
(3) Load Side Demand Constraints
In typical scenarios, the total electricity traded between power generation alliances and their competing power generation enterprises during a unit time period t must meet the demand for electricity on the load side during the corresponding time period. The equation constraint is expressed as follows:
4 Multi-Energy Complementary System Profit Distribution Model
Regarding the problem of internal revenue distribution in a multi-subject complementary energy system, if the revenue distribution is determined based on the power generation of each subject within the system, the revenue situation will be overly influenced by the installed capacity of the units, and the differences in the contributions of new energy and thermal power within the system cannot be reflected, which is not conducive to the overall stable cooperation of the system.
To this end, this paper proposes an improved Shapley value distribution method combined with the entropy weight method. Based on the total revenue value obtained in the previous text, which includes the multi-energy complementary system among multiple power generation alliances in typical scenarios, it calculates the marginal contribution effect of each player within the multi-energy complementary system on the overall system. At the same time, it makes a secondary distribution of the overall revenue increment of the system to ensure that high-risk entities within the system obtain corresponding high-risk returns, satisfying overall rationality and individual rationality. The MDP indicator is introduced, and the equal sharing method, the core method, and the traditional Shapley value method are selected as control groups. The results show that the satisfaction of each interest entity within the multi-energy complementary system with the improved Shapley value distribution model is more concentrated, and the distribution effect is optimal.
Regarding the problem of revenue distribution within a system involving multiple power generation participants, Shapley L.S. proposed the Shapley value method [30], where the revenue obtained by member i within the system is equal to the average of the marginal benefits created by all the power generation alliances that the member may participate in. Eq. (19) represents the probability of cooperative member i forming the multi-energy complementary system s, and Eq. (20) represents the revenue value of the cooperative participant i within the system.
In the formula, m represents the total number of power generation entities within the multi-energy complementary system; ns represents the number of participants in system s; v(s) represents the revenue of a multi-energy complementary system of size s including member i, and v(s/i) represents the revenue of a multi-energy complementary system of size (s − 1) excluding member i.
The Shapley value allocation model satisfies the assumption that all cooperative partners in the multi-energy complementary system are rational players, meaning that all participants in the system satisfy both individual rationality and collective rationality. The constraint conditions can be expressed as:
4.2 Nucleolus Allocation Model
For the problem of solving the allocation strategy for the players in the multi-energy complementary system, Schmeidler proposed the nucleolus theory [31], which requires that each allocation scheme has one and only one nucleolus, denoted as Nu(γ). This nucleolus is the minimum of the maximum dissatisfaction distribution within the allocation set. The formula can be expressed as:
In the formula, X = {x1, x2, ..., xi} represents the profit share of each power generation entity in the multi-energy complementary system;
Rewrite Eq. (23) into linear programming form:
In the formula, ε refers to e(s,
4.3 Improved Shapley Value Method
The traditional Shapley value allocation model assumes that all members within the system share the risk equally. However, in the multi-energy complementary system discussed in this paper, the three parties—wind, solar, and thermal power plants-have different construction costs and operating and maintenance expenses, leading to significant differences in their respective operational risks. To address this, the paper proposes introducing a risk factor to improve the traditional Shapley value allocation model.
4.3.1 Determine Weights Using Entropy Method
The traditional Shapley value method assumes that the risk borne by each player in the system is 1/m, where m is the number of players. This section comprehensively considers factors such as the initial investment cost, average annual operating and maintenance expenses, and net residual value of each stakeholder. Based on the principle that higher risk should be compensated with higher returns, the paper proposes establishing a risk factor to compensate the stakeholders with higher risk and lower power generation in the system.
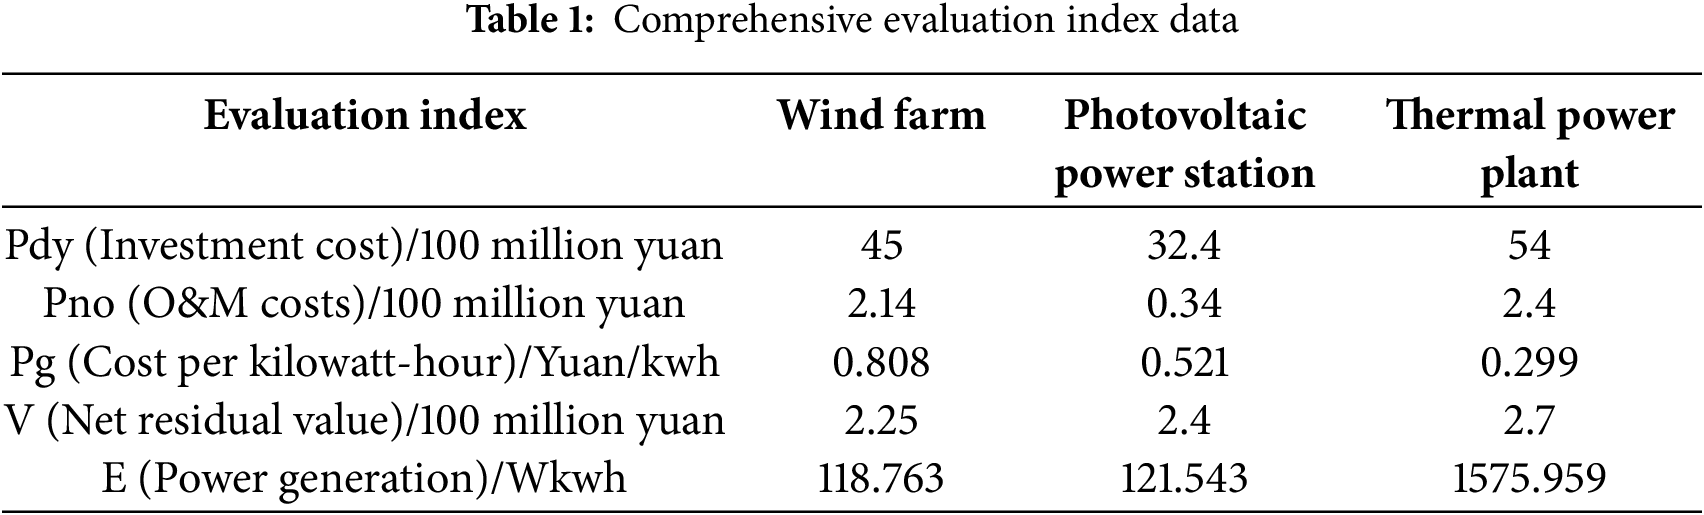
Select evaluation indicators as shown in Table 1. It is stipulated that the size of the indicators is positively correlated with the risk value. Large-type indicators are selected as follows: initial investment cost, annual operation and maintenance cost, cost per kilowatt-hour; small-type indicators are selected as follows: net residual value of the power plant, electricity generation in typical scenarios.
Based on the selected J risk indicators, an initial indicator matrix is established for M stakeholders within the multi-energy complementary system:
In the formula,
Normalize the positive-converted matrix:
The objective entropy weight value for the j-th indicator is calculated as follows:
In the formula,
To determine the membership relationship between wind, light, fire, and various indicators within the multi-energy complementary system, a membership function is introduced to quantitatively judge the correlation between the two. A trapezoidal distribution is selected to construct the membership function, and the factor evaluation matrix R is determined. The construction methods for the membership functions corresponding to small-type indicators and large-type indicators are different, respectively represented by Eqs. (31) and (32):
In the formula, a and b represent the minimum and maximum values of the indicator, respectively. The comprehensive risk evaluation matrix σ for each power generation entity within the multi-energy complementary system is σ = A × W.
4.3.2 Improved Shapley Value Allocation Model
By incorporating the Entropy Weight Method to comprehensively quantify the risks undertaken by multiple stakeholders within the multi-energy complementary system, each participant gains additional cooperative benefits from the integrated collaboration. Based on the risk factors, a secondary distribution of these cooperative gains is made, with the specific allocation results
In the formula,
To intuitively reflect the feasibility of the improved Shapley value distribution model proposed in this paper, the MDP (Markov Decision Process) indicator is used to quantitatively compare this method with other common distribution models such as the nucleolus method and the equal sharing method. The specific meaning of this evaluation indicator is the ratio of the average economic loss brought to other partners within the multi-energy complementary system after a certain interest entity rejects a cooperation request, to its own revenue loss in the case of not participating in cooperation. If the entity’s own loss is greater, it is more inclined to accept the cooperation invitation; otherwise, it will refuse to participate in the cooperation offer. The MDP evaluation method is expressed in inequality language as follows:
In the formula, xj represents the revenue allocated to other participants in system s excluding subject i. v(S/i) indicates the revenue value of system s based on typical scenarios when subject i exits the system.
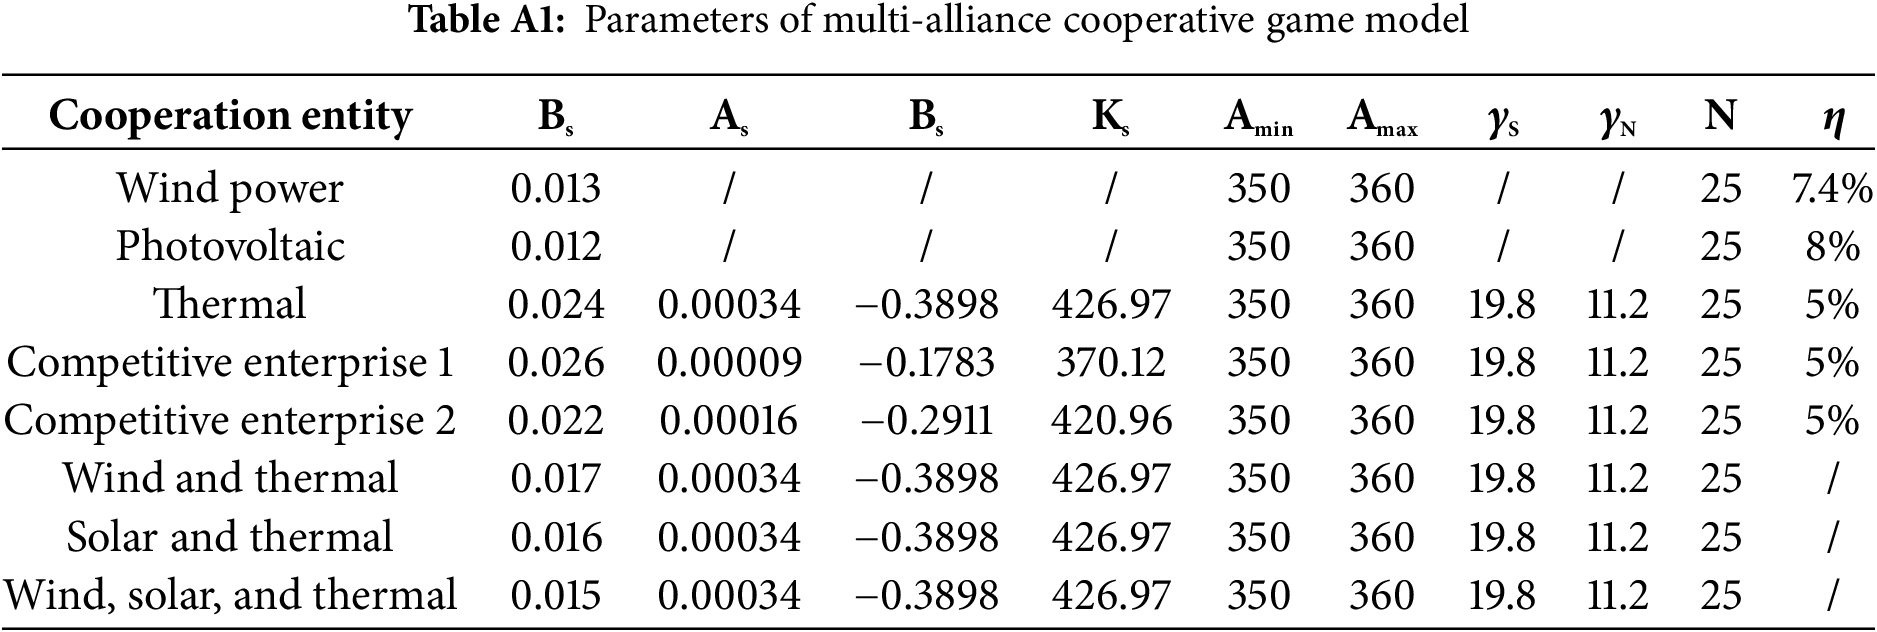
This paper takes a wind-photovoltaic-thermal multi-energy complementary system planned in a certain area of Liaoning Province as an example. It selects the actual annual power generation data of two 600 MW thermal power units, 300 MW offshore wind power, and 400 MW photovoltaic power station for analysis. The three power plants are integrated into a multi-energy complementary system at the same connection point, as shown in Fig. 4. The system has been successfully connected to the grid and operated for 168 h. The system participates in market competition as an independent entity, and the electricity purchase side is set to a direct purchase model for large users. At the same time, two thermal power units with the same rated capacity are selected as competing power generation companies to participate in the market bilateral transactions within typical scenarios together with the multi-energy complementary system. The bidding coefficients and cost parameters of the multi-energy complementary system and other alliance models are shown in Appendix A. The wind power subsidy price in this transaction market environment is set at 475.1 yuan/MWh, the photovoltaic subsidy price is 440.14 yuan/MWh, the transmission and distribution price is 80.7 yuan/MWh, and the new energy deviation assessment fee is 200 yuan/MWh.

Figure 4: Multi-energy complementation system demonstration diagram
5.1 Revenue Analysis under Different Alliance Models
This paper classifies the historical load data of large users and the output data of new energy stations for the entire year. The data for each month is input into the data set to be clustered. After applying the improved K-means algorithm, multiple typical scenarios within the month are obtained. Based on the frequency of occurrence of each scenario, the final cluster centers are weighted to obtain the fitting curve of the typical output scenarios for the month.
As shown in Fig. 5, taking the data set of January as an example, the historical load data of large users is clustered into 3 groups, and the optimal number of clustering scenarios for both wind power and photovoltaic power stations is 2. The scenarios of light wind and clear sky appear most frequently and account for a larger proportion within the month. Therefore, the overall output value of the new energy stations in January is easily affected by the duration of sunlight, and the thermal power units within the multi-energy complementary system mainly cooperate with the photovoltaic power station to adjust their output in real-time.
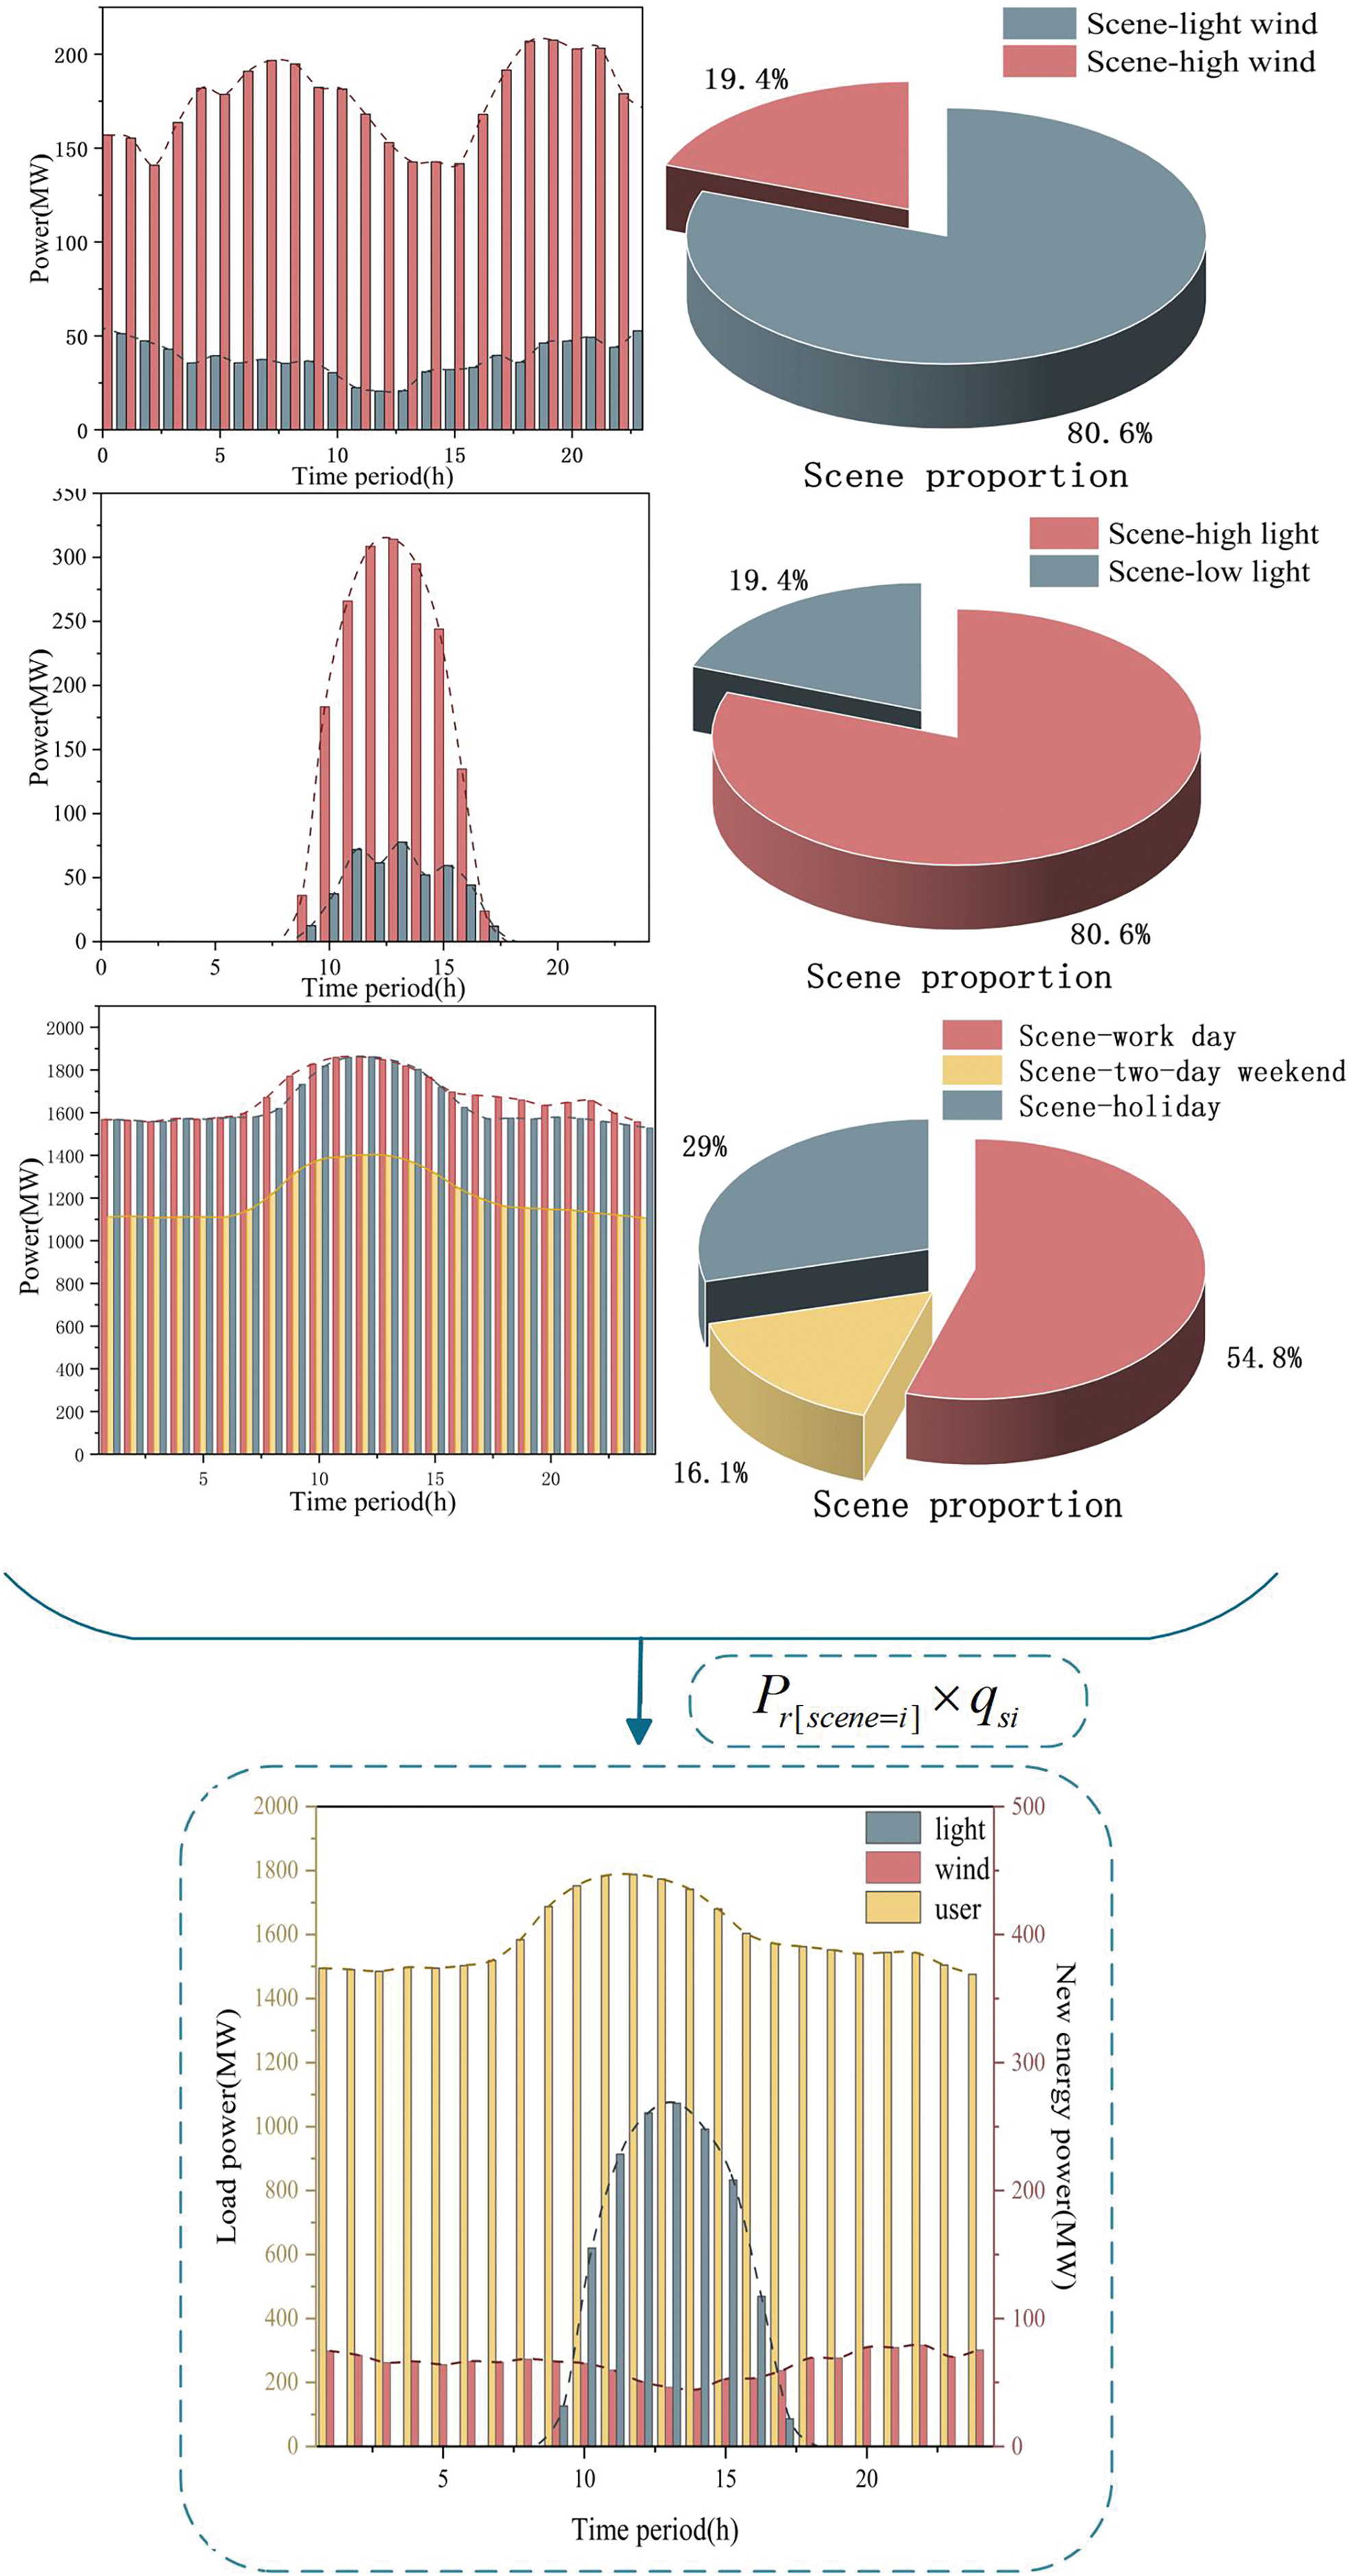
Figure 5: Typical scenario construction in January
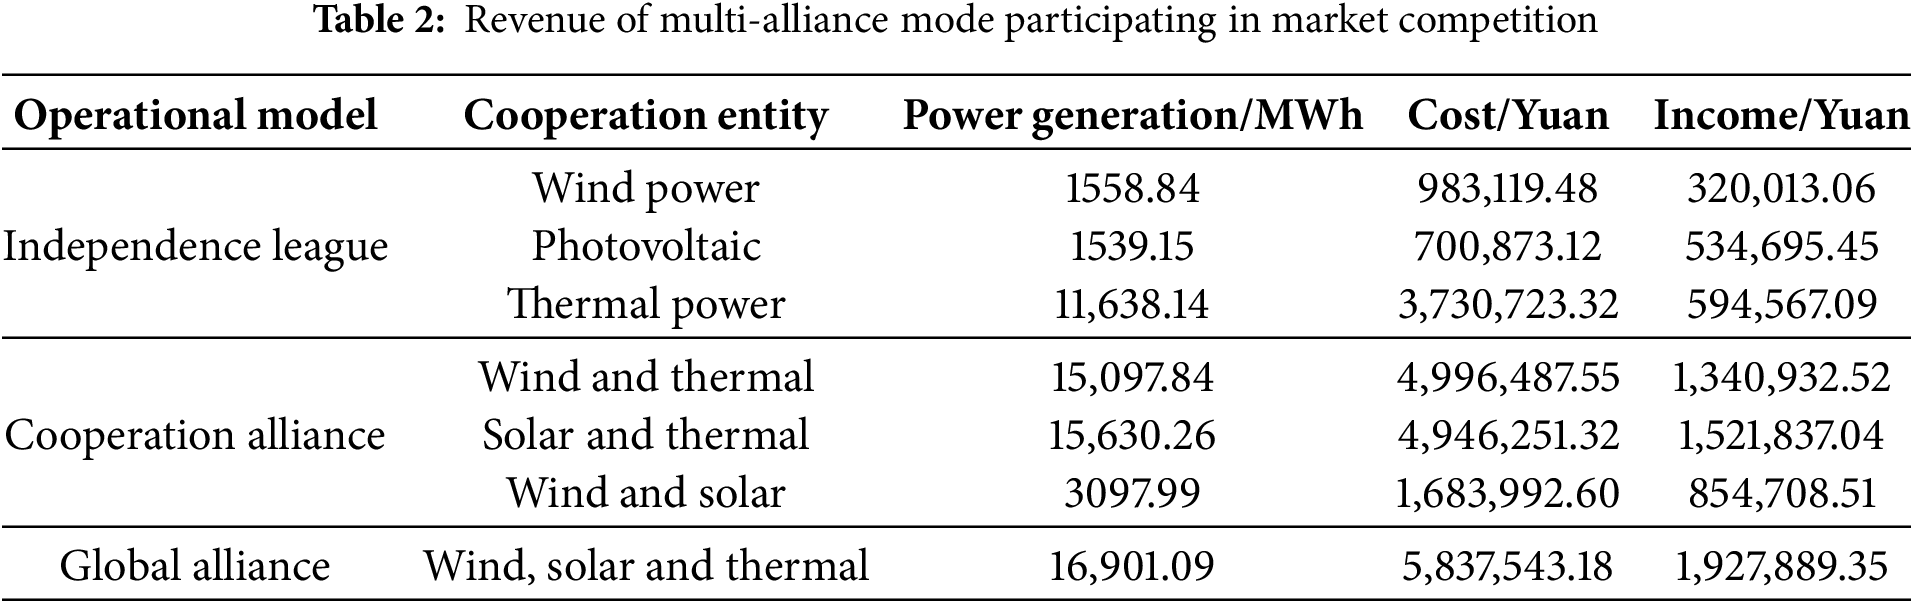
It is assumed that each scenario has 24 trading periods. Since the multi-energy complementary system is a sub-alliance within the power generation alliance, the three stakeholders within the system—wind farm, photovoltaic power station, and thermal power plant—can form seven cooperation modes, as shown in Table 2. Different alliances can set a unified price to participate in market competition. Regardless of the alliance model, the annual revenue can be calculated using a two-layer game model. The revenue of each alliance under cooperative and non-cooperative modes in typical scenarios is shown in the following table.
Integrating the new energy output data and the historical load demand data of large users for 12 months, 12 typical trading scenarios for the whole year are constructed. The contracted electricity and revenue obtained by the multi-energy complementary system participating in the market game throughout the year are shown in Fig. 6.
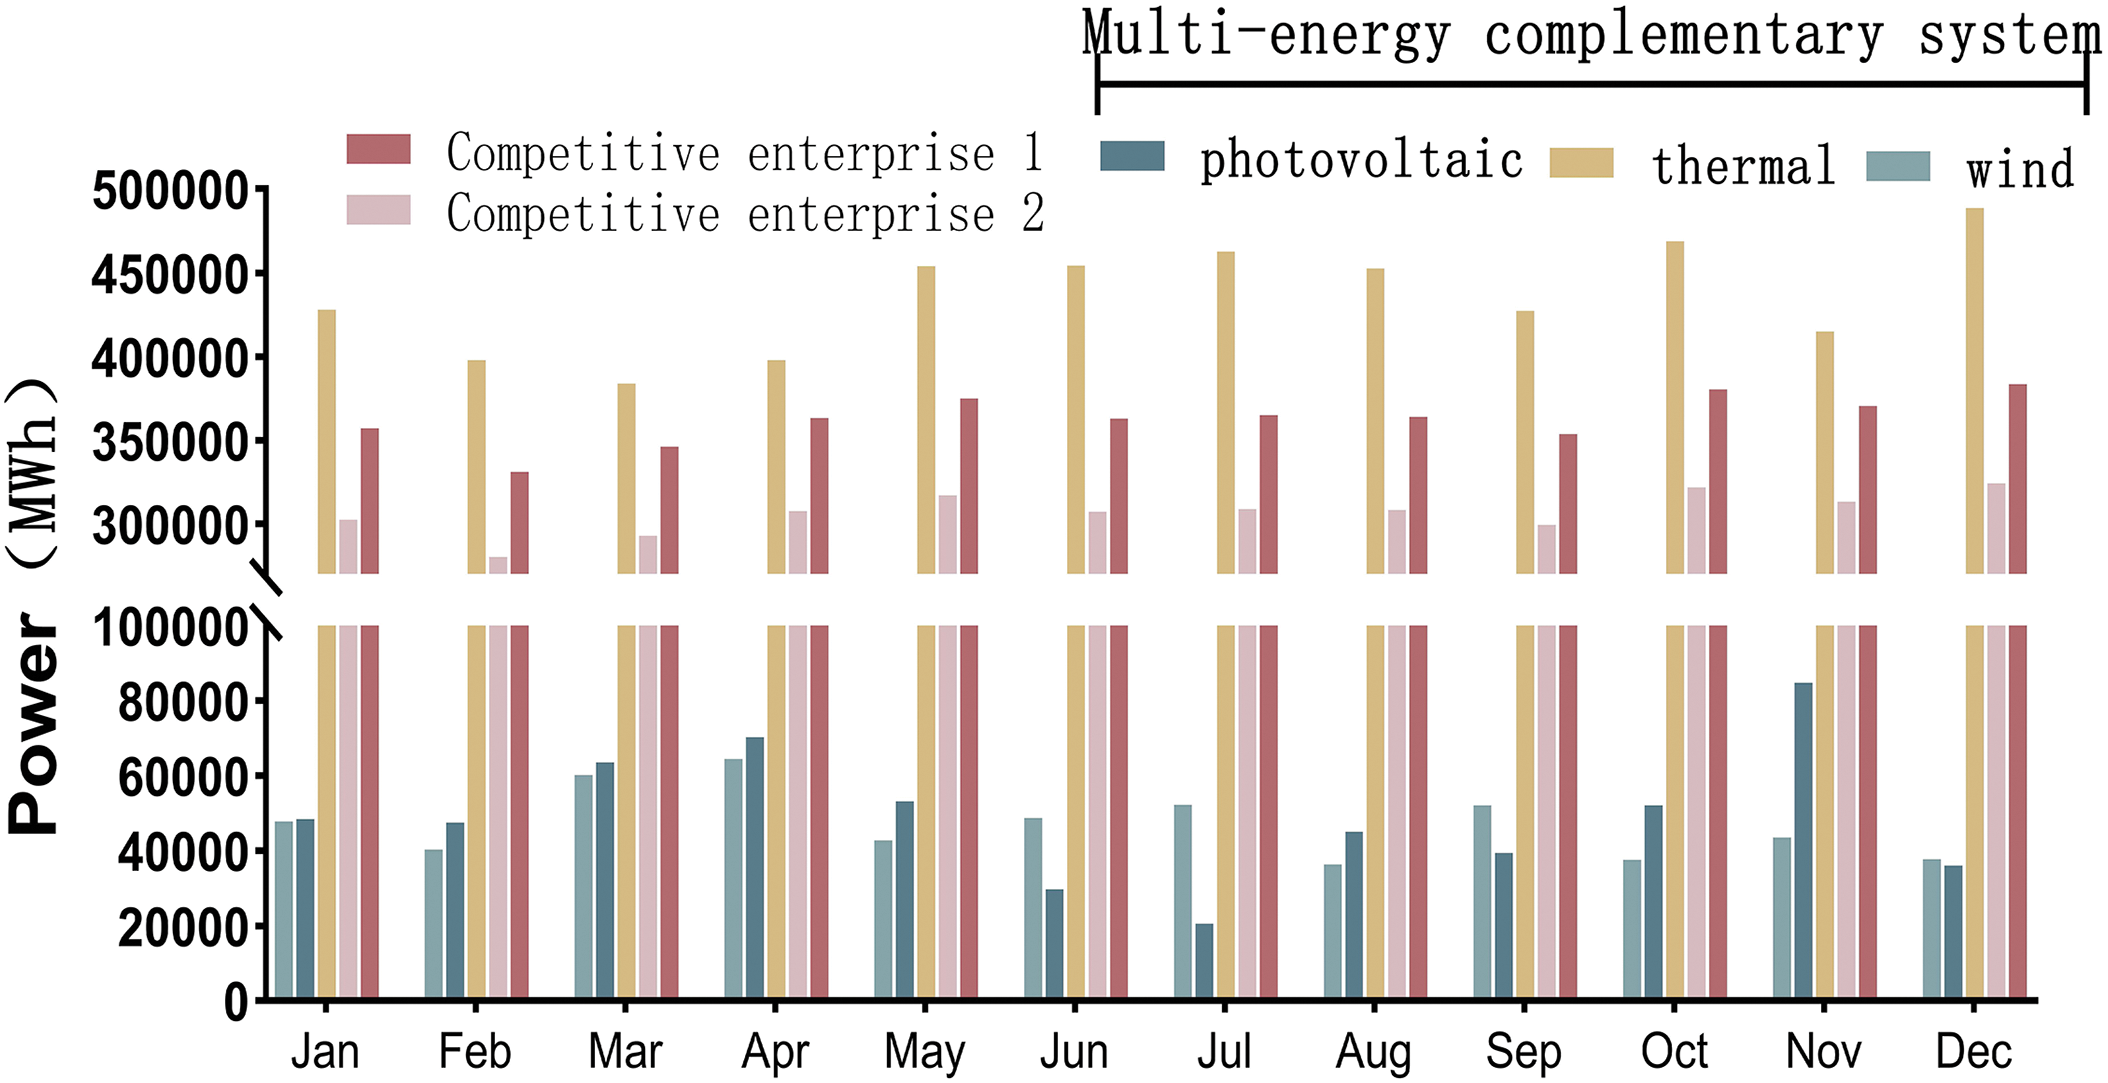
Figure 6: Multi-alliance mode annual contract electricity
From Table 2 and Fig. 6, it can be seen that as a cooperative operation model, the multi-energy complementary system has low marginal costs for its internal wind farm and photovoltaic power station. By cooperating with the thermal power plant, the three stakeholders can make a unified offer externally, effectively reducing the unit power generation cost of the thermal power plant. This allows the thermal power units within the multi-energy complementary system to secure more contracted electricity in the bilateral market game, resulting in a 42.012% and 20.164% increase in annual power generation compared to the other two competing power generation companies in the market.
For the typical trading scenarios, the wind farm and photovoltaic power station are subject to assessment electricity amounts of 115.597 and 336.366 MWh, respectively, resulting in a total cost of 90,392.6 yuan. Under the multi-energy complementary system model formed with the thermal power plant, this assessment cost can be disregarded, and the system as a whole achieves full local consumption of new energy. For the aforementioned reasons, the revenue situation of the multi-energy complementary system under the global alliance is better than the other cooperation models.
5.2 The Revenue Distribution Results of the Improved Shapley Value Method Are as Follows
First, the risk assessment indicators are selected as shown in Table 1. By combining the entropy weight method discussed in Part III, the risk factor weights for multiple entities within the multi-energy complementary system are calculated, yielding the risk values undertaken by wind, photovoltaic, and thermal power as 0.545, 0.34, and 0.115, respectively. Then, using the improved Shapley value distribution model and the nucleolus method distribution model as shown in Eqs. (23)–(33), and in conjunction with the data in Table 2, the revenue obtained by multiple entities within the system is solved sequentially, as shown in Table 3, with units in ten thousand yuan.
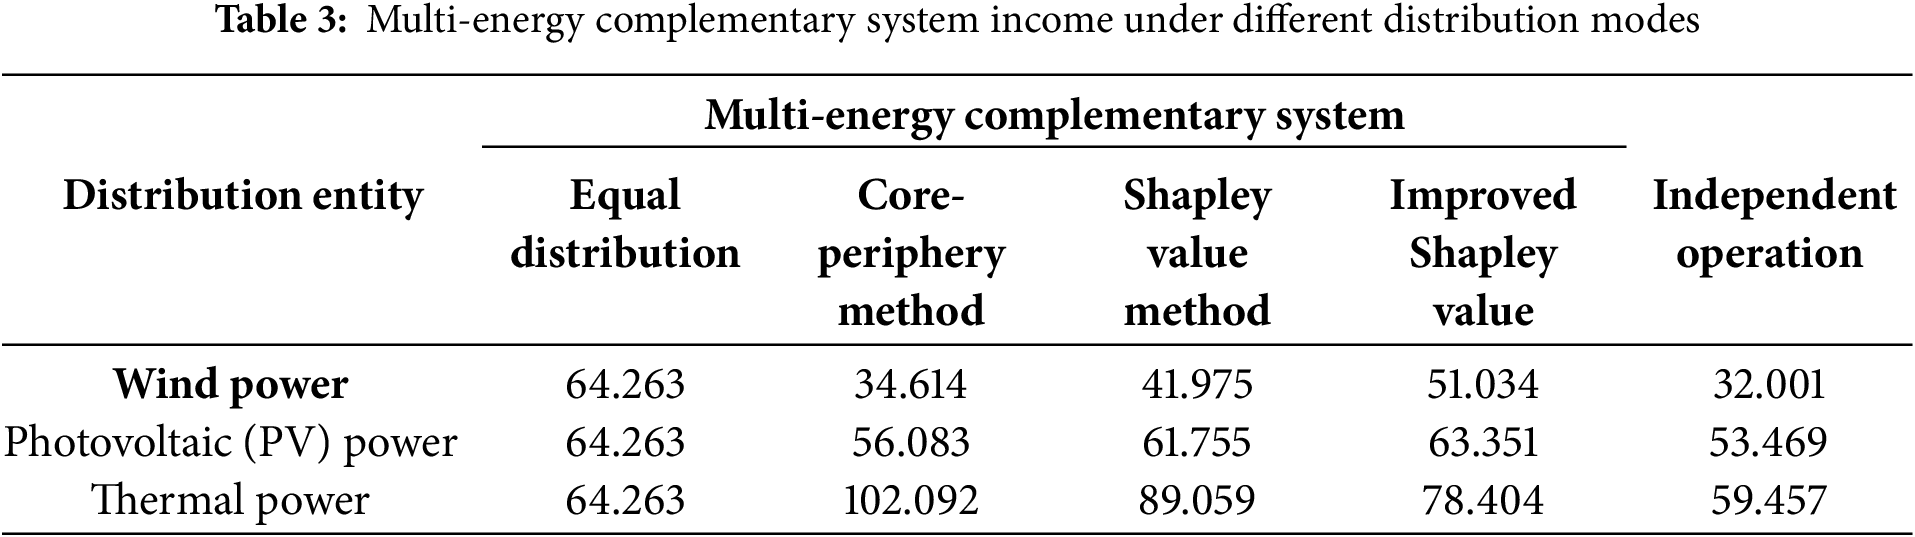
Table 3 shows that under four different distribution models, compared to participating in market competition independently, the benefits of wind, photovoltaic, and thermal power are all improved to some extent after forming a multi-energy complementary system and then distributing the benefits. The total benefits of the alliance under the multi-energy complementary system model are the greatest. At this time, each stakeholder under different distribution models conforms to individual rationality and collective rationality.
5.3 MDP Indicator Verification
To verify the superiority of the improved Shapley value distribution method proposed in this paper, the MDP indicator is used to quantitatively compare it with other distribution models such as the nucleolus method, and to analyze whether each participant within the multi-energy complementary system is willing to accept the cooperation offer.
By combining Eq. (34) and the data in Table 3, the preferences of the wind-photovoltaic-thermal power trio within the system for different distribution strategies can be obtained. The calculation results are shown in Fig. 7, where the boundary condition of the inequality is set to 1, that is, a unit straight line with a slope of 1 is used to divide the strategy preference graph into rejection and cooperation areas.

Figure 7: The satisfaction distribution of each subject under MDP index evaluation
As shown in Fig. 7, the wind farm under the nucleolus method and the equal sharing model does not satisfy Eq. (34) and is in the non-cooperation area. This indicates that the incremental revenue obtained by this power generation entity after participating in the cooperation is too small, while other power generation entities within the system see a significant increase in average revenue due to the inclusion of the wind farm. As a result, the wind farm refuses to join the multi-energy complementary system and shows aversion to both the equal sharing model and the nucleolus method.
For the other two distribution models, the MDP indicator for the wind farm under the traditional Shapley value distribution is as high as 14.57, while the corresponding indicators for the other entities within the system are only 5.3 and 4.2. These three sets of data indicate that the stakeholders’ strategy preferences under this distribution model are not concentrated, violating the “three fairness principles.” In contrast, for the improved Shapley value distribution model, the corresponding indicator parameters for the wind farm, photovoltaic power station, and thermal power plant are 3.8, 4.5, and 1.2, respectively. The distribution of indicators is relatively concentrated, which can satisfy the fairness between the stakeholders.
In summary, the improved Shapley value distribution model is more practical, and it has a certain appeal to all three stakeholders within the multi-energy complementary system, making the system as a whole more stable. Combining Fig. 6, which shows the annual contracted electricity of the multi-energy complementary system, and the improved Shapley value distribution model, the annual revenue distribution of the multi-energy complementary system can be obtained. The annual revenue distribution amounts for the wind farm, photovoltaic power station, and thermal power plant are 20,803.4799, 23,031.9716, and 31,161.1157, respectively, in units of ten thousand yuan.
This paper proposes a revenue accounting model for multi-energy complementary systems participating in annual bilateral market transactions and, based on the traditional Shapley value method combined with risk factors, proposes a strategy for the redistribution of risk and revenue within the system among multiple stakeholders. Simulation verification is conducted using actual examples, and the conclusions are as follows:
(1) In the multi-energy complementary system, each power generation entity is adjusted by internal resources, and the entire system increases the income value by 33.99%. Among them, the thermal power units are adjusted on an hourly basis to accommodate the fluctuations in new energy output, thereby significantly enhancing new energy consumption. Under the multi-energy complementary system, new energy producers within the system can save approximately 90,392.6 yuan per month in assessed costs, effectively mitigating the deviation assessment costs for new energy producers.
(2) Based on the principle of marginal benefit, while the traditional Shapley value method can achieve a relatively equitable distribution of income within the multi-energy complementary system, it overlooks risk factors inherent in practical operations. This oversight leads to an imbalanced distribution of benefits within the system.
(3) Based on the entropy weight method to comprehensively assess the risk indicators of multiple entities within the system, combined with the improved Shapley value distribution model, the cooperative gains of the multi-energy complementary system are redistributed according to individual contribution and risk coefficients. The MDP index verification shows that, compared with the nucleolar method and equal-sharing method, the satisfaction index of all participants in the system is concentrated around 3.0 by using the improved Shapley value distribution model, and the internal cooperation of the system is the most stable.
It is important to note that the clearing mechanism discussed in this paper primarily addresses the bilateral transaction model within the medium to long-term power market. However, it should be acknowledged that the actual power market encompasses additional components such as the spot market and auxiliary service markets. Furthermore, the enhanced Shapley value distribution model introduced in this study focuses on a wind-solar-thermal multi-energy complementary system. In future work, we plan to extend this model to large-scale cooperative power generation systems with a greater number of participants, taking into account regional energy distribution. This extension will provide distribution models tailored to various trading mechanisms, thereby supporting the development of a new power system.
Acknowledgement: The authors would like to express special thanks to State Grid Liaoning Electric Power Co., Ltd. and Dalian Zhuanghe Electric Power Co., Ltd. for providing data support.
Funding Statement: The authors received no specific funding for this study.
Author Contributions: The authors confirm their contributions to the paper as follows: Research conception and design: Dongfeng Yang; Ruirui Zhang; Chuang Liu; Guoliang Bian; Data collection: Dongfeng Yang; Ruirui Zhang; Chuang Liu; Guoliang Bian; Results analysis and interpretation: Dongfeng Yang; Ruirui Zhang; Chuang Liu; Guoliang Bian; Draft manuscript preparation: Dongfeng Yang; Ruirui Zhang; Chuang Liu; Guoliang Bian. All authors reviewed the results and approved the final version of the manuscript.
Availability of Data and Materials: The authors confirm that the data supporting the findings of this study are available within the article.
Ethics Approval: Not applicable.
Conflicts of Interest: The authors declare no conflicts of interest to report regarding the present study.
References
1. National Energy Administration. 2022 national renewable energy power development monitoring and evaluation report. Beijing, China: National Energy Administration; 2023. [Google Scholar]
2. Wang X, Zhang ZY, Zhang SH, Zhang SQ. Power market game analysis considering the lease of shared storage by new energy generators. Power Grid Technol. 2024;48(8):3269–77. doi:10.13335/j.1000-3673.pst.2024.0181. [Google Scholar] [CrossRef]
3. Wang HL, Sun WQ, Sang BY. Spot market bidding strategy of New energy + Storage power station considering conditional value-at-risk. Power Grid Technol. 2023;47(9):3620–31. doi:10.13335/j.1000-3673.pst.2022.1135. [Google Scholar] [CrossRef]
4. Li H, Wei J, Lv Y. Day-ahead market quotation strategy considering bilateral transactions of energy storage and new energy. Power Grid Technol. 2022;46(12):4843–53. [Google Scholar]
5. Tang RM. Promoting integration of charge and storage of power source and network and multi-energy complementarity—policy interpretation of the guiding opinions of the national development and reform commission and the national energy administration on promoting integration of charge and storage of power source and network and multi-energy complementarity-complementary development. China Econ Trade Guide. 2021;8:10–1. [Google Scholar]
6. Ma SY, Li JC, Duan C, Wu J, Xu T, Chen HF, et al. Combined optimization of wind-light-pumped storage based on power market background. Smart Electr Power. 2019;47(8):43–9. [Google Scholar]
7. Yang JY, Peng L, Luo LF, Yang TG. Tracking plan output control strategy of wind storage system taking into account wind power consumption. Electr Power Constr. 2023;44(9):160–70. [Google Scholar]
8. Ma TS, Wang Y, Lv K, Shi XP, Xu PJ, Zhang JY, et al. Research Progress of flexible transformation technology of coupled energy storage for thermal power units under dual-carbon target. Proc CSEE. 2022;42(S1):136–48. [Google Scholar]
9. Chen YH, Li ZQ, Jiang ZQ, Chen XL. Research on flexible modification technology of thermal power unit based on electric boiler. J Therm Energy Power Eng. 2020;35(1):261–6. [Google Scholar]
10. Lu YZ. Research on flexible transformation technology of coal power units under new situation. Boil Technol. 2022;53(6):72–6,80. [Google Scholar]
11. Xu H, Li HQ. Flexible transformation planning and operation comprehensive stochastic optimization model for thermal power units. Power Grid Technol. 2020;44(12):4626–38. [Google Scholar]
12. Qi CJ, Che B, Yang Y, Chen BS. A master-slave game robust pricing method for shared energy storage considering new energy consumption and energy storage participation in frequency modulation. China Electr Power. 2023;56(8):26–39. [Google Scholar]
13. Li CX, Yan H, Zhang H, Guo PC. Day-ahead optimization scheduling of wind-light-fire-pumping and storage combined system with cascade carbon trading. J Hydraul Eng. 2023;54(10):1163–76. [Google Scholar]
14. Huang S, Liu WX, Chang Y, Liu ZQ. Wind-fire bundling strategy for large user direct purchase based on game theory. Mod Electr Power. 2020;37(2):212–20. [Google Scholar]
15. Li JJ, Liu XS, Zhou GW, Yan PG, Liu JF, Yu DR. Thermal performance analysis of multi-operation mode of triple power supply system based on fire-storage combined cycle. Proc CSEE. 2024;44(9):3598–609. [Google Scholar]
16. Hao L, Chen L, Huang YH, Xu F, Xu DR, Chen Q, et al. Challenges and prospects of primary frequency modulation for coal-fired thermal power units in new power systems. Autom Power Syst. 2024;48(8):14–29. [Google Scholar]
17. Han LY, Morstyn T, McCulloch M. Incentivizing prosumer coalitions with energy management using cooperative game theory. IEEE Trans Power Syst. 2018;34(1):303–13. doi:10.1109/TPWRS.2018.2858540. [Google Scholar] [CrossRef]
18. Feng C, Wen F, You S, Li Z, Shahnia F, Shahidehpour M. Coalitional game-based transactive energy management in local energy communities. IEEE Trans Power Syst. 2020;35(3):1729–40. doi:10.1109/TPWRS.2019.2957537. [Google Scholar] [CrossRef]
19. Cui Y, Zhou XQ, Liu W, Ji DS. Multi-energy alliance market strategy based on dynamic revenue optimization of system auxiliary services. Acta Sol Energy Sin. 2021;42(2):370–5. [Google Scholar]
20. Sun WJ, Gong H, Liu P. Cooperative game theory-based coordinated scheduling of two-machine flow-shop and transportation. J Syst Sci Complex. 2023;36(6):2415–33. doi:10.1007/s11424-023-2491-3. [Google Scholar] [CrossRef]
21. Ke JC, Meng YP. Logistics network design of multi-party cooperative distribution under time window allocation strategy. Comput Eng Appl. 2024;60(18):324–36. [Google Scholar]
22. Yang XB, Pan YS, De G, Tan ZF. Operation optimization and benefit distribution model of rural park integrated energy system under multi-subject cooperation. Sci Technol Eng. 2023;23(9):3758–68. [Google Scholar]
23. Yang YL, Jiao YH, Yan GG, Fan LD, Zhang ZW, Zhang GL, et al. Electric heating load group trading mechanism based on improved Shapley value distribution. Electr Power Constr. 2023;44(4):37–44. doi:10.12204/j.issn.1000-7229.2023.04.005. [Google Scholar] [CrossRef]
24. Ouyang RH, Gong W. Data factor pricing mechanism based on value and market evaluation contribution. Reform. 2022;3:39–54. [Google Scholar]
25. Chang Y, Liu ZQ, Huang S, Liu WX, Wang S. Mixed game coordination planning and benefit distribution method of wind and fire network. Power Grid Technol. 2019;43(11):3899–907. [Google Scholar]
26. Cui Y, Xu Y, Liu XY, Cheng XT, Cheng DR, Zhu H. Method of spot electricity energy market day clearance under carbon trading coupling. Proc CSEE. 2025;45(1):66–79. [Google Scholar]
27. Cheng G, Xu F, Hu B, Hao L, Chen L, Zhou GP, et al. Research on synergistic performance and combination design of integrated coupling of renewable energy and thermal power. Power Grid Technol. 2021;45(6):2178–91. [Google Scholar]
28. Liu YJ, He ZQ, Zhang ZY, Long JP, Zhao QZ, Zhao Y. A method for obtaining characteristic curves of coal-fired units with consideration of energy consumption and environmental protection. Therm Energy Power Eng. 2020;35(6):274–9. [Google Scholar]
29. Liu DN, Tang HM, Yang M, Li QM, Xu L, Zhang SN. Electric power transaction deviation settlement compensation mechanism to promote the consumption of new energy. Autom Electr Power Syst. 2017;41(24):105–11. [Google Scholar]
30. Shan EF, Liu T, Lv WR. New axiomatizations of the solidarity value and its application in the distribution of coalition benefits. Syst Eng Theory Pract. 2023;43(11):3230–45. doi:10.12011/SETP2022-2671. [Google Scholar] [CrossRef]
31. Wu DW, Yu AQ. Profit distribution based on nucleolar theory in large-scale multi-source joint dispatch coordination. Power Grid Technol. 2016;40(10):2975–81. [Google Scholar]
Cite This Article
 Copyright © 2025 The Author(s). Published by Tech Science Press.
This work is licensed under a Creative Commons Attribution 4.0 International License , which permits unrestricted use, distribution, and reproduction in any medium, provided the original work is properly cited.
 Downloads
 Citation Tools