
 Submit a Paper
 Propose a Special lssue
 Open Access
ARTICLE

Effect of Air Bubble Injection on the Performance of a Double Pipe Heat Exchanger
Mechanical Engineering Department, College of Engineering, University of Baghdad, Baghdad, 1417, Iraq[-4pc]
* Corresponding Author: Roasi A. Flayh. Email:
(This article belongs to the Special Issue: Advancements in Energy Resources, Processes, Systems, and Materials-(ICSSD2024))
Energy Engineering 2025, 122(7), 2801-2818. https://doi.org/10.32604/ee.2025.062916
Received 30 December 2024; Accepted 15 May 2025; Issue published 27 June 2025
 View Full Text
 Download PDF
Abstract
Double pipe heat exchangers (DPHEs) are normally utilized in various manufacturing uses owing to their simple design and low maintenance requirements. For that, performance enhancement by improved heat transfer is ongoing. Air injections are a good strategy for enhancing the thermal performance of the DPHE. In the present work, the influence of air bubble injection in a DPHE was experimentally investigated, and the system’s hydrothermal performance improvement parameters were evaluated. Two modes were designed, manufactured, and used to conduct the experiments. The first mode was conducted with no air injection, named a single phase mode, while in the second mode, air was injected into the annulus of DPHE throughout different perforated rings on the side of the annular. Three different ring types were used and coded as R-1, R-2, and R-3, with an added case of insertion of the three rings inside the annulus. The airflow rate was fixed at 1.5 LPM with a 25°C inlet temperature. Also, the hot water rate in the inner pipe was maintained continuously at 3 LPM with a controlled 70°C temperature at the inlet. Five different cold water flow rates, 3, 3.5, 4, 4.5, and 5 LPM, in the annulus, were considered with a controlled inlet temperature at 17°C. Additionally, the effectiveness of the heat exchanger, the number of transfer units (NTU), and the overall heat transfer were predicted and considered for performance evaluation and comparison. The outcomes proved that the injection of air and the bubbly flow creation in the heat exchanger’s hot side is an effective method to strengthen the DPHE performance. Moreover, the total heat transfer coefficient was enhanced by 41% in R-1, 58.8% in R-2, and 40.1% in R-3 at 4 LPM of cold water. The optimal ring, which yielded the most improvement, was R-2, achieving a 65% improvement in NTU, with a maximum enhancement in effectiveness of 56%.Keywords
DPHEs are employed in numerous industries due to their low costs of design and upkeep, low costs of installation, and flexibility; therefore, there is a need to develop the heat exchanger by creating an additional amount of heat transfer. Many methods are utilized for improving the heat transfer into HE, like fins, metal foam [1,2], twisted tape [3], springs, gas injection, and so on. Owing to the increasing demand for further energy, certain investigators concentrated on making active HEs with less cost as well as simpler producers, like [4]. They focused on many passive plans because they were the minimum cost in comparison with the effective plans for improving the friction factor, f, and heat transfer rate (HTR). One of the most prominent approaches utilized for improving the heat transfer in two-phase flow can be implemented by utilizing several techniques, like injecting air from the air compressor and creating small bubbles moving vertically inside the tube. Also, the number, distribution, form, and air bubble size play a significant part in improving heat transfer. Within such context, reference [5] experimentally studied the impact of air injection on the NTUs, their effectiveness, and the HTR in horizontal HE double tubes. The rate of the mass flow of cold water and the temperature were at least 0.083 kg/s and 25°C, correspondingly. In addition, the rate of the mass flow of hot water is in the range of 0.083–0.2495 kg/s at 40°C. The outcomes evinced that the injection of air bubbles augmented the efficiency by about 10% to 40% and the Nusselt Number (Nu) by about 6% to 35%. It has been investigated as one of the promising methods that do not require many complicated systems: injecting air bubbles into moving fluids to increase their turbulence.
A study has been done by [6] on four cases, both with and without injection of air on the tube or shell side. Results indicate a (25%–40%) increase in heat transfer rate, which is enhanced when injecting air bubbles throughout the tube. Adding air bubbles to a vertical pipe has been examined experimentally and numerically by [7], with water flowing through it while being affected by a constant heat flux. The water flow rate was conducted at 10 to 18 LPM. The airflow rate was assessed at four levels of 1.0 to 4 LPM and three heat fluxes equal to 27,264, 36,316, and 45,398 W/m2, which was numerically solved by using ANSYS Fluent (ANSYS.15). Continuity equations, energy, the turbulence model k-ε, and momentum were used to describe the motion of the flow. It was observed that the Nu enhancement for 4 LPM air bubbles and 27,264 W/m2 heat flux equal 33.3% and 23% in the numerical as well as investigational terms, correspondingly. Recently, numerous studies have adopted nanofluids to enhance the DPHE, such as [8,9]. Some others recommended compound enhancement techniques. Al-Kayiem et al. [10] explored the influence of compound 0.1 vol.% TiO2-in-water nanofluid (NF) with several twisted tape inserts (TTIs) upon the hydrodynamic performance of DPHE. Results showed a 110.8% maximum increase in Nu in a tube with quintuple TTIs, with a 25.2% rise in the drop of pressure, and others have used them to improve thermal performance.
From the other side, reference [11] experimentally illustrated the air bubbles injection into a vertical DPHE using a diffuser placed at the bottom of the DPHE. The experimentations were carried out at a constant rate of the hot water flow of 1.5 LPM, with the cold fluid flow rate controlled at 0.25–1.5 LPM and the air flow rate controlled at 2–10 LPM. They noticed that the air bubble injection resulted in a variation in the kind of flow from laminar to turbulent and an increase in temperature differences. The bubble injection can enhance the HTR by about 30%. In other research, reference [12] experimented with the air influence that was injected into a vertical DPHE through a ring tube inserted in the heat exchanger’s annular gap, using perforation diameters, d = 0.3 and 0.8 mm, with perforation numbers of 12, 24, and 36. Also, the fluid in the inner tube was hot water at 40°C with Re = 5500, and the fluid in the outer tube was cold water at 25°C with 5000 < Re < 16,000. As well, the flow of air inside the ring tube was equal to 0.098 kg/s, and the temperature was 26°C, the ring tube dia. was (3 mm), as well as the maximum Nu enhancement was around 57%. An experimental investigation of a DPHE and its thermal behaviour was conducted by [13]. Different injection techniques were looked at, and the DPHE angle was used as a research parameter. Injected air bubbles reduced NTU and dimensionless energy losses from 5.9% to 177.3% and from 2% to 226%, respectively. Furthermore, the overall heat transfer coefficient, U, increased from 10.3% to 149.5%, with the maximum effectiveness value reaching 55.8%.
Sinaga et al. [14] investigated the impact of the air bubbles on the heat transfer properties. Air was injected into the internal tube of a DPHE using a mixed T-junction with the continual use of cold water at 2 LPM. The rate of airflow was in the 1.0–5 LPM, while the hot water had various rates of 3, 4, 5, and 6 LPM of flow. Also, the outcomes evinced a rise in the heat transfer coefficient as well as the NTU of 33% and 38%, respectively. A series of studies have experimented with injecting air inside a helical or shell-and-tube type of HE, such as [15]. They did experiments to find out what happened when sub-millimetre bubbles of air were injected into a vertical shell with a coiled tube, HE inside a spiral tube. Hot water temperature and rate of flow were set at 0.06249 kg/s and 40°C. The cold water temperature was maintained at 12°C. The rate of flow was in the range of 0.00831 to 0.2495 kg/s. Air injection occurred in four distinct instances: case (d) can be improved in NTU more compared with pure water without air injection, with a rise of 1.23–2.59 times in the energy losses, 1.5–4.2 times in the NTU, and at last 1.36–2.44 times in the effectiveness. Experiments were performed by [16] to explore how active techniques, such as air injection in the side of the shell of different positions of U-shaped DPHEs as well as the inverse U, affected effectiveness by 26%, NTU by 39%, and U by 39%. Experimental investigations were performed by [17] to evaluate the augmentation of HE by air injection into a coiled tube of HE. The flow of cold and hot water and the flow of air were variants at 1–2 LPM, 2–10 LPM, and 0–10 LPM, respectively. The outcomes manifested that injection of air bubbles could improve the effectiveness and the NTU by 0.83 and 1.93, respectively.
Another arrangement of helical coil HEs was studied via [18] into the range 9000 < Re < 50,000 of hot water Reynolds Number (Re) inside the coils, and the rate of cold water flow was kept at 0.0331 kg/s; the air was injected into the hot water within the range of 1.5–3.5 LPM. It was found that air injection caused an enhancement in the Nu of 64% to 126%, and the NTU increased from 66% to 75%. Talib et al. [19] experimentally clarified the influence of air bubble injection through the shell, tube, as well as horizontal HE shell. The flow rate of the cold water was reserved and fixed at 4 LPM, and the flow rate of the hot water changed along the experiments at 50°C. The airflow rate was equal to 0.06 kg/s flow rates, and enhancement with and without air injection was 2.41% and 25.5%, respectively. Also, the HTR enhanced in the shell was 4.45%, that is, 8.42%, and in the shell and tube, it is 13.63%.
The present work investigated experimentally optimized heat transfer performance by injecting sub-millimetre bubbles of air in a DPHE. Previous studies did not focus on the importance of studying the location of bubbles relative to the HE surface. The current study relied on using three rings to inject air bubbles into the annulus. Each ring was used separately, and then the three rings were run together. Each ring has a different number of holes and different dimensions regarding its distance from the heat transfer surface. In addition, the present work explores the way the thermal performance of DPHE is influenced by varying the rates of the flow of air, the rates of annulus side flow, and the location of bubbles. The effect of air injection was studied by measuring the cold-water outlet temperature after air injection and then theoretically measuring thermal characteristics.
The experimental schematic diagram is displayed in Fig. 1.
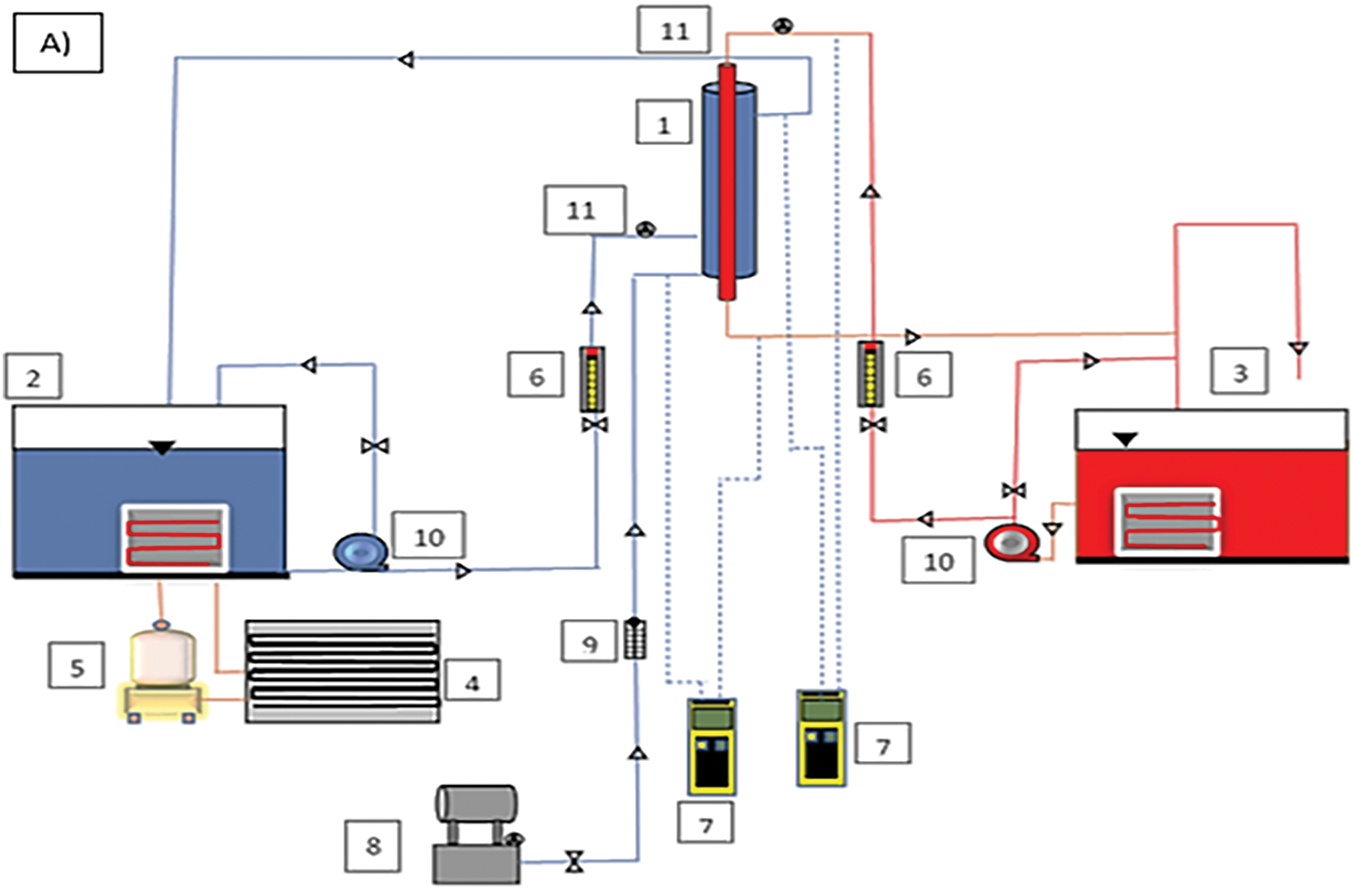
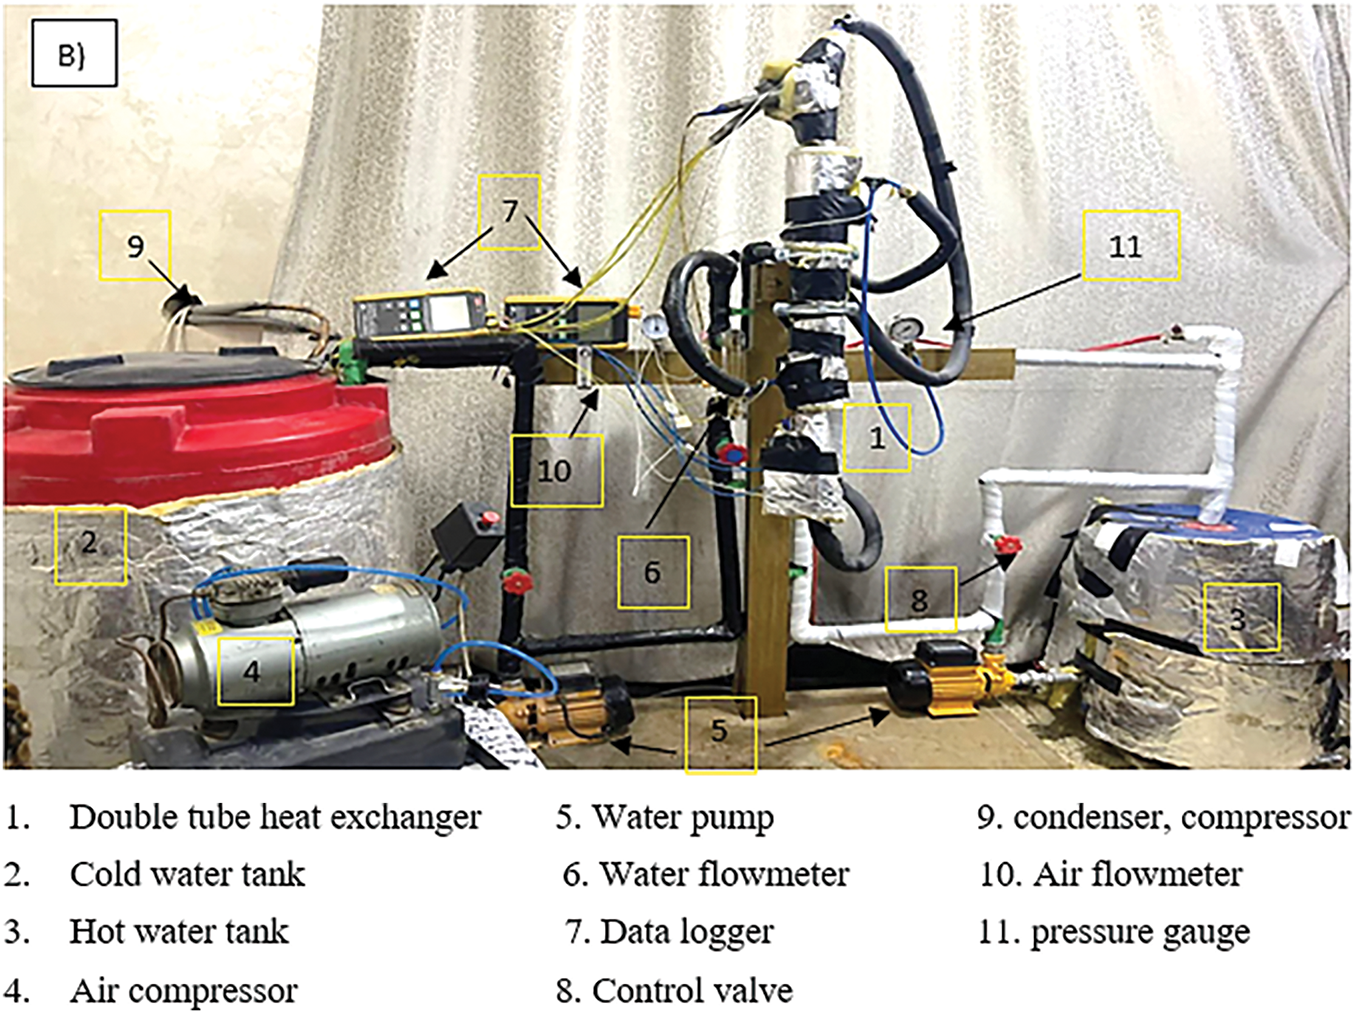
Figure 1: The experimental setup. (A) Schematic diagram and (B) general view
As previously mentioned, the quantities of cold water change throughout the exchange process as 3, 3.5, 4, 4.5, and 5 LPM with a constant quantity of hot water of 3 LPM at a fixed temperature of 70°C, as well as a rate of 1.5 LPM of airflow. The experimental method flow chart is shown in Fig. 2. This shows the stage of cold-water transfer since it is pumped and then enters the flow meter to determine the amount of water required to enter the test section, the occurrence of heat exchange, and then return to the cold water unit. The same applies to hot water. Air is pumped through the air compressor to the air flowmeter and pushed to the rings to make bubbles through the cold water pipe.
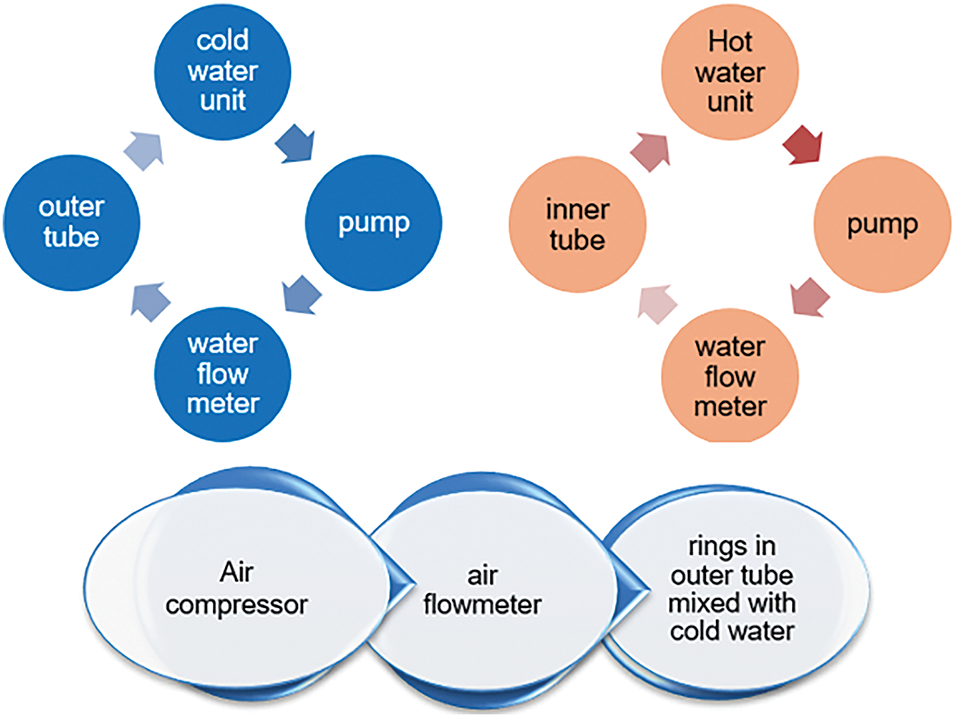
Figure 2: Flowchart of the experimental method
Two double-tube heat exchangers have three main parts: An outside tube is produced from Perspex, an internal tube is produced from copper material with a high thermal conductivity of 387.6 W/m · K, and a third part is an air injection ring. Table 1 lists the specifications for the test section.

The cold water was pushed inside the outer tube, as well as the hot water flowing through the inner tube. The internal tube functioned as a conductivity barrier. Hot and cold water were introduced into the tube was configured in the system flow as counterflow, and the hot water entered the copper tube from the top, and cold water entered the outside tube from the bottom, as shown in Fig. 3. Heat transfer occurs on the copper tube surface. Cold water and air bubbles were moving in a parallel flow from the bottom to the HE top. Also, a thermocouple set was installed along the inner tube surface, as well as fixed using heat-conductive adhesive waterproof tape to get more accurate readings.
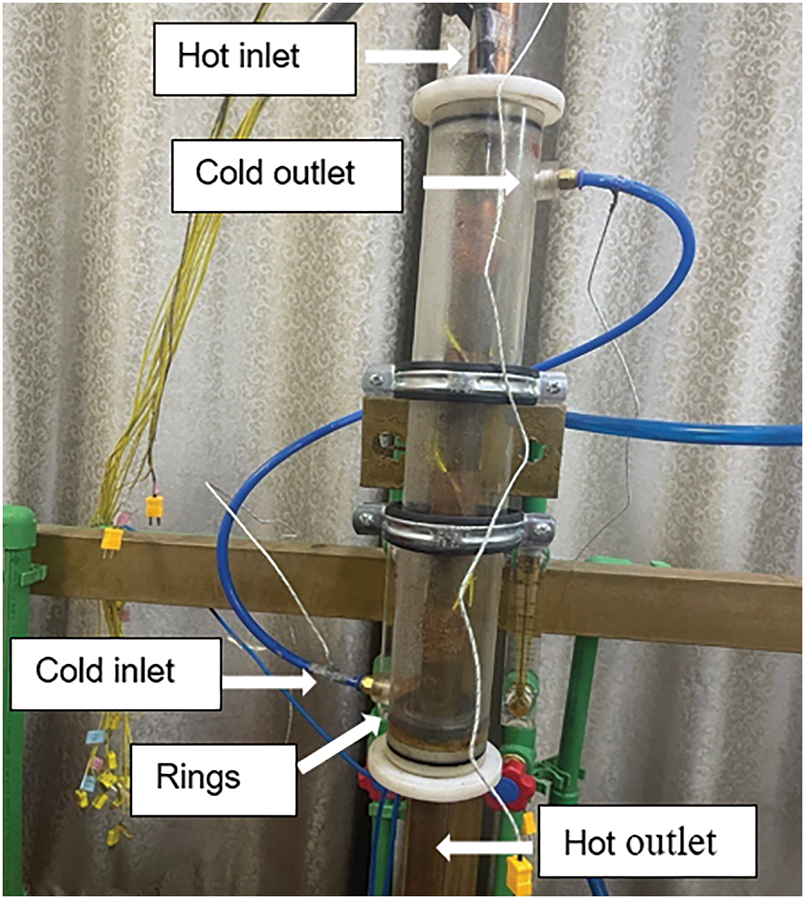
Figure 3: Schematic showing ring position and flow direction
A mechanism for creating bubbles consists of a compressor employed to inject air into cold water by utilizing three rings positioned at the base of the annular space to produce bubbles. Each ring contains several holes having a 0.3 mm diameter. The number and location of such holes are detailed in Table 2. Air was injected through three different configurations of rings, as depicted in Fig. 4. In the first case, air was injected into the first ring, R-1, which was adjacent to the wall of the outer tube, which has 36 holes. In the second case, the air was injected through R-2, which contains 24 holes, and in the third case, R-3, the air was injected through the ring adjacent to the internal tube’s heat transfer surface, which contains 12 holes. The last case, R-4, is represented by injecting air into the three rings together at the same time.

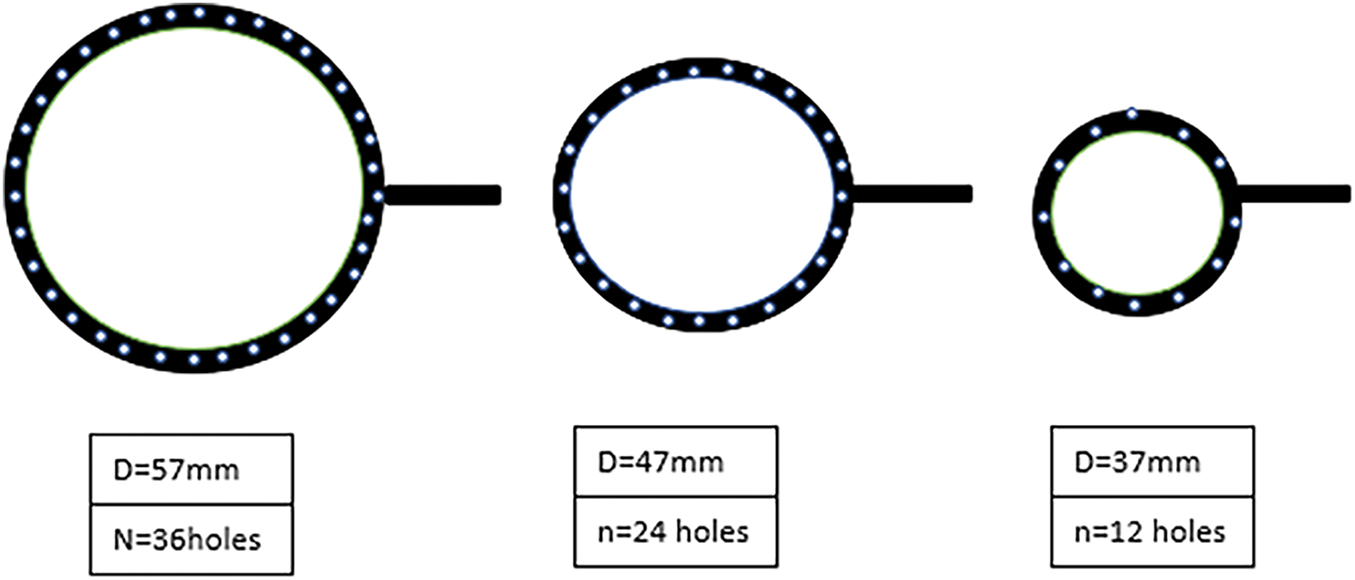
Figure 4: Outlines of the ring, from the left to the right: (R-1), (R-2), and (R-3)
2.2 Heating and Cooling Systems
These systems are used to provide hot water to the heat exchanger internal tube, comprising a tank for hot water of 60 L capacity, an electric heater immersed in the water for more temperature control, and a range of hot water at 70°C using the thermostat used for this purpose. The cooling system is a closed circuit consisting of the following parts: a tank for cold water with a storage capacity of 250 L, and some parts such as the condenser, expansion valve, and compressor. The external unit of the air conditioner has all three parts, so it was used as one part and has the same purpose. The evaporator, which is made of 19 mm, is a spiral copper tube immersed in the cold-water tank. Two electrical pumps were used, one for pushing hot water to the inner tube and the other for pushing the cold water through the annulus of the DPHE. The specifications were the same for the two pumps: voltage of 220 V, a maximum head of 30 m, rated power of 370 W, and a maximum discharge of 30 LPM.
2.3 Measurement and Instruments Tools
The cold and hot water temperature was measured utilizing 20 thermocouples (Type K). Four thermocouples were for each cold and hot water inlet and outlet; the other 16 thermocouples were distributed as loops A, B, C, and D along the copper tube of the heat exchanger. Every loop has four thermocouples, and the distance between one loop and the other is 100 mm. All these thermocouples are connected to two data loggers of the Lutron BTM-4208SD model, as outlined in Fig. 5. Also, two flow meters were utilized for controlling the cold and hot water rate in the experimental process (ZYIA-LZM), ranging between 2 and 18 LPM with accuracy 4, and one was employed for controlling the air volumetric flow rate (MATHESON SLPM-U310), ranging from 0.5 to 6 LPM. Pressure drop through the heat exchanger was measured by using two pressure gauges: the first gauge was set at the cold water in the inlet pipe, and the second gauge was an oily gauge to avoid the effect of bubbles on the water leaving the exchanger, set at the outlet of the cold-water tube. The measuring range of the gauge was 0–1 bar with an accuracy of ±2%.
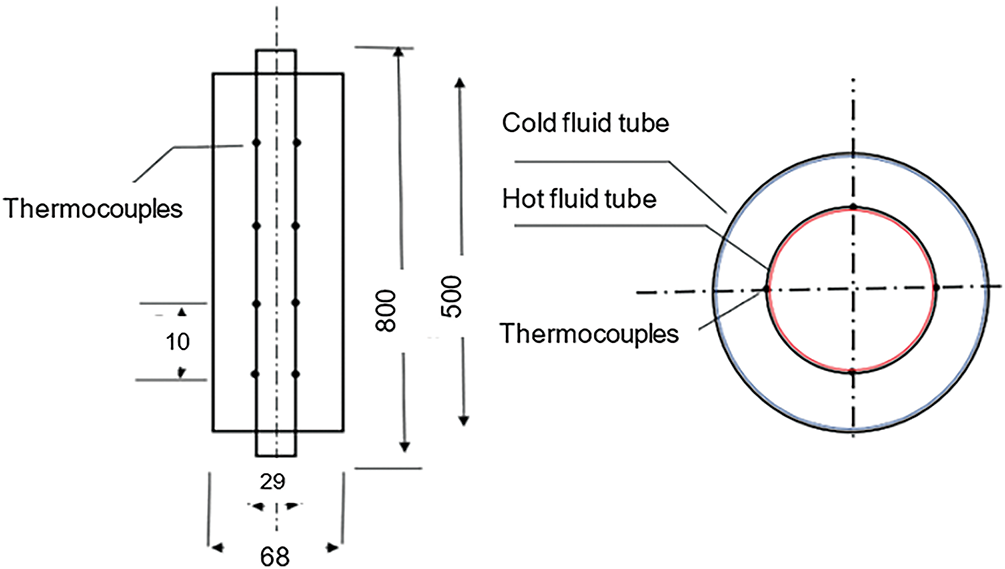
Figure 5: Top and front view of DPHE (all dimensions are in mm)
For DPHE with counterflow, the determination of the heat transfer could be predicted by Eqs. (1) and (2) [20].
where Qc and Qh represent the HTR of cold and hot water (J), respectively.
The average of the heat transfer rate,
where
By using the mean difference of temperature between the inlet as well as the outlet for the two liquids, the U can be computed by using the logarithmic mean temperature difference [21].
where LMTD is logarithmic mean temperature difference, terms that could be determined by Eq. (5) [20,21].
The tube surface area is computed via Eq. (6).
The NTU for a DPHE could be calculated using Eqs. (7) and (8):
where Cmin is defined as the following:
Eq. (9) is the general definition of the heat exchanger’s effectiveness.
that could be reduced to Eq. (10).
Re in the cold water passage is predicted based on the hydraulic diameter, dh, by Eq. (11) [21]:
The hot water tubes’ average Nu is computed by Eq. (12):
Eq. (13) was used to obtain friction factor values [4]:
The enhancement in the performance parameter could be calculated as the improved values in U, Nu, and NTU to the baseline of the parameter without air bubble injection, as in Eq. (14):
The instrument’s uncertainty and the expected NTU, overall heat transfer, and effectiveness were computed using a technique that was proposed by [22]:
where X1, X2, …, Xn … are independent variables of defined results and
The maximum margin of error in measured temperature measurements is ±0.05°C, due to uncertainty in the measuring sensor, as shown in Table 3. In addition, the water flow meter accuracy was ±0.04 LPM, and the accuracy of the airflow meter was ±0.02 LPM. The uncertainty value for overall heat transfer is 5.37%, the uncertainty of NTU is similar to 2.24%, and the greatest degree of uncertainty for effectiveness is 1.43%.

The impact of introduced air bubbles on thermal characteristics, including pressure drop, NTU, effectiveness, and overall heat transfer coefficient of an exchange of heat with two concentrated vertical tubes, U, was explained within this work. The hot flow rate in the inner tube was maintained constant at 3 LPM, even though the outer tube flow rates of cold water changed to 3, 3.5, 4, 4.5, and 5 LPM.
3.1 Overall Heat Transfer Coefficient
In most heat exchangers, one of the finest indicators of heat transmission is the overall heat transfer, U. An increase in this parameter means an increase in the amount of heat transferred and, hence, better HE performance. The results of the overall heat transfer coefficients estimated under various rings, air, and water flow rates are presented in Figs. 6–8 for cases of R-1, R-2, and R-3, respectively.
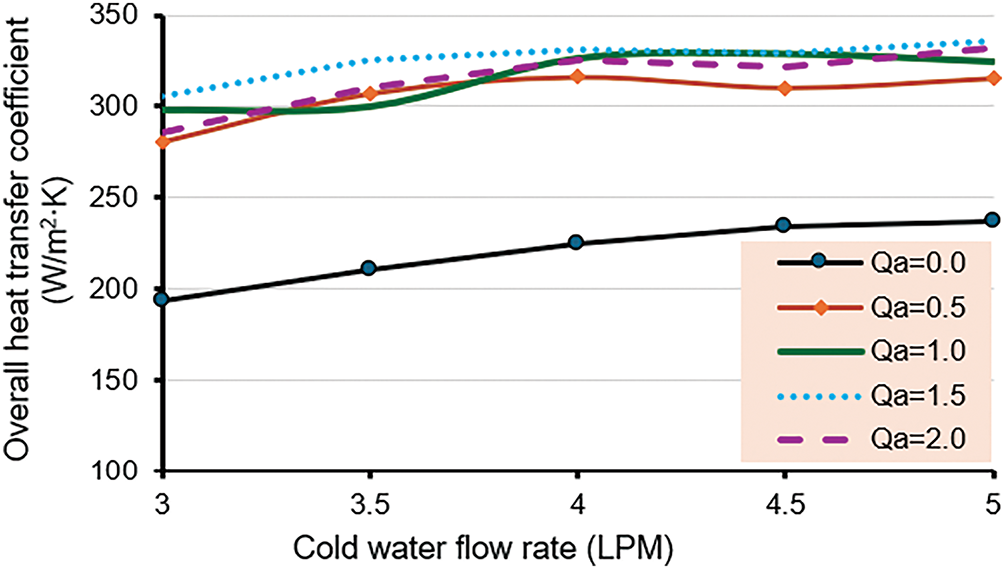
Figure 6: Overall heat transfer coefficient for R-1
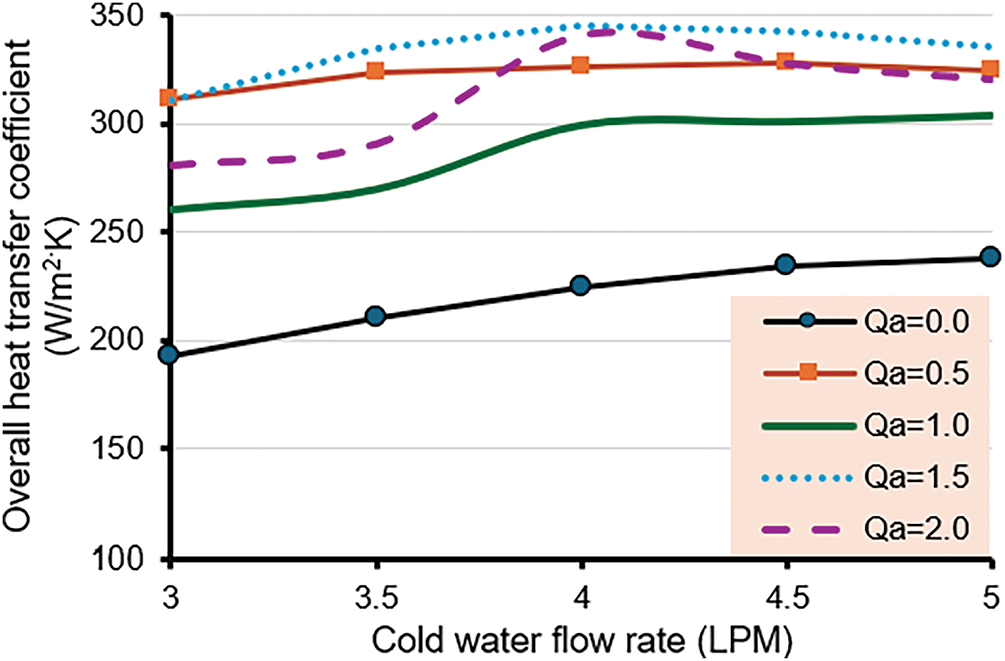
Figure 7: Overall heat transfer coefficient for R-2
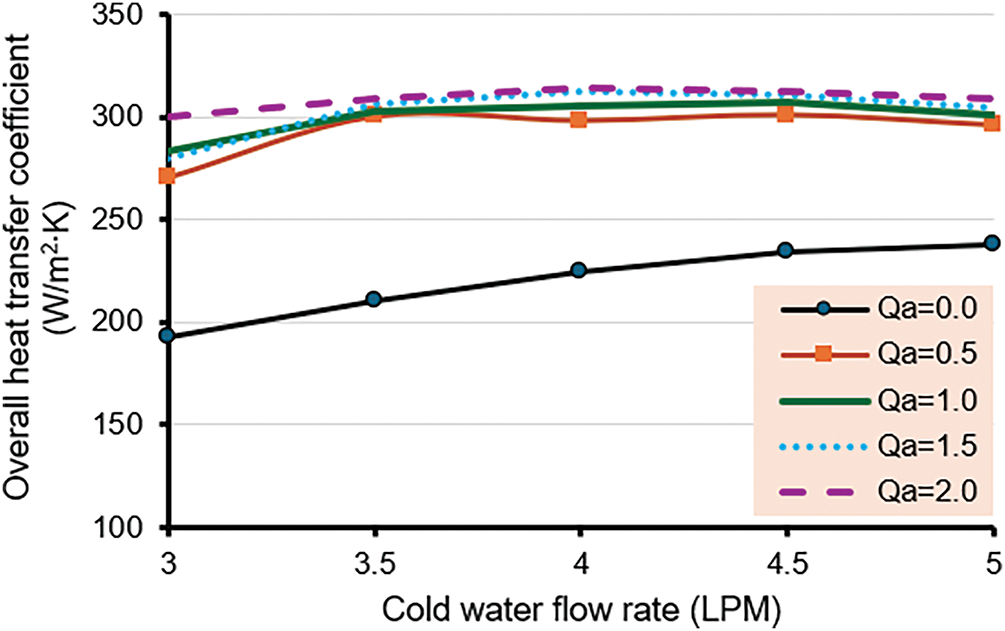
Figure 8: Overall heat transfer coefficient for R-3 to clarify the optimal air flow rate
The results in Fig. 6 show that any air bubbles introduced in the system considerably increase the values of the overall heat transfer coefficient compared with the bare, i.e., no bubble injection. The average enhancement in the overall heat transfer coefficient is around 46.6% over the tested range of cold water flow rate.
Then, a different air flow rate was assessed on the second ring, R-2. The results presented in Fig. 7 show that the highest enhancement in the overall heat transfer was achieved with 1.5 LPM, with a mean enhancement of around 46%. Also, one could realize that the highest values of the overall heat transfer are within the range of 4 ± 0.2 LPM cold water flow rate.
Fig. 8 also shows that all air quantities were assessed on the third ring, and it was found that the best results for the overall heat transfer rate were at 2 LPM with around 38%.
After experimenting with several quantities of air for the three rings, the results are shown in Figs. 6–8 prove that 1.5 LPM represents the optimal airflow. Accordingly, it was fixed in all other experiments, and a comparison between the rings was made at this value of air flow rate.
The results revealed that the overall heat transfer coefficient, U, is higher for two phases than for a single phase. It improved the U by 41% in the case of R-1. Case R-2 experienced the greatest enhancement in overall heat transfer by 58.8% at a cold flow rate equal to 4 LPM. In Case R-3, it was enhanced by 40.1%, and it was enhanced by 43% in Case R-4. Due to the location of R-2 in the middle, where the velocity is at its peak in the middle of the tube, and also the location of the bubbles on the surface of the heat exchange, it was very suitable for breaking the boundary layer.
The least improvement occurs in the case of R-3, because with this ring placed near the inner side of the inner tube, air bubbles collide and create an air pocket, which can lower the improved heat transfer. For the same reason, the improvement in heat transfer at R-4 was decreased, as shown in Fig. 9. The injection of air contributes greatly to causing a large disturbance inside the heat exchanger. This affects the boundary layer that forms along the heat transfer surface. Also, the injection of bubbles directly increases the fluid velocity, which leads to an increase in the Re. All these reasons lead to an increase in the amount of heat transferred [11]. The variation of U with the cold-flow rate for four cases was demonstrated in Fig. 9.
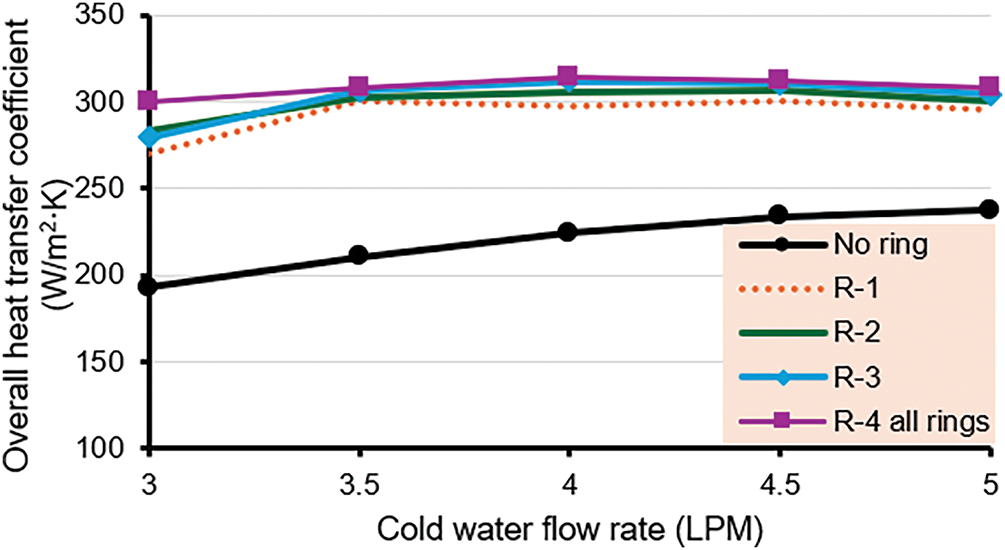
Figure 9: Overall heat transfer coefficient with cold-water flow rate
The ratio of overall heat transfer in two-phase flow to overall heat transfer in single-phase flow is evaluated at various air-in-water volume fractions for all cases of rings and presented in Fig. 10. It was observed that Utp/Usp increased with an increase in the volume fraction for all cases. However, there is a nonlinear correlation between the ratio and the void fraction. The best enhancement is higher in the range of 0.255 < void fraction < 0.3 for all ring cases.
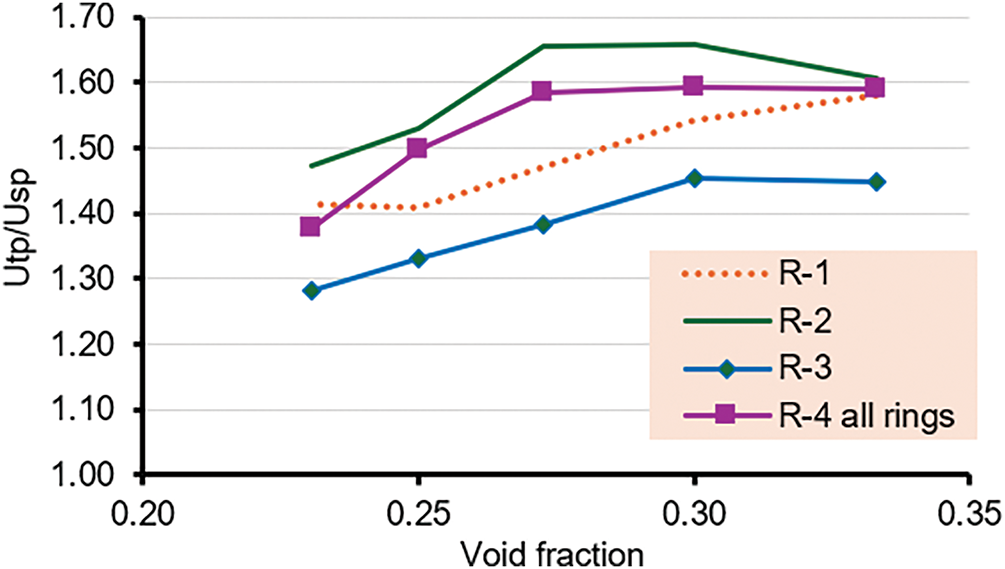
Figure 10: Overall heat transfer coefficient ratio vs. the void fraction at different rings
3.2 Number of Heat Transfer Units
The association between NTU and the mass flow rate of cold water. The number of heat transfer units increased in all cases when air injection was used. The enhancement obtained from R-1 was 49%; the maximum value occurred in R-2 at 65% on a 4 LPM amount of cold-water flow rate; R-3 enhanced NTU by 47%; and last, 58% by R-4, as shown in Fig. 11. Two mechanisms can be used to explain the enhancement caused by air bubble injection. First, the buoyancy force that causes the air bubbles to naturally move vertically on the heat exchanger side can stir the boundary layers that form on the hot tube’s surface and generate more turbulence in the water flow on cold tubes. Second, injected air helps to improve the heat transfer rate in a heat exchanger by increasing the Re. The increment of the Re causes more turbulence intensity in cold water, and because of this mixed phenomenon, the heat transfer coefficient increases.
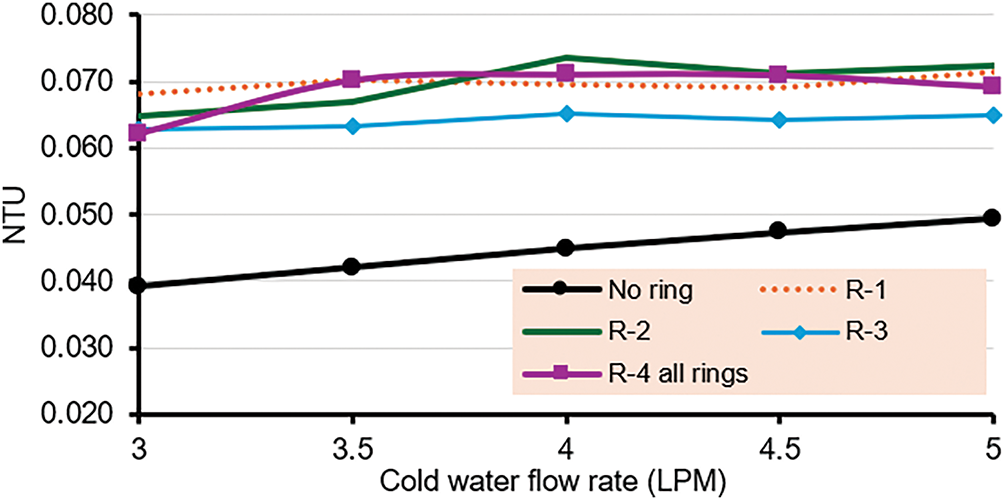
Figure 11: Number of heat transfer units with cold-water flow rate at different rings
The correlation between two-phase NTU and single-phase NTU in terms of the void fraction is shown in Fig. 12. The NTUtp/NTUsp ratio increases with an increase in the void fraction. The maximum value for this ratio was achieved at case R-2, which varies from 1.62 to 1.75 at a volume fraction of 0.33. The least enhancement occurs at case R-3 at 0.23 volume fraction.
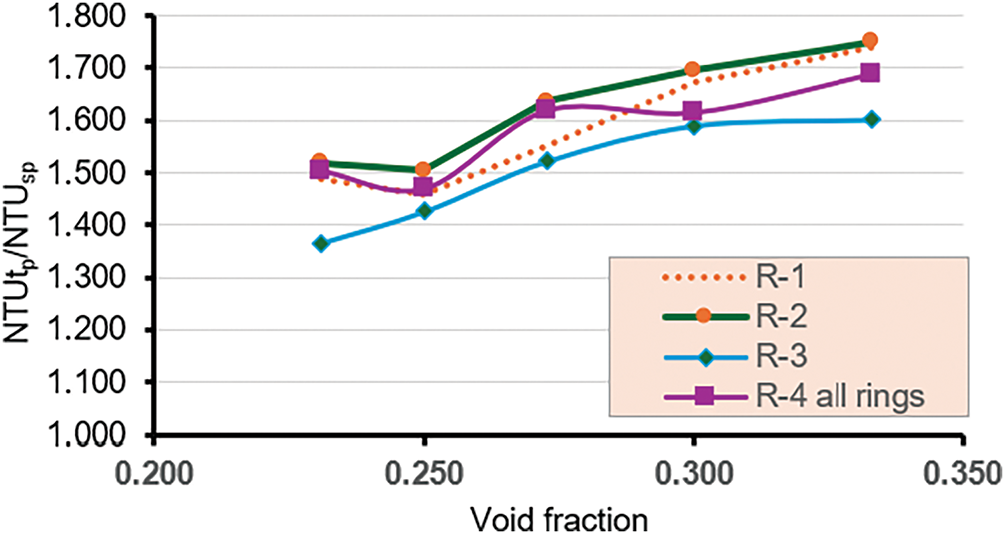
Figure 12: NTUtp/NTUsp with void fraction at different rings
3.3 Pressure Drop and Friction Factor Analysis
An important parameter in the heat exchanger that should be studied is the pressure drop through the heat exchanger. The results of pressure drop for cases with rings at various cold-water flow rates are shown in Fig. 13. The Results show that pressure drop increased with increased air injection due to increased turbulence that led to increased pressure drop. Maximum pressure drops of 4.28 kPa occur in the case of R-4, at a cold water flow rate of 5 LPM, where three rings were used together, and more bubbles were introduced to the annular space than when using one ring alone.
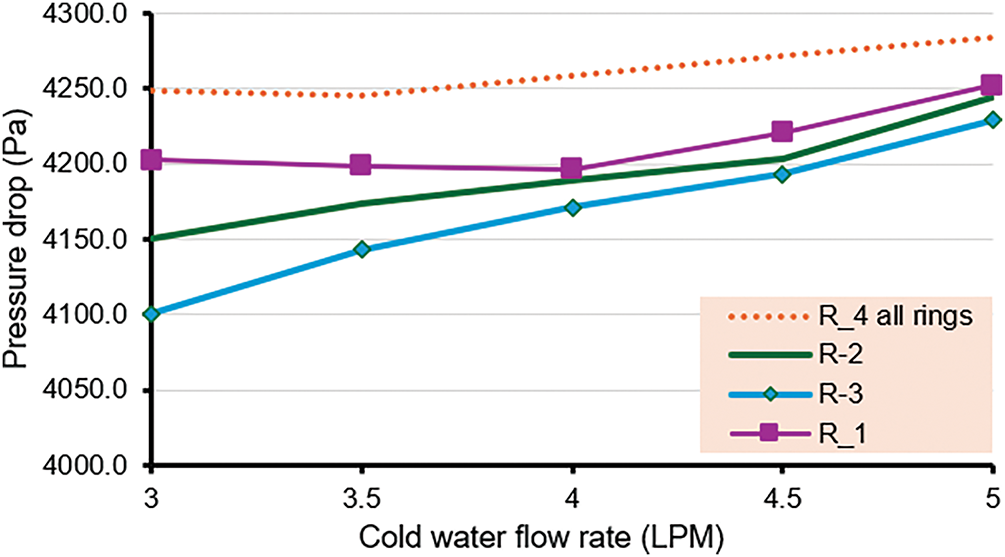
Figure 13: The change in the drop in pressure with various rates of cold-water flow with different cases of rings
The relation between the friction factor and Reynold’s number with three rings is illustrated in Fig. 14. When the cold flow rate increases, the friction factor decreases in the cold water conduit, which is justified by referring to the Moody chart of f-Re. The friction factor for the two phases is more than that for the single phase, depending on the turbulence caused by air bubbles. A lower pressure drop occurs at the second ring due to less viscosity, which leads to fewer friction losses in pipes, so the minimum value of friction factor occurs at R-3 as 0.11, which makes heat transfer at R-3 more effective than other pipes. The maximum friction factor of 0.5 was seen in the case of R-4 due to an increase in air bubbles, which means increased turbulence and, therefore, increased friction factor.
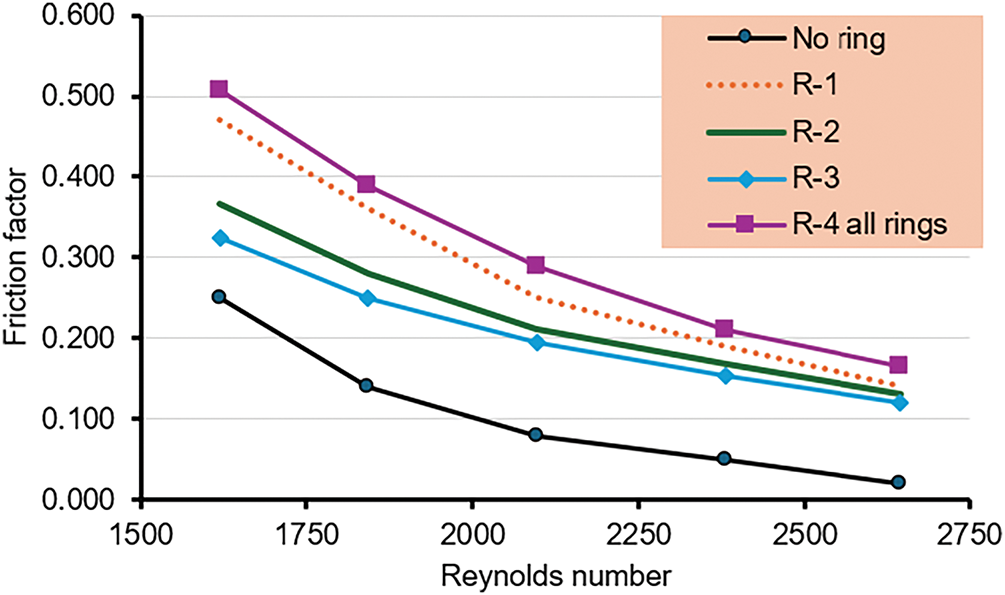
Figure 14: Friction factor with Reynolds number for different rings
The Nu number results, shown in Fig. 15, show that the Nu number rises with an increment in the Re number. Because of the higher intensity of the turbulent flow when the air was injected, a thinner thermal boundary layer contributes to an increase in the rate of heat transfer with an increase in mass flow rate. The Nu number with air injection is larger than the single flow case. The greatest Nu was reached when air bubbles were present, reaching 54.8% of the Re value of 2100. Air injection makes an enhancement in the Nu number equal to 48.9%, 54.8%, 41.31%, and 51.27% in R-1, R-2, R-3, and R-4, respectively.
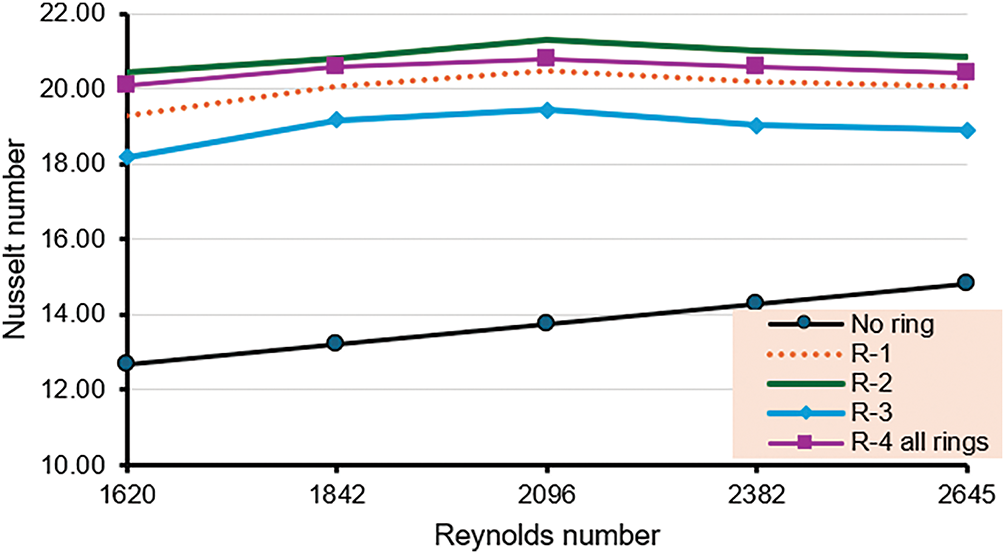
Figure 15: Relationship between Nu and Reynolds at different rings
The improvement of Nu is presented as Nutp/Nusp ratios for each case of installation, as shown in Fig. 16. Depending on the value of water, flow rates were reduced by an increase in cold water. In addition, the ratio of Nu increases more when there is an air bubble injection. The maximum enhancement in the Nu occurred in case R-2.
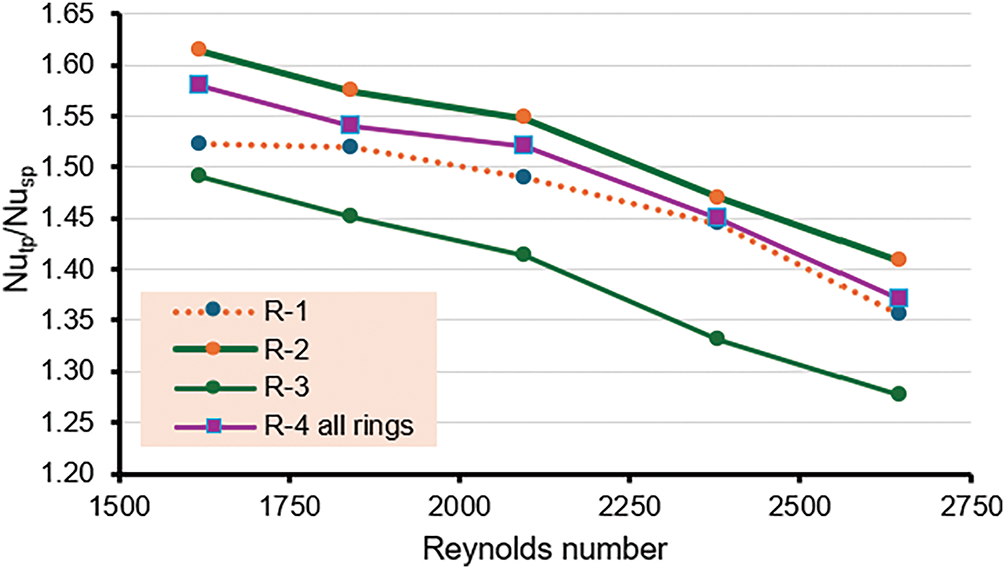
Figure 16: Variation of Nutp/Nusp ratio with Reynolds number
3.5 Results and Analyses of the Performance Indicator
The performance indicator (P.I.) is the ratio of enhancement with air injection to without air injection. This parameter considers the gain in the heat transfer and the penalty of a higher pressure drop due to the bubble injection. It is commonly predicted in the form of Eq. (16) [1].
The thermal enhancement factor is present in Fig. 17. It shows that the thermal performance factor is affected by air injection, and the difference between rings with an increase in Re. The thermal performance factor was computed using the annulus friction factor. The major goal of the current study was to examine a double tube heat exchanger with and without air injection, which raises the thermal performance factor from one ring to another and shows that R-2 performs better than the other rings. This suggests that the air injection into the outer tube and rings significantly affects the performance of the heat exchanger. To verify the result of experimental research, the experiment’s value for overall heat transfer is compared with the theoretical values for a vertical double tube heat exchanger without air bubble injection, as shown in Fig. 18. It was discovered that the high difference between the theoretical and experimental values is less than 11.3%. The present study results were compared with other studies, as presented in Table 4.

Figure 17: Performance indicator for cold-water flow rate at different rings
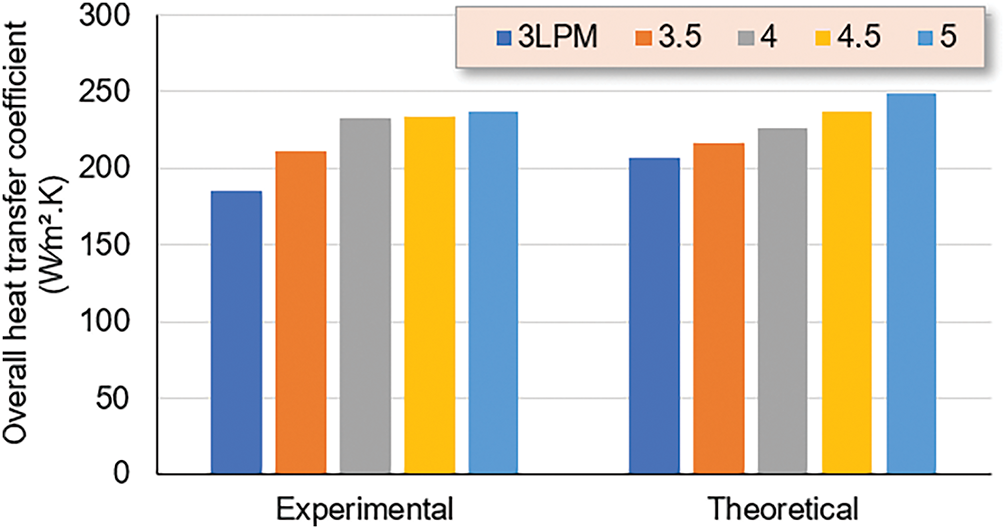
Figure 18: Verification and comparison between theoretical and experimental results of overall heat transfer coefficients at various cold-water flow rates

Thermal performance enhancement of vertical DPHE by air bubble injection has been experimented with and evaluated. Three distinct rings were used to inject the bubbles of air into the annular space of the HE. The results revealed that the injection of air can be employed as an effective technique for enhancing the HT into the DPHE. The following conclusions could be summarized as follows:
1. Overall, heat transfer coefficients improved by injecting air bubbles by 41% in R-1, 58.8% in R-2, 40.1% in R-3, and 43% in R-4. The maximum improvement occurred in the case of R-2 at a 4 LPM cold water flow rate.
2. Maximum effectiveness could be reached when air bubbles are injected at R-2, which is equal to 56%. Air injection inside the annular space by R-1 can enhance effectiveness by 44%, 48.7% in R-3, and 49% in R-4.
3. The NTU of the heat exchanger increases in all cases of rings. Enhancement value was obtained at R-1 equal to 49%, R-2 equal to 65%, R-3 equal to 49.7%, and R-4 equal to 58%.
4. The Nu enhancement reached its maximum value at around 54.79% in R-2. Other rings enhanced the Nu number but were less than that obtained from R-2. 48% enhancement has been obtained by R-1, 41.31 by R-3, and 51.27% by R-4.
It is recommended that further investigations be conducted by numerical simulation to extend the cases of the parameters and cover wider ranges of fluid flow rates.
Acknowledgement: The authors acknowledge the University of Technology-Iraq, Baghdad, for the technical support to conduct the research by allowing the use of the Center for Renewable and Sustainable Energy Facilities.
Funding Statement: The authors received no specific funding for this study.
Author Contributions: The authors confirm their contribution to the paper as follows: study conception and design: Roasi A. Flayh and Ayser Muneer Flayh; data collection: Roasi A. Flayh; analysis and interpretation of results: Roasi A. Flayh and Ayser Muneer Flayh; draft manuscript preparation: Roasi A. Flayh. All authors reviewed the results and approved the final version of the manuscript.
Availability of Data and Materials: The datasets are available to the corresponding authors upon reasonable request.
Ethics Approval: Not applicable.
Conflicts of Interest: The authors declare no conflicts of interest to report regarding the present study.
Nomenclature
| A | Area, m2 |
| Cp | Specific Heat, J/kg·K |
| di | Inner diameter, m |
| dh | Hydraulic diameter, m |
| f | Friction Factor |
| h | Coefficient of heat transfer, W/m2·K |
| k | Thermal Conductivity, W/m·K |
| L | Length of Tube, m |
| Rate of Mass flow, kg/sec | |
| Pressure drop, Pa | |
| Q | Rate of heat transfer, W |
| Re | Reynolds number |
| T | Temperature, °C |
| Logarithmic mean temperature difference, °C | |
| U | Overall heat transfer coefficient, W/m2·K |
| V | Velocity, m/sec |
| Ε | Effectiveness |
| ρ | Density, kg/m3 |
| µ | Dynamic viscosity, kg/m·sec |
| η | Thermal enhancement factor |
| Abbreviations | |
| DPHE | Double pipe heat exchanger |
| HE | Heat exchanger |
| HTR | Heat transfer rate |
| LMTD | Logarithmic mean temperature difference |
| NTU | Number of transfer units |
| Nu | Nusselt number |
| Subscripts | |
| C | Cold |
| E | Enhanced |
| H | Hot |
| I | Inner |
| S | Surface |
| Min | Minimum |
References
1. Flayh AM. Heat transfer and pressure drop comparison for corrugated tube and different numbers of copper foam cylindrical inserts in laminar flow. Heat Transf. 2025;54(1):1052–69. doi:10.2139/ssrn.4868380. [Google Scholar] [CrossRef]
2. Hamzah JA, Nima MA. Numerical investigation of heat transfer enhancement of double pipe heat exchanger using metal foam fins. J Eng. 2019;25(6):1–18. doi:10.31026/j.eng.2019.06.01. [Google Scholar] [CrossRef]
3. Hussein NF. Enhancing heat transfer in tube heat exchanger by inserting discrete twisting tapes with different positions. J Eng. 2019;25(8):39–51. doi:10.31026/j.eng.2019.08.03. [Google Scholar] [CrossRef]
4. Al-Kayiem HH, Ekhwan AB, Laheeb LN. Augmentation of ribs turbulators height on the hydrothermal performance of double pipe heat exchanger. J Eng Sci Technol. 2017;12(2):548–63. [Google Scholar]
5. Dizaji SJH. Heat transfer enhancement due to air bubble injection into a horizontal double pipe heat exchanger. Int J Autom Eng. 2015;4(4):973–80. [Google Scholar]
6. Nandan A, Singh G. Experimental study of heat transfer rate in a shell and tube heat exchanger with air bubble injection. Int J Eng. 2016;29(8):1160–6. doi:10.17485/ijst/2016/v9i36/101404. [Google Scholar] [CrossRef]
7. Ezzat A, Abdullah N, Ghashim SL. Effect of air bubbles on heat transfer coefficient in turbulent convection flow. J Eng. 2017;23(1):1–21. doi:10.31026/j.eng.2017.01.02. [Google Scholar] [CrossRef]
8. Akhavan-Behabadi MA, Shahidi M, Aligoodarz MR. An experimental study on heat transfer and pressure drop of MWCNT-water nano-fluid inside horizontal coiled wire inserted tube. Int Commun Heat Mass Transf. 2015;63(3):62–72. doi:10.1016/j.icheatmasstransfer.2015.02.013. [Google Scholar] [CrossRef]
9. Naphon P, Wiriyasart S. Experimental study on laminar pulsating flow and heat transfer of nanofluids in micro-fins tube with magnetic fields. Int J Heat Mass Transf. 2018;118(1):297–303. doi:10.1016/j.ijheatmasstransfer.2017.10.131. [Google Scholar] [CrossRef]
10. Al-Kayiem HH, Kassim MS, Taher ST. Applications of compound nanotechnology and twisted inserts for enhanced heat transfer. In: Bhattacharya S, Ardekani MM, Biswas R, Mehta RC, editors. Inverse heat conduction and heat exchangers. London, UK: Intech Open; 2020. doi:10.5772/intechopen.93359. [Google Scholar] [CrossRef]
11. Kaska SA, Habeeb HH, Khalefa RA. Performance enhancement of the vertical double pipe heat exchanger by applying of bubbling generation on the shell side. Kirkuk Univ J Sci Stud. 2018;13(1):156–71. doi:10.32894/kujss.2018.142500. [Google Scholar] [CrossRef]
12. Pourhedayat S, Dizaji HS, Jafarmadar S. Thermal-exergetic behavior of a vertical double-tube heat exchanger with bubble injection. Exp Heat Transf. 2019;32(5):455–68. doi:10.1080/08916152.2018.1540504. [Google Scholar] [CrossRef]
13. Mahdi Heyhat M, Abdi A, Jafarzad A. Performance evaluation and exergy analysis of a double pipe heat exchanger under air bubble injection. Appl Therm Eng. 2018;143(4):582–93. doi:10.1016/j.applthermaleng.2018.07.129. [Google Scholar] [CrossRef]
14. Sinaga N, Khorasani S, Nisar KS, Kaood A. Second law efficiency analysis of air injection into inner tube of double tube heat exchanger. Alex Eng J. 2021;60(1):1465–76. doi:10.1016/j.aej.2020.10.064. [Google Scholar] [CrossRef]
15. Sadighi Dizaji H, Jafarmadar S, Abbasalizadeh M, Khorasani S. Experiments on air bubbles injection into a vertical shell and coiled tube heat exchanger; exergy and NTU analysis. Energy Convers Manag. 2015;103:973–80. doi:10.1016/j.enconman.2015.07.044. [Google Scholar] [CrossRef]
16. Albayati MF, Khalefa RA. The Performance of the U shape double pipe heat exchanger under effect of using active techniques. NTU J Eng Technol. 2022;1(3):1–9. doi:10.56286/ntujet.v1i3.61. [Google Scholar] [CrossRef]
17. Baqir AS, Mahood HB, Kareem AR. Optimisation and evaluation of NTU and effectiveness of a helical coil tube heat exchanger with air injection. Therm Sci Eng Prog. 2019;14:100420. doi:10.1016/j.tsep.2019.100420. [Google Scholar] [CrossRef]
18. Ghashim SL, Flayh AM. Experimental investigation of heat transfer enhancement in heat exchanger due to air bubbles injection. J King Saud Univ Eng Sci. 2021;33(7):517–24. doi:10.1016/j.jksues.2020.06.006. [Google Scholar] [CrossRef]
19. Talib SM, Rashid FL, Eleiwi MA. The effect of air injection in a shell and tube heat exchanger. J Mech Eng Res Dev. 2021;44(5):305–17. [Google Scholar]
20. Mohsen AM, Oleiwi A, Tukkee AM, Al-Kayiem HH. Experimental investigation of heat transfer enhancement in shell and tube heat exchanger using discontinuous curved and longitudinal straight fins. J Eng Sci Technol. 2023;18(5):2327–39. doi:10.1002/htj.22354. [Google Scholar] [CrossRef]
21. Abdulmalek SH, Assadi MK, Al-Kayiem HH, Gitan AA. Effect of tube diameter on the design of heat exchanger in solar drying system. IOP Conf Ser Mater Sci Eng. 2018;328:012028. doi:10.1088/1757-899x/328/1/012028. [Google Scholar] [CrossRef]
22. Al-Kayiem HH, Tukkee AM, See YK. Experimental assessment of a solar Vortex engine integrated with sensible TES at different collector configurations. Renew Energy. 2024;227:120539. doi:10.1016/j.renene.2024.120539. [Google Scholar] [CrossRef]
Cite This Article
 Copyright © 2025 The Author(s). Published by Tech Science Press.
This work is licensed under a Creative Commons Attribution 4.0 International License , which permits unrestricted use, distribution, and reproduction in any medium, provided the original work is properly cited.
 Downloads
 Citation Tools