
 Submit a Paper
 Propose a Special lssue
 Open Access
ARTICLE

Occupancy Based Building Energy Analysis Using Discrete Event Simulation
1 Amazon.com Services LLC, Seattle, WA 98109, USA
2 Industrial and Management Systems Engineering, West Virginia University, Morgantown, WV 26505, USA
* Corresponding Author: Bhaskaran Gopalakrishnan. Email:
Energy Engineering 2025, 122(7), 2931-2956. https://doi.org/10.32604/ee.2025.064887
Received 26 February 2025; Accepted 20 May 2025; Issue published 27 June 2025
 View Full Text
 Download PDF
Abstract
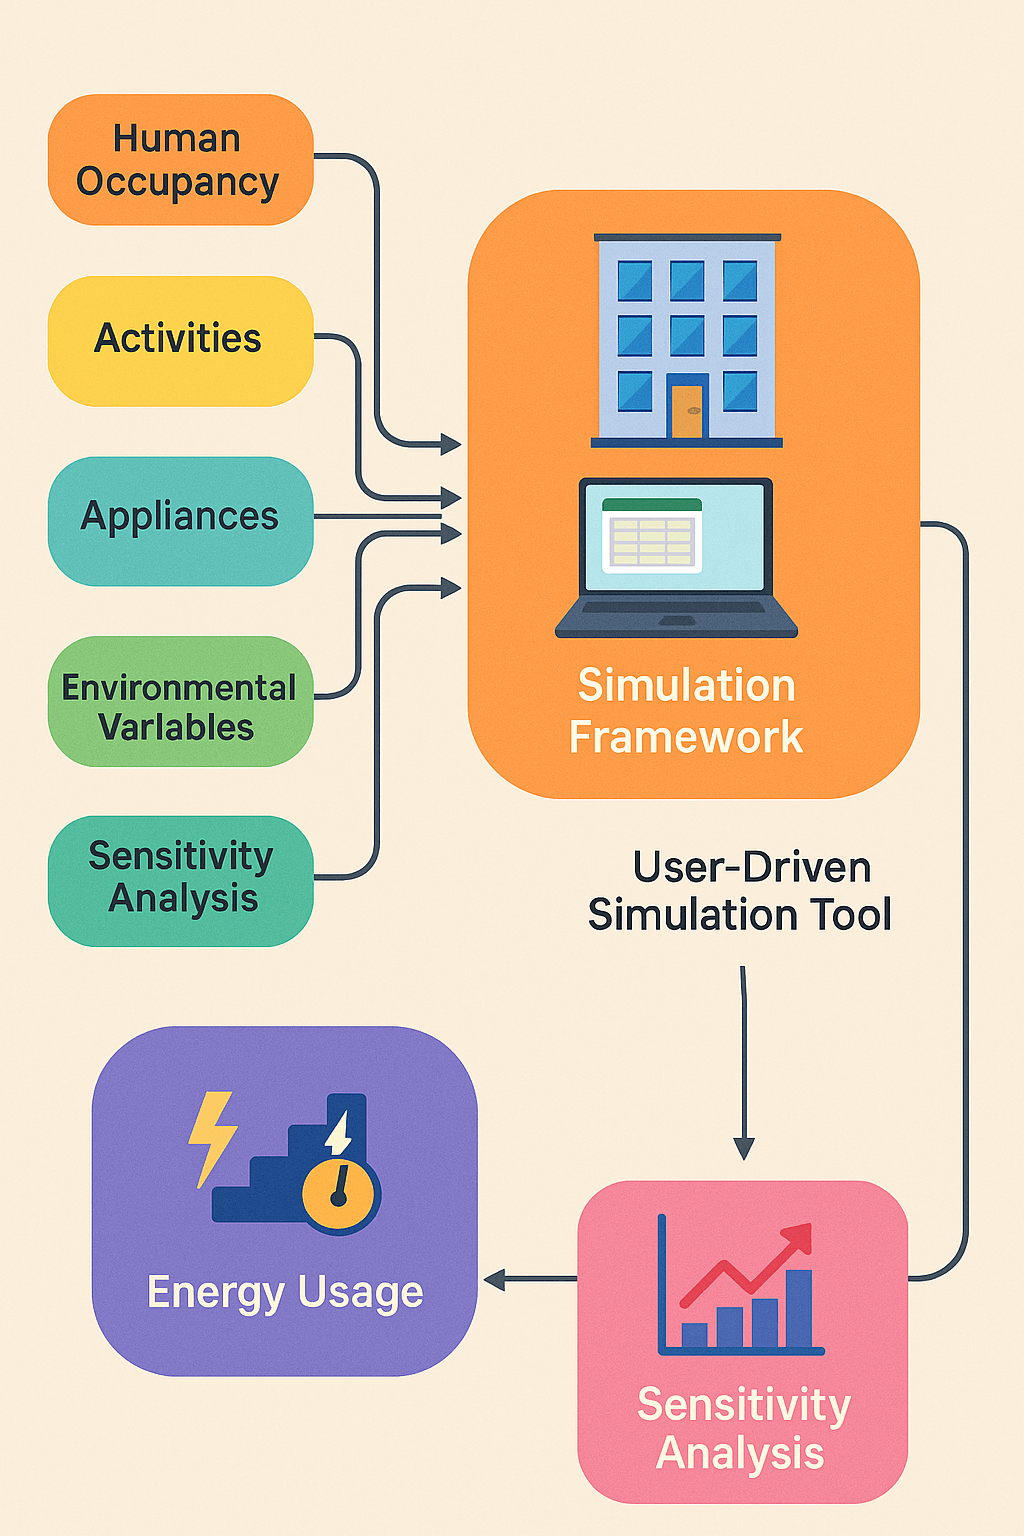
Highly energy-efficient buildings have generated remarkable interest over the last few years. There is a need for simulation based effective control systems for efficient usage of electrical and fossil fuel driven devices, as they contribute to energy-efficient buildings and assist in gaining flexibility for the human occupancy-based energy loads. In this context, the integrated energy profile of a building can be ascertained by effective research approaches, as this knowledge would be beneficial to understand the demographics with respect to human occupancy and activities, as well as estimate varying energy consumption over time. Utility data from Smart Meter (SM) readings can reveal detailed information that could be mapped to predict resident occupancy and the usage patterns of specific types of appliances over desired time intervals. This research develops a user-driven simulation tool with realistic data acquisition options and assumptions of potential human behavior to determine energy usage patterns over time without the utility billing information. In this work, factors such as level of human occupancy, the possibility of space being occupied, thermostat settings, building envelope infrastructural aspects, types of appliances used in households, appliance energy related capacities, and the probability of using each appliance is considered, along with variance in weather, and heating-cooling systems specifications. For five specific benchmarked scenarios, the range of the random numbers is specified based on assumed potential human behavior for occupancy and energy-consuming appliances usage probabilities, with respect to the time of the day, weekday, and weekends. The simulation is developed using the Visual Basic Application (VBA)® in Microsoft Excel®, based on the discrete-event Monte Carlo Simulation (MCS). The simulated energy usage and the cost are reflected in the sensitivity analysis by comparing factors such as the level of human occupancy, appliance type, and time intervals.Graphic Abstract
Keywords
The rapid advances in sensors, data collection, monitoring systems, and storage technologies have generated enormous, complex, and multidimensional datasets. Our everyday activities have been recorded while we are using digital technology such as credit cards, social media, telephone. All this recorded data is the potential source of valuable information and the primary input for analysis. Energy usage-based data analytics can be defined as the use of scientifically derived and proven methods toward the preservation, collection, validation, identification, analysis, interpretation, documentation, and presentation of digital energy usage data, which is derived from varying sources [1].
1.1 Energy Analysis Using Discrete Event Simulation
In recent times, all information related to energy usage is available in digital format. Correspondingly, the improvement of the electronic sensor, data storage, and communication technologies in energy measurement provides enormous, detailed information about energy usage, demand, supply, and system performance. Energy data analysis relies on this digital information, networking, and data transmission systems. For analyzing all this information to get an insight into the detailed activities of energy users, various data analysis tools can be used, such as simulation, linear or nonlinear regression, the least-squares method, decision tree analysis, and clustering methods. However, energy usage information is not publicly available. Most entities do not have access to detailed building energy data such as energy supply, user information, appliance information, and occupancy. The field of energy analysis can be well served by alternative solutions. Simulation is an essential tool in the field of energy analysis. It is possible to simulate the energy usage pattern for varying scenarios. Subsequent data analytics techniques can be used for interpreting the results derived from the simulation.
1.2 Usage of Digital Data to Interpret Human Behavior
In this modern era, there are many ways people can leave electronic trails. It is easy to follow their digital footprint through these electronic trails. All the available sources of the digital footprint can detect a person’s activities outside of their homes. In addition, the usage of Artificial Intelligence (AI) is gradually increasing in predicting human behavior. Two monitoring approaches are available for tracing human behavior: vision-based monitoring and sensor-based monitoring [2]. In vision-based monitoring systems, the video camera is commonly used to ensure outdoor and public places. Therefore, vision-based technology can be deployed for discovering human activities such as entertainment, home automation, security, and safety of the residents, Ambient-Assisted Living (AAL), advanced support, and care applications. AAL can provide different types of support regarding health and safety, mostly for the elderly or impaired people. AAL’s intelligent monitoring system’s main advantage over traditional video surveillance systems recognizes a different set of behaviors that can identify specific body activity, e.g., accurate fall detection. The leading information source for vision-based technology is the video camera because the video provides rich sensory information. This information can be utilized for providing services from automatic supervision to intelligent monitoring. Automatic supervision can help the elderly population improve their daily life activities by promoting positive behavior changes and assisting them with medication. For illustration, a vision-based health monitoring system learns the activity patterns of the elderly and detects anomalies or deviations, which can help to recognize changes in health status. There will be a predefined activity zone environment, where visitors will identify the activity. Usually, the event is logged when a subject stays in the activity zone for more than one second. To detect deviations from the learned activity pattern, it performs pattern analysis later. The system can detect a home emergency, such as the fall of a subject. Before the trigger, the alarm system tries to confirm the fall detection with the involved person. As a next step, the system will contact the emergency personnel in charge. For communication, a video will be transmitted to the responsible person as a shadow form for maintaining a person’s privacy. Finally, the monitoring person will check the subject person’s state and take action as required. Moreover, under the obstruction, multiple people can be detected as well as their activities can be tracked. Nevertheless, continuous monitoring through the video camera violates privacy rights, so such systems frugally access private areas such as a home. Due to the obstacle of rules and regulations, the vision-based monitoring systems are not publicly available, and progress is slow.
Another known technique for monitoring human behavior is a sensor-based monitoring system. The sensor-based system uses a deep learning architecture for modeling the inter-activity human behavior, which is based on classification concepts of human behavior. This classification develops an algorithm to automatically describe inter-activity behavior. The algorithm creates a probabilistic model of user behavior by using Long-Short Term Memory Networks (LSTMs). This model predicts the user’s action or detects unexpected behavior. For illustration, it can detect the overspeed vehicle number plate, leaving a bag at the airport, removing an object from a store (theft), and incorrect exchange of bags between two persons [3].
In general, the sensor-based system has two branches: data-driven and knowledge-driven approaches. Data mining and machine learning techniques have been used to learn about human behavior and activity in a data-driven approach. This system requires enormous sensor-based datasets about human activities to train different kinds of classifiers. Several training techniques are used, such as the Markov model, Bayes classifier, dynamic Bayesian network, support vector machine, and online classifier. Usually, all these techniques try to model human behavior while considering humans as devices with many internal mental states. Each mental state has its particular control behavior and interstate transition probabilities. Short-term and long-term behavior can be described by organizing the data in hierarchical order. In terms of a road-driving event, long-term behavior might be passing, turning, following, maintaining lane position, and releasing the brake will be considered as short-term behavior. Another widespread usage is to manage people and object interaction by performing a shadow analysis of a person to protect body parts from the machine or avoid a car accident [4].
The existing domain knowledge has been used for training in the knowledge-driven approaches instead of labeled datasets. The significant task in an intelligent environment is to predict human behavior. The improvement of data science allows a model to scrutinize human daily life activities. This facilitates the detection process of human behavior variation and the subject’s needs. Varying types of algorithms have been developed based on sequencing matching, compression, device usage pattern, user mobility pattern, and user activity prediction methods in the smart environment. Many cities worldwide have efforts in place to convert their cities into smart cities, with the deployment of deep learning architecture. The enormous amount of data improves the decision-making process and transforms the whole city into an intelligent environment. To ensure smart city resident comfort, a more in-depth analysis of the use of user behavior in intelligent environments is usually performed. Finally, it is possible to model and predict the inter-activity behavior with a detailed description by using action sequences from specific sensor technologies [2].
All the human behavior prediction processes described herein can assist authoritative entities in regulating and controlling human behavior-based activities for enhanced energy efficiency. Additionally, the improved vision-based and sensor-based monitoring system provides the facilities with advanced knowledge of undesirable events from occurring. It is difficult to track human behavior in their living space. Residential energy usage information can provide knowledge about the resident’s activities and occupancy. Generally, all the appliances within a living space consume energy, and energy usage by appliances is directly related to human occupancy. The only way to obtain detailed energy consumption information is from the energy utility bills. In the literature and in knowledge available from social spaces, the energy utility bills are an integral part of occupancy-based building energy analysis. However, this research aims to deviate from this paradigm.
1.3 Collection and Use of Utility Data
There are a variety of energy meters available. Depending on the type of energy, the most common measuring equipment is electricity meters and gas meters. The most typical electricity meter is known as the electromechanical meter. The electromechanical meter is equipped with a non-magnetic, electrically conductive metal disc where rotational speed is proportional to the power that is passing through the meter. Usually, the meter is manual and read by the power company representative or the customer. Digital microtechnology (DMT) promotes the development of electronic meters, where the meter does not need to depend on moving parts. The electronic meter consists of several parts, such as a Liquid Crystal Display (LCD) monitor, a metering engine, a processor, and a communication engine. Besides measuring energy use, it can record other parameters such as electrical usage demands, voltages, power factor, and reactive demand. These meters are capable of storing information in remote locations in the digital cloud [5].
Utilizing communication and data storage technology, utility companies have introduced new energy consumption measuring devices, known as Smart Meters (SM). The most advantageous feature of SM is the two-way communication capability. SM measures the energy consumption and displays it on an analog counter. SM directly sends the bill and energy status to utility companies and customers. The first-generation SM was equipped with Automated Meter Reading (AMR) and Remote Meter Reading (RMR) while it operated at one-way communication. SM provides access to long meter readings to the utility company. After the development of Advanced Metering Infrastructure (AMI) and Intelligent Energy Networks (IENs), SM could afford two-way end-to-end communication, appliance monitoring, and control, detection and diagnosis of faulty systems, data storage and management, demand-side management, detection of electricity theft, enhancement of system security, load management, and emission control, and development of smart urban cities [6,7].
It is entirely feasible that the detailed utility data analytics associated with facility annual energy consumption can provide insight into human activities within the building’s living spaces. The analysis of the utility data will deliver knowledge about the number of residents, occupancy, and activities. Utility data can be obtained from the AMR or SM reading. SM reading contains detailed information about the occupancy and appliance usage within small time intervals.
There are some obstacles to accessing utility data. Foremost, any kind of utility data is very confidential, and it is not available to the public. Subsequently, the SM’s deployment in the USA can be considered to be slow, even though it is expected that 1000 million SM will be installed worldwide by 2022 [8]. There are mainly two reasons for the slow penetration of SM at households in the US. First, the presently installed meter can deliver one-way communication, and secondly, the customers’ knowledge of SM is limited. Besides, each region or area, or State, has varying regulations for SM deployment. Hence, SM data to analyze resident behavior by using artificial intelligence or machine learning is usually not feasible. Moreover, procedural and regulatory constraints also prevent authoritative entities from obtaining utility information about a building. However, an easier alternative for obtaining knowledge about the number of residents and their activities is to develop electricity consumption patterns without the use of detailed utility bills. This pattern will present the energy consumption rate within specific intervals, over a whole year or any specific time period during the year. Analysis of the obtained patterns can be used to indicate the level of human activities and occupancy based on the use of appliances within living spaces.
For a commercial enterprise, the knowledge of human activities within building spaces is invaluable information for understanding the market condition and developing a new product. This information can also be used by authoritative entities for varying commercial reasons. The objectives of this research are related to the overall concept of paving the way to enable the analysis of residents’ behavior and activities inside a building living space. The specific objectives have been outlined below.
1. Develop cases for calculating energy consumption (electricity and natural gas) based on varying human occupancy scenarios.
2. Develop a Microsoft Excel® based (Visual Basic Application (VBA)®) Monte Carlo simulation, which can forecast the occupancy level at varying time intervals.
3. Identify the usage of appliance based on the occupancy for specific time intervals during the day.
4. Develop a user-interactive simulation model based on user input data pertaining to various parameters that impact appliance usage, building infrastructure, weather, and human occupancy.
For predicting the residential electricity consumption with respect to time, Fumo and Rafe Biswas [9] utilized simple linear regression analysis along with quadratic regression analysis. Here, they also consider time as a relevant factor that defines the quality of the model. Also, multiple regression analysis was used to compare the results with simple linear regression. To simulate the energy consumption profile for single-family houses in Florida, researchers Hoşgör and Fischbeck [10] collected data from 7091 houses and used the Princeton Scorekeeping Method (PRISM). Historical weather data and publicly available monthly utility consumption data were used as input in this research. The motivation of this work was to use publicly available data to understand energy efficiency. Research has been done to develop a model for calculating the heating energy consumption of residential buildings from historical utility data.
Soldo et al. [11] also presented a simple linear regression model to verify the impact of solar radiation on gas consumption for heating in the houses. In their linear model, they used an artificial neural network. Elsawaf et al. [12] used a linear least-squares regression method. They studied varying combinations of heating, such as heat pump, gas heating, and an electric heater, to model their efficiencies. The data were analyzed for four cities in eastern Northern California (USA). The researchers considered seven variables-house size, number of occupants, number of stories, years since construction, house orientation, heating temperature, and a dummy variable (value of 0 or 1) to indicate if the home relies on heat pumps. To find the cause of increased energy consumption in China from 2002 to 2010, Nie and Kemp [13] used a regression-based prediction model. The available data from the China statistical yearbook 2011 and the China statistical energy yearbook have been used in this work. They have found that the change of appliance has a great impact, and the second significant cause is floor space per capita. The model has been developed to predict electricity usage by investigating the relationship between electricity consumption and ownership of appliances. In another example, Bianco et al. [14] developed a multiple regression model to forecast the energy consumption for the residential and non-residential areas in Italy throughout 1970–2007. In their study, they prove that the gross domestic product (GDP) has a strong relationship with electricity consumption. Similarly, Chen et al. [15] implemented a multivariate regression analysis to find a correlation between household variables, energy consumption, socioeconomic conditions, and resident behavioral variability in China. The data was gathered from 642 households during the wintertime and 838 households during the summer. The researchers concluded that the socio-economic parameter explains 26.3% of the energy consumption variation under the defined condition. When the behavioral variability was included, the variation increased up to 28.8%. Also, based on the income level, the variation in energy consumption for the air conditioner was 18%. When the floor area was incorporated, it rose to 44%. In this research, Gans et al. [16] also worked with real-time energy usage information while they were trying to find the impact of dwelling, health, education, employment, and welfare payments on electrical energy consumption for a residential area in Northern Ireland.
Some researchers tried to measure energy consumption, aiming to find opportunities to improve energy efficiency. For example, Raffio et al. [17], Mattinen et al. [18], and Mastrucci et al. [19] investigated the building envelope effect on energy consumption. Varying methods were used by the researchers, such as multiple linear regression and bottom-up approach data analysis. Raffio et al. [17] identified that the following characteristics of houses, such as high hot water temperature setpoints, low-efficiency hot water heaters, no nighttime setbacks, a high rate of infiltration, and low furnace efficiency, are the cause of high energy consumption. In addition, Schleich et al. [20] in their study examine the impact of customer feedback provided to the customers on energy consumption. The obtained data were from 1500 households, where half of the households received the feedback and were considered as pilot groups. The rest of the households did not have that feedback and were considered as control groups. The regression results revealed that the feedback helped to reduce the energy savings by 4.5%. The demand load for residential houses is an important factor. Ndiaye and Gabriel [21] completed a conditional demand analysis with 59 predictor variables to develop a regression model for the housing units in Oshawa (Ontario, Canada). They have found that the coefficient of determination is 0.784, only for nine predictor variables. There were three methods for collecting the data: survey, site audits, and audit of smart meter information.
Chicco [22] reviewed different clustering techniques used to group customers based on the electricity consumption pattern. At first, they discussed hierarchical clustering, which is used to cluster the load patterns. The second and third techniques were k-means and fuzzy k-means. The fourth technique was to Follow the Leader (FDL), where the algorithm does not require the number of clusters as an input. Rhodes et al. [23] investigated residential houses’ demand profile within their respective seasons. In this work, they used the k-means cluster method to cluster similar hourly electricity use patterns based on the smart meter data and survey data from 103 homes in Texas, Austin.
Al-Wakeel and Wu [24] also used the k-means clustering algorithm to develop a clustering method. For the validation of their model, the authors used individual or aggregated smart meter-based residential daily and segmented load profiles data from 100 residential smart meters. Zhou et al. [25] developed a fuzzy c-means clustering model for households’ monthly electricity consumption pattern mining. In this experiment, the SM data were collected from 1200 households in China for one month. The author claimed that c-means fuzzy clustering is superior in electricity consumption data analysis compared with hard clustering methods. Gouveia and Seixas [26] used this method in their study. The obtained data were from the high-resolution smart meter data and surveys for the 265 sampled households in a Southwest European city of Portugal. Hierarchical clustering has been used for trimming the electricity data from 2011–2014, for each day. Yang [27] also utilized a hierarchical clustering method to identify electricity consumption patterns and abnormal users in China. They used the electricity consumption data of 300 residential users for one month. From their research, they were successfully able to find the nine abnormal users and four types of monthly electricity consumption patterns.
Beaudin and Zareipour [28] present the positive side of SM deployment. They discussed the Home Energy Management Systems (HEMS) and several optimization methods based on the HEMS information. The recent improvement of smart meters and smart grids provides opportunities to develop some tools for reducing the demand response and electricity consumption. Author Yildiz et al. [29] reviewed the recent methods and techniques for analyzing SM data. They discussed the techniques for the development of a Smart Meter Based Model (SMBM). They recommended Demand Response (DR) tools and Home Energy Management Systems (HEMS) to improve their electricity consumption management. A pilot project called “Latvenergo” was introduced in Latvia, where smart meters were installed in 500 Latvian households at the beginning of 2013 to promote households’ energy efficiency using smart technologies. One research group, Poznaka et al. [30], investigated the “Latvenergo” pilot project and revealed that electricity consumption decreased by 23% for the target group. McKenna et al. [31] described the smart meter’s negative effect in terms of violating citizens’ privacy. Smart meter data can be classified as personal data and system-related data. This paper investigated the possibility of avoiding personal data while using the system data aimed to improve demand control, distribution network operation, and planning.
Xie and Stravoravdis [32] proposed a novel hybrid framework combining Graph Neural Networks and Long Short-Term Memory networks to generate accurate occupancy profiles for building energy simulations. The method models complex spatial-temporal patterns in occupant behavior, capturing both relationships between spaces and temporal dynamics. Ahmed et al. [33] systematically analyzed recent literature on various aspects of occupant behavior, including data collection, modeling approaches, validation, and data presentation. By providing an up-to-date evaluation of occupant behavior modeling, the study offers valuable insights for researchers and professionals aiming to enhance the accuracy of building performance simulation through better representation of occupant interactions with building systems. Ding et al. [34] analyzed six monitoring methods and their combinations, evaluating their effectiveness in occupancy detection. They categorize occupancy prediction approaches into deterministic schedules, stochastic schedules, and machine learning methods, discussing the advantages and limitations of each.
Ding et al. [35] captured the stochastic nature of human behavior and its impact on energy use, providing a more accurate representation compared to traditional deterministic models. By incorporating detailed occupant–equipment interaction behaviors, the model enhances the precision of energy consumption forecasts, aiding in the development of more effective energy-saving strategies and policies for office environments.
Hong et al. [36] presented a comprehensive review of how occupant behavior models are implemented and represented within building performance simulation tools. The paper highlights the critical role of occupant behavior in influencing energy use and indoor environmental quality in buildings, pointing out that many simulation tools lack robust or standardized approaches to model such behaviors. Sydora et al. [37] introduced a simulation-based methodology to evaluate infection risks within building environments under various viral transmission scenarios. By modeling occupant movements and interactions, the study assesses how different factors such as occupancy density, movement patterns, and ventilation strategies impact the spread of airborne pathogens. The authors demonstrate that specific interventions, like improved ventilation and reduced occupancy, can significantly mitigate infection risks. Dong et al. [38] provide a comprehensive review of occupant behavior modeling in building performance simulation. The paper emphasizes the significant impact of occupant behavior on building energy consumption and indoor environmental quality. It categorizes existing modeling approaches into deterministic, stochastic, and agent-based models, discussing their respective advantages and limitations.
Tang et al. [39] introduced the concept of “technology-guided occupant behavior” to enhance the coordination between occupant actions and energy-efficient technologies in building energy management. The study emphasizes the importance of integrating occupant behavior into the control loops of central air-conditioning systems to achieve energy savings. By involving occupants in the control process, the system can respond more effectively to actual cooling demands, reducing unnecessary energy consumption. On-site tests conducted in a Hong Kong campus building demonstrated that this approach could reduce the energy consumption of the central air-conditioning system by approximately 23.5%, accounting for about 7.8% of the total building electricity use. This research highlights the potential of occupant-involved control strategies in optimizing building energy performance. Karki et al. [40] presented a user-driven simulation tool designed to evaluate the effectiveness of Building Energy Management Systems (BEMS) in reducing energy consumption for heating and cooling. Developed using Visual Basic for Applications (VBA) in Microsoft Excel and based on Monte Carlo Simulation (MCS), the tool allows users to input specific building parameters and BEMS control strategies. Mundu et al. [41] presented a comprehensive review of simulation modeling techniques applied to energy systems analysis, emphasizing their role in advancing sustainable energy development. Each approach is analyzed for its effectiveness in modeling key components of energy systems, including generation, transmission, distribution, consumption, storage, and renewable integration. The study highlights practical applications through case studies, demonstrating how these models address challenges such as data quality, model complexity, and validation processes. The review concludes that simulation modeling is essential for addressing energy challenges, driving innovation, and informing policy. It identifies critical areas for improvement, including enhancing data quality, refining modeling techniques, and strengthening validation processes, thereby offering valuable insights for researchers and policymakers in the energy sector.
Su et al. [42] presented a comprehensive review of current research trends and future directions in building energy studies. The authors analyze over 100 publications, categorizing them into key areas such as energy modeling, occupant behavior, renewable energy integration, and intelligent monitoring systems. The study also identifies a gap in the development of standardized design and construction codes related to building energy, emphasizing the need for further research to establish practical guidelines. Hakawati et al. [43] investigated the influence of occupant knowledge and behavior on the effectiveness of smart energy management systems in residential buildings. Conducting a survey with 100 valid responses from residents in Palestine, the study employs partial least squares structural equation modeling to analyze the relationships between knowledge, behavior, and energy consumption.
Rastegarpour and Ferrarini [44] presented a comprehensive analysis of modeling and control strategies aimed at enhancing energy efficiency in buildings. The study evaluates various modeling techniques, including linear time-invariant, time-varying, and nonlinear models, alongside control approaches such as adaptive and real-time predictive controls. Dutta et al. [45] presented an Internet of Things (IoT)-based system designed to monitor and control electricity consumption in buildings. The system utilizes Wi-Fi smart plugs as sensors to collect real-time power consumption data for individual devices. A mobile application provides users with access to energy usage data and allows remote control of connected devices. The study details the system’s architecture, including hardware components, software infrastructure, and data flow. Results indicate that the smart plugs deliver accurate power consumption data with minimal deviation. Chatzikonstantinidis et al. [46] investigated the role of Digital Twin (DT) technology in enhancing energy management within smart buildings, particularly during crisis situations such as the COVID-19 pandemic. The study analyzes energy consumption data from a residential complex in Cyprus under lockdown conditions. The authors emphasized the importance of interdisciplinary collaboration and the integration of advanced technologies in building management to promote adaptability and sustainability in urban environments.
Basholli and Daberdini [47] investigated the quality of electricity within a university building, emphasizing the impact of non-linear loads such as computers and laboratory equipment on power quality. Utilizing the Power Sight device and associated software, the study monitors parameters including voltage, current, frequency, and harmonic distortion over a one-week period. Shahee et al. [48] investigated strategies to reduce energy consumption in residential buildings through the implementation of insulation scenarios and the integration of renewable energy sources. The study focuses on a residential locality in Florida, analyzing the impact of architectural design and environmental factors on energy efficiency. The study calculates the building’s energy consumption intensity and determines its classification according to Energy Star standards, demonstrating the effectiveness of these measures in enhancing energy efficiency and promoting environmental sustainability. Mischos et al. [49] presented a comprehensive review of intelligent energy management systems (IEMS) aimed at enhancing energy efficiency in residential, commercial, and educational buildings. The review discusses the strengths and weaknesses of each system type, explores various optimization techniques employed, and offers insights into future improvements.
This methodology is based on the determination of the activities in resident apartments by simulating the energy consumption patterns. The simulation takes information about the number of residents information about the apartment envelope and location, and the number of home appliances and their energy capacity as input factors. The simulation workflow can be segmented into steps, as shown in the flow chart (Fig. 1) and described in the subsequent text. Step 1: Define human occupancy scenarios based on the number of residents, age of residents (i.e., adult or child), work location (i.e., work from home or outside), and the number of rooms in the apartment. Step 2: Define probability charts for occupancy (i.e., occupied or unoccupied), room size, thermostat settings, weather condition, and usage status of the appliance (i.e., being used or unused), based on the time of the day and the day of the week. Step 3: Define factors necessary for energy calculations, such as the size of the rooms, building envelope, thermostat settings, building construction aspects, heating and cooling systems energy capacity, appliance energy capacity, weather data, energy source, and energy unit costs.
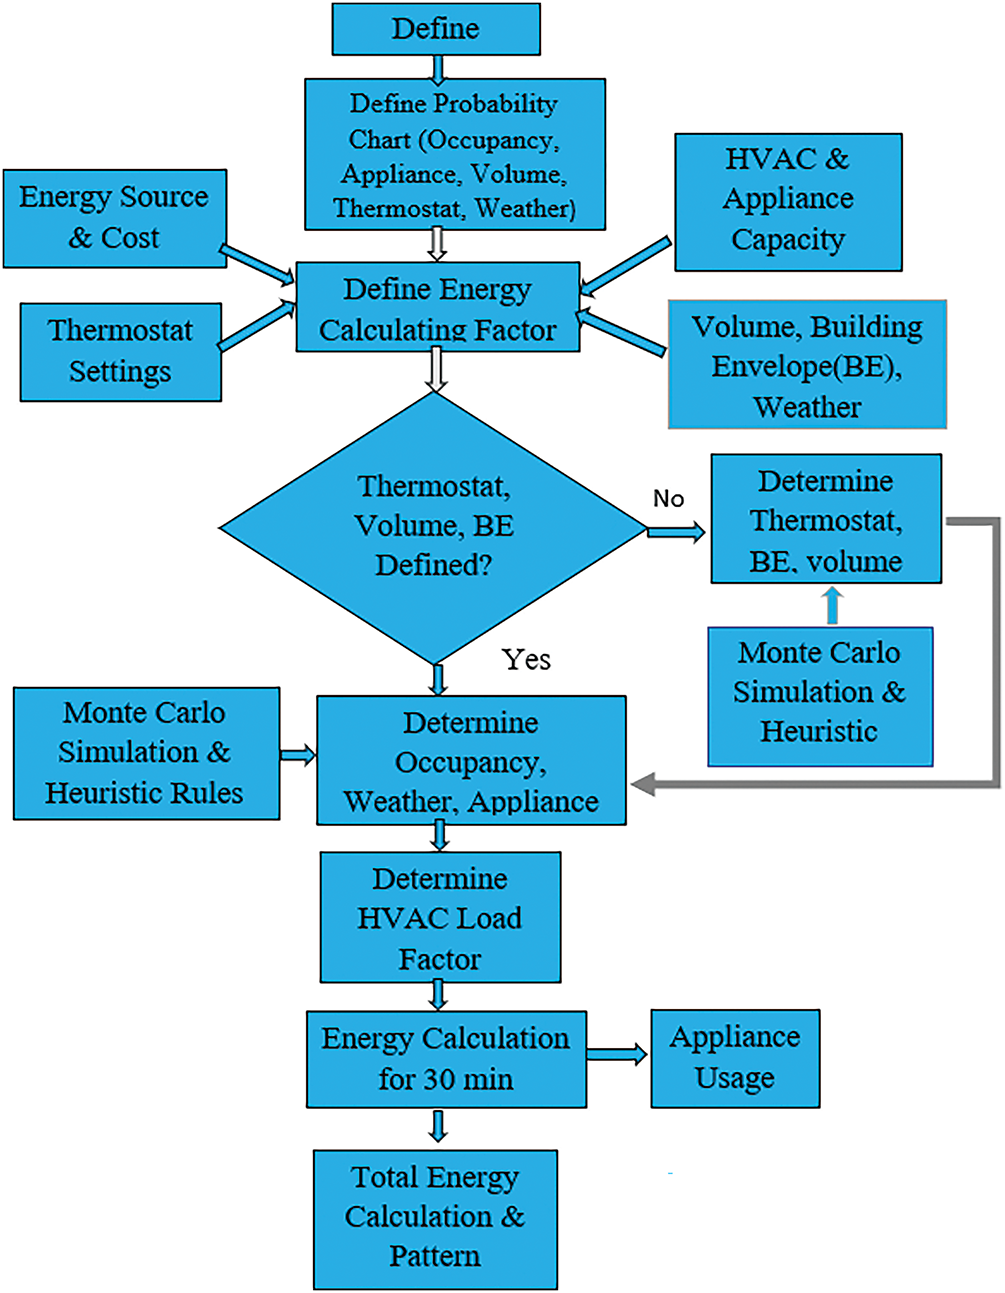
Figure 1: Steps of energy analysis using discrete event simulation
Step 4: Define the value for thermostat settings, room volumes from the user. Step 5: If the user does not provide the input values, then the system will determine the status of the room volume and thermostat settings by Monte Carlo Simulation and Heuristic Rules. Step 6: If at step 4, the user assigns the value for room volume and thermostat, then the system will determine the human occupancy, weather, and the status of the appliance by Monte-Carlo simulation. The Monte-Carlo simulation works by comparing random numbers with the probability chart (from Step 2) to randomly define the occupancy, weather condition, and appliance usage status. Step 7: Assign load factors for the HVAC system for various combinations of occupancy, building envelope, room size, thermostat settings, and weather. The detail load factor is defined only for HVAC, as this is the most energy-consuming component that runs at variable load based on user comfort levels and the weather. For simplification, most of the energy-consuming parts are assumed to operate at full load capacity. Step 8: Calculate energy consumption for every 30 min for one year and a specific scenario from Step 1. Besides, the total energy consumption is calculated for all appliances. Step 9: Finally, the individual equipment total energy consumption pattern is developed for a particular day and over one year.
For this study, five cases are described for the pattern-generating simulation. These cases portray the common scenarios about the residents’ activities and occupancy in the apartment houses. The cases are described below:
Case 1: One-bedroom apartment house for an adult couple without a child: Both adults work at locations external to the house during the same working hours. So, there is a low probability that the living place will be occupied from 9:00 am to 5:00 pm. The probability of the area being occupied varies on weekdays and weekends.
Case 2: One-bedroom apartment without a child, and one person works from home and another person works outside the home: Now, the daytime occupancy will be different because one person will be at home most of the time. At the same time, the probability of appliance usage will be different from Case 1. So, electricity consumption patterns will be different.
Case 3: Two-bedroom apartment house for an adult couple with children: Children could be toddlers or school-going kids, and both adults are working outside the home at the same time with regular work hours. In this case, the occupancy and the usage probability of the appliances will be different. So, the load factor and electricity consumption will be different, which depicts the difference in the resident’s activities due to the presence of children.
Case 4: Two-bedroom apartment with children where one adult works from home and the other works outside the home: In this case, the children and one adult will stay at home, and the place will be occupied all the time. Consequently, the probability of usage will be different, resulting in different electricity consumption patterns.
Case 5: Three-bedroom apartment for student housing: Students’ occupancy-based behavior is highly variant based on their schedule. Also, the home appliances will be distinct from the family apartment. All these will show a different result in energy usage pattern generation.
For the pattern-generating simulation, the system requires input. In this simulation, the user has the flexibility to choose the building envelope, thermostat settings, room volume, building construction time, the geographical position, heating and cooling systems energy specification, fuel type, fuel cost, type of home appliances related to each room, and appliance energy capacity. All these factors have been accounted for as input data. This simulation is interactive, which allows its user to change the value of the variables. The simulation is done in Microsoft Excel® based on the discrete event Monte Carlo Simulation (MCS) using the Visual Basic Application (VBA)®. The uniformly distributed random numbers will be generated. The heuristic rules are applied to compare the automatically generated random numbers and values from the probability chart to determine the occupancy. Similarly, heuristic rules are used to determine the appliance usage status, weather conditions, and thermostat settings. The Monte Carlo Simulation (MCS) method is a powerful modeling tool. It is used to analyze complex mathematical and statistical problems due to its outstanding capability of achieving a closer observance of reality [50]. Here, MCS is used to simulate desired parameters, namely the total energy consumption and energy usage by appliances, at different time slots of a day, based on uniform distributions and the weighted probability of occupancy and appliance usage status. The results are recorded, and the calculation is repeated for other days to acquire a cumulative outcome over several days.
All the energy calculation factors can be divided into two categories-major factors and minor factors. Major factors are those that have a direct impact on energy accounting and are related to the designed case. Major factors are human occupancy, number of residents, and resident workplace system configuration. On the other hand, the minor factors are the ones that are present in varying scenarios related to building envelope, thermostat level, area of the room, number of rooms, weather, and appliances. The goal of this simulation is to generate electricity consumption patterns for the designed cases. This pattern will show what type of appliance has been used at that specific time for a user-specified day. Visual Basic Applications (VBA) is used for executing the simulation, which will be designed to generate results for every day of the year for the five different scenarios. The developed system is user-interactive, where the user has the option to choose from several different inputs to define the relevant situations. Additionally, the user will be able to modify the default input values, such as appliance specifications and appliance usage and occupancy probabilities, and weather data to simulate a customized scenario.
3.3 Energy Consumption Calculation
The energy calculation for any kind of home appliance except HVAC systems can be calculated as:
Energy Consumption = (C × UF × LF × OH)/(Eff × K)
Where,
C = Capacity of the Appliance
LF = Load Factor (%)
UF = Utilization Factor (%)
OH = Operating Hours
Eff = Efficiency of the equipment (100%)
K = Constant, (1000 W/kW)
HVAC energy consumption can be calculated as:
HVAC Electric Cooling = LF × ((C × 12)/(SEER)) × OH
Or, HVAC NG Heating = LF × OH × C
Or, HVAC Electric Heating = {LF × ((C × 3412 Btu/kWh)/HSPF)}/1000 W/kW × OH
Where,
C = Capacity of the Appliance (ton/h or MMBtu/h or kW)
LF = Load Factor (%)
OH = Operating Hours
SEER = Seasonal Energy Efficiency Ratio (Btu/Wh)
HSPF = Heating Seasonal Performance Factor (Btu/Wh).
3.4 Assumptions and Limitations
Several assumptions have been made during the development of this simulation program. The time interval for the simulation has been considered as thirty minutes. Hence, it will not be able to detect any event in terms of occupancy between 0–30 min intervals. The electrical efficiency of every electricity-using appliance is 100%. The load factor for a 30-min interval is the average load factor for HVAC systems. When the room is occupied at a specific time, most of the equipment is probably operational. It is considered that a smart thermostat with zoning control is employed. It has been assumed that any type of improvements in the building envelopes are implemented from the beginning of the month. The effect of ventilation and exhaust air is disregarded during the energy consumption calculation. The possibility of a natural disaster based on weather or other factors is ignored in this simulation. Weather factors are updated only after eight hours. Washing machine, clothes dryer, and dishwasher are operational for thirty minutes at a time. The load factor for all the appliances except HVAC, Water Heater, Refrigerator, and Freezer. The Washing Machine and Dryer have been assumed to be 100%.
There are some limitations to this simulation. Only five cases have been developed. In practical application, there are various other combinations of residents in terms of age, education, and occupation that can arise. The number of rooms directly relates to the designed case. The simulation cannot handle any random numbers for the specification of a varying number of rooms. Apartments and not houses are considered in this research. Regular daily life usable appliance is considered, and any luxury equipment is ignored. Only electricity and natural gas are accounted for as energy sources. Appliance capacity is given in the reference sheet. If actual capacity differs significantly, energy consumption will be different. This simulation is not able to determine HVAC capacities. Nine weather regions are considered. The simulation cannot be specific about the location for weather data. Many input boxes have been used, none of them take any character (alphabets/words) or 0 or anything out of the range. The season factor is generated in one of the rooms and will remain constant for all the other rooms during specific hours.
The total electricity cost and the cost of natural gas are calculated and presented in the following Table 1.

One of this research’s essential purposes is to generate energy consumption patterns for each selected appliance with respect to specific scenarios. Heating and cooling energy consumption graphs are plotted against the months of the year, as shown in Fig. 2. Next, the energy consumptions of all different appliances are plotted for specific months. For example, all appliances’ energy consumption is shown for January in Fig. 3.

Figure 2: HVAC energy consumption summary of 12 months

Figure 3: Appliances energy consumption summary for January
The model will generate HVAC energy consumption graphs for specific days during the year at thirty minutes time intervals. For this example, July 10th has been selected, and the total electricity and natural gas consumption for 24 h at 30 min intervals are shown in Fig. 4.

Figure 4: Total energy consumption pattern for July 10th
It is a summer day, hence only the air conditioning system was operational, and the energy consumption graph is shown in Fig. 5.

Figure 5: HVAC energy consumption pattern for July 10th
In order to improve the graph visualization, appliances are divided into four groups: low capacity (0–100 W), medium capacity (101–500), moderately high capacity (500–1000 W), and high capacity (>1000 W). Additionally, the energy consumption of the stove, kitchen water heater, and restroom water heater is plotted separately in another graph, as the energy source for these appliances can vary between electricity and natural gas. The appliance energy consumption graphs for Case 1 on 10th July are shown in Figs. 6–10.
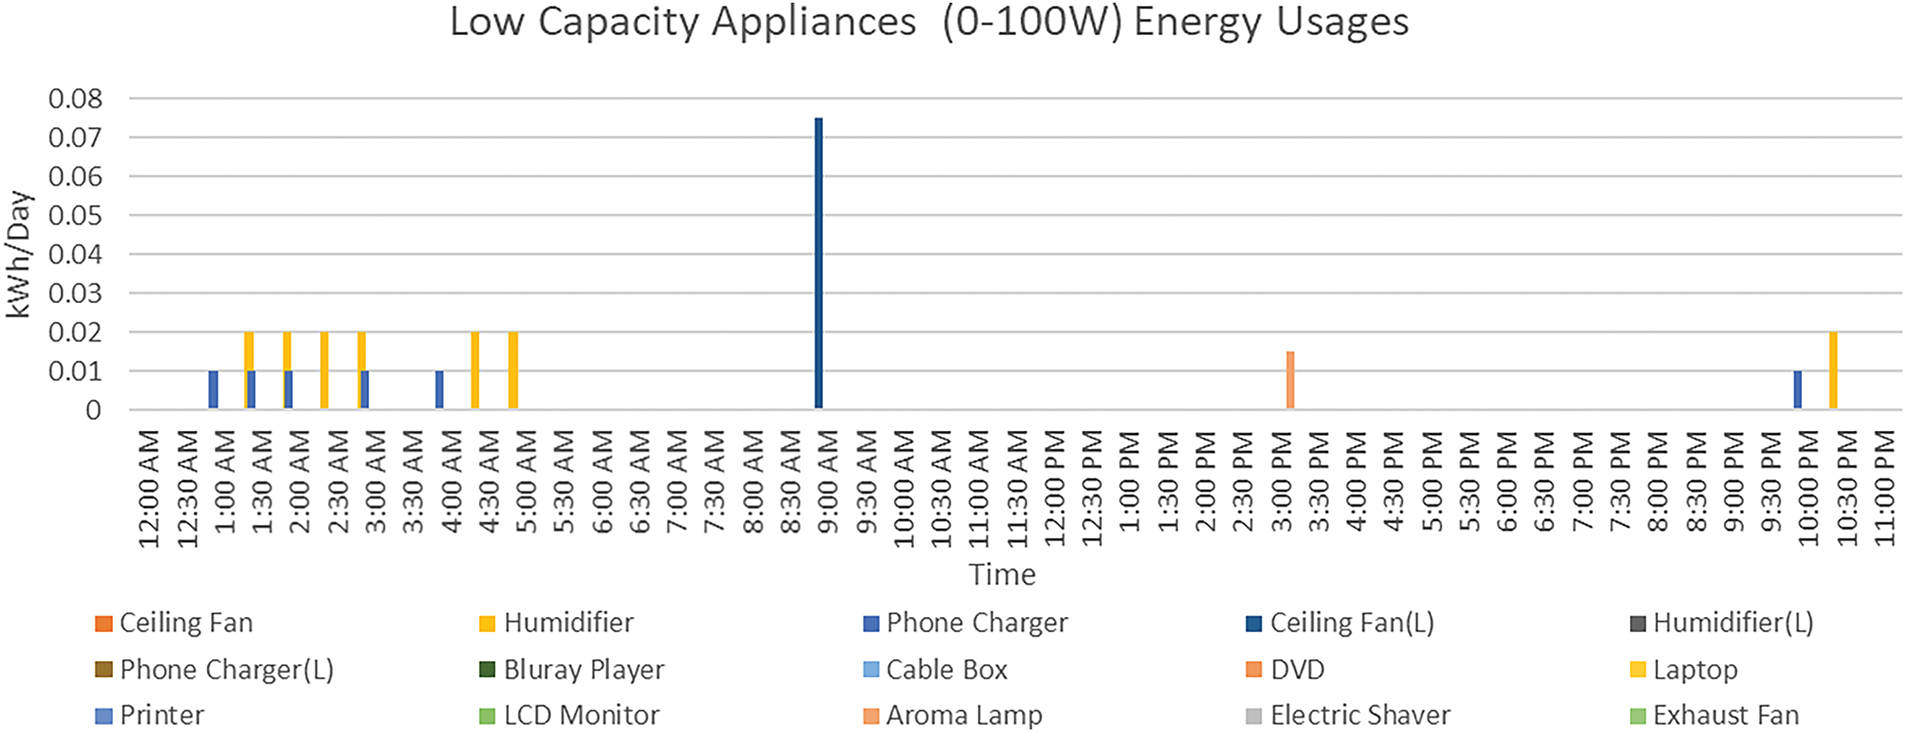
Figure 6: Low-capacity appliances energy consumption pattern of July 10th

Figure 7: Medium-capacity appliances energy consumption pattern of July 10th

Figure 8: Moderately high-capacity appliances energy consumption pattern of July 10th

Figure 9: High-capacity appliances energy consumption pattern of July 10th

Figure 10: Stove and water heater energy consumption pattern of July 10th
4.2 Verification of Simulation Results
The simulated total one-year electricity and natural gas consumption and cost were found to vary for five cases, as summarized in Table 2. Also, the HVAC energy consumption patterns for one year for all five cases are shown in Fig. 11.

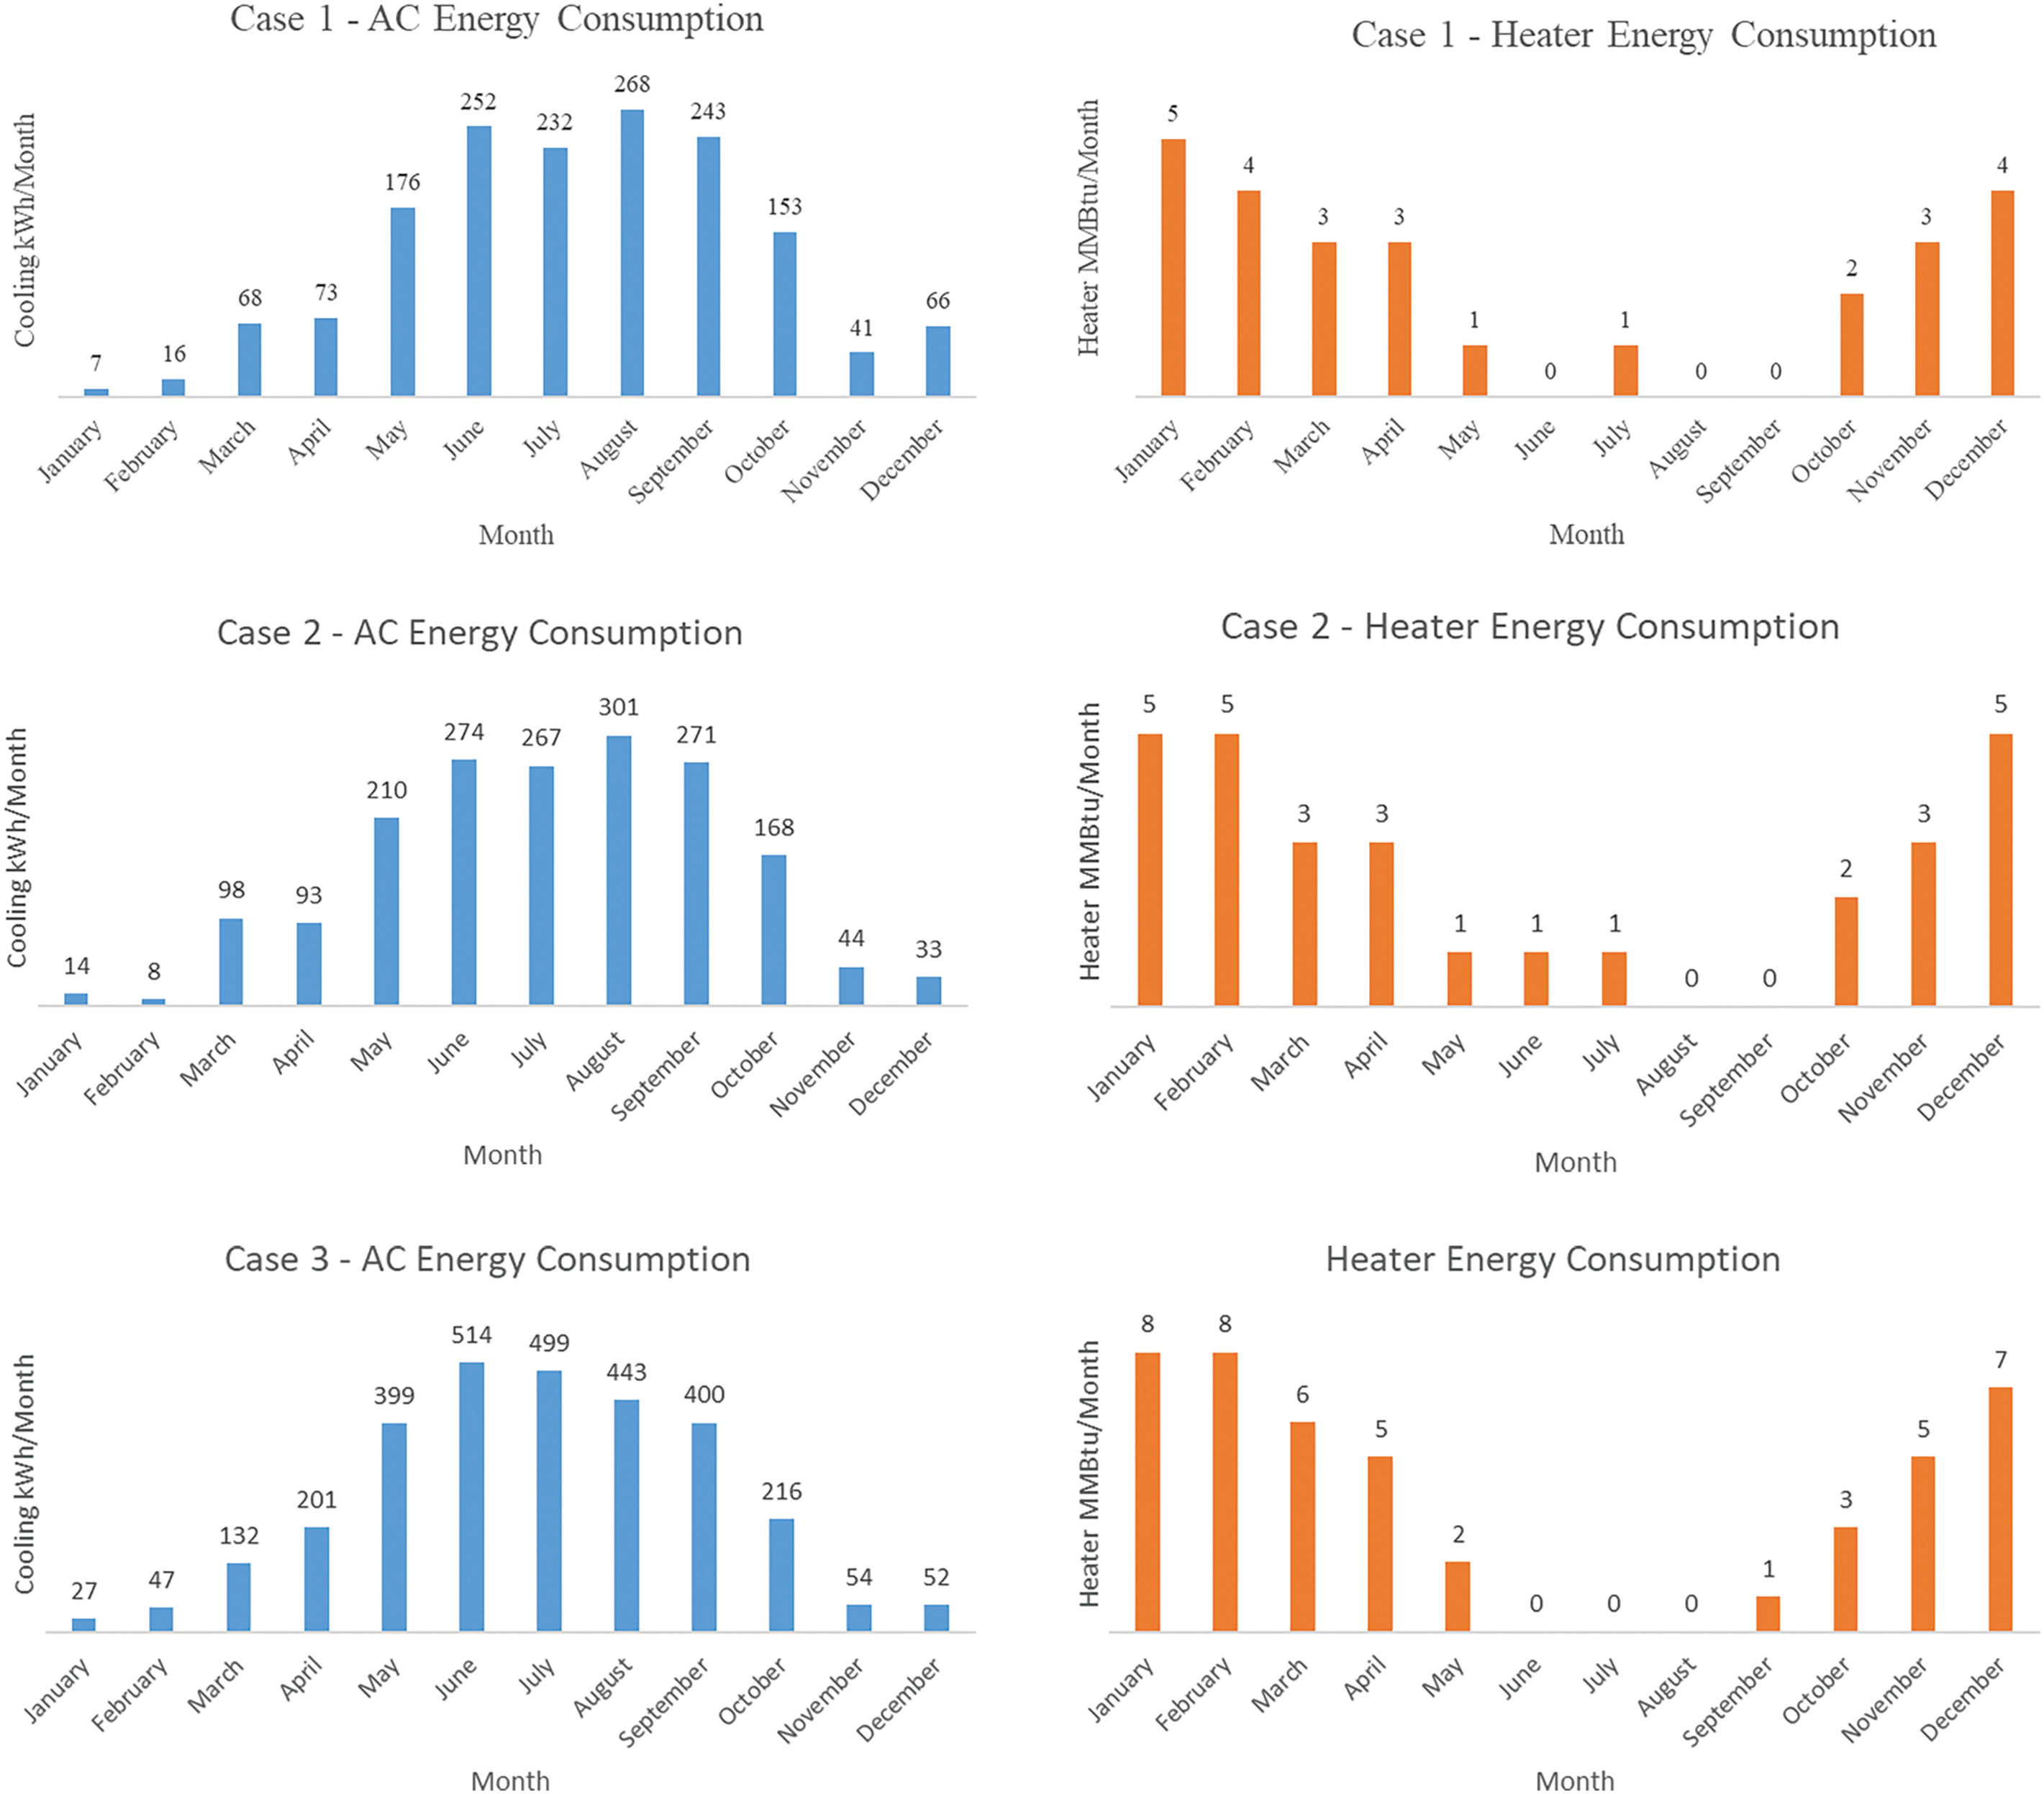
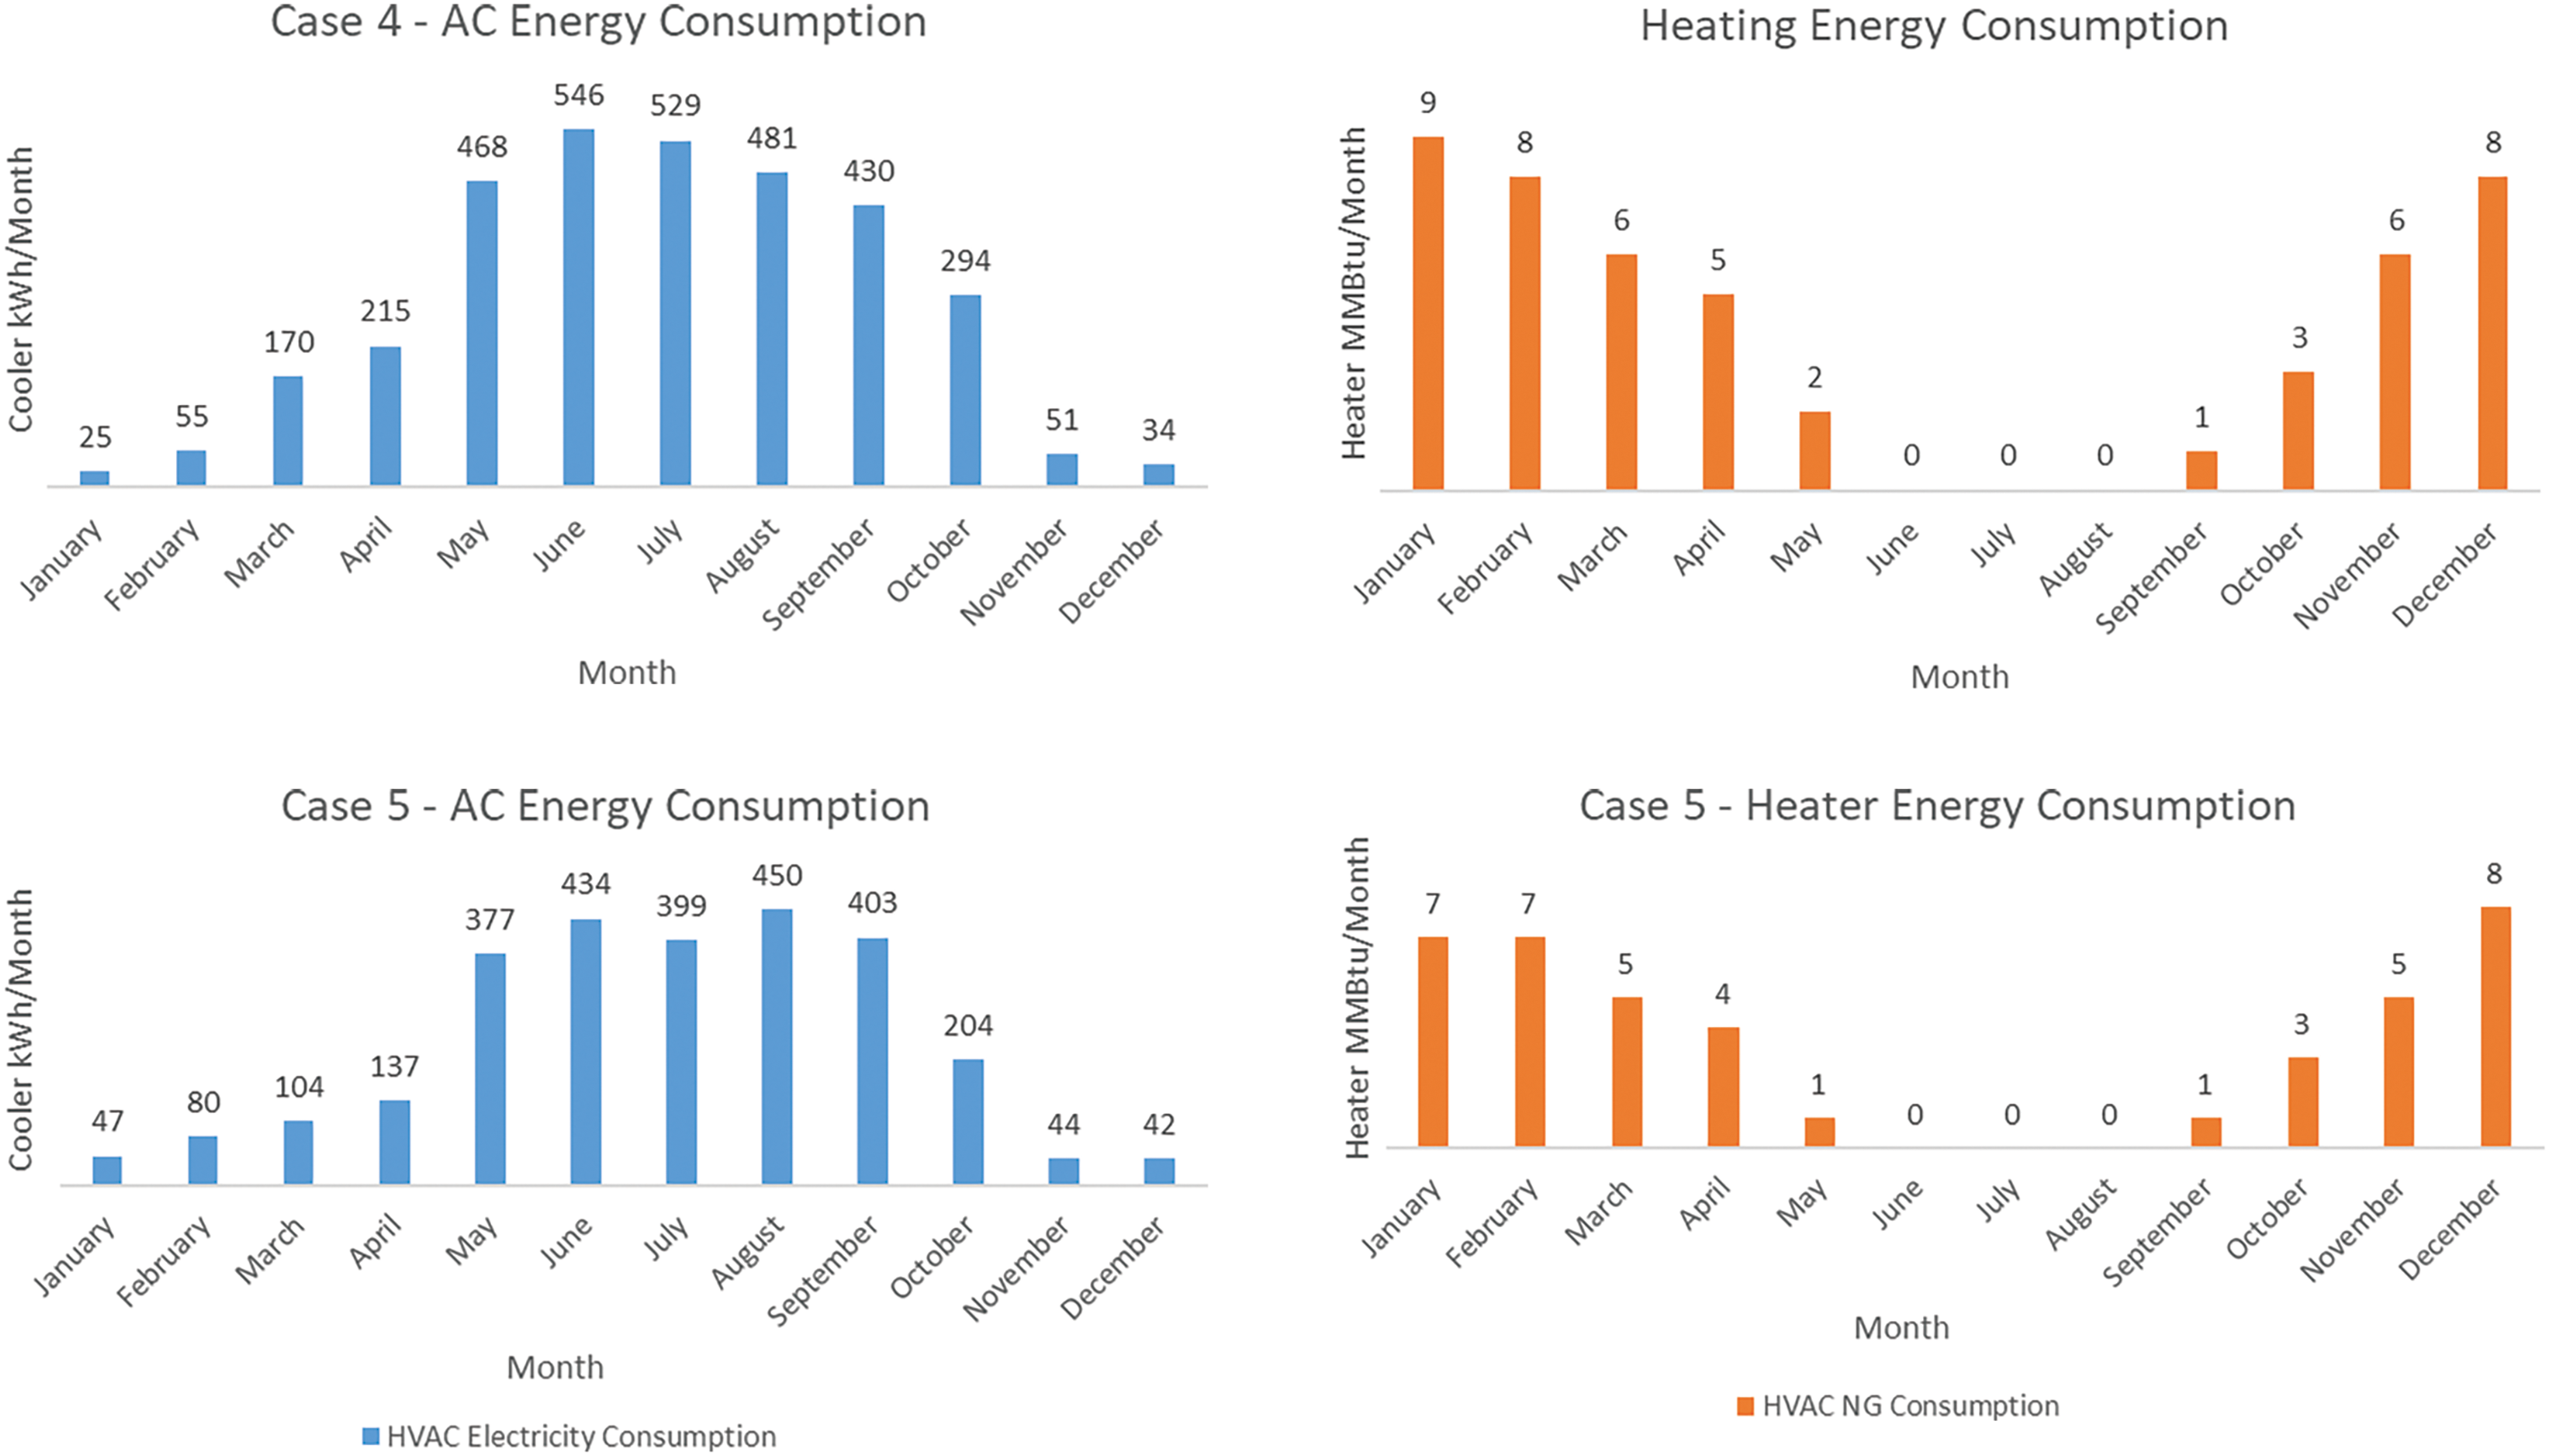
Figure 11: One-year energy consumption of HVAC for five different cases
To ascertain the validity of the simulated results, total electricity consumption from case 1 and case 2 was compared with real energy consumption data. Two identical one-bedroom apartment houses located in Morgantown, West Virginia, in the USA, were selected. First house occupancy is similar to case 1 and second house occupancy is similar to case 2. The insulation of the house is excellent, and there were no alterations to the building envelope. The apartment is equipped with a natural gas heater, the cost of which was not the resident’s responsibility. Hence, in this case, only the electricity cost was verified. Air conditioning unit capacity is 1.5 t, and all other major appliances are the same for both apartments. Cooking Stove and water heater are electricity-based, with the same capacity. Twelve-month energy consumptions for the two cases are shown in Fig. 12.

Figure 12: Simulated results vs. real data one-year electricity consumption comparison
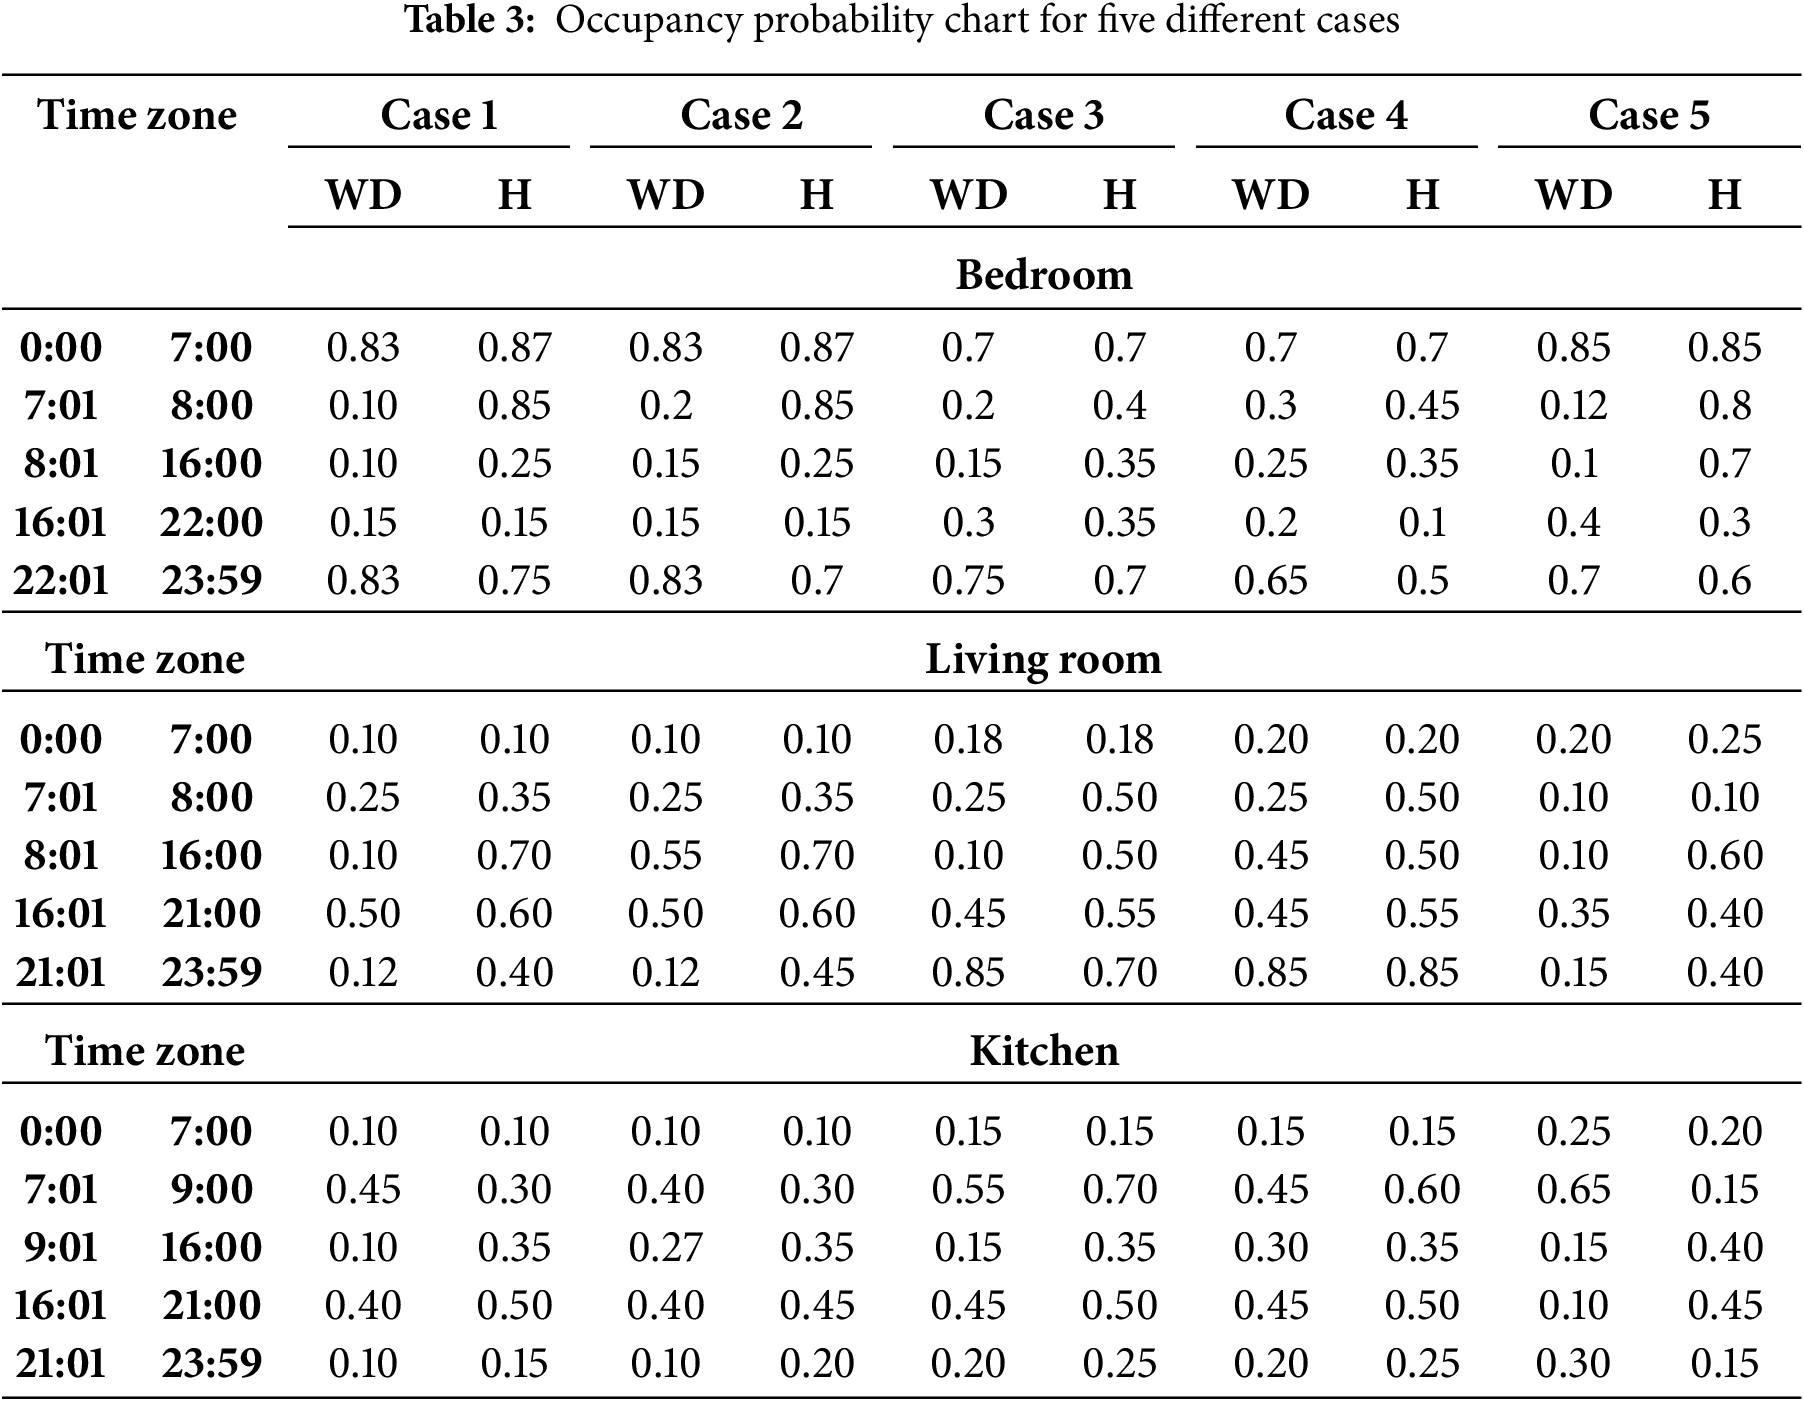
The probability for human occupancy varies among the cases. For example, the probability of human occupancy is lower for case 1 than for case 2, despite both scenarios utilizing a one-bedroom apartment. In case 1, the residents are two adults who work outside the building in the daytime, while in case 2, one adult works from home and one works outside. Similarly, case 3 and case 4 are two-bedroom apartments where residents are two adults with children, but the residents’ different workplace locations lead to different occupancy probabilities. The case 5 is designed as a three-bedroom apartment with three student residents, and the residents’ schedules are quite different from each other. Therefore, in all these cases, the occupancy and, subsequently, the energy consumption will be different. The probability chart of five cases for the bedroom, living room, and kitchen is shown in Table 3 for different time intervals on weekdays (WD) and holidays (H).
A summary of the energy consumption results and graphs are presented in Fig. 13. The summary results indicate that human occupancy has a significant influence on the energy consumption, usage, and cost.

Figure 13: One-year energy consumption and costs for five different cases
The type and number of appliances are important parameters that are influenced by resident activities. To examine the impact of appliance energy consumption, case 1 and case 5 were considered as example scenarios. In case 1, at first, the simulation was executed with all the appliances selected. Next, a subset of appliances was considered for incorporation. The energy consumption with all appliances vs. the use of only selected appliances for case 1 is shown in Fig. 14. In case 5, student apartments usually utilize many laptop computers, entertainment systems, and appliances than a usual household does. Therefore, a total of three laptops, one audiovisual instrument, a cable box, a printer, and a dishwasher were considered, in addition to the appliances listed in case 1. The energy consumption comparison between all appliances and selected appliances for case 5 is shown in Fig. 15.
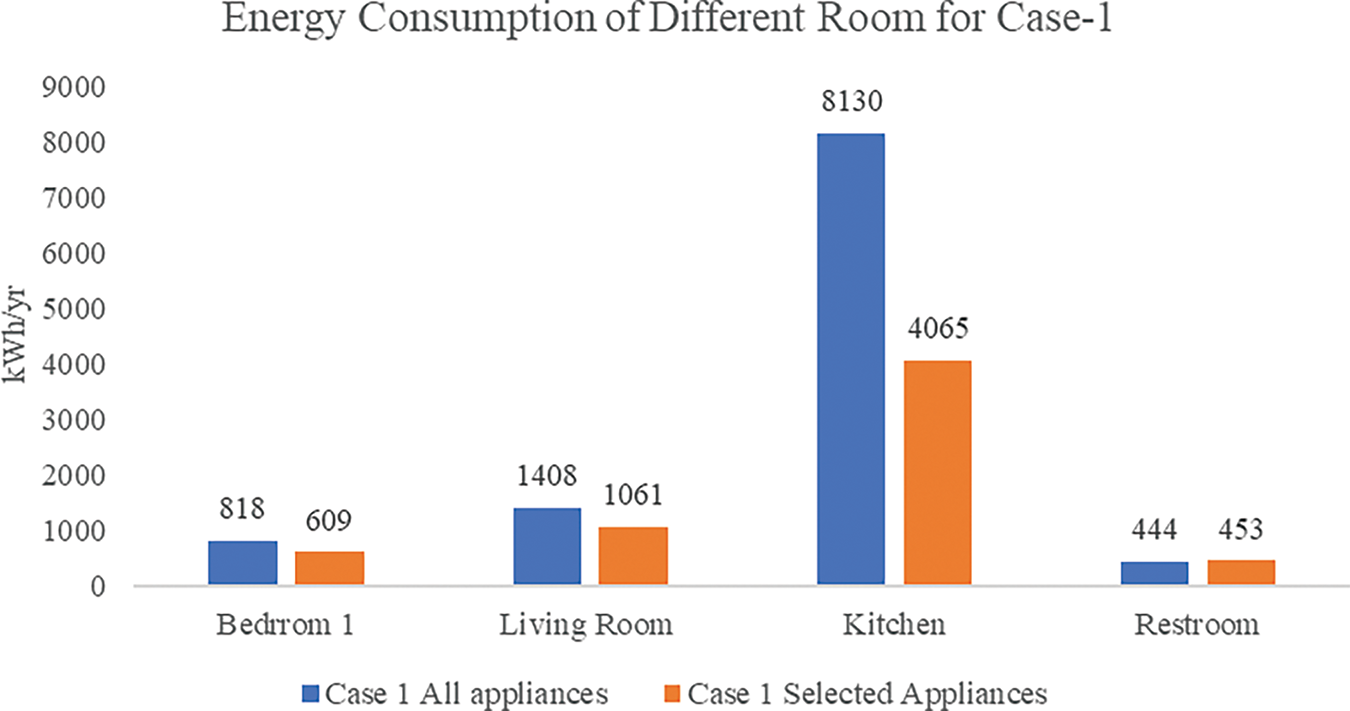
Figure 14: Energy consumption for case 1 with different appliance combinations

Figure 15: Energy consumption for case 5 with different appliances combinations in the living room and kitchen
The resident’s presence at the house also impacts the energy consumption. During the weekend, the apartment will be more occupied compared to the weekdays. Besides, there will be more activity in the daytime on weekends, which indicates more appliances are being used. As a result, energy consumption during the weekend will be high. To identify if a day of the year is weekday or a weekend, the day of the year is first divided by 6. If the remainder is 0 or 1, it would be the weekend for this simulation. Energy consumption was found to be higher during weekends compared to weekdays (Fig. 16).

Figure 16: Energy consumption weekends vs. weekdays
The graph shows that the weekend energy consumption for case 3 is higher than case 4, despite both being 2-bedroom apartments and having the same number of residents. The reason for the low energy consumption for case 4 (occupied on weekdays) is that the household workload was distributed throughout the week.
Occupancy and the appliance usage depend on the time of the day, influenced by the residents’ age and work location. If the residents work from home, or if there are children at home, then the place will be more occupied and appliance usage probability will be high. Therefore, different cases can have the same number of rooms, but their energy consumption will differ due to the occupancy difference. Fig. 17 compares the energy consumption between cases with the same room numbers-case 1 vs. case 2 (1-bedroom apartment), case 3 vs. case 4 (2-bedroom apartment), and case 5 (3-bedroom apartment). The energy consumption was different at the same time of the day, despite having the same number of rooms.

Figure 17: Energy consumption comparison for the same time of day for different cases
This pattern-generating simulation tool is developed to identify the human occupancy level and resident activity level. In developing an energy consumption simulation tool, several factors that directly impact energy consumption have been considered. These factors include the number of residents, age of residents, residents’ workplace location, type of appliances, day of the week, and time of the day depict the occupancy and inside activities of that specific building space. In this study, the effects of these factors on energy consumption have been verified. This simulation is a user-driven simulation with realistic data options for the user, developed in Microsoft Excel® and built with a Visual Basic Application (VBA)®. Here, the Monte Carlo Simulation method and heuristic rules are applied to enable the determination of various parametric values. The simulation allows the user to choose appliances and their capacity, building conditions, and weather-related anomalies over time. The study computes the results of the detailed energy consumption patterns. These patterns represent the occupancy and the activity of the people inside the living spaces. The generated patterns can be compared with real-world data in similar scenarios. A discrepancy between the simulated and real data may indicate unusual activity or occupancy. In other cases, energy consumption in a case with unusual occupancy or activities can be simulated, and any real data, such as the simulated data, may also indicate unusual human activities. This research can pave the way for commercial entities and stakeholders to study various appliance usage patterns to develop advanced products. Additionally, authoritative entities can evaluate human activities within apartment spaces using data analytics simulation approaches for varying reasons.
The simulation results have been verified by comparing the scenarios with varying parameter combinations. The summary of the analysis is listed below:
• The energy consumption is high with the same building specifications, number of rooms, appliances, and regional location if the place is more occupied.
• The energy consumption pattern shows that most of the energy usage should happen in the morning and evening time within a standard everyday lifestyle.
• A number of appliances and their type also make a difference in energy consumption, while occupancy, weather, and building parameters remain the same.
The energy consumption pattern shows that the place will be more occupied on weekends, and most of the appliances will be used compared with weekdays.
Several assumptions have been made to retain the core benefit derived from the model. This simulation can be updated with more realistic values and more cases depicting other scenarios concerning future work. The possible future work for this research is listed below:
• This study only considers five scenarios to show how energy consumption patterns will reveal human activity within living spaces. More scenarios can be included to make the simulation more versatile. Detailed weather data will make the results more accurate. Besides, in this work, only the USA weather has been considered, and it is possible to extend its applicability to other countries.
• To better visualize human activities within living spaces, a smaller time interval frequency than thirty minutes should be considered.
• The occupancy probability chart and appliance usage probability chart can be updated with values for every hour to make a more realistic model and enable robust simulation.
• Including additional appliances will make this simulation more usable for diverse scenarios.
• Detailed insulation types, building construction materials, and the ventilation system can add to the viability of this research.
This research focused on apartments. However, the future work can include townhouses and single-family homes.
Acknowledgement: The authors would like to express their sincere gratitude to the anonymous reviewers for their valuable comments and constructive suggestions, which have significantly improved the quality of this manuscript.
Funding Statement: The authors received no specific funding for this study.
Author Contributions: The authors confirm contribution to the paper as follows: study conception and design: Bhaskaran Gopalakrishnan, Rupa Das; data collection: Rupa Das; analysis and interpretation of results: Rupa Das, Roseline Mostafa; draft manuscript preparation: Roseline Mostafa, Rupa Das. All authors reviewed the results and approved the final version of the manuscript.
Availability of Data and Materials: The data that support the findings of this study are available from the corresponding author, Bhaskaran Gopalakrishnan, upon reasonable request.
Ethics Approval: Not applicable.
Conflicts of Interest: The authors declare no conflicts of interest to report regarding the present study.
Nomenclature
| AAL | Ambient-Assisted Living |
| AI | Artificial Intelligence |
| ANN | Artificial Neural Network |
| AMI | Advanced Metering Infrastructure |
| AMR | Automated Meter Reading |
| COP | Coefficient of Performance |
| DFRWS | Digital Forensic Research Workshop |
| DM | Digital Microtechnology |
| DR | Demand Response |
| EE | Energy Efficiency |
| EIA | Energy Information Administration |
| EUI | Energy Use Intensity |
| GDP | Gross Domestic Product |
| GHG | Green House Gas |
| HEMS | Home Energy Management Systems |
| HSPF | Heating Seasonal Performance Factor |
| HVAC | Heating, ventilation, and Air Conditioning |
| IENs | Intelligent Energy Networks |
| IoT | Internet of Things |
| LSTM | Long-Short Term Memory |
| MCS | Monte Carlo Simulation |
| NILM | Non-intrusive load monitoring |
| SEER | Seasonal Energy Efficiency Ratio |
| SM | Smart Meter |
| VBA | Visual Basic Application |
References
1. Palmer G. A road map for digital forensic research. In: Proceedings of the First Digital Forensic Research Workshop; 2001 Aug 7–8; Utica, NY, USA. p. 27–30. [Google Scholar]
2. Almeida A, Azkune G. Predicting human behaviour with recurrent neural networks. Appl Sci. 2018;8(2):305. doi:10.3390/app8020305. [Google Scholar] [CrossRef]
3. Chaaraoui AA, Padilla-López JR, Ferrández-Pastor FJ, Nieto-Hidalgo M, Flórez-Revuelta F. A vision-based system for intelligent monitoring: human behaviour analysis and privacy by context. Sensors. 2014;14(5):8895–925. doi:10.3390/s140508895. [Google Scholar] [PubMed] [CrossRef]
4. Pentland A, Liu A. Modeling and prediction of human behavior. Neural Comput. 1999;11(1):229–42. [Google Scholar] [PubMed]
5. Sun Q, Li H, Ma Z, Wang C, Campillo J, Zhang Q, et al. A comprehensive review of smart energy meters in intelligent energy networks. IEEE Internet Things J. 2016;3(4):464–79. doi:10.1109/jiot.2015.2512325. [Google Scholar] [CrossRef]
6. Farhangi H. The path of the smart grid. IEEE Power Energy Mag. 2010;8(1):18–28. doi:10.1109/mpe.2009.934876. [Google Scholar] [CrossRef]
7. Depuru SSSR, Wang L, Devabhaktuni V, Gudi N. Smart meters for power grid—challenges, issues, advantages and status. In: Proceedings of the 2011 IEEE/PES Power Systems Conference and Exposition; 2011 Mar 20–23; Phoenix, AZ, USA. p. 1–7. [Google Scholar]
8. Mey A, Hoff S. Nearly half of all U.S. electricity customers have smart meters [Internet]. Washington, DC, USA: U.S. Energy Information Administration. [cited 2025 May 19]. Available from: https://www.eia.gov/todayinenergy/detail.php?id=34012#. [Google Scholar]
9. Fumo N, Rafe Biswas MA. Regression analysis for prediction of residential energy consumption. Renew Sustain Energy Rev. 2015;47(8):332–43. doi:10.1016/j.rser.2015.03.035. [Google Scholar] [CrossRef]
10. Hoşgör E, Fischbeck PS. Virtual home energy auditing at scale: predicting residential energy efficiency using publicly available data. Energy Build. 2015;92(2):67–80. doi:10.1016/j.enbuild.2015.01.037. [Google Scholar] [CrossRef]
11. Soldo B, Potočnik P, Šimunović G, Šarić T, Govekar E. Improving the residential natural gas consumption forecasting models by using solar radiation. Energy Build. 2014;69(31):498–506. doi:10.1016/j.enbuild.2013.11.032. [Google Scholar] [CrossRef]
12. Elsawaf N, Abdel-Salam T, Pagliari L. Evaluation of heat pumps usage and energy savings in residential buildings. Int J Energy Envion. 2012;3(3):399–408. [Google Scholar]
13. Nie H, Kemp R. Index decomposition analysis of residential energy consumption in China: 2002–2010. Appl Energy. 2014;121(2):10–9. doi:10.1016/j.apenergy.2014.01.070. [Google Scholar] [CrossRef]
14. Bianco V, Manca O, Nardini S. Linear regression models to forecast electricity consumption in Italy. Energy Sources B Econ Plan Policy. 2013;8(1):86–93. doi:10.1080/15567240903289549. [Google Scholar] [CrossRef]
15. Chen J, Wang X, Steemers K. A statistical analysis of a residential energy consumption survey study in Hangzhou. China Energy Build. 2013;66:193–202. doi:10.1016/j.enbuild.2013.07.045. [Google Scholar] [CrossRef]
16. Gans W, Alberini A, Longo A. Smart meter devices and the effect of feedback on residential electricity consumption: evidence from a natural experiment in Northern Ireland. Energy Econ. 2013;36:729–43. doi:10.1016/j.eneco.2012.11.022. [Google Scholar] [CrossRef]
17. Raffio G, Isambert O, Mertz G, Schreier C, Kissock K. Targeting residential energy assistance. Energy Sustain Conf Proc. 2007;47977:489–96. doi:10.1115/es2007-36080. [Google Scholar] [CrossRef]
18. Mattinen MK, Heljo J, Vihola J, Kurvinen A, Lehtoranta S, Nissinen A. Modeling and visualization of residential sector energy consumption and greenhouse gas emissions. J Clean Prod. 2014;81(21):70–80. doi:10.1016/j.jclepro.2014.05.054. [Google Scholar] [CrossRef]
19. Mastrucci A, Baume O, Stazi F, Leopold U. Estimating energy savings for the residential building stock of an entire city: a GIS-based statistical downscaling approach applied to Rotterdam. Energy Build. 2014;75(3):358–67. doi:10.1016/j.enbuild.2014.02.032. [Google Scholar] [CrossRef]
20. Schleich J, Klobasa M, Gölz S, Brunner M. Effects of feedback on residential electricity demand—findings from a field trial in Austria. Energy Policy. 2013;61(3):1097–106. doi:10.1016/j.enpol.2013.05.012. [Google Scholar] [CrossRef]
21. Ndiaye D, Gabriel K. Principal component analysis of the electricity consumption in residential dwellings. Energy Build. 2011;43(2–3):446–53. doi:10.1016/j.enbuild.2010.10.008. [Google Scholar] [CrossRef]
22. Chicco G. Overview and performance assessment of the clustering methods for electrical load pattern grouping. Energy. 2012;42(1):68–80. doi:10.1016/j.energy.2011.12.031. [Google Scholar] [CrossRef]
23. Rhodes JD, Cole WJ, Upshaw CR, Edgar TF, Webber ME. Clustering analysis of residential electricity demand profiles. Appl Energy. 2014;135(2):461–71. doi:10.1016/j.apenergy.2014.08.111. [Google Scholar] [CrossRef]
24. Al-Wakeel A, Wu J. K-means based cluster analysis of residential smart meter measurements. Energy Proc. 2016;88(3):754–60. doi:10.1016/j.egypro.2016.06.066. [Google Scholar] [CrossRef]
25. Zhou K, Yang S, Shao Z. Household monthly electricity consumption pattern mining: a fuzzy clustering-based model and a case study. J Clean Prod. 2017;141:900–8. [Google Scholar]
26. Gouveia JP, Seixas J. Unraveling electricity consumption profiles in households through clusters: combining smart meters and door-to-door surveys. Energy Build. 2016;116(1):666–76. doi:10.1016/j.enbuild.2016.01.043. [Google Scholar] [CrossRef]
27. Yang T, Ren M, Zhou K. Identifying household electricity consumption patterns: a case study of Kunshan. China Renew Sustain Energy Rev. 2017;91:861–8. doi:10.1016/j.rser.2018.04.037. [Google Scholar] [CrossRef]
28. Beaudin M, Zareipour H. Home energy management systems: a review of modelling and complexity. Renew Sustain Energy Rev. 2015;45:318–35. doi:10.1016/j.rser.2015.01.046. [Google Scholar] [CrossRef]
29. Yildiz B, Bilbao JI, Dore J, Sproul AB. Recent advances in the analysis of residential electricity consumption and applications of smart meter data. Appl Energy. 2017;208(1):402–27. doi:10.1016/j.apenergy.2017.10.014. [Google Scholar] [CrossRef]
30. Poznaka L, Laicane I, Blumberga D, Blumberga A, Rosa M. Analysis of electricity user behavior: case study based on results from extended household survey. Energy Proc. 2015;72(4):79–86. doi:10.1016/j.egypro.2015.06.012. [Google Scholar] [CrossRef]
31. McKenna E, Richardson I, Thomson M. Smart meter data: balancing consumer privacy concerns with legitimate applications. Energy Policy. 2012;41:807–14. doi:10.1016/j.enpol.2011.11.049. [Google Scholar] [CrossRef]
32. Xie Y, Stravoravdis S. Generating occupancy profiles for building simulations using a hybrid GNN and LSTM framework. Energies. 2023;16(12):4638. doi:10.3390/en16124638. [Google Scholar] [CrossRef]
33. Ahmed O, Sezer N, Ouf M, Wang L, Hassan IG. State-of-the-art review of occupant behavior modeling and implementation in building performance simulation. Renew Sustain Energy Rev. 2023;185(2):113558. doi:10.1016/j.rser.2023.113558. [Google Scholar] [CrossRef]
34. Ding Y, Han S, Tian Z, Yao J, Chen W, Zhang Q. Review on occupancy detection and prediction in building simulation. Build Simul. 2022;15(3):333–56. doi:10.1007/s12273-021-0813-8. [Google Scholar] [CrossRef]
35. Ding Y, Pan X, Chen W, Tian Z, Wang Z, He Q. Prediction method for office building energy consumption based on an agent-based model considering occupant-equipment interaction behavior. Energies. 2022;15(22):8689. doi:10.3390/en15228689. [Google Scholar] [CrossRef]
36. Hong T, Chen Y, Belafi Z, D’Oca S. Occupant behavior models: a critical review of implementation and representation approaches in building performance simulation programs. Build Simul. 2018;11(1):1–14. doi:10.1007/s12273-017-0396-6. [Google Scholar] [CrossRef]
37. Sydora C, Nawaz F, Bindra L, Stroulia E. Building occupancy simulation and analysis under virus scenarios. ACM Trans Spat Algorithms Syst. 2022;8(3):1–20. doi:10.1145/3486898. [Google Scholar] [CrossRef]
38. Dong B, Yan D, Li Z, Jin Y, Feng X, Fontenot H. Modeling occupancy and behavior for better building design and operation—a critical review. Build Simul. 2018;11(5):899–921. doi:10.1007/s12273-018-0452-x. [Google Scholar] [CrossRef]
39. Tang R, Wang S, Sun S. Impacts of technology-guided occupant behavior on air-conditioning system control and building energy use. Build Simul. 2021;14(1):209–17. doi:10.1007/s12273-020-0605-6. [Google Scholar] [CrossRef]
40. Karki V, Mostafa R, Gopalakrishnan B, Johnson DR. Determination of effectiveness of energy management system in buildings. Energy Eng. 2023;120(2):561–86. doi:10.32604/ee.2023.025218. [Google Scholar] [CrossRef]
41. Mundu MM, Nnamchi SN, Sempewo JI, Uti DE. Simulation modeling for energy systems analysis: a critical review. Energy Inf. 2024;7(1):75. doi:10.1186/s42162-024-00374-8. [Google Scholar] [CrossRef]
42. Su Y, Jin Q, Zhang S, He S. A review on the energy in buildings: current research focus and future development direction. Heliyon. 2024;10(12):e32869. doi:10.1016/j.heliyon.2024.e32869. [Google Scholar] [PubMed] [CrossRef]
43. Hakawati B, Mousa A, Draidi F. Smart energy management in residential buildings: the impact of knowledge and behavior. Sci Rep. 2024;14(1):1702. doi:10.1038/s41598-024-51638-y. [Google Scholar] [PubMed] [CrossRef]
44. Rastegarpour S, Ferrarini L. Energy management in buildings: lessons learnt for modeling and advanced control design. Front Energy Res. 2022;10:899866. doi:10.3389/fenrg.2022.899866. [Google Scholar] [CrossRef]
45. Dutta PK, El-Kenawy SM, Ali G, Dhoska K. An energy consumption monitoring and control system in buildings using Internet of Things. Babylon J Internet Things. 2023;2023:38–47. doi:10.58496/bjiot/2023/006. [Google Scholar] [CrossRef]
46. Chatzikonstantinidis K, Afxentiou N, Giama E, Fokaides PA, Papadopoulos AM. Energy management of smart buildings during crises and digital twins as an optimisation tool for sustainable urban environment. Int J Sustain Energy. 2025;44(1):2455134. doi:10.1080/14786451.2025.2455134. [Google Scholar] [CrossRef]
47. Basholli F, Daberdini A. Monitoring and assessment of the quality of electricity in a building. Eng Appl. 2023;2(1):32–48. [Google Scholar]
48. Shahee A, Abdoos M, Aslani A, Zahedi R. Reducing the energy consumption of buildings by implementing insulation scenarios and using renewable energies. Energy Inf. 2024;7(1):18. doi:10.1186/s42162-024-00311-9. [Google Scholar] [CrossRef]
49. Mischos S, Dalagdi E, Vrakas D. Intelligent energy management systems: a review. Artif Intell Rev. 2023;56(10):11635–74. doi:10.1007/s10462-023-10441-3. [Google Scholar] [CrossRef]
50. Zio E. The monte carlo simulation method for system reliability and risk analysis. London, UK: Springer. 198 p. [Google Scholar]
Cite This Article
 Copyright © 2025 The Author(s). Published by Tech Science Press.
This work is licensed under a Creative Commons Attribution 4.0 International License , which permits unrestricted use, distribution, and reproduction in any medium, provided the original work is properly cited.
 Downloads
 Citation Tools