
 Submit a Paper
 Propose a Special lssue
 Open Access
ARTICLE

Research on Optimal Scheduling of Integrated Energy Systems with Wind-Photovoltaic-Biogas-Storage Considering Carbon Capture Systems and Power-to-Gas Coordination
1 Economic and Technological Research Institute, State Grid Inner Mongolia Eastern Electric Power Co., Ltd., Hohhot, 010020, China
2 Inner Mongolia Hengsheng New Energy Technology Co., Ltd., Baotou, 014030, China
* Corresponding Author: Jianfeng Liu. Email:
Energy Engineering 2025, 122(8), 3155-3176. https://doi.org/10.32604/ee.2025.065753
Received 21 March 2025; Accepted 16 May 2025; Issue published 24 July 2025
 View Full Text
 Download PDF
Abstract
In order to promote the utilization level of new energy resources for local and efficient consumption, this paper introduces the biogas (BG) fermentation technology into the integrated energy system (IES). This initiative is to study the collaborative and optimal scheduling of IES with wind power (WP), photovoltaic (PV), and BG, while integrating carbon capture system (CCS) and power-to-gas (P2G) system. Firstly, the framework of collaborative operation of IES for BG-CCS-P2G is constructed. Secondly, the flexible scheduling resources of the source and load sides are fully exploited, and the collaborative operation mode of CCS-P2G is proposed to establish a model of IES with WP, PV, and BG multi-energy flow coupling. Then, with the objective of minimizing the intra-day operating cost and the constraints of system energy balance and equipment operating limits, the IES with WP, PV, and BG collaborative optimal scheduling model is established. Finally, taking into account the uncertainty of the output of WP and PV generation, the proposed optimal scheduling model is solved by CPLEX, and its validity is verified by setting several scenarios. The results show that the proposed collaborative operation mode and optimal scheduling model can realize the efficient, low-carbon, and economic operation of the IES with WP, PV, and BG and significantly enhance the utilization of new energy for local consumption.Keywords
With the increasing depletion of fossil energy and the frequent natural disasters caused by the greenhouse effect, clean and efficient energy conversion and utilization have become an important development direction and the main way of change in the global energy field [1]. The proposal of China’s “carbon peaking and carbon neutrality” target promotes the transformation of energy and a low-carbon economy. It also puts forward the important initiative of building a new modern energy system by developing and consuming new energy according to local conditions [2]. Although the WP, PV, and other clean energy research technologies tend to mature, the development of new energy is facing multiple challenges, such as large-scale development, efficient local consumption, and the need to ensure a safe and reliable supply of electricity. In this context, multi-energy complementary IES is the key platform for connecting energy supply and demand. It can realize the coupling and joint supply of multiple energy sources through rational and optimal dispatching and distribution of heterogeneous energy sources, improve the comprehensive utilization efficiency of energy, and effectively enhance the capacity of renewable energy consumption and the reliability of energy supply. IES contains power, gas, heat, and other energy structures that can be coordinated and optimized through the energy conversion devices, storage facilities, and other equipment formed by the production, supply, and distribution of integrated systems. IES is an important way to realize the goal of the “carbon peaking and carbon neutrality” strategy, which has become a hot research topic for researchers.
P2G technology provides a new way of energy conversion and spatial-temporal transfer. This technology solves the problem of renewable energy accommodation and realizes peak cutting and valley filling of power load by converting WP, PV, or other energy into natural gas, which is easy to be stored [3]. At present, P2G is widely used to power and gas coupled energy systems to improve WP and PV accommodation and the flexibility of system operation. In [4], the authors proposed a joint application of P2G and combined heat and power (CHP) units in IES. The superiority of energy utilization efficiency is verified through simulation. In [5], the authors proposed a model for coordinated optimization of micro gas turbine (GT) and P2G systems. This model supplies natural gas to micro GT through the P2G system, which not only reduced the carbon emissions but also reduced the natural gas procurement cost of the system. In [6], the authors established a model of peak cutting and valley filling considering P2G, which improved the economy of the whole system operation. In [7], the authors provided an in-depth analysis of the conversion process of P2G technology, including aspects of the electrolytic tank model, system steady state, and transient models. In summary, the application of P2G devices to IES has significant practical engineering value and significance.
Carbon capture power plants (CCPP) are transformed from coal-fired and gas-fired power plants through the CCS, which can significantly reduce the level of carbon emissions. By controlling the energy consumption of CCS, CCPP are characterized by flexible operation and fast response. Compared to conventional power plants, CCPP can realize low-carbon and economic dispatch operation of IES [8]. In [9], the authors introduced CCS to a WP generation system. Its example simulations showed that the CCS can reduce the impact of WP fluctuations on the system. A system model of P2G-CCS is constructed, which utilizes CO2 captured by CCPP as feedstock to supply the P2G. This model can save the material cost and reduce the carbon emission at the same time [10,11]. In [12], the authors established a collaborative model of CCS and P2G. The conclusion showed that the collaborative operation of CCS and P2G can effectively promote the accommodation of WP and realize the recycling of carbon. In [13], the authors applied CCS technology and P2G technology to the scheduling model of IES. In [14], the authors proposed a collaborative operation model of liquid storage CCS-P2G-CHP, and the system’s economy and low-carbon benefit were improved by executing the optimal scheduling possible while taking the cost of carbon transactions into account. The current research on P2G-CCPP mainly focuses on electricity-gas systems, rarely involves the IES of electricity, gas, and heat, and does not realize the coordinated and optimized scheduling among multiple energy sources of electricity, gas, and heat.
Current research on BG utilization is also developing rapidly under the guidance of China’s national policy, especially in rural or suburban areas with abundant biomass resources. Biomass energy in these areas is easy to connect to the IES, which is an important direction for future energy development. In [15], the authors established a BG-WP-PV IES model based on an energy hub (EH). Then, the BG storage tank was introduced to participate in the optimal scheduling of electricity, heat, and gas systems, which reduced the operation cost of the system. In [16], the authors analyzed the economic and environmental benefits of hybrid power generation technology with renewable energy such as BG, WP, and PV, which reduces CO2 emissions. In [17], the authors considered the uncertainty of environmental factors such as WP and PV in remote mountainous areas and established a micro-energy network model of BG-WP-PV to model the heat load of buildings in detail, which improved the economy and reliability of the system’s energy supply. In [18], the authors added BG to IES containing renewable energy sources such as WP and PV, which proved that BG can save fuel costs instead of traditional diesel. In [19], the authors designed a cooperative renewable energy scheduling system using BG-PV-WP to increase the penetration of renewable energy sources and lower the system’s running costs. In [20], the authors adopted the concept of an EH to represent the coupling relationship among energy sources. Then, an optimal scheduling model of IES containing BG-WP-PV is established. And its calculation results show that low-carbon and economic operation of the IES can be achieved through optimal dispatching. In [21], the authors constructed an interval optimization model for an integrated rural energy system with hydrogen production from biogas fermentation electrolysis in order to solve the problems of low biomass utilization, wind power uncertainty, and intermittency in rural winter. In [22], the authors developed a two-tier optimization model for a biogas-IES considering the thermal comfort of heating customers and natural gas price fluctuations and resolved the uncertainty of the probabilistic results using an improved Latin hypercube sampling method. In [23], a day-ahead optimal scheduling model for an IES is proposed, which takes into account the coupling of biomass and P2G to reduce carbon emissions during the operation of an industrial park. Currently, IES containing BG have begun to receive attention. However, the research on multi-energy coupling systems that integrate the consideration of BG-WP-PV, P2G, CCS, and energy storage has not been reported.
For this reason, this thesis introduces biogas into the electricity-heat-gas IES and constructs a WP-PV-BG IES considering CCS and P2G conversion in order to realize the efficient local consumption and utilization of renewable energy, which has good research significance and practical value. The main contributions of this paper include:
(1) A grid-connected WP-PV-BG integrated energy microgrid composed of multiple renewable energy sources is proposed to utilize the complementary characteristics among PV, WP, and BG to realize the synergistic operation of BG-CCS-P2G in a low-carbon economy while promoting the virtuous cycle of the ecosystem.
(2) Aiming at the stochastic uncertainty of WP and PV in the WP-PV-BG IES, scenario generation of WP and PV output following the probability distribution constraints is generated by the Latin hypercube sampling technique. The stochastic uncertainty problem is transformed into a deterministic problem for collaborative optimization computation by using the scenario abatement technique and combining it with the characteristics of the maximum probability distribution.
(3) A collaborative optimal scheduling model of WP-PV-BG IES considering CCS and P2G is established, and four typical cases are set to verify the feasibility and superiority of the constructed WP-PV-BG IES.
The main structure of this paper: Section 1 constructs the IES architecture and completes the modeling. Section 2 constructs the optimal scheduling model, including the objective function, constraint conditions, and solving algorithm. Section 3 verifies the feasibility of the scheduling model developed in this paper through an arithmetic example analysis. The conclusion is drawn in Section 4.
2 Structure and Model Construction of the IES with WP-PV-BG
This paper proposes an IES structure of WP-PV-BG proposed with P2G and CCS (Fig. 1). The system includes the external energy supply, the multiple energy storage, the energy conversion, and the load. The system realizes the comprehensive utilization of energy and meets the load demand flexibly through the coupling of three energy sources: electricity, heat, and gas. External energy supply includes a variety of energy sources such as PV, WP, BG, the external power grid, and the external gas grid. Energy storage includes electric energy storage, thermal storage, and gas storage to achieve a balance between supply and demand. Energy conversion equipment includes P2G, CCS, and BG to reduce carbon emissions through rational utilization of biomass. In addition, GT and electric boilers (EB) are used as energy supply equipment to provide electricity and heat energy for the system.
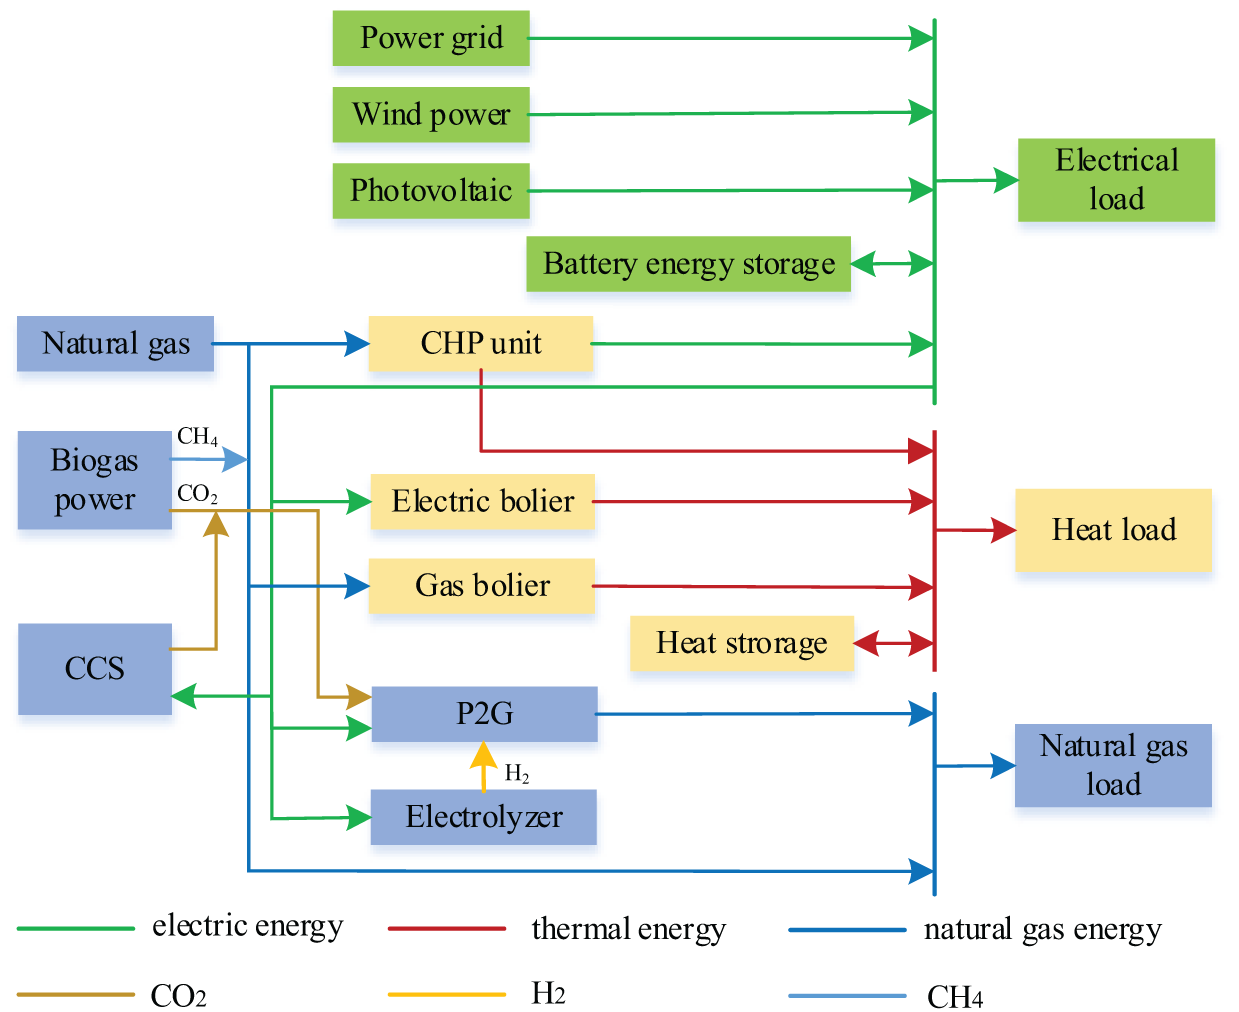
Figure 1: Structure of IES
As a greenhouse gas, CH4 has a serious impact on climate change. By collecting and utilizing methane from agricultural waste (such as BG digesters), direct emissions of these greenhouse gases into the atmosphere can be effectively reduced. At the same time, BG, as a clean fuel, its combustion releases far fewer pollutants than traditional fossil fuels (such as coal, oil, and natural gas), which helps to improve air quality. Fig. 2 shows the process of BG production.
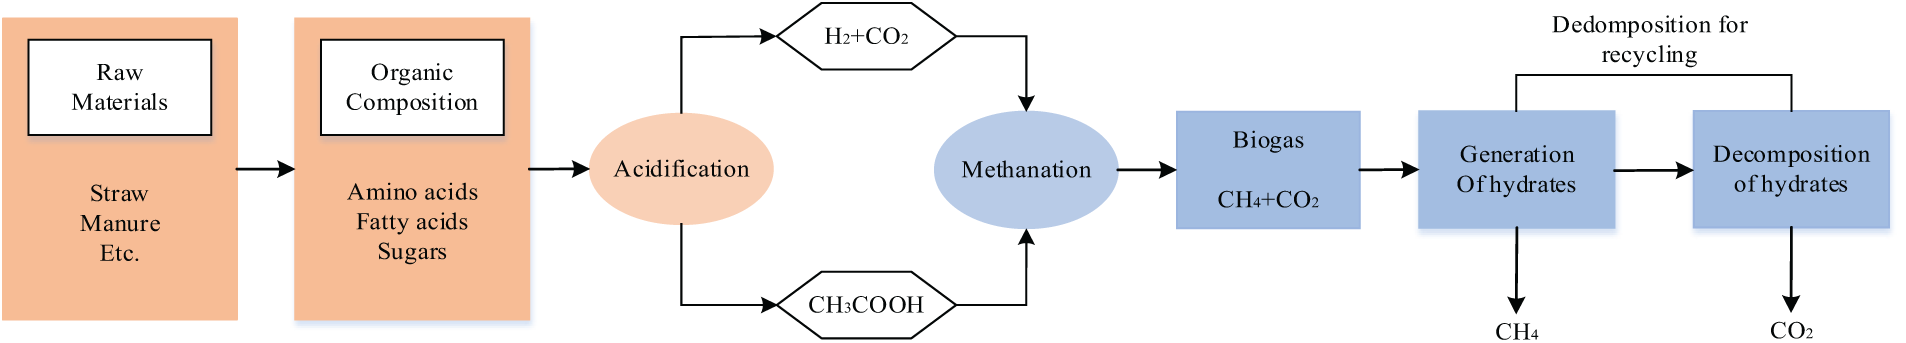
Figure 2: Working principle of BG digester
As can be seen in Fig. 2, the fermentation stage of BG includes hydrolysis, acidification, formation of acetic acid, and methanation. Then BG composed of CH4 and CO2 is obtained. BG is purified by the hydrate method. Because the pressure of a hydrate formation of CO2 is lower than that of CH4, CO2 forms hydrate into a hydrate phase at a certain temperature and pressure. CH4 is enriched in the gas phase, realizing the separation of CH4 and CO2. By decomposing the gas hydrate containing CO2, the high-purity CO2 gas can be recovered and the decomposed aqueous solution can be recycled. The CH4 in BG can be supplied to CHP, while CO2 is used by P2G to produce gas.
2.2 CCS-P2G-BG Collaborative Operation Framework
Fig. 3 shows the CCS-P2G-BG collaborative operation framework. The BG produced from the digester is separated into CH4 and CO2. CH4 is directly used as a fuel for CHP, and CO2 can be used as a feedstock for P2G to synthesize CH4. Next, CCS can capture CHP and CO2 emitted from BG digesters. P2G uses surplus renewable energy to convert CO2 separated from the BG digester and CO2 captured by CCS into CH4 gas for gas equipment to use, which improves energy efficiency and reduces carbon emissions of the system.
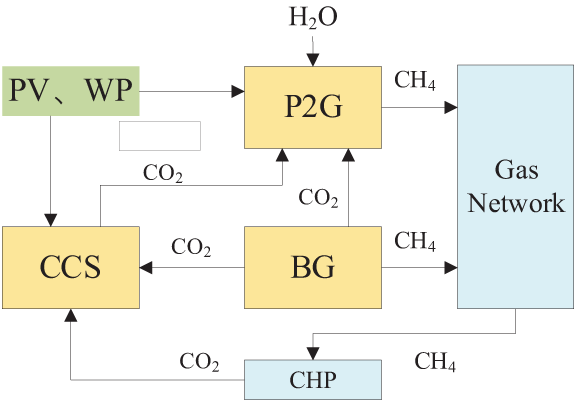
Figure 3: Working schematic diagram of P2G-CCS-BG coupling system
The digester reacts to produce CO2 and CH4. Temperature is an important environmental factor affecting BG production, which are proportional to the calorific value of the BG, and the correlation formula is as follows:
where
The amount of CO2 captured by CCS is related to the CO2 emitted by the fuel as follows:
Moreover, the power consumption of CCS is related to the amount of CO2 captured, and the specific relationship is as follows:
where
Due to the complexity of the internal nature of P2G, the current literature usually simplifies P2G to an energy conversion model with fixed efficiency. It acts as an active load bus on the electrical load side and as a gas source node on the gas side. The P2G model is represented as follows:
where
2.3.4 Modeling of CCS and P2G Coupling
CO2 captured by CCS is mainly synthesized into methane and sequestered in the following relationship:
where
Molar mass relationship for the synthesis of CH4 from H2 produced by P2G and CO2:
where
The optimized scheduling objective of IES proposed in this paper is to minimize the total operating cost of the system with the following objective function:
where
3.1.1 Operation and Maintenance Cost
where
where
where
3.1.4 Comprehensive Energy Purchase Cost
where
3.1.5 BG Digester Raw Material Cost
where
The CHP unit constraints are described by Eq. (19).
where
The GB operation constraint is represented by Eq. (20).
where
The constraint of EB is represented by Eq. (21).
where
The electric ES constraints are represented by Eq. (22).
where
The heat ES constraint is similar to the electric ES constraints.
3.2.6 Renewable Energy Unit Constraints
Renewable energy units include WP and PV, and their constraints are as follows:
where
3.2.7 Power Balance Constraints
where
3.2.8 Upper and Lower Limits of Unit Output Power Constraints
where
3.2.9 Unit Climbing Constraints
where
3.2.10 Unit Start-Stop Constraints
In order to avoid damage to equipment caused by frequent start-ups and shutdowns, it is necessary to limit the starting and stopping time of the unit. Eq. (27) ensures that the start-up time and downtime of IES component are not lower than its minimum value. Eq. (28) limits the power of the unit during start-up and downtime to no less than the minimum power, ensures that the unit can provide sufficient power during operation and shutdown, and avoids damage to the equipment during low-power operation.
where
3.2.11 BG, P2G and CCS Operation Constraints
where
3.2.12 Input Power Limit and Climbing Power Limit for P2G Devices
where
where
In this paper, a low-carbon economic dispatch model of IES considering CCS cooperative WP, PV, hydrogen, BG and storage is constructed. The nonlinear model is transformed into a mixed integer linear programming (MILP) model by piecewise linear. The CPLEX solver in the YALMIP toolbox was invoked in MATLAB to perform simulation solutions, so as to determine the output of the energy supply equipment and the energy conversion equipment in each time period, thus realizing the economic and low-carbon operation of IES. The standard form for solving the model is as follows:
where the optimization variable x includes the output of the energy supply equipment, the input of the conversion equipment, the input and output of the energy storage device, as well as the purchase of electricity and gas from the power grid and gas grid. Aeqx = beq is an equality constraint that includes the energy balance equation of the system and the balance equation of the energy storage device. Aineqx ≤ bineq is an inequality constraint that includes output constraints for each device in the system.
4.1 Renewable Energy Uncertainty Processing
Multiple random scenarios of wind power and photovoltaic output following probability distribution constraints are generated by Latin hypercube sampling technique. The scene reduction method based on Kantorovich distance is used to reduce these scenes, so as to simulate the uncertainty of WP and PV output.
4.1.1 Renewable Energy Probability Model
In this paper, the normal distribution is used to describe the prediction error of PV and WP:
where σPV, σPW present the standard deviations of PV and WP; μPV, μPW present the expectations of PV and WP.
4.1.2 Latin Hypercube Sampling Generation Scenario
In this paper, the sampling scale is set to 1000 and the steps of using Latin hypercube sampling to generate photovoltaic multi-scenario output are as follows:
(1) The distribution curve of F(PV) is divided into 1000 intervals, and the spacing is 1/1000.
(2) Take a number in each of the 1000 intervals, and set the sampling point of the xth interval as Nx, then the cumulative probability of Nx is:
where Px presents the cumulative probability of sampling point x; rx presents any number in the interval [0~1].
(3) The sampling value Kx of each interval can be obtained by bringing Px back to the distribution function:
(4) Repeat the operation of step 3 to obtain 1000 sampling values of PV, generate a 1 × 1000-dimensional matrix, and randomly sort into 1000 scenarios.
Based on the above 1000 randomly generated scenes, set the number of scenes after reduction to 5, and the reduction process is as follows:
(1) Initially, the probability of each scene is 1/1000 and the initial number of scenes is n = 1000;
(2) Calculate the Kantorovich distance Dx(Si, Sj) for each scene:
(3) The closest scene y within the range of scene x is selected, and the probability and the product of the Kantorovich distances of the two scenes are set equal:
(4) Repeat step 3 to select the scene z with minimum PxDx(Si, Sj) and delete it, then update the number of scenes to n = n − 1, at which point the probability of scene y is updated to Py = Py + Pz;
(5) Repeat steps 2–4 until n = 5 and the scene cut ends.
The scenario generation and reduction process for wind power is the same as above. Fig. 4 shows the clustering cut results of wind power and PV output scenarios, in which the probabilities of scenarios 1 to 5 are 0.422, 0.113, 0.172, 0.138, and 0.155, respectively, and scenario 1 with the highest probability is selected as the final scenario of the predicted output of PV and WP.
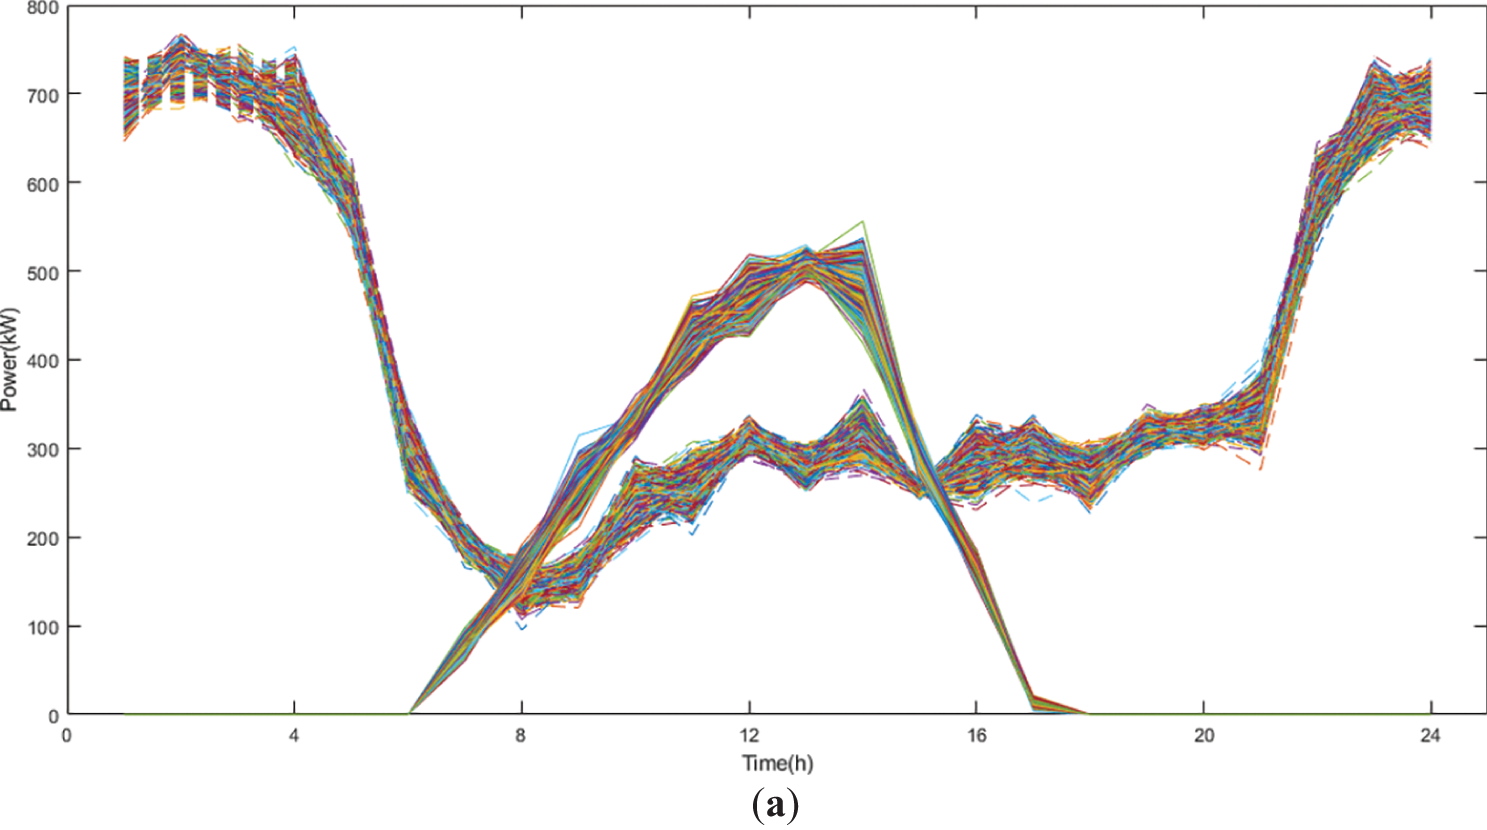
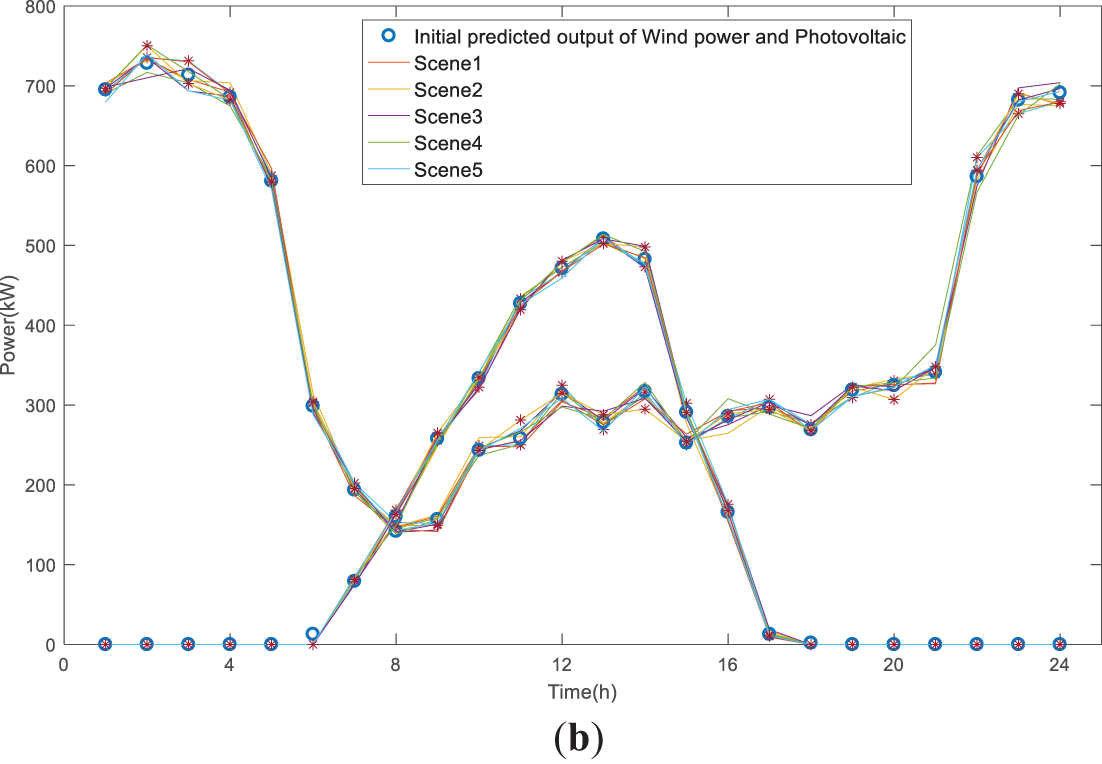
Figure 4: Scenario clustering reduction results; (a) 1000 PV and WP generation scenarios; (b) Typical output scenarios of PV and WP
4.2 System Parameters and Scene Settings
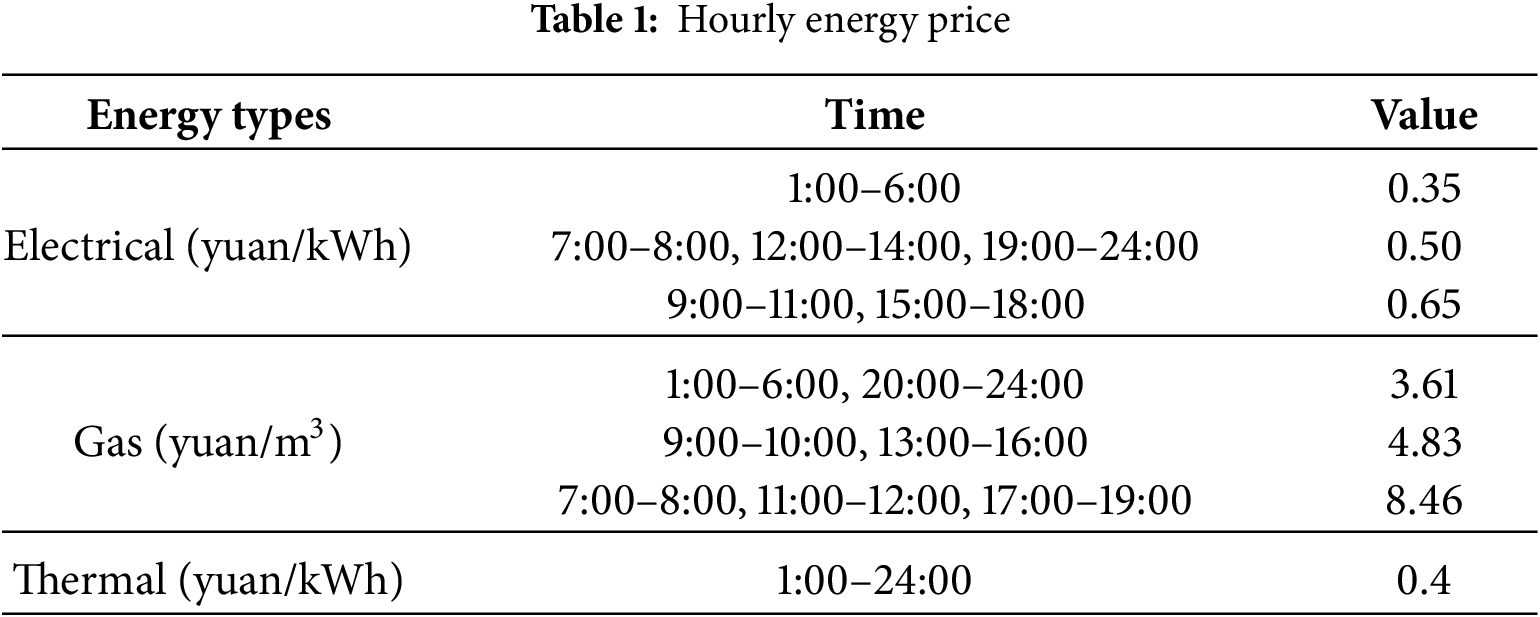
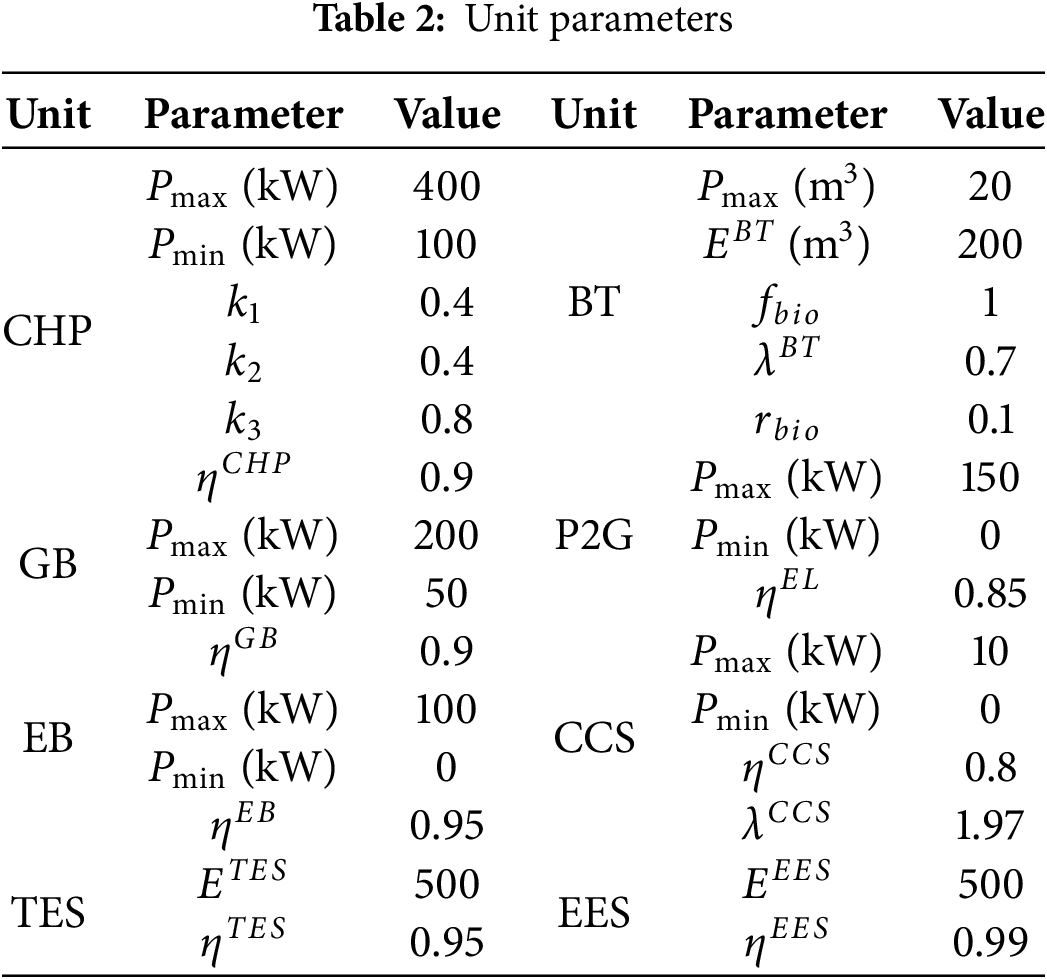
In order to verify the economy and effectiveness of the IES operation proposed in this paper, the DES structure given in Fig. 1 is used as an example for simulation calculation. The forecast curve of electric, gas and heat load forecast curves, as well as the day-ahead predicted output power of WP and PV are shown in Fig. 5, where Pwav is the WP output; Pvav is the PV output; Pl is the active load; Ql is the reactive load; and Hl is the heat load. The real-time prices of electrical, heat and gas energy are seen in Table 1. The relevant parameter data is seen in Table 2.

Figure 5: Predicted output of WP, PV, and load
Four scenarios are set up to calculate the operating costs through co-optimization used to verify the feasibility and superiority of the carbon capture and power-to-gas wind swamp IES proposed in this thesis. Among them, Case 1: Optimized scheduling of IES day-ahead without considering P2G, CCS, and BG digester. Case 2: IES day-ahead optimal scheduling with only P2G considered on the base case. Case 3: Consider the day-ahead optimal scheduling of IES of P2G and CCS. Case 4: IES day-ahead optimal scheduling considering both P2G and CCS as well as BG digester.
Optimization calculations are performed for the four cases set up, and the results are shown in Table 3.
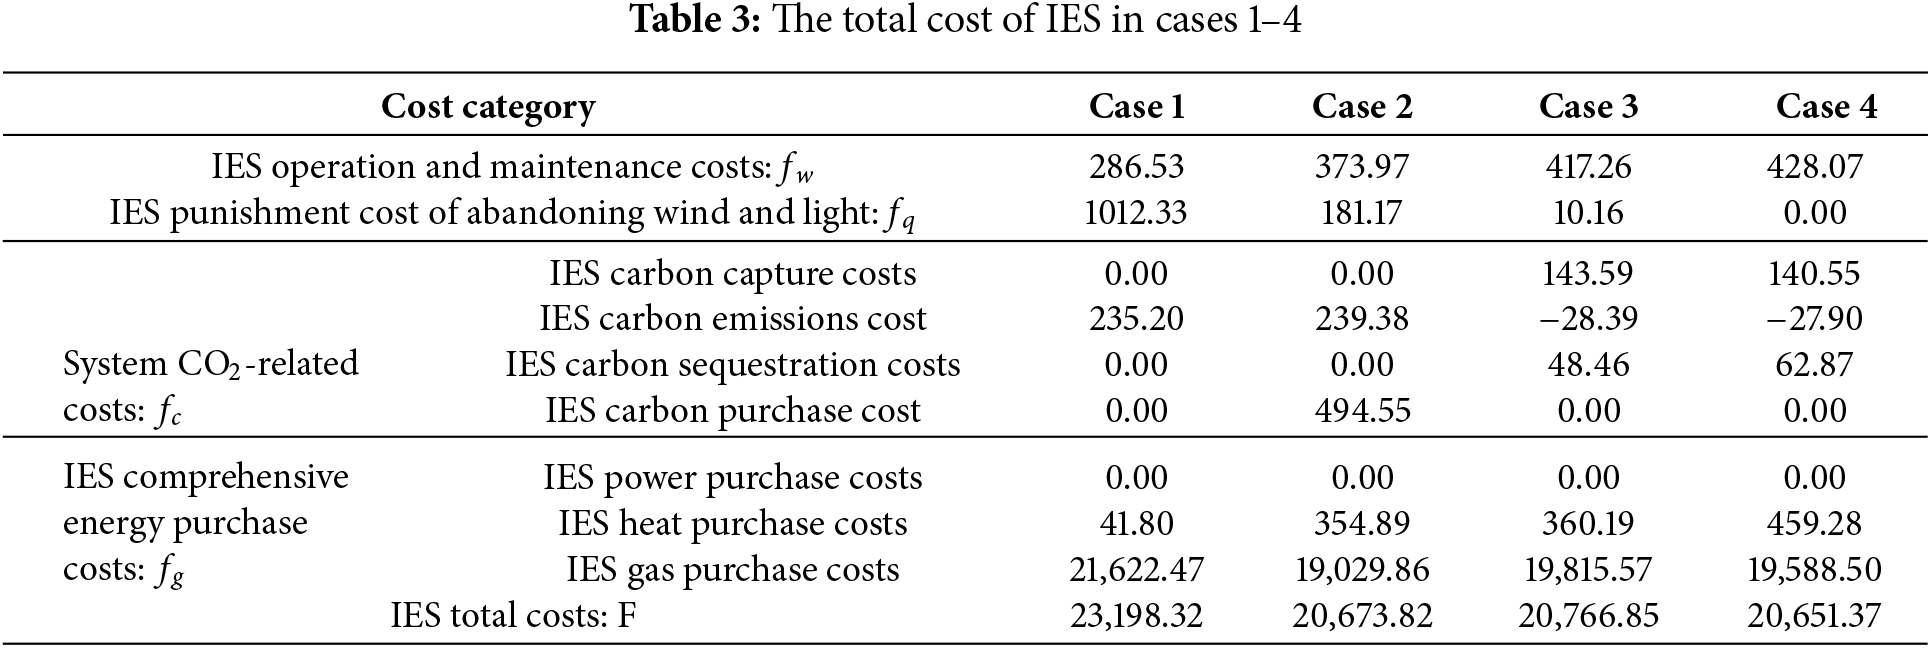
From Table 3, it can be seen that Case 1 has the highest wind abandonment cost of RMB 1012.33, indicating insufficient renewable energy consumption. And after the introduction of the power-to-gas device, the renewable energy of Cases 2, 3, and 4 is substantially consumed, especially Case 4 realizes 100% of the renewable energy accommodation. Cases 1 and 2 cause large CO2 emissions due to the non-existence of CCS, and the cost of carbon emissions amounted to RMB 235.2 and RMB 239.38, respectively. In contrast, cases 3 and 4 would benefit from the carbon trading market, with carbon trading gains of RMB 28.39 and RMB 27.90, respectively. Although a BG digester was added to Case 4, the CO2 separated from the BG digester was not fully utilized due to multiple factors such as wind and light storage, resulting in a larger CO2-related cost than Case 3. While Case 2 also has a higher CO2-related cost because it is not able to obtain CO2 from the system itself and needs to purchase CO2 from the external carbon market to satisfy the operation of P2G.
In all four cases, there is no need to buy electricity from an external energy network, because it is self-sufficient. Cases 2, 3 and 4 are all equipped with P2G, which can improve the self-supplying capacity of gas. However, because P2G is a high energy-consuming equipment, the electric energy output of CHP is increased, thus the heat energy output is reduced. For this reason, Cases 2, 3, and 4 all require the purchase of thermal energy, resulting in an increase in the cost of purchasing heat compared to Case 1 by RMB 313.09, RMB 318.39, and RMB 417.48, respectively. From the perspective of total cost, Case 4, which also considers P2G, CCS, and BG digester, has the lowest cost of RMB 20,651.37, which is 10.98% lower relative to Case 1, and realizes low-carbon economic operation.
4.4 Analysis of the Level of Renewable Energy Accommodation
The process of renewable energy accommodation is analyzed through four cases, as shown in Fig. 6 Pwav denotes the WP output; Pvav denotes the PV output; Pwav + Pvav denotes the sum of the WP and PV outputs, which is the set point; Cases 1–4 is the sum of the WP and PV grid-connected power, which is the WP and PV power that can be accepted by IES after the optimal dispatch, that is, the grid-connected power.

Figure 6: Renewable energy consumption levels under different cases
From Fig. 6, it is evident that there are substantial WP outputs during the time intervals of 1:00 to 5:00, 22:00 to 24:00, and 10:00 to 13:00. During this period, Case 1 cannot be consumed resulting in an increase in WP abandonment cost. For Case 2, which considers P2G, most of the renewable energy is consumed, but there is still the problem of insufficient accommodation. Case 3 considers both P2G and CCS, and the level of renewable energy accommodation increases significantly. Case 4 considers a BG digester in addition to Case 3, and realizes 100% of renewable energy accommodation.
4.5 Analysis of Carbon Emission Levels
Fig. 7 shows the CO2 emissions of the system under the four cases. From the figure, it can be seen that the emissions of Case 2 are larger than those of Case 1, which is due to the fact that the WP and PV renewable energy outputs are lower in the 5:00 to 7:00 and 19:00 to 22:00 time periods. In order to meet the normal operation of the P2G, the output of the CHP unit in Case 2 is increased, which leads to an increase in the CO2 emissions. For Cases 3 and 4, where CCS is considered, the carbon emissions are significantly reduced and the carbon emission curves are approximately the same. The operation of the BG system does not have a significant impact on the level of carbon emissions from the system, which is generally consistent with Case 3.

Figure 7: System CO2 emissions under different cases
4.6 Analysis of Scheduling Results
Because case 4 has the lowest total operating cost, this section only analyzes the output of each running device in case 4.
Fig. 8 shows the electric energy scheduling results, where Peesch denotes the charging power of the battery; Peb denotes the electricity consumption of EB; Pccs denotes the power of the CCS; Pel denotes the power of the electrolytic tank; Psell denotes the power of the electricity sold to the system; Peesids denotes the battery discharge power; Pchp denotes the power of CHP unit; Pw denotes the wind turbine power; Pv denotes the PV power, and Pbuy denotes the power of the electricity purchased from the system.

Figure 8: Electricity scheduling results
From Fig. 8, the devices store electricity during periods of abundant WP and PV resources from 1:00 to 4:00, 11:00 to 14:00, and 23:00 to 24:00. They discharge stored energy during periods of low WP and PV resources from 6:00 to 9:00 and 16:00 to 19:00, which plays the role of peak-shaving and valley-filling in renewable energy dispatch. Likewise, the CHP unit also boosts their output to meet the electrical load during low renewable energy output hours. EB converts electricity to heat to meet the system’s heat energy demand during periods of high renewable energy output. P2G converts surplus electricity into gas for efficient energy use. CCS equipment is kept in operation to capture CO2 from CHP and BG digesters.
Fig. 9 shows the results of heat energy scheduling, where Hsell denotes the amount of heat sold to the system; Htesch denotes the amount of heat stored in the heat storage tank; Heb denotes the value of heat produced by the EB; Hzq denotes the amount of heat produced by the BG digester; Hchp denotes the amount of heat produced by CHP unit; Htesdis denotes the amount of heat discharged from the heat storage tank; and Hgb denotes the amount of heat produced by the GB. As seen in Fig. 10, the heat storage unit stores heat energy during the low-demand period from 11:00 to 14:00 and provides heat to the system during periods of insufficient CHP output from 7:00 to 9:00 and 17:00 to 19:00. In addition to meeting the heat load demand, the system needs to purchase heat from the external energy market when the EB and the CHP output is insufficient.

Figure 9: Heat energy scheduling results
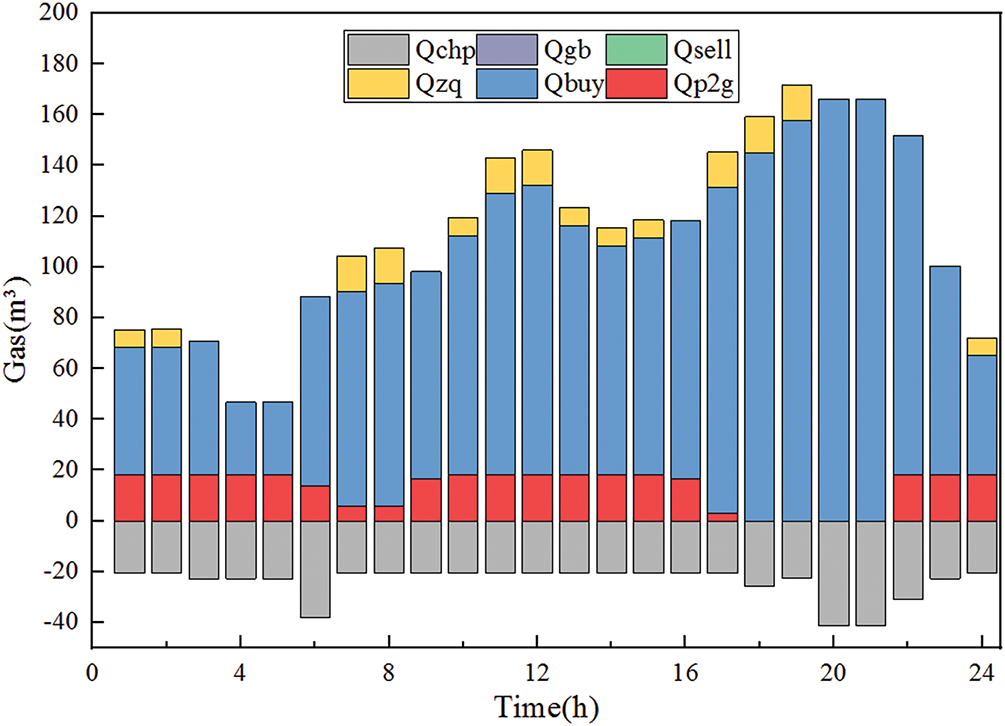
Figure 10: Natural gas scheduling results
Fig. 10 shows the gas dispatch results, where Qchp denotes the gas consumption of the CHP unit; Qgb denotes the gas consumption of GB, Qsell denotes the gas sold to the system, Qzq denotes the gas production from BG; Qbuy denotes the gas purchased from the system; Qp2g denotes the gas produced by P2G. As can be seen from Fig. 11, P2G and BG digester can provide gas to the system during the operation of the system. The shortage of gas meets the load demand by purchasing gas from gas companies. Equipment that consumes gas includes CHP and GB.

Figure 11: Carbon capture device CO2 traces in case 4
In summary, the system maintains the balance between supply and demand through different energy conversions and coordinated operation of units. The P2G unit converts CO2 into CH4 for use by the gas unit when there is surplus electricity. The addition of BG also shares a small part of the supply pressure for the system, and the BG digester supply is mainly affected by the real-time gas transaction price, providing gas during higher price hours to reduce the purchase of gas in the system. Similarly, gas from P2G can also compensate for part of the gas demand, thereby reducing the cost of gas purchase. All units and equipment in the system operate cooperatively to achieve low-carbon economic operation of the system.
Fig. 11 shows the CO2 traces captured by the CCS in Case 4, where c_ccs denotes the amount of CO2 captured by CCS; c_ccs_me denotes the amount of CO2 utilized by P2G; and c_ccs_f denotes the amount of CO2 that is not directly utilized but is compressed and then sequestered. From Fig. 12, it can be observed that during the time intervals of 5:00 to 7:00 and 19:00 to 23:00, there is an increase in CHP generation, leading to higher carbon emissions. During these periods, the CCS captures a larger quantity of CO2, which in turn results in increased electricity consumption. A portion of the captured CO2 is utilized by P2G, while the remaining portion is compressed and subsequently stored through transportation. The consumption of CO2 primarily occurs during the time intervals of 1:00 to 5:00, 9:00 to 17:00, and 22:00 to 24:00, coinciding with high renewable energy output periods, during which P2G actively consumes renewable energy.
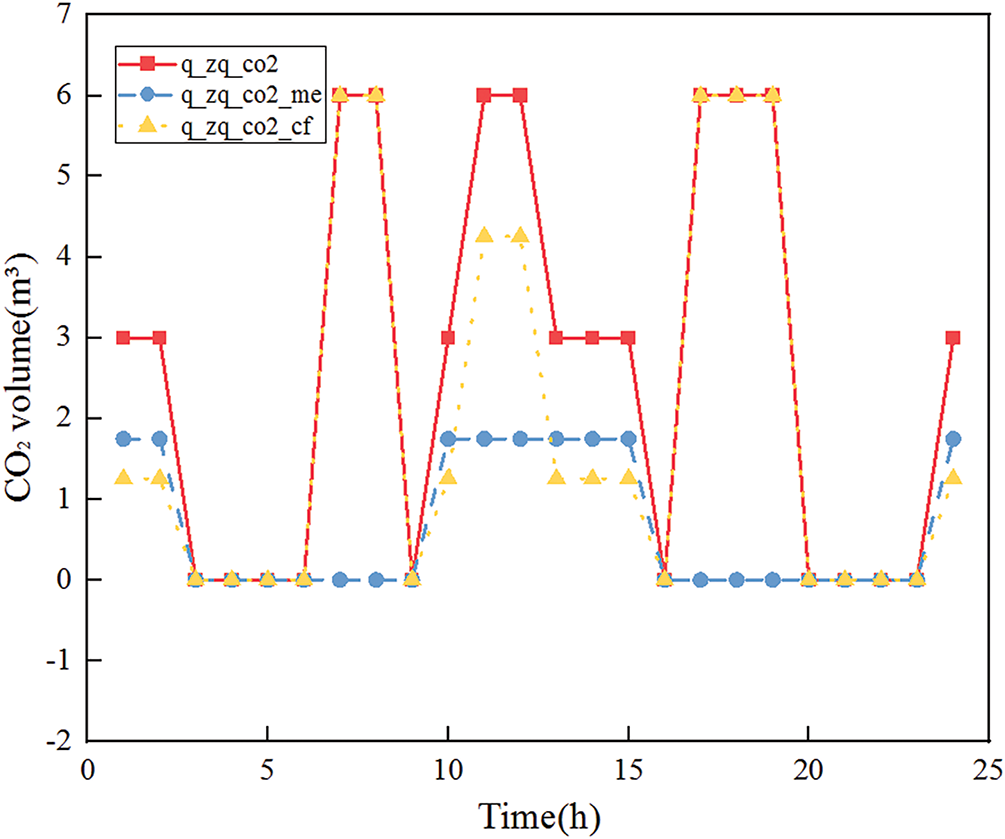
Figure 12: CO2 traces in BG digester in case 4
Fig. 12 shows the CO2 situation in the BG digester for case 4, where q_zq_co2 denotes the CO2 produced by the BG digester; q_zq_co2_me denotes the CO2 that is directly utilized by P2G, and q_zq_co2_cf denotes the CO2 that is not directly utilized in the sequestration process. This is similar to the utilization of CO2 in carbon capture power plant.
In this thesis, the framework of WP-PV-BG IES considering CCS and P2G conversion is constructed, and a collaborative optimal scheduling model considering operation cost is established. The main conclusions are obtained as follows:
(1) The proposed collaborative operation framework of BG-CCS-P2G makes full use of the natural gas produced by the BG pool. Then, it provides the CO2 captured by the CCS device as a feedstock for the P2G plant to be converted into natural gas. This results in a 9.4% reduction in the cost of purchased gas relative to the original case. The P2G and CCS coupling energy storage systems can achieve 100% consumption of renewable energy.
(2) The coordinated optimal scheduling strategy can significantly reduce the renewable energy penalty cost and natural gas scheduling cost so that the total system operation cost can be reduced by RMB 2546.95, which has a very economical performance.
Acknowledgement: The authors sincerely acknowledge the contribution of all individuals, reviewers, and editors for their contribution towards the production of this manuscript.
Funding Statement: The authors received no specific funding for this study.
Author Contributions: The authors confirm contribution to the paper as follows: Conceptualization, Yunfei Xu and Xiaoqing Hao; methodology, Tianxing Sun and Heran Kang; software, Jianfeng Liu and Tianxing Sun; validation, Yunfei Xu, Jianfeng Liu, Tianxing Sun, Heran Kang and Xiaoqing Hao; formal analysis, Yunfei Xu and Heran Kang; investigation, Jianfeng Liu and Xiaoqing Hao; resources, Tianxing Sun and Xiaoqing Hao; writing—original draft preparation, Yunfei Xu, Jianfeng Liu and Tianxing Sun; writing—review and editing, Yunfei Xu, Heran Kang and Xiaoqing Hao; supervision, Jianfeng Liu and Xiaoqing Hao; project administration, Yunfei Xu and Xiaoqing Hao. All authors reviewed the results and approved the final version of the manuscript.
Availability of Data and Materials: The data presented in this study are available on request from the corresponding author.
Ethics Approval: Not applicable.
Conflicts of Interest: The authors declare no conflicts of interest to report regarding the present study.
Nomenclature
| IES | Integrated energy systems |
| CCS | Carbon capture system |
| P2G | Power-to-gas |
| BG | Biogas |
| CHP | Combined heat and power |
| WP | Wind power |
| PV | Photovoltaic |
| ES | Energy storage |
| EL | Electrolyser |
| GB | Gas boiler |
| EB | Electric boiler |
| EES | Electric energy system |
References
1. Yang P, Jiang H, Liu C, Kang L, Wang C. Coordinated optimization scheduling operation of integrated energy system considering demand response and carbon trading mechanism. Int J Electr Power Energy Syst. 2023;147(6):108902. doi:10.1016/j.ijepes.2022.108902. [Google Scholar] [CrossRef]
2. Yan Q, Zhang G, Zhang Y, Yu H. Coordinated scheduling optimization of building integrated energy system with flexible load. Energy Rep. 2024;12(11):3422–36. doi:10.1016/j.egyr.2024.08.081. [Google Scholar] [CrossRef]
3. Wang L, Ni L, Wang S, Wang J, Zhao Z, Shen H. Low-carbon economic dispatch of waste incineration power plant and biogas purification multi-energy coupling system considering power-to-gas. Energy Rep. 2025;13(3):2997–3012. doi:10.1016/j.egyr.2025.02.031. [Google Scholar] [CrossRef]
4. Gao C, Lu H, Chen M, Chang X, Zheng C. A low-carbon optimization of integrated energy system dispatch under multi-system coupling of electricity-heat-gas-hydrogen based on stepwise carbon trading. Int J Hydrogen Energy. 2025;97(3):362–76. doi:10.1016/j.ijhydene.2024.11.055. [Google Scholar] [CrossRef]
5. Zhang G, Wang W, Chen Z, Li R, Niu Y. Modeling and optimal dispatch of a carbon-cycle integrated energy system for low-carbon and economic operation. Energy. 2022;240:122795. doi:10.1016/j.energy.2021.122795. [Google Scholar] [CrossRef]
6. Liao M, Liu C. Optimal coordination of electricity-P2G-gas system to facilitate renewable energy integration. Sustain Energy Grids Netw. 2025;41(4):101610. doi:10.1016/j.segan.2024.101610. [Google Scholar] [CrossRef]
7. Xing X, Lin J, Song Y, Zhou Y, Mu S, Hu Q. Modeling and operation of the power-to-gas system for renewables integration: a review. CSEE J Power Energy Syst. 2018;4(2):168–78. doi:10.17775/cseejpes.2018.00260. [Google Scholar] [CrossRef]
8. Wang J, Ji X, Meng X, Bai Y, Li M. Low-carbon economic dispatch of integrated energy system with carbon capture power plant and multiple utilization of hydrogen energy. Front Energy Res. 2025;12:1447858. doi:10.3389/fenrg.2024.1447858. [Google Scholar] [CrossRef]
9. Ji Z, Kang C, Chen Q, Xia Q, Jiang C, Chen Z, et al. Low-carbon power system dispatch incorporating carbon capture power plants. IEEE Trans Power Syst. 2013;28(4):4615–23. doi:10.1109/tpwrs.2013.2274176. [Google Scholar] [CrossRef]
10. He K, Zeng L, Yang J, Gong Y, Zhang Z, Chen K. Optimization strategy for low-carbon economy of integrated energy system considering carbon capture-two stage power-to-gas hydrogen coupling. Energies. 2024;17(13):3205. doi:10.3390/en17133205. [Google Scholar] [CrossRef]
11. Zhang Y, Zhang P, Du S, Dong H. Economic optimal scheduling of integrated energy system considering wind-solar uncertainty and power to gas and carbon capture and storage. Energies. 2024;17(11):2770. doi:10.3390/en17112770. [Google Scholar] [CrossRef]
12. He L, Lu Z, Zhang J, Geng L, Zhao H, Li X. Low-carbon economic dispatch for electricity and natural gas systems considering carbon capture systems and power-to-gas. Appl Energy. 2018;224(4):357–70. doi:10.1016/j.apenergy.2018.04.119. [Google Scholar] [CrossRef]
13. Sun S, Xing J, Cheng Y, Yu P, Wang Y, Yang S, et al. Optimal scheduling of integrated energy system based on carbon capture-power to gas combined low-carbon operation. Processes. 2025;13(2):540. doi:10.3390/pr13020540. [Google Scholar] [CrossRef]
14. Wang Y, Gao S, Jia W, Ding T, Zhou Z, Wang Z. Data-driven distributionally robust economic dispatch for park integrated energy systems with coordination of carbon capture and storage devices and combined heat and power plants. IET Renew Power Gener. 2022;16(12):2617–29. doi:10.1049/rpg2.12436. [Google Scholar] [CrossRef]
15. Fen Z, Lv L, Xu L. A day-ahead and real-time two-stage optimal scheduling model for a full renewable energy system based on energy hubs-marsh-wind-light. Power Syst Technol. 2019;43(9):3101–9. (In Chinese). doi:10.13335/j.1000-3673.pst.2019.0596. [Google Scholar] [CrossRef]
16. Ghaem Sigarchian S, Paleta R, Malmquist A, Pina A. Feasibility study of using a biogas engine as backup in a decentralized hybrid (PV/wind/battery) power generation system—case study Kenya. Energy. 2015;90(2):1830–41. doi:10.1016/j.energy.2015.07.008. [Google Scholar] [CrossRef]
17. Tan H, Yan W, Wang H. Optimal scheduling model of marsh-wind-light isolated micro-energy network based on building thermal energy flow analysis. Power Syst Technol. 2020;44(7):2483–91. (In Chinese). doi:10.13335/j.1000-3673.pst.2019.2434. [Google Scholar] [CrossRef]
18. Rahman MM, Hasan MM, Paatero JV, Lahdelma R. Hybrid application of biogas and solar resources to fulfill household energy needs: a potentially viable option in rural areas of developing countries. Renew Energy. 2014;68:35–45. doi:10.1016/j.renene.2014.01.030. [Google Scholar] [CrossRef]
19. Zhou B, Xu D, Li C, Chung CY, Cao Y, Chan KW, et al. Optimal scheduling of biogas-solar–wind renewable portfolio for multicarrier energy supplies. IEEE Trans Power Syst. 2018;33(6):6229–39. doi:10.1109/TPWRS.2018.2833496. [Google Scholar] [CrossRef]
20. Zhang S, Gu W, Zhang XP, Lu H, Yu R, Qiu H, et al. Dynamic modeling and simulation of integrated electricity and gas systems. IEEE Trans Smart Grid. 2023;14(2):1011–26. doi:10.1109/tsg.2022.3203485. [Google Scholar] [CrossRef]
21. Zhang M, Yu S, Li H. Inter-zone optimal scheduling of rural wind-biomass-hydrogen integrated energy system. Energies. 2023;16(17):6202. doi:10.3390/en16176202. [Google Scholar] [CrossRef]
22. Qin M, Yang Y, Chen S, Xu Q. Bi-level optimization model of integrated biogas energy system considering the thermal comfort of heat customers and the price fluctuation of natural gas. Int J Electr Power Energy Syst. 2023;151(2):109168. doi:10.1016/j.ijepes.2023.109168. [Google Scholar] [CrossRef]
23. Chen W, Chang X, Li J. A day-ahead optimal scheduling model of an integrated energy system for a facility agricultural-industrial park. IET Energy Syst Integr. 2023;5(3):261–74. doi:10.1049/esi2.12101. [Google Scholar] [CrossRef]
Cite This Article
 Copyright © 2025 The Author(s). Published by Tech Science Press.
This work is licensed under a Creative Commons Attribution 4.0 International License , which permits unrestricted use, distribution, and reproduction in any medium, provided the original work is properly cited.
 Downloads
 Citation Tools