
 Submit a Paper
 Propose a Special lssue
 Open Access
ARTICLE

Two-Stage Optimal Dispatching of Electricity-Hydrogen-Waste Multi-Energy System with Phase Change Material Thermal Storage
1 College of Electrical Engineering and New Energy, China Three Gorges University, Yichang, 443002, China
2 State Key Laboratory of Advanced Electromagnetic Engineering and Technology, Huazhong University of Science and Technology, Wuhan, 430074, China
* Corresponding Author: Linwei Yao. Email:
(This article belongs to the Special Issue: Integration of Hybrid Renewable Energy Systems for Sustainable Development)
Energy Engineering 2025, 122(8), 3285-3308. https://doi.org/10.32604/ee.2025.066628
Received 13 April 2025; Accepted 20 June 2025; Issue published 24 July 2025
 View Full Text
 Download PDF
Abstract
In order to address the synergistic optimization of energy efficiency improvement in the waste incineration power plant (WIPP) and renewable energy accommodation, an electricity-hydrogen-waste multi-energy system integrated with phase change material (PCM) thermal storage is proposed. First, a thermal energy management framework is constructed, combining PCM thermal storage with the alkaline electrolyzer (AE) waste heat recovery and the heat pump (HP), while establishing a PCM-driven waste drying system to enhance the efficiency of waste incineration power generation. Next, a flue gas treatment method based on purification-separation-storage coordination is adopted, achieving spatiotemporal decoupling between waste incineration and flue gas treatment. Subsequently, a two-stage optimal dispatching strategy for the multi-energy system is developed: the first stage establishes a day-ahead economic dispatch model with the objective of minimizing net system costs, while the second stage introduces model predictive control (MPC) to realize intraday rolling optimization. Finally, The optimal dispatching strategies under different scenarios are obtained using the Gurobi solver, followed by a comparative analysis of the optimized operational outcomes. Simulation results demonstrate that the proposed system optimizes the output and operational states of each unit, simultaneously reducing carbon trading costs while increasing electricity sales revenue. The proposed scheduling strategy demonstrates effective grid peak-shaving functionality, thereby simultaneously improving the system’s economic performance and operational flexibility while providing an innovative technical pathway for municipal solid waste (MSW) resource utilization and low-carbon transformation of energy systems.Keywords
With the acceleration of urbanization and the improvement of consumption levels, the production of municipal solid waste (MSW) has continued to rise [1,2]. In 2023, the collected volume of MSW reached 2.54 billion tons in China, with an incineration rate of 82.47% and a sanitary landfill rate of 7.45% [3]. However, sanitary landfill treatment presents multiple drawbacks, including excessive land occupation, risks of groundwater contamination, and methane emissions, which are increasingly incompatible with the goals of carbon peak and carbon neutrality [4,5]. As an efficient method for MSW treatment, the waste incineration power plant (WIPP) not only achieves waste reduction and harmless disposal but also facilitates effective resource recovery [6,7]. Against the backdrop of global decarbonization, traditional fossil fuel-dominated energy systems are confronted with multifaceted challenges such as resource scarcity, environmental pollution, and excessive carbon emissions [8,9]. While the large-scale deployment of renewable energy sources like wind and photovoltaic power has injected clean momentum into energy systems, their inherent intermittency and variability lead to significant curtailment issues, severely constraining the integration of renewable energy [10,11]. Therefore, investigating the coordinated operation of WIPP and renewable energy sources holds significant importance for promoting the clean energy transition in urban energy systems.
The characteristics of MSW are significantly influenced by the geographical environment, economic development, and residents’ living standards. There exist systematic differences in the composition and thermophysical properties of MSW between China and developed regions such as Europe and the United States [12]. In China, the proportion of food waste in MSW typically reaches 50%–60%, and this high organic content results in a moisture content generally ranging between 40%–60% [13,14]. The high moisture content not only increases the difficulty and cost of waste treatment but also reduces the calorific value of the waste, limiting the energy recovery efficiency of waste incineration [15,16]. Ling and Chen [17] proposed a novel cascaded waste heat recovery system for flue gas, comprising a Rankine cycle, an organic Rankine cycle, and a heat pump (HP) cycle, which effectively improved the utilization efficiency of incineration flue gas. Building upon this, Hong et al. [18] further incorporated the waste heat recovery from incineration bottom ash and proposed a carbon-reduction coordinative optimization model of the integrated energy system considering waste heat cascading utilization technology, thereby further exploring the potential of waste heat utilization in WIPP. Liu et al. [19] tested the flue gas composition and the flue gas temperature at the outlet of the economizer and explored the influence of flue gas recirculation on the efficiency of the incinerator-waste heat boiler and NOx emission in WIPP. Zhou et al. [20] proposed a system based on pre-drying and torrefaction of MSW feedstock, which improved waste incineration efficiency by recovering flue gas waste heat as a thermal source for the pre-drying or torrefaction stages. The aforementioned studies primarily focus on enhancing the energy efficiency of WIPP through flue gas waste heat recovery technologies, but they lack effective thermal energy storage, resulting in insufficient flexibility in system energy utilization. Moreover, the flue gas temperature exhibits significant fluctuation characteristics, directly affecting the stability of the heating system. Additionally, the waste drying pretreatment mentioned above relies solely on a single flue gas heat source, which suffers from inadequate heating capacity. These critical issues limit further improvement in the overall system performance.
Current research indicates that multiple heat sources can be applied to waste drying, and the optimal allocation of thermal energy management can be achieved through the integration of thermal energy storage devices. Among these, the alkaline electrolyzer (AE) and phase change material (PCM) demonstrate significant application potential. Specifically, AE can generate waste heat equivalent to 20%–30% of the input energy during operation, and efficient recovery and utilization of this energy could substantially improve overall energy efficiency. Meanwhile, PCM enables highly efficient thermal energy storage and release by absorbing and discharging large amounts of latent heat during phase transitions [21]. Due to the advantages of AE, such as high technological maturity and low equipment costs, as well as the high energy storage density and near-isothermal phase change characteristics of PCM [22], both have attracted extensive academic attention and research in the fields of waste heat recovery and thermal energy storage in recent years. Si et al. [23] designed a wind-hydrogen hybrid system incorporating waste heat utilization and established a dual-state constrained model for hydrogen and thermal dynamics in electrolyzers and proton exchange membrane fuel cells, thereby reducing the operational costs of the electricity-hydrogen-thermal hybrid energy storage system. Wang et al. [24] developed a cooperative dispatch model for an integrated electricity-heat-hydrogen energy system, which considered the delay characteristics of heat pipelines and hydrogen pipeline storage, thereby improving wind power consumption capability. Han et al. [25] proposed an integrated electricity-hydrogen-heat microgrid operation model, effectively coordinating power, hydrogen, and district heating systems. Li et al. [26] proposed a building envelope incorporating dynamic PCM, significantly reducing indoor temperature and heat flux on interior wall surfaces. Suo et al. [27] investigated the thermal performance of a battery thermal management system by combining PCM with air cooling, analyzing the effects of different PCM configurations and proportions. Singh et al. [28] investigated the influence of various thermal storage materials and nanoparticle-enhanced PCM on the performance of solar dryers. Manikandan et al. [29] investigated the technical characteristics of utilizing industrial and agricultural waste as PCM for thermal energy storage applications and revealed that waste-derived PCM exhibited high latent heat storage capacity, suitable phase transition temperatures, and reduced environmental impact, thereby significantly enhancing the performance of thermal energy storage systems. However, existing studies remain relatively limited in exploring AE waste heat recovery and PCM-based thermal storage applications in waste drying treatment, warranting further in-depth research.
To enhance the comprehensive energy utilization efficiency of the system, this paper proposes an electricity-hydrogen-waste multi-energy collaborative system. First, a steady-state efficiency-power model for AE is constructed, and PCM is utilized to store the waste heat recovered from the hydrogen production process as well as the thermal energy released by HP. Subsequently, PCM serves as a heat source for the drying pretreatment of waste. Meanwhile, a flue gas treatment mechanism combining purification and CO2 separation with a flue gas storage tank (FGST) is adopted, enabling the flue gas to be either purified and separated or temporarily stored in the storage unit. Furthermore, a two-stage optimal scheduling strategy incorporating model predictive control (MPC) is proposed for the multi-energy system, which optimizes system operation through day-ahead planning and intraday adjustments. Finally, a simulation case study is conducted to analyze and compare the operational economics, investment economics, and parameter sensitivity of the proposed scheme.
2 Electricity-Hydrogen-Waste Multi-Energy System Architecture
The proposed electricity-hydrogen-waste multi-energy system architecture is illustrated in Fig. 1. The power generation units of the system consist of wind turbines (WT), photovoltaics (PV), and WIPP, while the power consumption units include AE, HP, a flue gas purification device (FGPD), and a flue gas separation device (FGSD). Additionally, the system achieves surplus electricity utilization through grid-connected power sales.
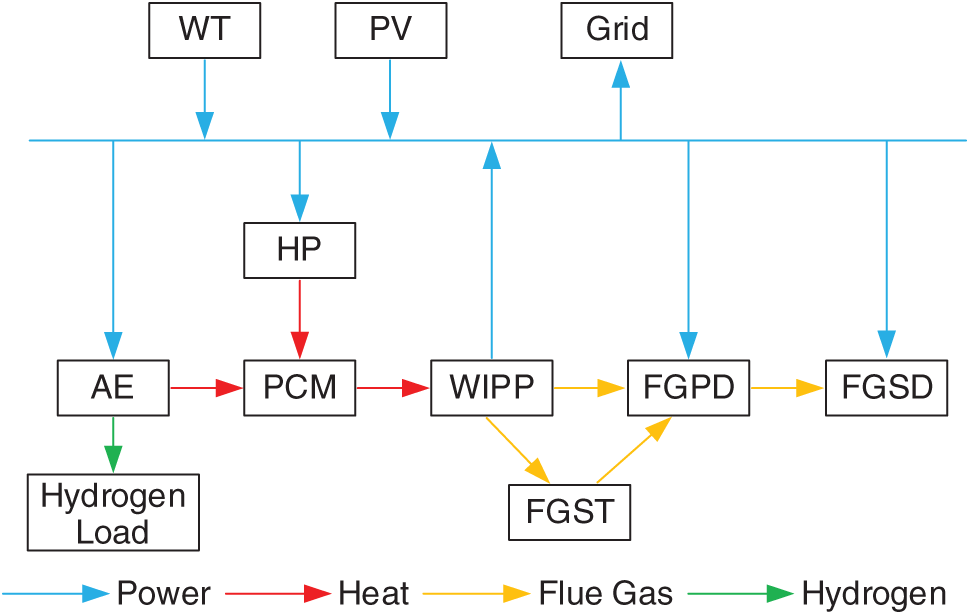
Figure 1: Architecture of electricity-hydrogen-waste multi-energy system
2.1 Alkaline Electrolyzer Model
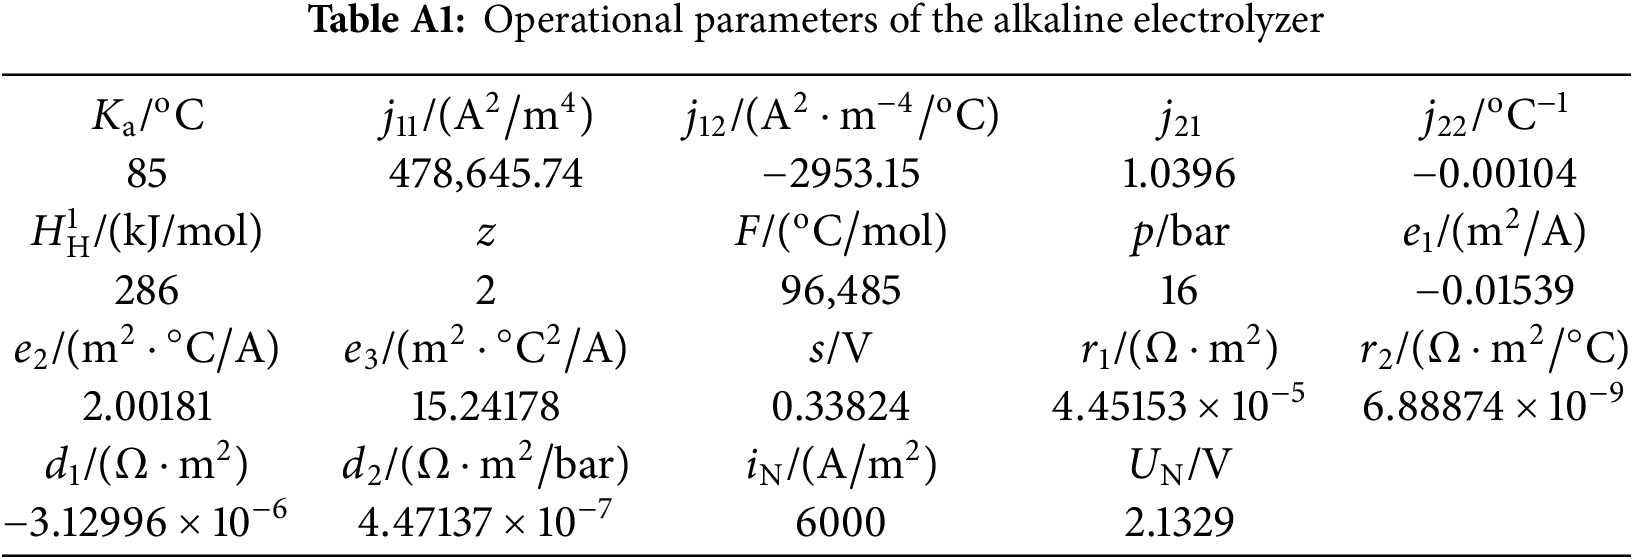
AE decomposes water into hydrogen and oxygen through an electrochemical reaction. The empirical equations for the electrochemical model of AE can be expressed as Eqs. (1) and (2) (parameters are detailed in Table A1 of Appendix A).
where:
Considering that variations in current density affect the hydrogen production efficiency of AE, a steady-state efficiency-power model is adopted for AE modeling [30]. Eq. (3) characterizes the relationship between the power consumption of AE and its voltage and current density. Eq. (4) describes the relationship between the hydrogen production power of AE, its efficiency, and its power consumption.
where:
The relationship between hydrogen production efficiency, hydrogen production power, and power consumption obtained from the aforementioned formula is illustrated in Fig. 2. As shown in Fig. 2. With the increase in AE power consumption, the hydrogen production efficiency initially rises and then declines, while the hydrogen production power exhibits a gradual upward trend. The hydrogen production efficiency reaches its peak value when the power consumption is approximately 7.5 MW. When the power consumption attains the rated power, the hydrogen production efficiency stabilizes at around 65%.
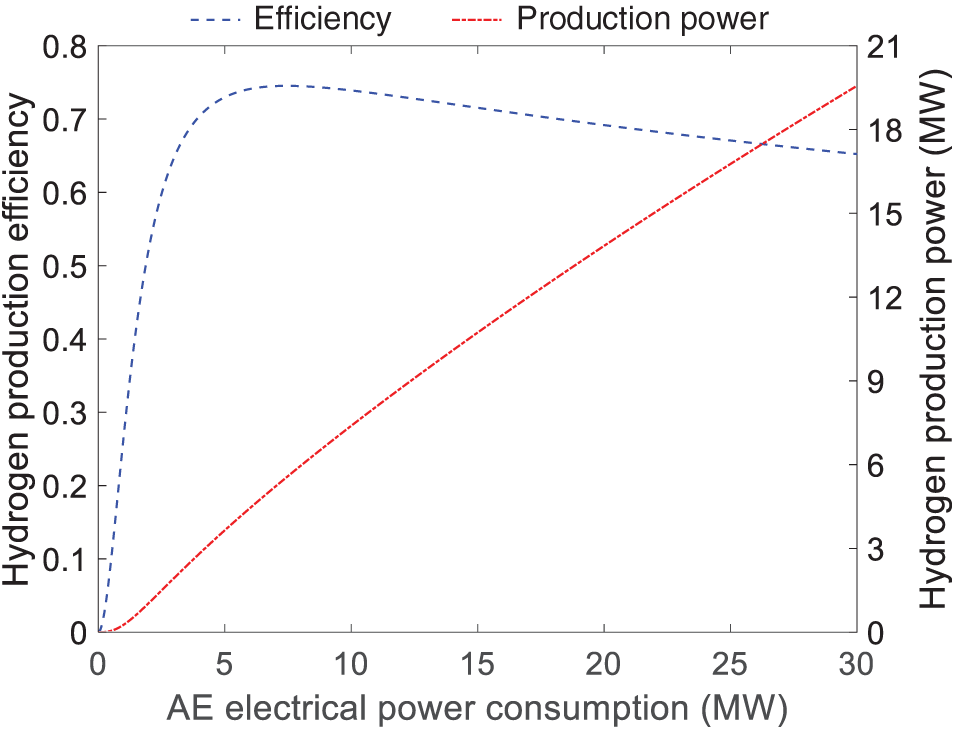
Figure 2: Relationship between hydrogen production efficiency and hydrogen production power of AE
During the water electrolysis process, AE releases a substantial amount of thermal energy. Eq. (5) describes the relationship between the waste heat recovery power of AE and its power consumption as well as the hydrogen production power. Eq. (6) describes the correlation between the mass of hydrogen produced by AE and its hydrogen production power.
where:
Eq. (7) ensures that the daily mass of hydrogen production from AE remains constant to meet the hydrogen demand. Eq. (8) defines the upper and lower bounds of the power consumption of AE. Eq. (9) constrains the ramp rate of the power consumption of AE.
where:
2.2 Phase Change Material Thermal Storage Model
PCM stores waste heat from AE and the converted thermal energy from HP through electro-thermal transformation, providing a heat source for waste drying. Eq. (10) describes the relationship between the heat absorption power of PCM and the waste heat recovery power of AE as well as the power consumption of HP. Eq. (11) describes the thermal storage capacity of PCM in relation to its heat absorption and heat release power.
where:
Eq. (12) defines the upper and lower bounds of the thermal storage capacity of PCM. Eq. (13) ensures that the thermal storage capacity returns to its initial value by the end of the scheduling period. Eqs. (14) and (15) define the upper and lower limits of the heat absorption and heat release power. Eq. (16) imposes that PCM cannot absorb and release heat simultaneously.
where:
Eq. (17) defines the upper and lower bounds of the power consumption of HP. Eq. (18) constrains the ramp rate of the power consumption of HP.
where:
The waste treatment model of WIPP is described by Eqs. (19)–(25).
(1) Waste drying
Eq. (19) describes the relationship between the PCM heat release power and the waste moisture content as well as the waste incineration mass. Eq. (20) ensures a fixed total daily waste incineration mass. Eq. (21) defines the upper and lower bounds of the waste moisture content. Eq. (22) defines the upper and lower bounds of the waste incineration mass.
where:
(2) Waste incineration power generation
Eq. (23) describes the relationship between the power generation of WIPP and the moisture content as well as the mass of incinerated waste. The unit power generation per mass of waste incineration can be approximated as a linear function of the waste moisture content. Eq. (24) defines the upper and lower bounds on the power generation of WIPP. Eq. (25) constrains the ramp rate of the power generation of WIPP.
where:
WIPP generates a significant volume of flue gas during the incineration process, which contains various pollutants as well as greenhouse gases such as CO2 [31]. The flue gas is initially treated by FGPD to remove pollutants, followed by FGSD to achieve effective isolation of greenhouse gases. To further optimize system operation, FGST is introduced to decouple the flue gas treatment process from waste incineration [32]. The flue gas treatment model of WIPP is described by Eqs. (26)–(37).
(1) Flue gas purification
Eq. (26) describes the linear relationship between the power consumption of FGPD and the flue gas treatment quantity. Eq. (27) describes the dependency of the flue gas incineration quantity on the power generation of WIPP. Eq. (28) describes the relationship between the purified flue gas quantity and flue gas flow splitting.
where:
Eq. (29) describes the relationship between the stored flue gas quantity of FGST and the inflow/outflow rates of flue gas. Eq. (30) ensures that the flue gas storage capacity returns to its initial value by the end of the scheduling period. Eq. (31) defines the upper and lower bounds on the flue gas storage capacity.
where:
Eqs. (32)–(34) constrain the flow rate of the flue gas pipeline. Eq. (35) imposes that the inflow and outflow of FGST cannot occur simultaneously.
where:
(2) Flue gas separation
Eq. (36) describes the relationship between the power consumption of FGSD and the CO2 separation quantity. Eq. (37) describes the correlation between the CO2 separation quantity and the flue gas purification quantity.
where:
3 Two-Stage Optimal Dispatching Strategy
As illustrated in Fig. 3, the electricity-hydrogen-waste multi-energy system adopts a two-stage optimal dispatching strategy consisting of day-ahead and intraday phases. In the day-ahead dispatching stage, with a 1-h temporal resolution and a 24-h dispatching horizon, the optimal operational plan for each subsystem is determined for the dispatching period. For the intraday dispatching phase, a rolling horizon optimization approach is employed, with a 15-min optimization step and a 4-h rolling window, to perform refined adjustments to the day-ahead dispatching plan.
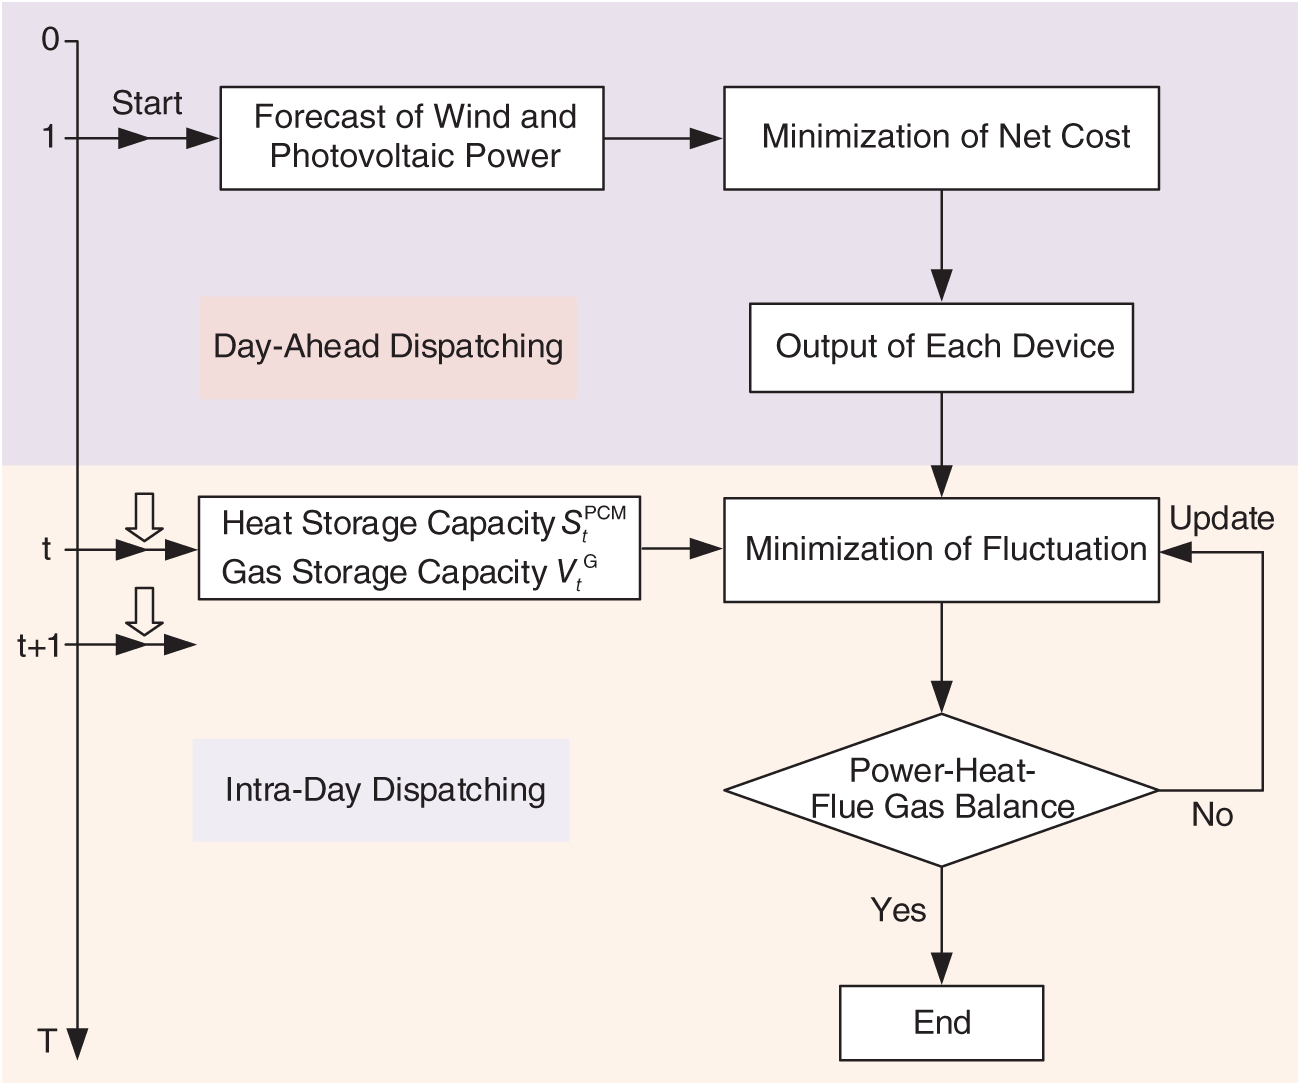
Figure 3: Flowchart of the two-stage optimal dispatching
Day-ahead dispatching aims to minimize the net expenditure within the dispatching period as its optimization objective, considering the economic efficiency of system operation. The system expenditures include flue gas treatment expenditure, carbon trading expenditure, and hydrogen production expenditure while the revenue is derived from grid-connected electricity sales. The objective function for day-ahead dispatching is given in Eq. (38). Eq. (39) describes the relationship between flue gas treatment expenditure and the power consumption of flue gas purification and separation. Eq. (40) describes the carbon trading expenditure as a function of the power generation of WIPP and flue gas treatment quantity. Eq. (41) describes the hydrogen production expenditure of AE in relation to its power consumption. Eq. (42) describes the electricity sales revenue as a function of the grid-connected power of the system. The day-ahead dispatching constraints encompass not only the constraints associated with individual units but also the system electrical power balance constraint, as specified in Eq. (43).
where:
To enhance readability, the technical coupling relationships among system modules are illustrated in Fig. 4.
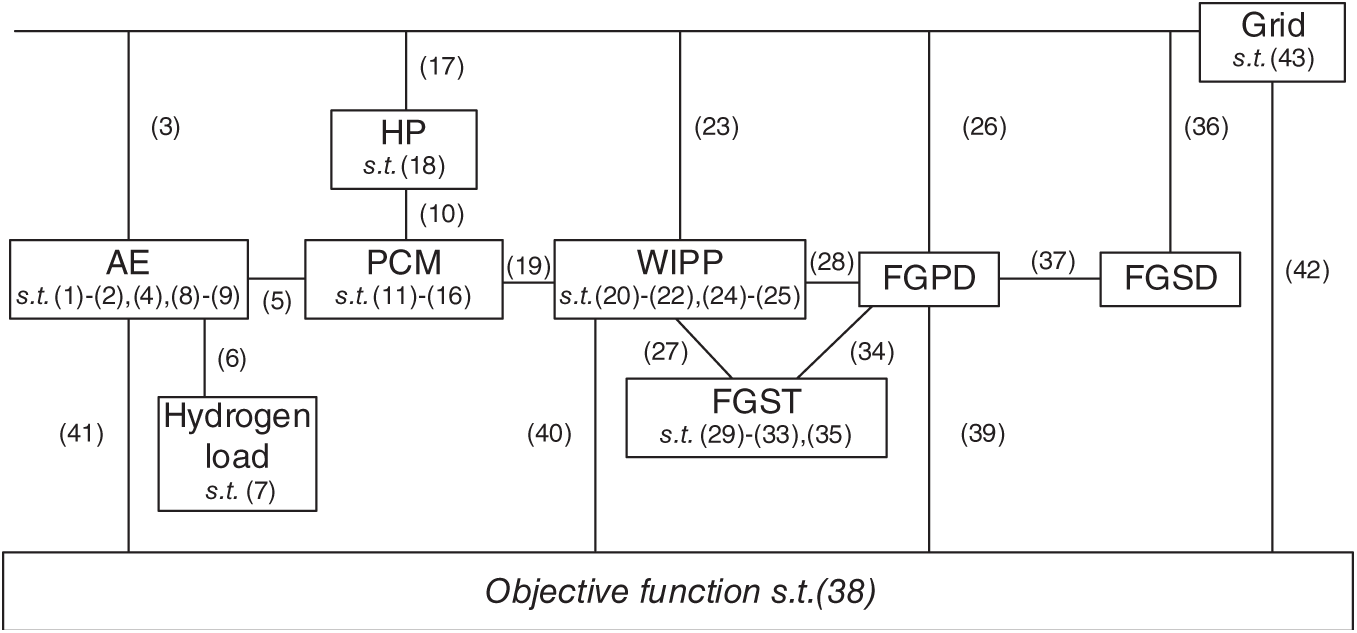
Figure 4: Inter-unit coupling mechanisms within the system
Intraday dispatching is performed based on the optimization results of day-ahead dispatching, employing MPC for rolling optimization to correct prediction deviations in the day-ahead dispatching plan. It adjusts the output of each unit, the thermal storage of PCM, and the gas storage of FGST to ensure the system meets the balance of electricity, heat, and flue gas. The objective function of intraday dispatching is described by Eq. (44). The constraints are similar to those of day-ahead dispatching, but due to the change in time resolution from 1 h to 15 min, adjustments are required for the constraints of relevant devices, as formulated in Eqs. (45)–(47). Eqs. (48) and (49) describe the relationship between thermal storage capacity and flue gas storage capacity in day-ahead scheduling and intraday scheduling.
where:
Here are the three operational schemes proposed for the electricity-hydrogen-waste multi-energy system:
Scheme 1: Consider PCM thermal storage and AE waste heat recovery.
Scheme 2: Consider AE waste heat recovery, regardless of PCM thermal storage. The heat required for waste drying is directly supplied by AE and HP.
Scheme 3: Regardless of PCM thermal storage and AE waste heat recovery. The heat required for waste drying is solely supplied by HP.
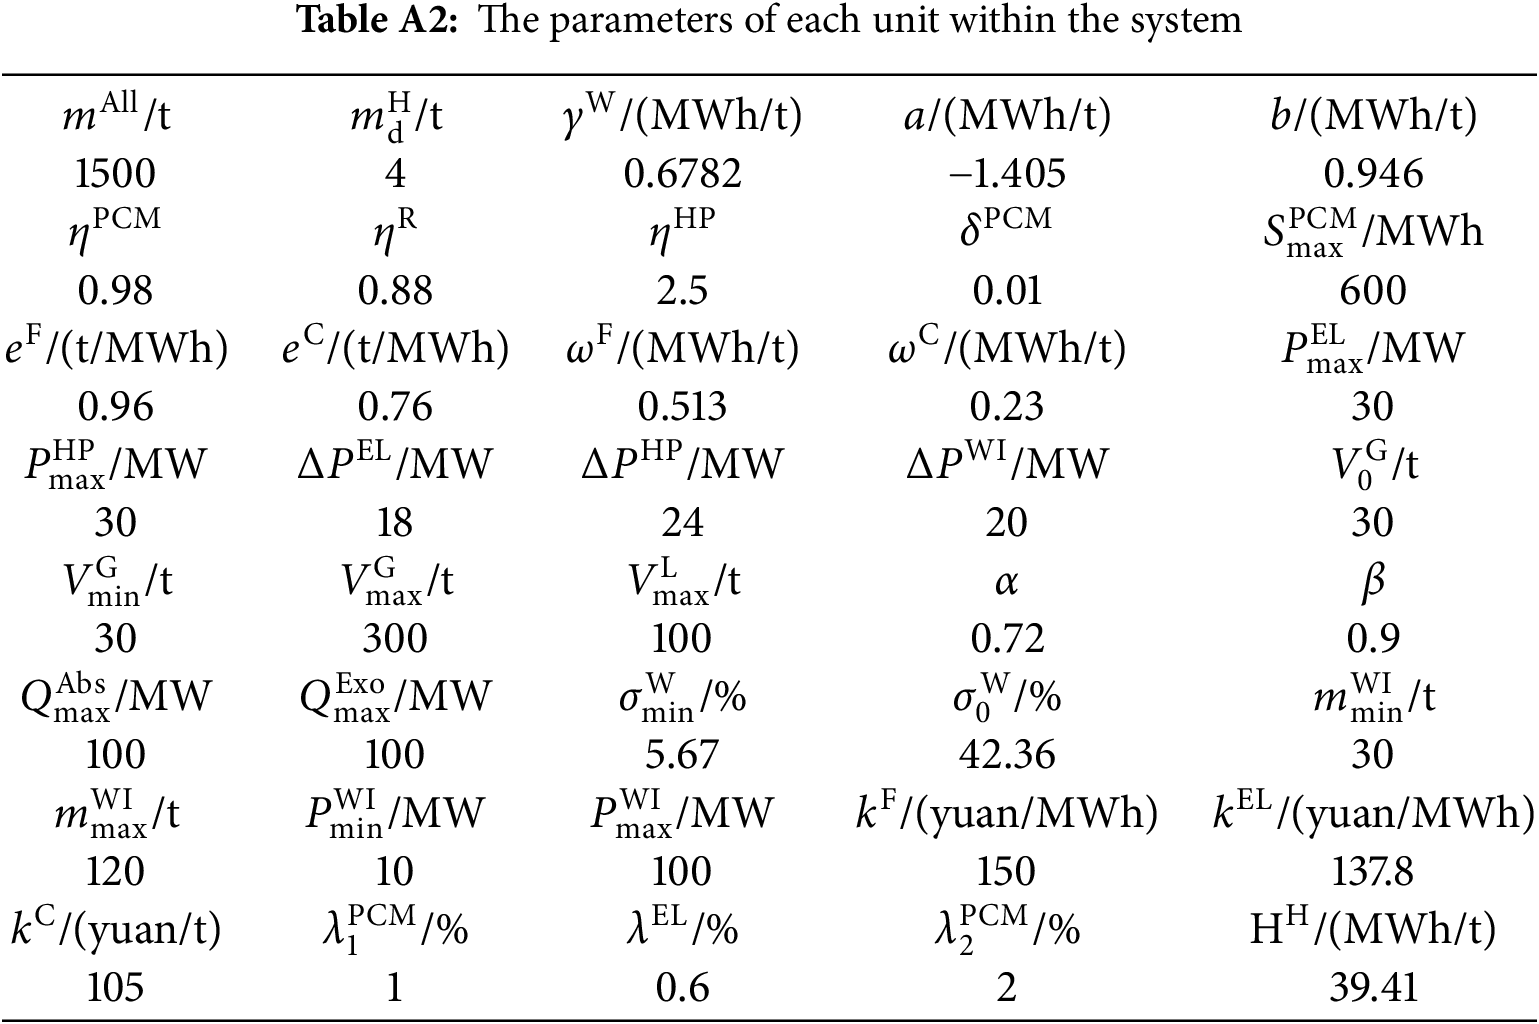
Taking the WIPP in southern China as a case study, the specific system parameters are provided in Table A2 of Appendix A, the 24-h grid electricity price curve is shown in Fig. 5, and the WT and PV power output curve is presented in Fig. 6.
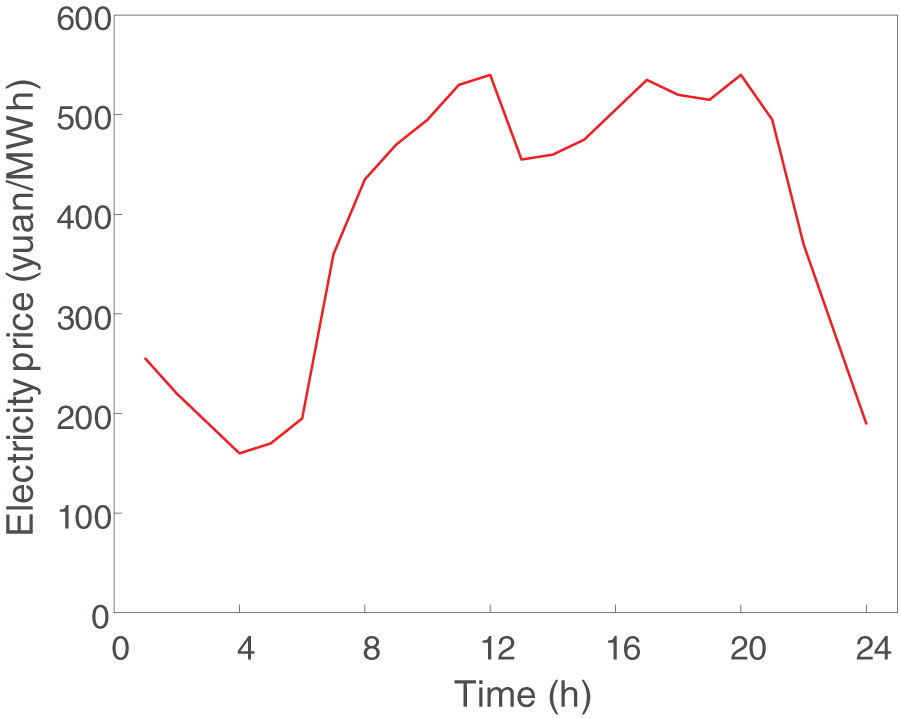
Figure 5: Electricity price curve
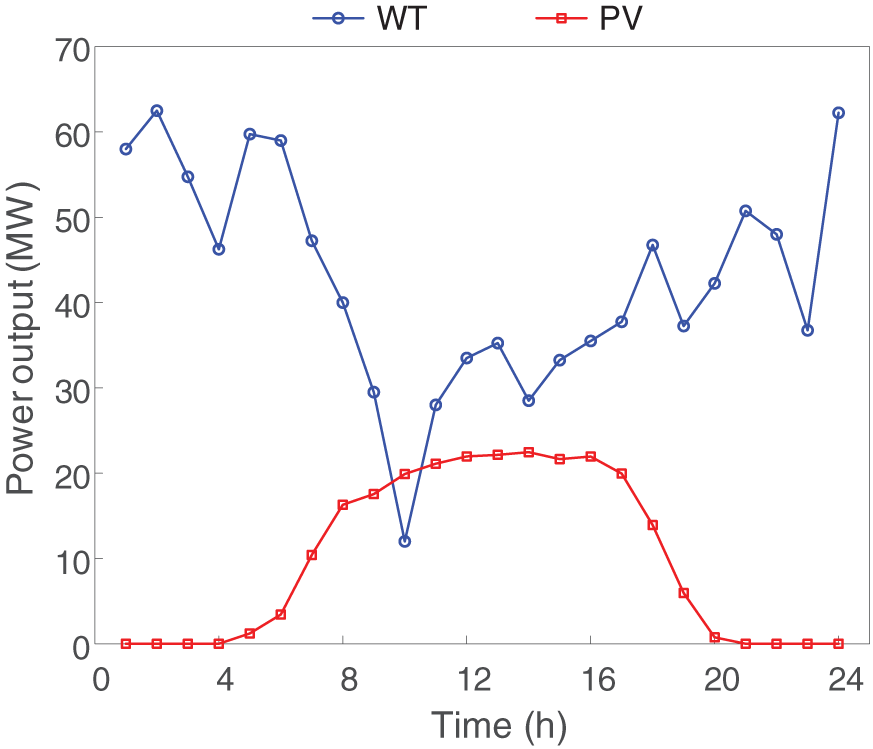
Figure 6: WT and PV power output curve
4.2 Simulation Results Analysis
To validate the correctness and effectiveness of the proposed model, the YALMIP toolbox in MATLAB is employed for modeling, and the Gurobi solver is invoked to perform the optimization solution. The simulation results of the electricity-hydrogen-waste multi-energy system under various operational schemes are presented in Figs. 7–15.
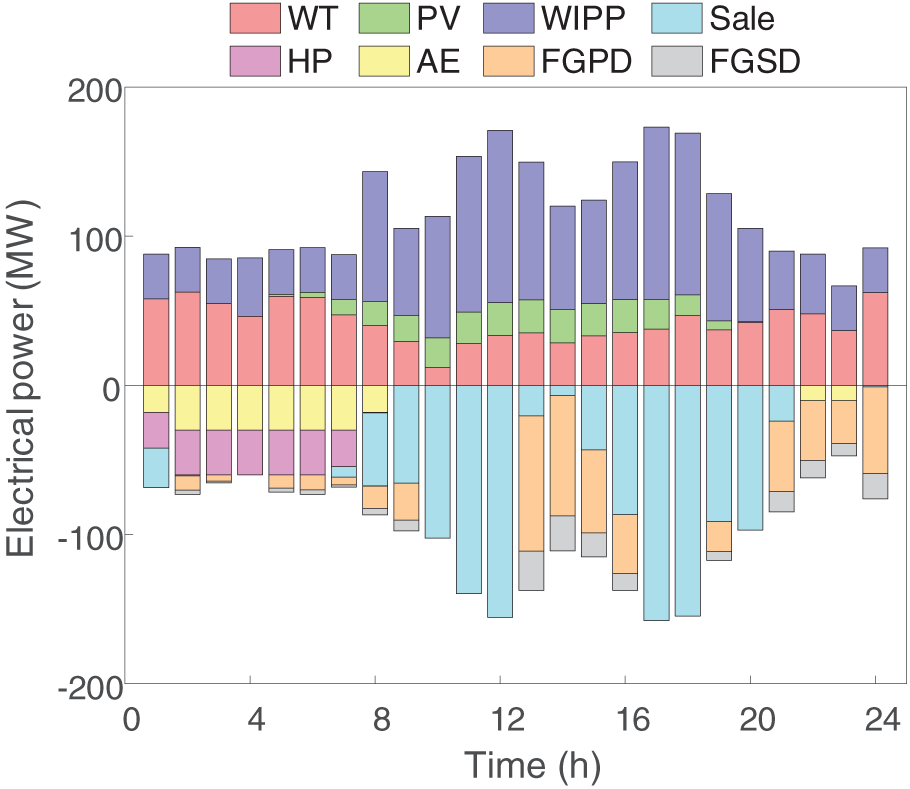
Figure 7: Scheme 1 electrical power balance
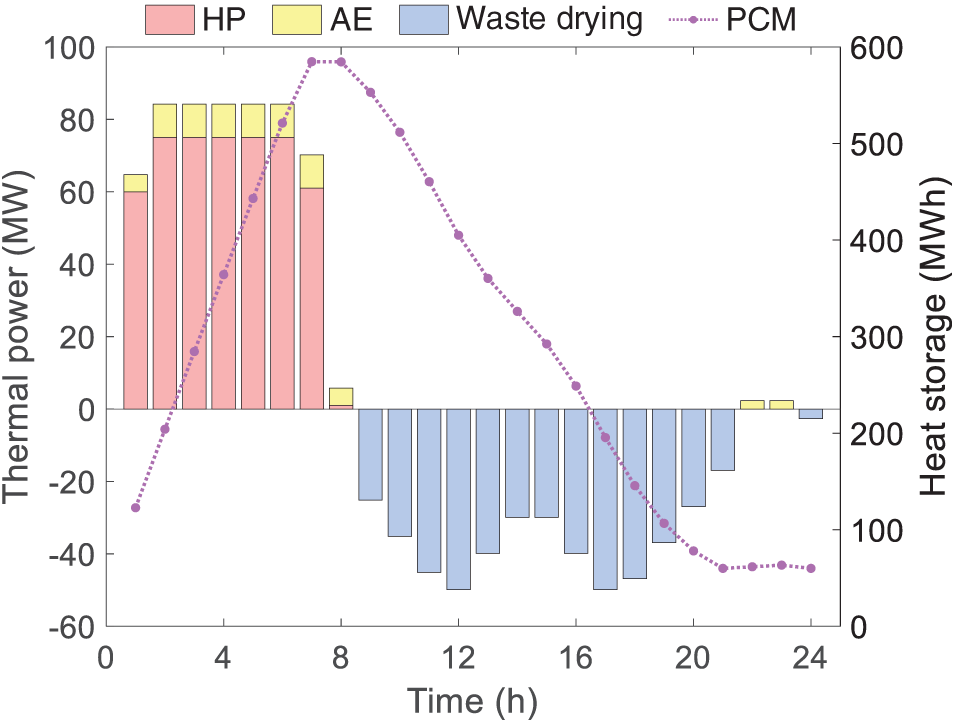
Figure 8: Scheme 1 thermal power balance
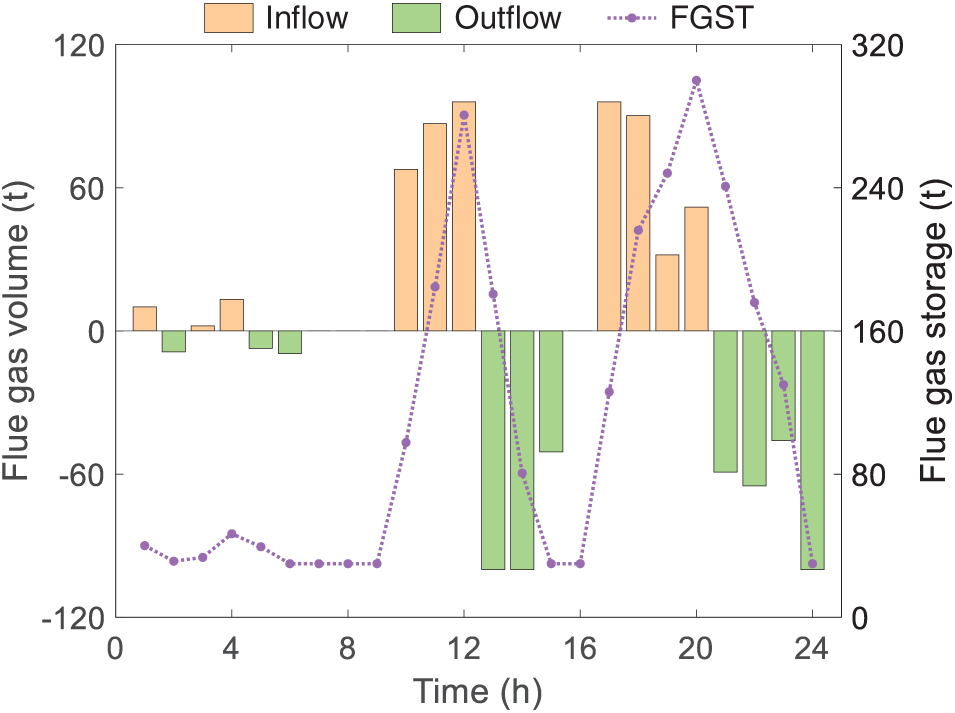
Figure 9: Scheme 1 flue gas balance
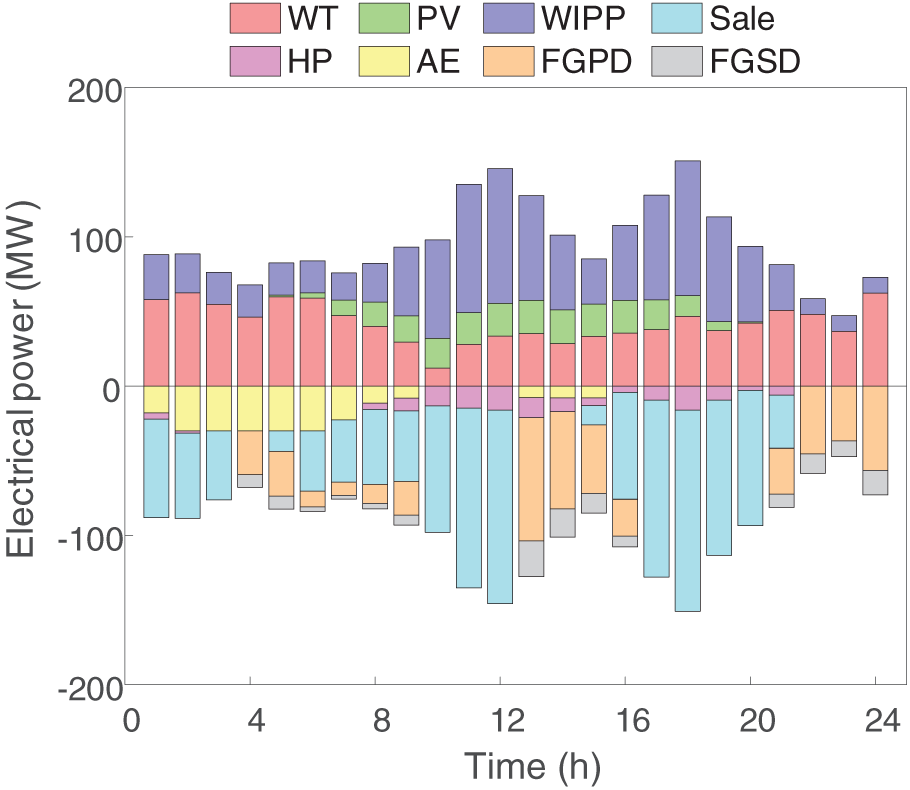
Figure 10: Scheme 2 electrical power balance
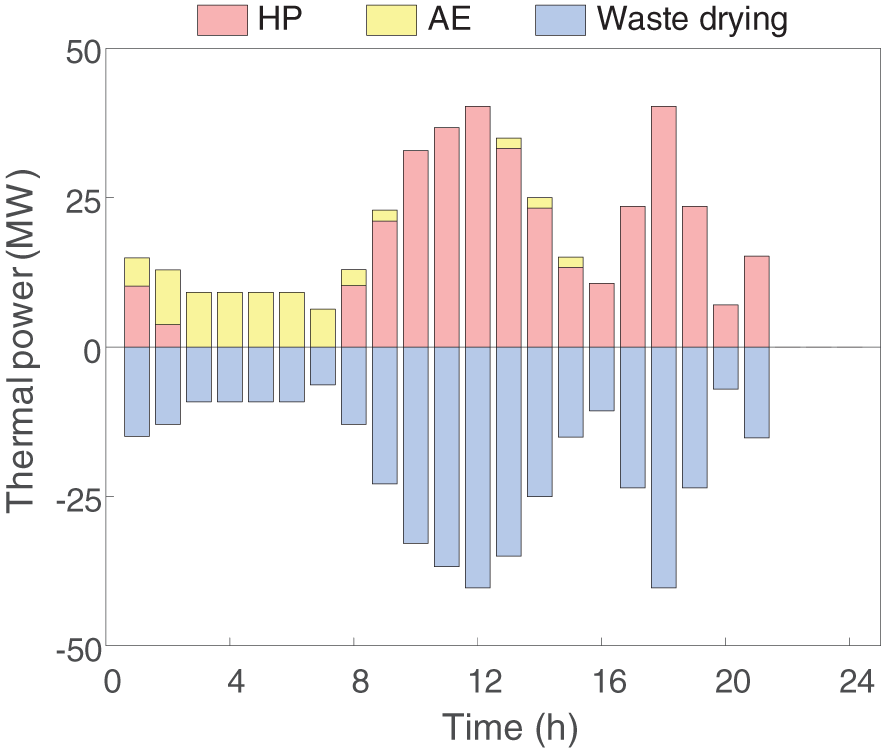
Figure 11: Scheme 2 thermal power balance
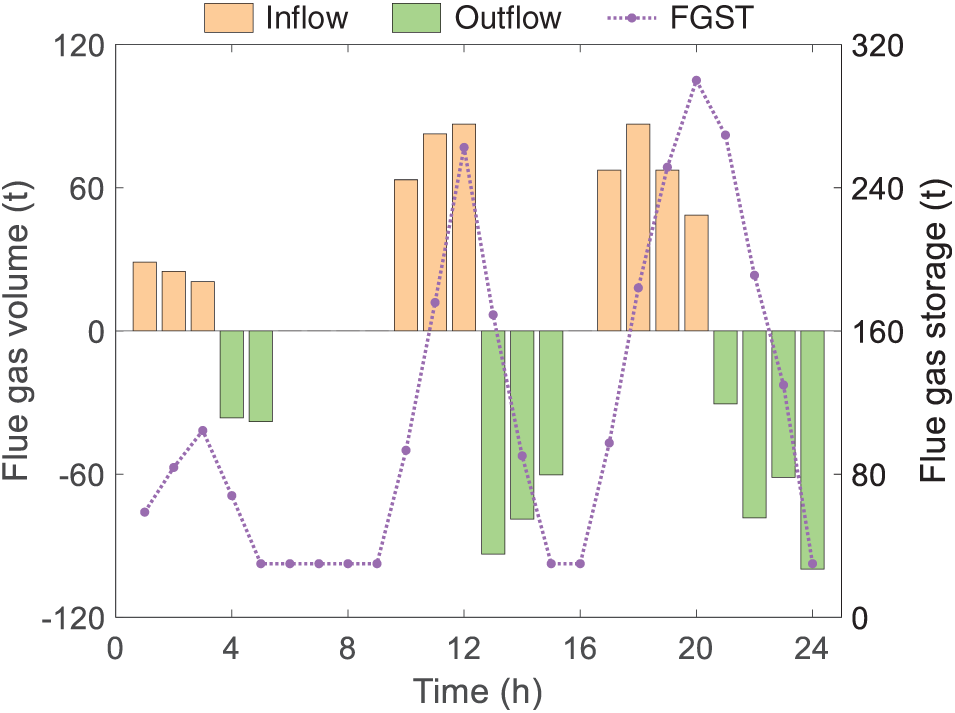
Figure 12: Scheme 2 flue gas balance
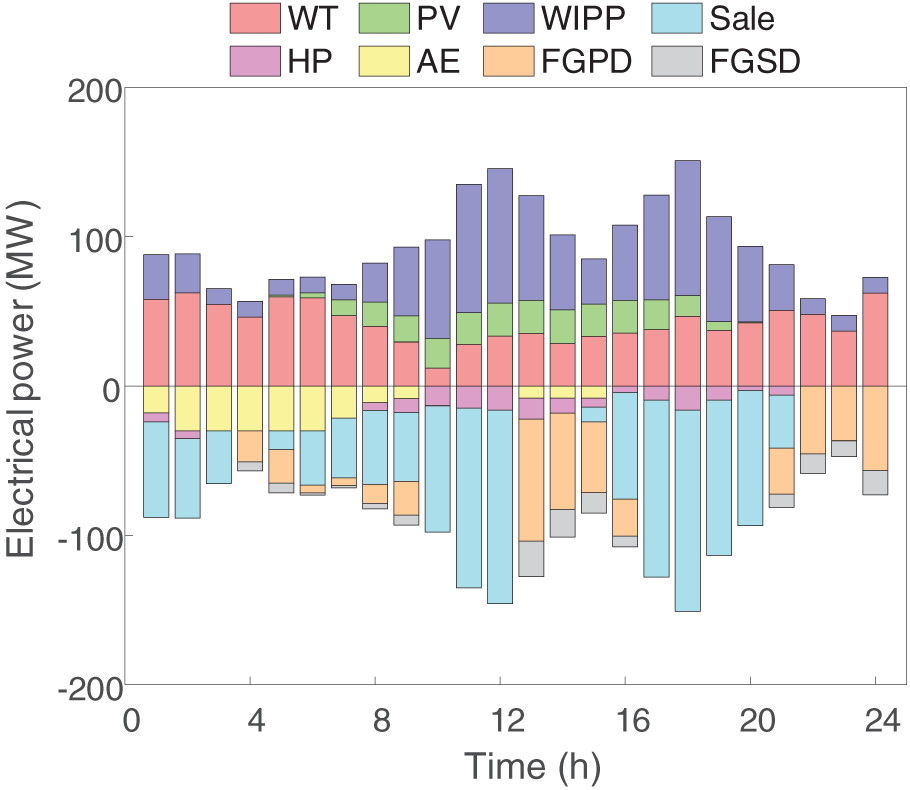
Figure 13: Scheme 3 electrical power balance
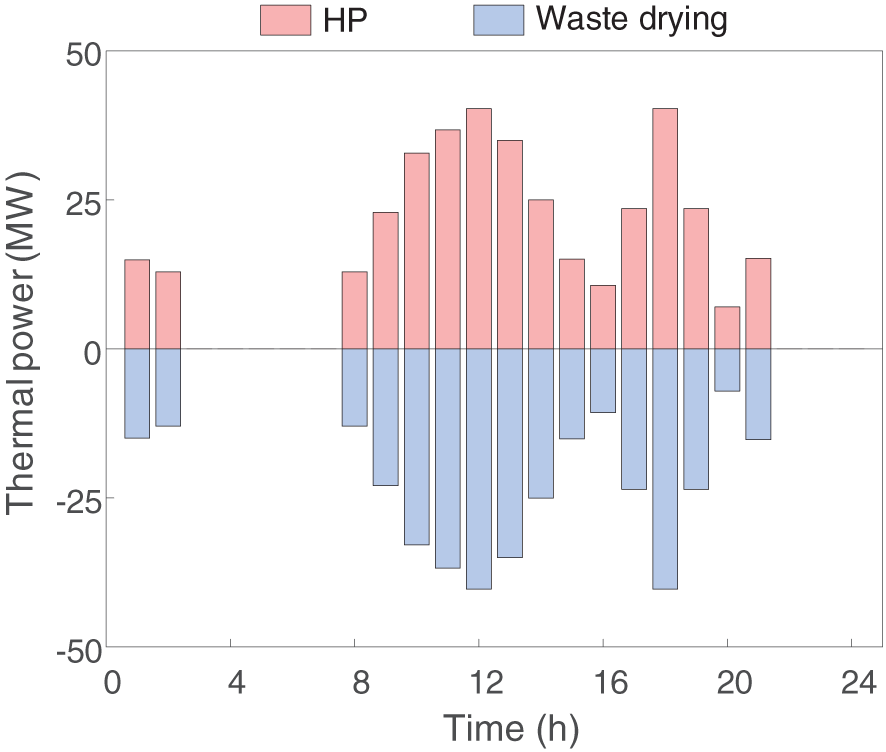
Figure 14: Scheme 3 thermal power balance
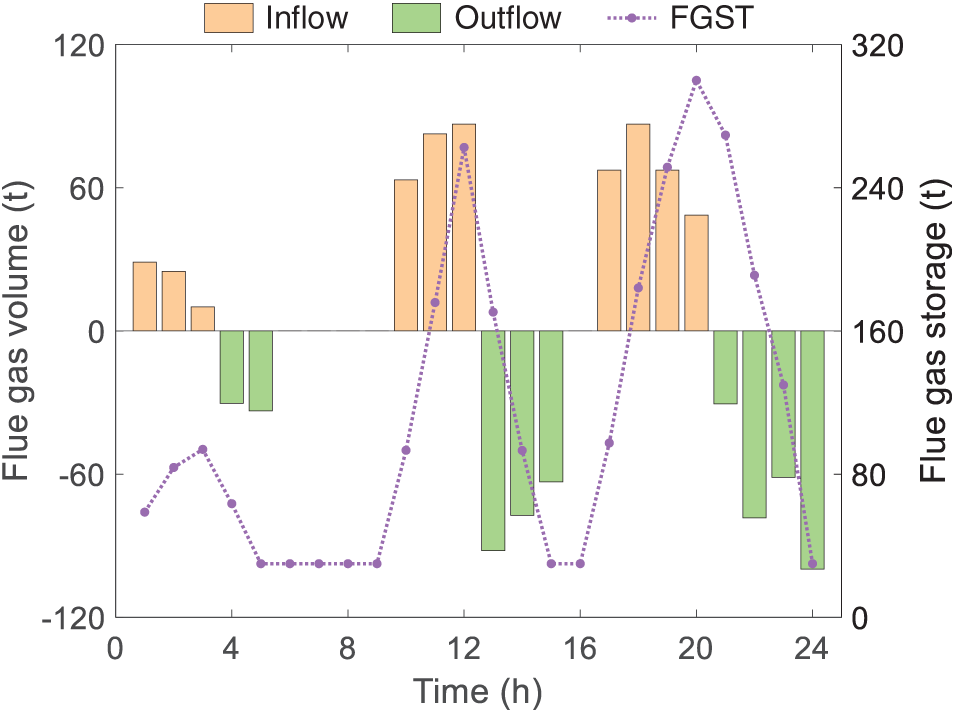
Figure 15: Scheme 3 flue gas balance
As illustrated in Fig. 7, the WT power output demonstrates a relatively balanced temporal distribution characteristic, with prominent generation periods occurring during 1:00–7:00 and 21:00–24:00. During the low electricity price interval from 1:00–7:00, the system prioritizes the utilization of wind resources to power AE for water electrolysis hydrogen production, while synergistically employing HP to accomplish electricity-to-heat conversion, thereby satisfying both the daily hydrogen load demands and PCM thermal storage requirements. PV power output is constrained by solar irradiance intensity, with its effective output period spanning from 5:00–20:00 and reaching peak power output during 11:00–16:00. The grid-connected electricity price maintains elevated levels during 8:00–21:00, correspondingly, WIPP power output is primarily concentrated during 9:00–20:00. The system’s electricity selling behavior exhibits a dual-peak characteristic, predominantly occurring during two intervals: 8:00–12:00 and 15:00–20:00. The flue gas treatment process is mainly distributed across 13:00–16:00 and 21:00–24:00 periods, encompassing two critical stages: flue gas purification and CO2 separation, which exhibit significant coupling characteristics in terms of power consumption.
As illustrated in Fig. 8, PCM exhibits distinct temporal decoupling characteristics in its heat charging and discharging processes. Specifically, the thermal storage capacity of PCM increases significantly when AE operates in synergy with HP, whereas it decreases correspondingly during the endothermic phase of the waste drying process. Waste drying operations are primarily concentrated between 9:00 and 21:00, a period that aligns well with the peak power output of WIPP. During this interval, PCM releases substantial latent heat to drive the waste drying process, thereby enhancing the energy coupling between waste drying and incineration power generation. The system prioritizes the scheduling of waste drying and incineration power generation during high electricity price periods. The more waste processed per unit time by WIPP, the more thorough the drying becomes, leading to greater heat demand for drying and consequently higher power generation. From 1:00 to 7:00, the system utilizes PCM to absorb heat from the electrothermal conversion of HP and waste heat recovery of AE, during which waste is incinerated directly without pretreatment.
As illustrated in Fig. 9, the inflow of flue gas into FGST predominantly occurs between 10:00–12:00 and 17:00–20:00, while outflow and subsequent treatment are concentrated during 13:00–15:00 and 21:00–24:00. During peak electricity price periods, the system temporarily stores flue gas from waste incineration in FGST, deferring purification to off-peak hours. However, due to the limited capacity of FGST and the throughput constraints of flue gas pipelines, dynamic coupling limitations persist between flue gas treatment and incineration power generation processes.
As illustrated in Figs. 10–12, Scheme 2 demonstrates the operational periods of AE are primarily concentrated between 1:00–9:00 and 13:00–15:00, while HP operates mainly during 1:00–2:00 and 8:00–21:00. Due to the absence of an effective thermal storage mechanism, the waste heat recovered by AE and the heat released by HP cannot be stored and can only be utilized in real-time for the waste drying process. Consequently, a tight real-time energy coupling relationship is formed among the AE waste heat, HP heat release, and waste drying heat absorption. In Scheme 2, waste drying operations are distributed between 1:00–21:00, whereas during 22:00–24:00, waste is directly fed into the incineration power generation process without drying. Compared with Scheme 1, the amount of waste heat recovered by AE in Scheme 2 remains largely unchanged, but the power consumption and heat output of HP are significantly reduced. This leads to a decrease in the available heat for waste drying, resulting in suboptimal drying performance and a consequent decline in the overall power output of WIPP. Furthermore, the variation trend of flue gas storage in FGST in Scheme 2 is similar to that in Scheme 1, but the temporal distribution of flue gas inflow and outflow exhibits more dispersed characteristics.
As illustrated in Figs. 13–15, Scheme 3 demonstrates similar performance to Scheme 2 in terms of electrical power output, thermal power distribution, and flue gas balance characteristics. Notably, a significant coupling relationship is observed between the heat release process of HP and the heat absorption process of waste drying. The waste drying operation is only conducted during two time periods: 1:00–2:00 and 8:00–21:00. Although the power consumption characteristics of HP are largely comparable to those of Scheme 2, the failure to effectively utilize the waste heat resources from AE results in relatively lower efficiency in waste drying, thereby adversely affecting the overall power output level of WIPP.
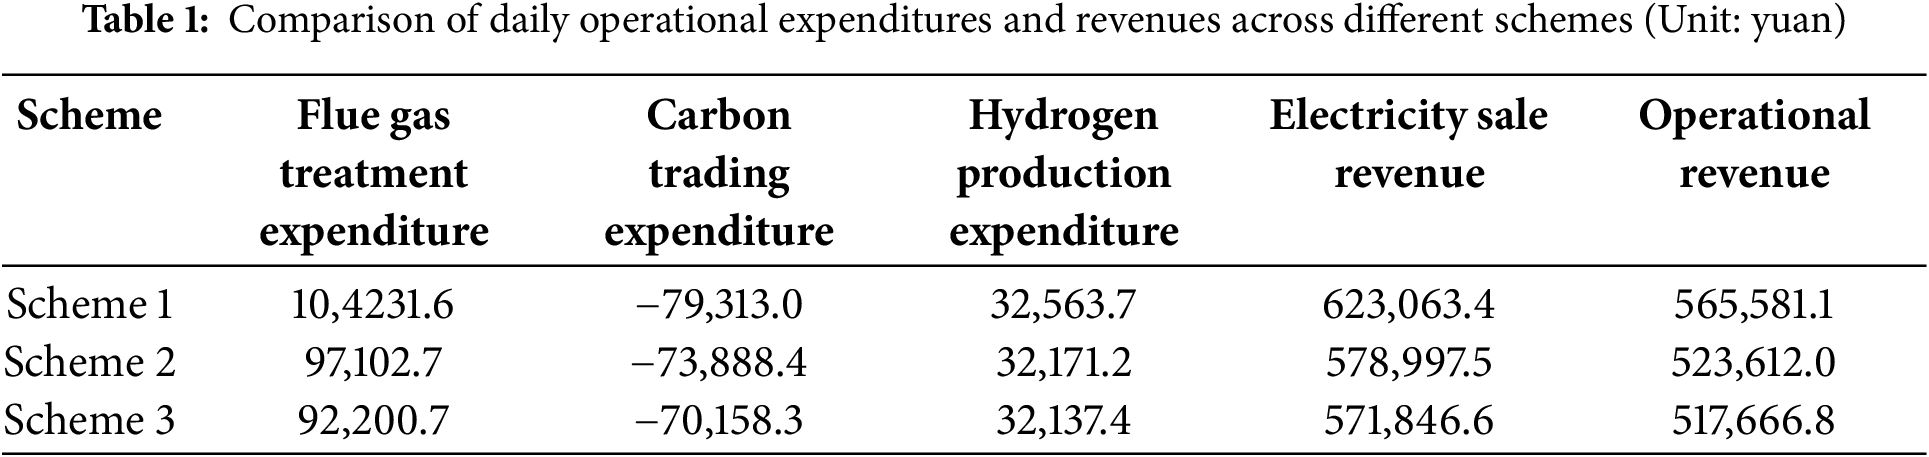
(1) Comparative Analysis of Operational Economics
Based on the statistical analysis of simulation results, the daily expenditures and revenues of each scheme are obtained. The daily operational revenue is calculated by subtracting flue gas treatment expenditure, carbon trading expenditure, and hydrogen production expenditure from electricity sales revenue, as presented in Table 1. Scheme 1 demonstrates the highest flue gas treatment and hydrogen production expenditure, the lowest carbon trading expenditure, and the highest grid-connected revenue and operational expenditure. This is attributed to Scheme 1’s WIPP generating the maximum power output, resulting in the highest flue gas emissions and the largest carbon emission allowances. Compared with Scheme 1, Scheme 2 shows a significant reduction in flue gas treatment expenditure, accompanied by a substantial decrease in grid-connected revenue and a notable decline in operational revenue. Relative to Scheme 2, Scheme 3 exhibits further reductions in both grid-connected revenue and operational revenue. Overall, the operational revenue of Scheme 1 is approximately 7.42% and 8.47% higher than that of Schemes 2 and 3, respectively, indicating that PCM thermal storage and AE waste heat recovery significantly enhance the system’s economic performance.
(2) Comparative Evaluation of Investment Economics
In the current comparative analysis of operational performance, the differences in initial investment expenditure among various schemes have not been comprehensively considered. Therefore, a comparative analysis of the investment economics of Scheme 1 and Scheme 2 relative to Scheme 3 is conducted. According to the equipment parameter settings, the design operational lifetimes of PCM, AE, and the waste heat recovery device are all 15 years. Specifically, the unit investment expenditure of PCM is 120,000 yuan/MWh [33], with a total investment of 72 million yuan; the unit investment expenditure of the waste heat recovery system for AE is 600,000 yuan/MW [34], with a total investment of 18 million yuan. During long-term operation, the performance of PCM and AE exhibits degradation characteristics [35]. The thermal storage capacity and charge-discharge efficiency of PCM, as well as the hydrogen production efficiency of AE, gradually decline with increasing operational years, as mathematically characterized by Eqs. (50)–(52). Fig. 16 illustrates the attenuation characteristics of AE’s hydrogen production efficiency as a function of operational years.
where:

Figure 16: The annual efficiency degradation curve of AE
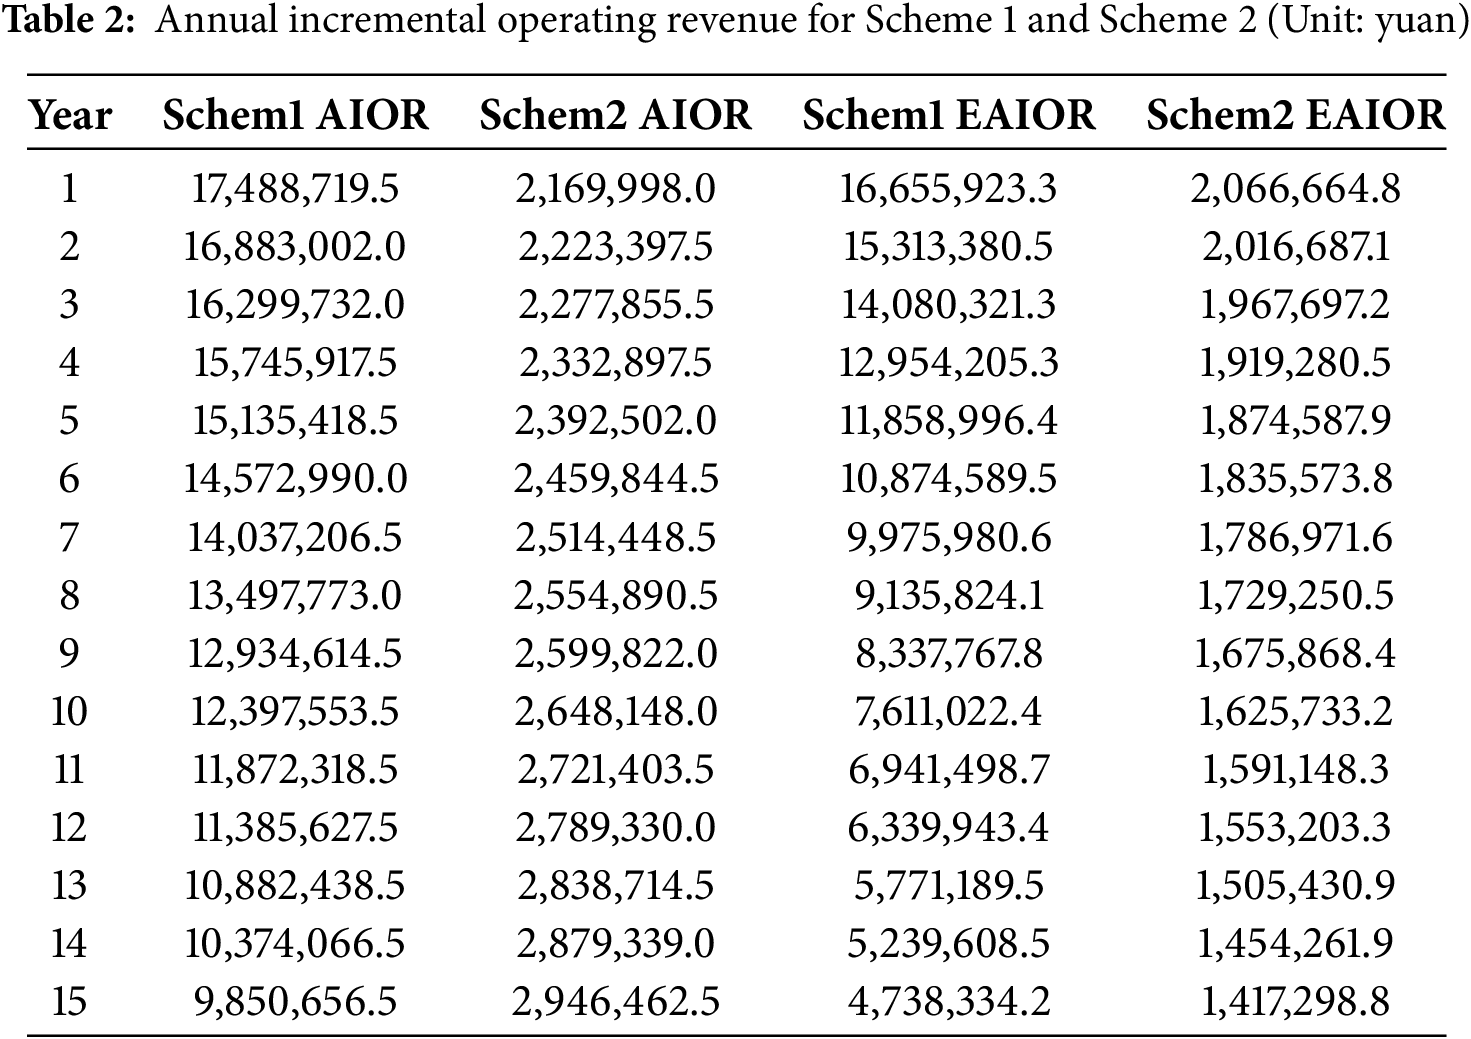
Based on the life-cycle expenditure analysis method, an economic comparison was conducted among the three proposed schemes. Specifically, the daily operational revenue of each scheme is first obtained through operational economic analysis at the daily timescale. These daily revenues are then accumulated over 365 operating days per year to derive the annual operational revenue for each scheme. Subsequently, the annual incremental operational revenue (AIOR) of Scheme 1 and Scheme 2 relative to Scheme 3 is calculated. To further evaluate the time value of economic revenue, a discount rate of 5% is applied to discount the annual incremental revenues, ultimately yielding the equivalent annual incremental operational revenue (EAIOR) for Scheme 1 and Scheme 2. The specific results are presented in Table 2.
Based on the cumulative EAIOR of Scheme 1 and Scheme 2, the total EAIOR over the entire life cycle compared to Scheme 3 are obtained. Subsequently, the net present value (NPV) of Scheme 1 and Scheme 2 is derived by deducting capital expenditure (CAPEX) from the 15-year equivalent AIOR. Finally, the relative payback period and internal rate of return (IRR) of Scheme 1 and Scheme 2 compared to Scheme 3 are calculated. The specific computational results are presented in Table 3.
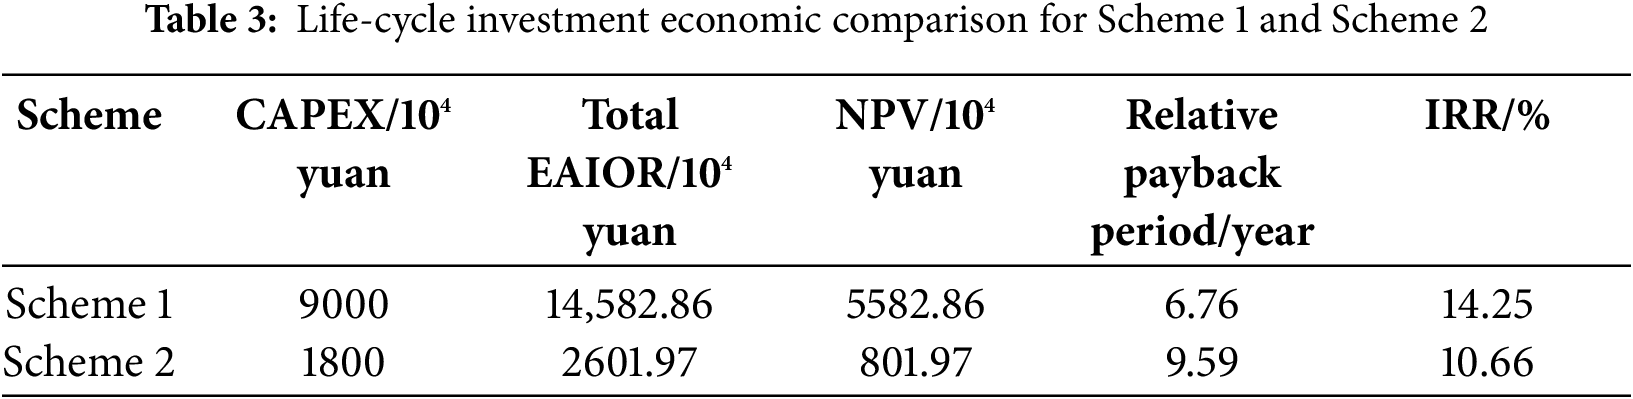
Compared with Scheme 3, Scheme 1 requires a CAPEX of 90 million yuan, but yields an NPV of 55.83 million yuan over 15 years. Its IRR reaches 14.25%, which exceeds the benchmark return level of the power industry. Moreover, its relative payback period is 6.76 years, shorter than the designed service life. In contrast, Scheme 2 involves a CAPEX of 18 million yuan compared with Scheme 3, achieving an NPV of 8.02 million yuan over 15 years, with an IRR of 10.66% and a relative payback period of 9.59 years. The comprehensive comparison demonstrates that Scheme 1 outperforms Scheme 2 in terms of higher NPV, a shorter payback period, and a superior IRR, indicating more favorable economic viability for investment.
4.4 Sensitivity Analysis of Parameters
To investigate the impact of variations in system parameters on the economic performance of the proposed scheme, a sensitivity analysis is conducted on PCM size, hydrogen demand, initial moisture content of waste, electricity price, as well as WT and PV power output. By comparing the percentage by which the operational revenue of Scheme 1 leads that of Schemes 2 and 3, the operational economy of Scheme 1 relative to Schemes 2 and 3 under different parameters is analyzed.
(1) PCM size
The size of PCM is evaluated based on its maximum thermal storage capacity, with a baseline of 600 MWh and a variation range of 500 to 700 MWh, as illustrated in Fig. 17.
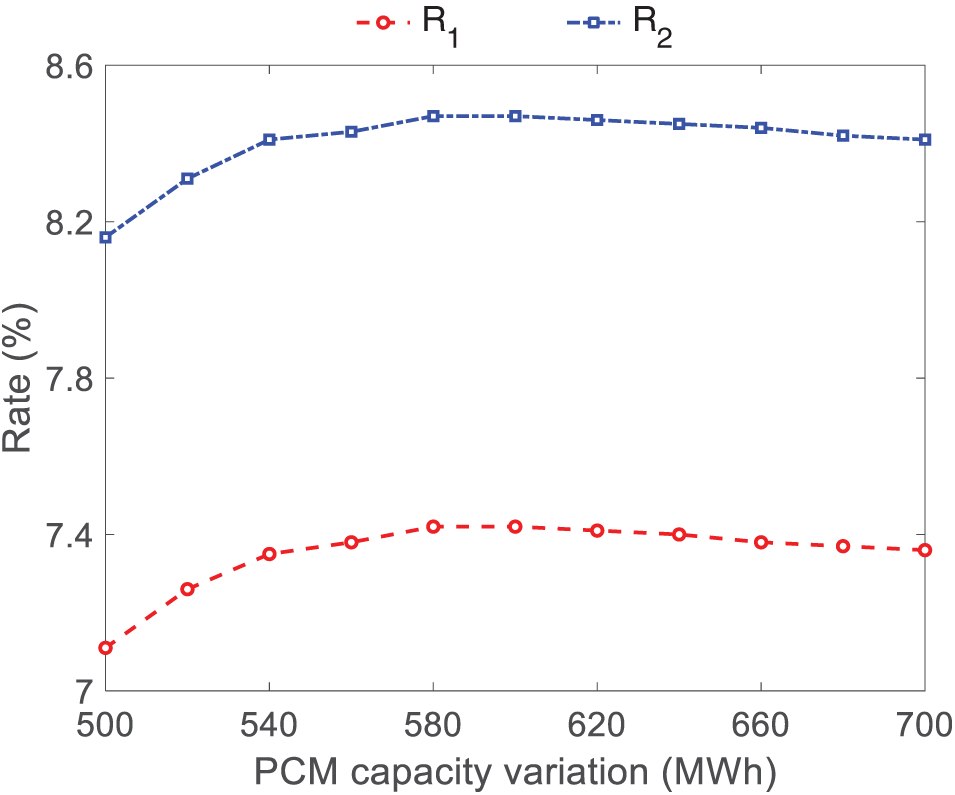
Figure 17: Size sensitivity of PCM
The economic performance of Scheme 1 is optimal when the maximum thermal storage capacity of PCM ranges between 580–600 MWh. However, when the capacity falls below 580 MWh or exceeds 600 MWh, the economic efficiency of Scheme 1 declines. Considering the capacity margin of the PCM, 600 MWh is selected as the maximum thermal storage capacity.
(2) Hydrogen demand
The hydrogen demand is quantified by the daily hydrogen production mass, with a baseline value of 4 t and an operational range of 3 to 5 t, as illustrated in Fig. 18.
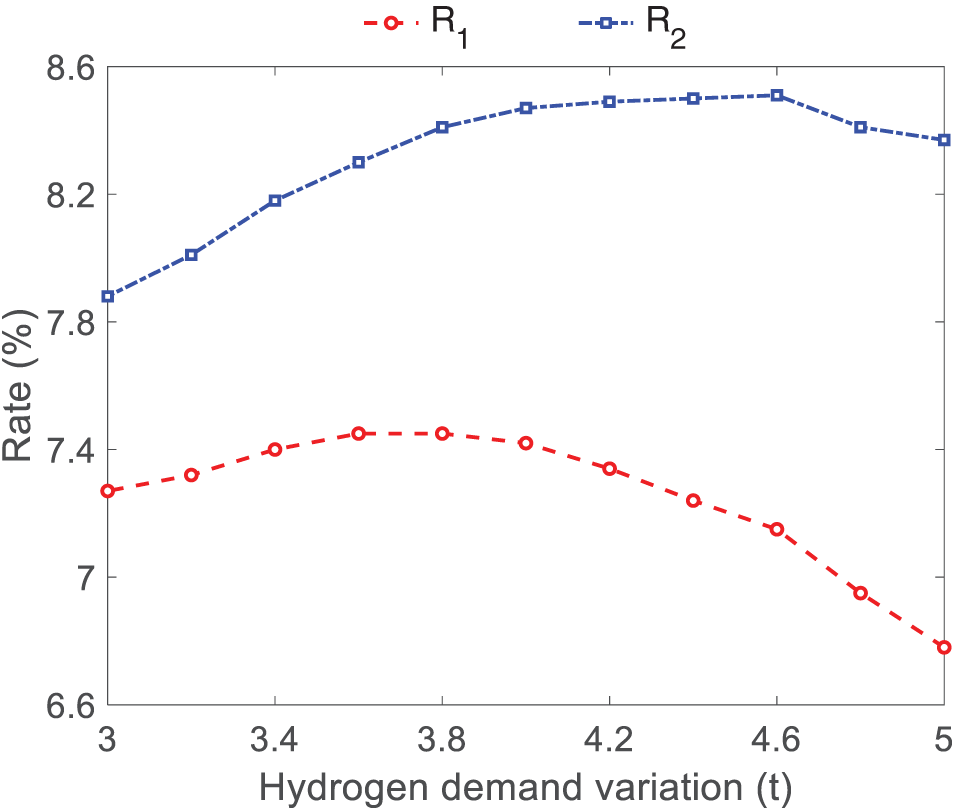
Figure 18: Hydrogen demand sensitivity
Scheme 1 demonstrates optimal economic performance compared to Scheme 3 when the daily hydrogen production reaches 4.6 t. For daily production levels between 3.6–3.8 t, Scheme 1 exhibits superior economic efficiency relative to Scheme 2. Considering the comprehensive economic evaluation of Scheme 1, a system design with a daily hydrogen production mass of 4 t is ultimately selected.
(3) Initial moisture content of waste
The initial moisture content of waste is set at 42.36% as the baseline, with a variation range of 31.77% to 52.95%, as illustrated in Fig. 19.

Figure 19: Sensitivity to initial moisture content of waste
The initial moisture content of waste significantly impacts the economic performance of the system. As the initial moisture content increases, the economic viability of Scheme 1 initially improves before declining, reaching its optimal economic efficiency at a moisture content of 42.36%.
(4) Electricity price
The grid-connected electricity price is determined based on the baseline electricity price, with its fluctuation range set between 80% and 120% of the baseline price, as illustrated in Fig. 20.
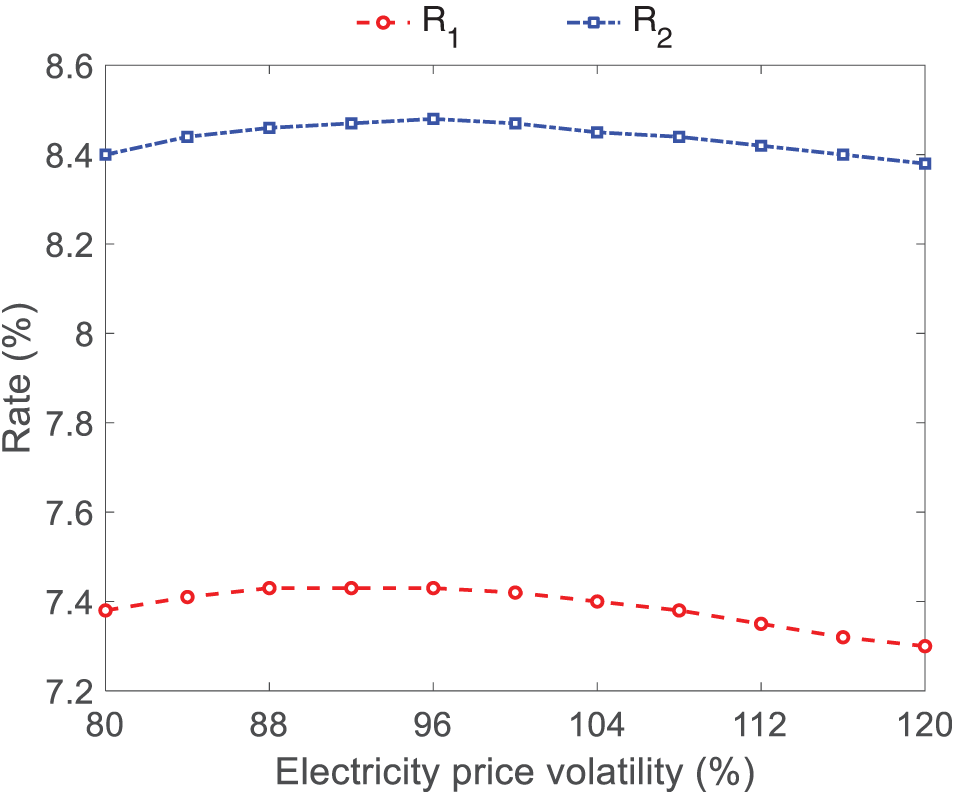
Figure 20: Electricity price sensitivity
The fluctuation of electricity prices has a relatively minor impact on system economics. Specifically, the economic advantage of Scheme 1 over Scheme 3 remains approximately 8.4%, while that of Scheme 1 over Scheme 2 stays around 7.4%.
(5) WT and PV power output
The WT and PV power output is bounded within 80% to 120% of the baseline generation capacity, with the variation range illustrated in Fig. 21.
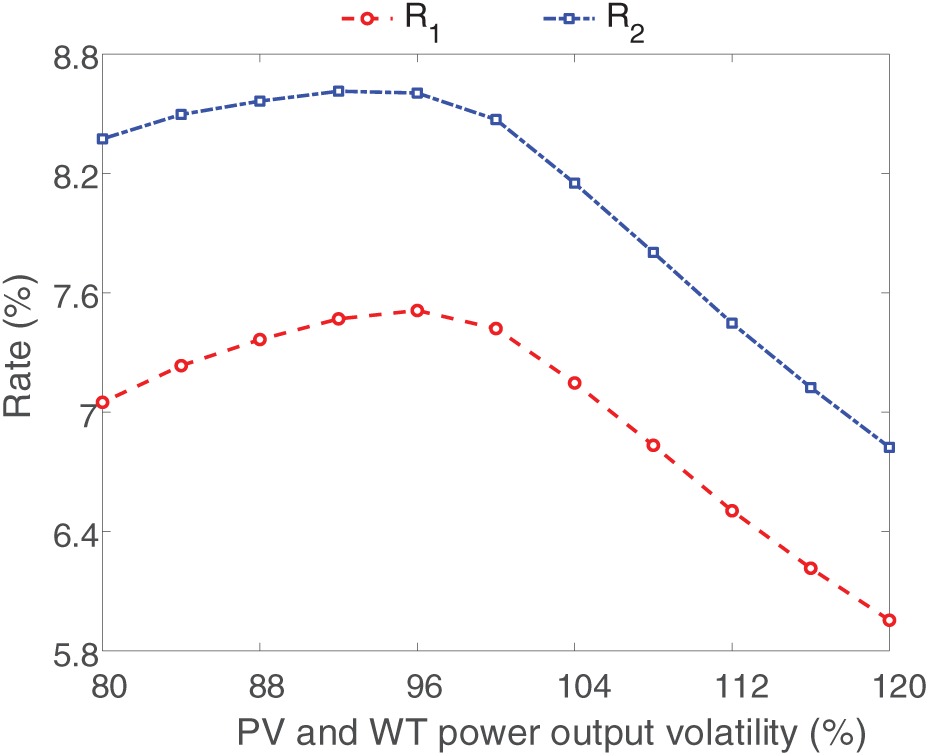
Figure 21: Sensitivity to WT and PV power output
The system exhibits high sensitivity to WT and PV power output variations. Specifically, Scheme 1 demonstrates optimal economic performance when WT and PV generation maintains approximately 96% of its original output level. However, its economic efficiency shows a progressive decline when WT and PV output exceeds the baseline level.
Overall, the economic efficiency of Scheme 1 follows a first-increasing-then-decreasing trend with respect to parameter variations. Under fluctuating system conditions, Scheme 1 consistently outperforms Scheme 2 and Scheme 3, basically maintaining a profit margin advantage of over 5%, thereby demonstrating robust economic viability.
This paper proposes a two-stage optimal scheduling strategy for an integrated electricity-hydrogen-waste multi-energy system incorporating PCM and AE. The core mechanism lies in utilizing PCM to recover waste heat from AE along with heat generated by HP for waste drying, thereby reducing moisture content in waste and enhancing per-unit waste-to-energy conversion efficiency. Furthermore, FGST establishes an integrated purification-separation-storage flue gas treatment approach, decoupling the interdependence between waste incineration power generation and flue gas treatment processes. Finally, a two-stage optimization scheduling model combining day-ahead economic dispatch with intraday rolling optimization is adopted to optimize the output and operational states of system components, mitigating the negative impacts of prediction errors on power, heat, and flue gas balance.
Experimental data demonstrate that the system improves economic performance through thermal storage and multi-energy coordination, promotes renewable energy consumption, and achieves peak shaving and valley filling in the power grid. The incorporation of FGST significantly enhances the flexibility of flue gas treatment while reducing system carbon emissions, yielding notable environmental benefits. Specifically, PCM and the waste heat recovery device of AE increase operating revenue by 8.47%, with an internal rate of return reaching 14.25%, indicating excellent economic and investment returns.
This study verifies the technical feasibility of the electricity-hydrogen-waste multi-energy system and optimizes spatiotemporal energy distribution. The system demonstrates outstanding engineering application value in improving energy conversion efficiency and realizing waste heat recovery. Future research will further investigate synergistic operation mechanisms among system components and refine the model to enhance overall system performance and applicability.
Acknowledgement: Not applicable.
Funding Statement: The authors received no specific funding for this study.
Author Contributions: Study conception and design: Linwei Yao, Xiangning Lin; data collection: Huashen He, Jiahui Yang; analysis and interpretation of results: Linwei Yao, Huashen He; draft manuscript preparation: Linwei Yao. All authors reviewed the results and approved the final version of the manuscript.
Availability of Data and Materials: Not applicable.
Ethics Approval: Not applicable.
Conflicts of Interest: The authors declare no conflicts of interest to report regarding the present study.
Appendix A
References
1. Heberlein S, Chan WP, Hupa L, Zhao Y, Lisak G. Converting ash into reusable slag at lower carbon footprint: vitrification of incineration bottom ash in MSW-fueled demonstration-scale slagging gasifier. J Environ Manage. 2024;352:119967. doi:10.1016/j.jenvman.2023.119967. [Google Scholar] [PubMed] [CrossRef]
2. Saikia S, Kalamdhad AS. Response surface methodology (RSM)-based pyrolysis process parameter optimization for char generation from municipal solid waste (MSW) in a fixed bed reactor. Sustainable energy technologies and assessments. Sustainable Energy Technol Assess. 2023;60:103541. doi:10.1016/j.seta.2023.103541. [Google Scholar] [CrossRef]
3. Statistics NBO. China Statistical Yearbook. Beijing, China: National Bureau of Statistics; 2024. (In Chinese). [Google Scholar]
4. Sarabhorn P, Sitthichirachat P, Siripaiboon C, Khaobang C, Somkeattikul K, Ding L, et al. Community-scale co-incineration of pre-sorted MSW with wood pellet using a decoupling gasifier and integrated burner for syngas combustion. J Clean Prod. 2025;487:144588. doi:10.1016/j.jclepro.2024.144588. [Google Scholar] [CrossRef]
5. Dihan MR, Naha T, Kirtania K. Comparative assessment of waste-to-energy scenarios to mitigate GHG emission from MSW in a developing mega city. Energy Sustain Dev. 2024;82:101540. doi:10.1016/j.esd.2024.101540. [Google Scholar] [CrossRef]
6. Zhao FB, Bian RX, Zhang TX, Fang X, Chai XL, Xin MX, et al. Characteristics of polychlorinated dibenzodioxins/dibenzofurans from a full-scale municipal solid waste (MSW) incinerator in China by MSW classification. Process Saf Environ Prot. 2022;161:50–7. doi:10.1016/j.psep.2022.03.012. [Google Scholar] [CrossRef]
7. Zeng WQ, Wang Y, Bu QG, Ma S, Hu HR, Ma DD, et al. Influence of main operating parameters on the incineration characteristics of municipal solid waste (MSW). Process Saf Environ Prot. 2024;185:325–39. doi:10.1016/j.psep.2024.03.017. [Google Scholar] [CrossRef]
8. Wang RT, Wen XY, Wang XY, Fu YB, Zhang Y. Low carbon optimal operation of integrated energy system based on carbon capture technology, LCA carbon emissions and ladder-type carbon trading. Appl Energy. 2022;311:118664. doi:10.1016/j.apenergy.2022.118664. [Google Scholar] [CrossRef]
9. Yang C, Dong XF, Wang G, Lv DR, Gu R, Lei YQ. Low-carbon economic dispatch of integrated energy system with CCS-P2G-CHP. Energy Rep. 2024;12:42–51. doi:10.1016/j.egyr.2024.05.055. [Google Scholar] [CrossRef]
10. Chen LD, Liu KZ, Zhao K, Hu L, Liu ZJ. Optimal scheduling of electricity-hydrogen-thermal integrated energy system with P2G for source-load coordination under carbon market environment. Energy Rep. 2025;13:2269–76. doi:10.1016/j.egyr.2025.01.059. [Google Scholar] [CrossRef]
11. Li ZZ, Chen SC, Chang XY. Achieving clean energy via economic stability to qualify sustainable development goals in China. Econ Anal Policy. 2024;81:1382–94. doi:10.1016/j.eap.2023.11.003. [Google Scholar] [CrossRef]
12. Wang D, Tang YT, He J, Yang F, Robinson D. Generalized models to predict the lower heating value (LHV) of municipal solid waste (MSW). Energy. 2021;216:119279. doi:10.1016/j.energy.2020.119279. [Google Scholar] [CrossRef]
13. He T, Niu DJ, Chen G, Wu F, Chen Y. Exploring key components of municipal solid waste in prediction of moisture content in different functional areas using artificial neural network. Sustainability. 2022;14(23):15544. doi:10.3390/su142315544. [Google Scholar] [CrossRef]
14. Li JS, An DH, Shi YT, Bai RX, Du SL. A review of the physical and chemical characteristics and energy-recovery potential of municipal solid waste in China. Energies. 2024;17(2):491. doi:10.3390/en17020491. [Google Scholar] [CrossRef]
15. Wang Y, Ma HT, Zeng WQ, Bu QG, Yang XC. Influence of moisture content and inlet temperature on the incineration characteristics of municipal solid waste (MSW). Appl Therm Eng. 2025;258:124677. doi:10.1016/j.applthermaleng.2024.124677. [Google Scholar] [CrossRef]
16. Lim M, Lee Y, Lee Y, Won Y, Kim S. Improving waste-incineration energy recovery efficiency using a reverse calculation algorithm to estimate waste composition and heating value. Waste Manage. 2024;190:486–95. doi:10.1016/j.wasman.2024.10.014. [Google Scholar] [PubMed] [CrossRef]
17. Ling JL, Chen XJ. Energy and economic analysis of a new combination cascade waste heat recovery system of a waste-to-energy plant. Energies. 2024;17(20):5196. doi:10.3390/en17205196. [Google Scholar] [CrossRef]
18. Hong MZ, Wu JK, Luo WM, Sun YH, Fang ZK, Zhan YG, et al. Coordinative optimization model for carbon reduction in integrated energy systems considering cascading utilization of waste heat. Southern Power Syst Technol. 2025;19(1):129–139, 149. (In Chinese). doi:10.13648/j.cnki.issn1674-0629.2025.01.013. [Google Scholar] [CrossRef]
19. Liu J, Luo XY, Yao S, Li QG, Wang WS. Influence of flue gas recirculation on the performance of incinerator-waste heat boiler and NOx emission in a 500 t/d waste-to-energy plant. Waste Manage. 2020;105:450–6. doi:10.1016/j.wasman.2020.02.040. [Google Scholar] [PubMed] [CrossRef]
20. Zhou X, Zhou P, Zhao XQ, Song ZL, Wang WL, Sun J, et al. Applicability of municipal solid waste incineration (MSWI) system integrated with pre-drying or torrefaction for flue gas waste heat recovery. Energy. 2021;224:120157. doi:10.1016/j.energy.2021.120157. [Google Scholar] [CrossRef]
21. Jeong SG, Lee T, Lee J. Evaluation of energy performance and thermal comfort considering the heat storage capacity and thermal conductivity of biocomposite phase change materials. Processes. 2021;9(12):2191. doi:10.3390/pr9122191. [Google Scholar] [CrossRef]
22. Hong BH, Zhou ZY, Huang XY, He JW, Cai Y, Wang WW, et al. A comprehensive investigation of PCM based annular thermoelectric generator for energy recovery: energy conversion characteristics and performance evaluation. Appl Therm Eng. 2023;228:120474. doi:10.1016/j.applthermaleng.2023.120474. [Google Scholar] [CrossRef]
23. Si Y, Chen LJ, Ma LR, Gao MY, Ma HR, Mei SW. Modeling the heat-hydrogen balance characteristic of hydrogen energy storage and cooperative dispatch of wind-hydrogen hybrid system. Front Energy Res. 2021;9:791829. doi:10.3389/fenrg.2021.791829. [Google Scholar] [CrossRef]
24. Wang C, Chen S, Zhao JT, Zhou YZ, Wei ZN, Zheng S. Coordinated scheduling of integrated electricity, heat, and hydrogen systems considering energy storage in heat and hydrogen pipelines. J Energy Storage. 2024;85:111034. doi:10.1016/j.est.2024.111034. [Google Scholar] [CrossRef]
25. Han PF, Xu XY, Yan Z, Tan ZF. Dual-layer model predictive control-based scheduling of integrated electricity-hydrogen-heat microgrid. IET Renew Power Gener. 2024;18:4638–49. doi:10.1049/rpg2.13172. [Google Scholar] [CrossRef]
26. Li WD, Rahim M, Wu DX, El Ganaoui M, Bennacer R. Experimental study of dynamic PCM integration in building walls for enhanced thermal performance in summer conditions. Renew Energy. 2024;237:121891. doi:10.1016/j.renene.2024.121891. [Google Scholar] [CrossRef]
27. Suo YH, Tang CB, Jia QN, Zhao WR. Influence of PCM configuration and optimization of PCM proportion on the thermal management of a prismatic battery with a combined PCM and air cooling structure. J Energy Storage. 2024;80:110340. doi:10.1016/j.est.2023.110340. [Google Scholar] [CrossRef]
28. Singh AP, Tiwari S, Sinhmar H, Sahdev RK, Tripathi S. Enhancing solar drying performance with heat storage technologies and nanoparticles integration: a clean energy production. J Energy Storage. 2025;105:114669. doi:10.1016/j.est.2024.114669. [Google Scholar] [CrossRef]
29. Manikandan S, Devarajan Y, Vickram S. Advancing thermal energy storage with industrial and agricultural waste-derived phase change materials: a path towards sustainable energy systems. Process Saf Environ Prot. 2025;198:107068. doi:10.1016/j.psep.2025.107068. [Google Scholar] [CrossRef]
30. Zhang WT, Zhou JH, Zhang RZ, Wang LJ, Xu G. Optimization strategy of wind and solar hydrogen production alkaline electrolyzer cluster considering energy consumption characteristics. Chem Ind Eng Progress. 2024;43(11):6119–28. (In Chinese). doi:10.16085/j.issn.1000-6613.2023-1859. [Google Scholar] [CrossRef]
31. Gao CQ, Bian RX, Li P, Yin CY, Teng X, Zhang JR, et al. Analysis of carbon reduction potential from typical municipal solid waste incineration plants under MSW classification. J Environ Manage. 2025;373:123844. doi:10.1016/j.jenvman.2024.123844. [Google Scholar] [PubMed] [CrossRef]
32. Zhou RJ, Chen Y, Yang WW, Wang YZ, Xu J, Zhu JS. Two-stage optimal dispatching of wind power-waste incineration virtual power plant with flue gas storage device. Electric Power. 2019;52(02):78–84. (In Chinese). doi:10.11930/j.issn.1004-9649.201806147. [Google Scholar] [CrossRef]
33. Sui Q, Wei FR, Wu CT, Lin XN, Wang ZX, Feng ZN, et al. Bi-level optimal dispatching of electric-thermal combined supply system in building-integrated-photovoltaic community based on phase change material energy storage. Proc CSEE. 2020;40(13):4150–62. (In Chinese). doi:10.13334/j.0258-8013.pcsee.190133. [Google Scholar] [CrossRef]
34. Gao ZH, Zhang SR, Cheng L, Wang YF, Hong FB, Hu XY. Optimization and evaluation method of integrated energy system for near-zero carbon park. Distrib Energy. 2025;10(2):25–35. (In Chinese). doi:10.16513/j.2096-2185.DE.(2025)010-02-0025-11. [Google Scholar] [CrossRef]
35. Kuang TF, Chen J, Liu J, Zhang YC, Bao HY. Optimization of user-side electrolytic hydrogen production system considering electrolyzer efficiency degradation. Int J Hydrogen Energy. 2024;88:545–56. doi:10.1016/j.ijhydene.2024.09.162. [Google Scholar] [CrossRef]
Cite This Article
 Copyright © 2025 The Author(s). Published by Tech Science Press.
This work is licensed under a Creative Commons Attribution 4.0 International License , which permits unrestricted use, distribution, and reproduction in any medium, provided the original work is properly cited.
 Downloads
 Citation Tools