
 Submit a Paper
 Propose a Special lssue
 Open Access
ARTICLE
Optimal Allocation of Multiple Energy Storage Capacity in Industrial Park Considering Demand Response and Laddered Carbon Trading
1 Institute of Electricity and Energy Efficiency, China Electric Power Research Institute, Beijing, 100192, China
2 National Key Laboratory of Power Grid Safety, China Electric Power Research Institute, Beijing, 100192, China
* Corresponding Author: Hongyin Chen. Email:
Energy Engineering 2026, 123(1), 6 https://doi.org/10.32604/ee.2025.070256
Received 11 July 2025; Accepted 14 August 2025; Issue published 27 December 2025
 View Full Text
 Download PDF
Abstract
To achieve the goals of sustainable development of the energy system and the construction of a low-carbon society, this study proposes a multi-energy storage collaborative optimization strategy for industrial park that integrates the laddered carbon trading mechanism with demand response. Firstly, a dual dimensional DR model is constructed based on the characteristics of load elasticity. The alternative DR enables flexible substitution of energy loads through complementary conversion of electricity/heat/cold multi-energy sources, while the price DR relies on time-of-use electricity price signals to guide load spatiotemporal migration; Secondly, the LCT mechanism is introduced to achieve optimal carbon emission costs through a tiered carbon quota allocation mechanism. On this basis, an optimization decision model is established with the core objective of maximizing the annual net profit of the park. The objective function takes into account energy sales revenue, generator unit costs, and investment and operation costs of multiple types of energy storage facilities. The model constraint system covers three key dimensions: dynamic operation constraints of power generation units, including unit output limits, ramping capability, and minimum start-stop time; the physical boundary of an electric/hot/cold multi-energy storage system involves energy storage capacity and charge/discharge efficiency; The multi-energy network coupling balance equation ensures that the energy conversion and transmission process satisfies the law of conservation of energy. Using CPLEX mathematical programming solver for simulation verification, construct an energy storage capacity configuration decision process that includes LCT-DR synergistic effect. The research results show that compared with the traditional single energy storage configuration mode, this strategy effectively enhances the economic feasibility and engineering practicality of industrial park operation by coordinating demand side resource scheduling and finely controlling carbon costs, while maintaining stable system operation. Its methodological framework provides a technical path that combines theoretical rigor and practical operability for the low-carbon transformation of regional integrated energy systems.Keywords
Due to the rapid development of economy, the utilization of fossil energy has resulted in many serious problems [1]. Data up to 2019 indicate that China’s power sector has become a critical contributor to greenhouse gas emissions, with its carbon dioxide emissions exceeding the 40% threshold of the nation’s total carbon footprint. To fulfill global climate governance responsibilities, the Chinese government formally integrated the “Dual Carbon” goals into its national development agenda in autumn 2020, committing to establish a comprehensive carbon-neutral pathway by 2060. Against this backdrop, advancing the low-carbon transition of power systems has emerged as an imperative. Current policy frameworks primarily employ economic instruments such as carbon emission trading mechanisms and environmental taxation for regulation, while emerging integrated energy supply paradigms offer innovative pathways for carbon reduction [2]. These systems synergistically integrate energy production, transmission, conversion, storage, and end-use utilization to form multi-energy collaborative supply networks [3]. Particularly under escalating environmental governance pressures, the construction of such multi-energy complementary systems has been validated as an effective solution for achieving carbon reduction targets [4], with ongoing academic focus on the coordinated optimization of electricity, heat energy and natural gas.
To address the issue of limited system flexibility caused by weak interactions between the user side and the energy supply network in current IPs, this study proposes improving the efficiency of supply-demand interaction through DR. Additionally, to reduce system carbon emissions, this paper introduces a CT mechanism to balance the environmental and economic aspects of IP, thereby enhancing the operational economy of the park and alleviating environmental burdens and energy supply pressures while enhancing the operational economy of IP [5,6]. Luo et al. innovatively proposed market elasticity-based DR and studied its impact on the optimal operation of IP [7]. Jiang et al. introduced price-based DR, altering users’ electricity consumption patterns, and quantitatively analyzed the contribution of DR strategies to reducing system carbon emissions [8]. Shao et al. improved the accuracy of demand-side response by enhancing the price elasticity matrix algorithm, laying a theoretical foundation for price-based DR research [9]. The aforementioned studies are typically limited to price-based DR analysis in power systems and fail to fully consider the dynamic impact of alternative DR on the flexibility and reliability of the electricity-heat-cooling multi-energy coupling systems. Although the stepwise carbon cost model proposed by Zhang et al. effectively constrained supply-side carbon emissions but overlooked the measurement of carbon footprints on the demand side [10]. Zhang et al. introduced a carbon emission accounting coefficient, but the theoretical derivation process was lacking [11]. Xiao et al. analyzed the source-load synergistic carbon reduction mechanism but provided insufficient description of the dynamic coupling relationships of load carbon emissions [12]. In the studies mentioned above, while the CT mechanism accounts for the carbon emissions from the energy supply sources, the calculation methods for load-side carbon emissions are overly simplified and require further optimization and refinement.
In recent years, the cascading energy utilization of CCHP systems has significantly improved energy efficiency and has been widely applied in IP [13]. Li et al. innovatively developed a CT embedded model, based on the coupling mechanism of electricity-heat multi-energy flows, which for the first time quantitatively mapped the flexible regulation potential of energy storage to carbon emission reduction benefits [14]. Zhang et al. and Cheng et al. introduced various energy storage methods to convert renewable energy into gas and heat energy for storage, thus reducing the phenomena of wind and solar curtailment [15,16]. Harsh and Das proposed a LE operation optimization method that considers electricity-gas-heat price DR [17]. Cui et al. considered the low-carbon aspects of the system, incorporating a gradual CT mechanism into the LE dispatch model of electric-heat IP [18]. The aforementioned studies addressed the LE dispatch issues in CCHP systems, but further research is needed for LE dispatch in electricity-heat-cooling IP under the consideration of various energy storage methods.
Based on the existing research, this paper develops an optimization scheduling model for IP considering CT and DR. First, based on the load response characteristics, a price DR and an alternative DR model are established. Next, on the basis of achieving LE dispatch for the system, the gradual CT mechanism is integrated into the IP model. Then, considering the various constraints of power generation units and energy storage systems, an optimization model for the electricity-heat-cooling energy storage capacity configuration is established, aiming to maximize the IP’s annual average net income, incorporating DR and gradual CT. Finally, a simulation analysis of the model is performed using CPLEX software to verify the effectiveness of the proposed multi-energy storage optimization configuration strategy in the system, thereby providing decision-making support for the LE operation of IP. The results indicate that the strategy proposed in this study presents notable benefits in terms of both economic feasibility and practical applicability when compared to conventional electricity-heat-cooling energy storage configurations.
IP integrates four energy forms-electricity, gas, heat, and cooling—achieving efficient, stable, and sustainable energy utilization through the incorporation of wind power and photovoltaic generation, combined with synergistic coordination among diverse generation units and energy storage systems. The architectural framework of this electricity-gas-heat-cooling integrated IP is presented in Fig. 1.
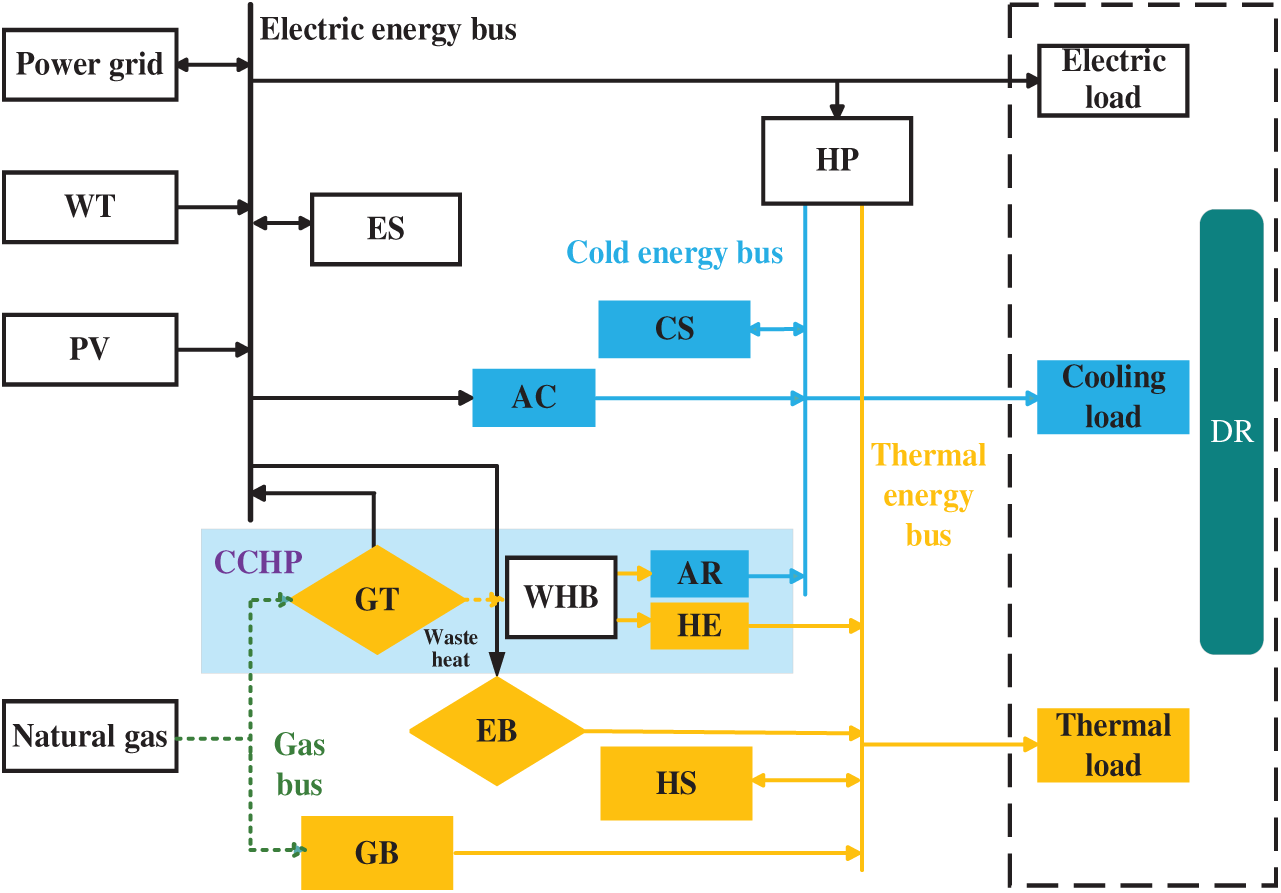
Figure 1: IP architecture
2.1 Gas Boiler Mathematical Model
GB supplements the heat deficit in WHB by burning natural gas. The connection between the output power and the gas transmission power is represented by Eq. (1).
where HGBmax denotes the maximum power of the GB.
2.2 Gas Turbine Mathematical Model
The connection between the natural gas power consumption GGT,t and PGT,t of the GT is expressed as:
Given that the aforementioned model constitutes a nonlinear programming problem, which cannot be directly addressed by the CPLEX optimization solver, piecewise linearization is required [19]. The slopes of the four linear segments post-discretization are detailed in Eq. (3).
where h1, h2, h3, h4 and h5 denote the linearized GT power parameters; h5 and h1 denote the maximum and minimum electric power output of the GT, respectively.
After linearization of Eqs. (2)–(4) can be obtained.
where GGTmin denotes the minimum natural gas power consumption of GT; UGT,t denotes the operating status of the GT during t, where 1 indicates the unit is on, and 0 indicates it is off.
During the operation of the GT, the high-temperature flue gas is used to provide heat energy to the users through the WHB. The heat characteristics are represented by Eqs. (5) and (6).
During the operation of GT, the constraints of power generation and climbing constraints are shown in Eqs. (7) and (8).
2.3 Electric Boiler Mathematical Model
The working principle of EB is to heat water or other fluids by converting electric energy into heat energy. The connection between the heat power output QEB,t and the electric power input PEB,t in t is
where ηEB denotes the ratio of electric to heat efficiency.
2.4 Air Conditioner Mathematical Model
AC is a refrigeration device driven by electric energy. The connection between the cooling capacity QAC,t and the power output EAC,t in t is
where
2.5 Absorption Refrigerator Mathematical Model
To analyze the key factors influencing voltage stability control, a dual-machine single-load system model, as shown in Fig. 1 [17], is established. The power side of the system includes a synchronous generator and a wind-PV unit based on an inverter, both of which supply power to a common load. There are impedances between the synchronous generator and the wind-PV unit, as well as between the wind-PV unit and the load.
AR uses liquid refrigerant to realize refrigeration. The connection between the cooling capacity output QAR,t and the heat power output HAR,t in t is
where
2.6 Heat Exchanger Mathematical Model
The heat exchanger is a device that transfers part of the heat of the hot fluid to the cooling fluid to achieve temperature regulation or heat energy recovery. Its heat output QHE,t, heat power output HHE,t, the connection between t is
where ηHE denotes the energy efficiency ratio of HE.
2.7 Energy Storage Mathematical Model
ES must satisfy state-of-charge constraints, charging/discharging power constraints, mutual exclusion constraints, and ramp rate constraints [20], namely
where UES.chr,t and UES.dis,t are the charge-discharge state of ES at t, which are 0–1 variables.
2.8 Heat Energy Storage Mathematical Model
HS plays the role of heat energy storage, which is similar to the operation mode of ES, and needs to meet the capacity constraints and heat charging/discharging power constraints as shown in Eqs. (16)–(18).
2.9 Cooling Energy Storage Mathematical Model
CS can accumulate cooling energy when there is an excess, and release it when cooling energy is insufficient or when refrigeration costs are high. The constraint conditions for CS are defined in Eqs. (19)–(21).
where UCS.chr,t and UCS.dis,t are the cooling storage and release state of CS in t.
2.10 Distribution Network Mathematical Model
IP can stabilize the system’s power load by buying and selling electricity from the distribution network. To ensure its safe operation, the following conditions must be satisfied.
where Ubgrid,t and Usgrid,t are the state of electricity purchase and sale of IP during the period t, and the values are 0 or 1; Pbgrid,t and Psgrid,t are the power of purchasing and selling electricity, respectively.
IP carbon emission quota comes from GB, GT, and power purchase from the superior power grid. This study assumes that carbon emission sources do not require additional payment for carbon emission quota fees [21].
where EIP denotes the carbon emission quota of IP, while γe and γg are the carbon emission coefficients for coal-fired and gas-fired units, respectively.
3.2 Actual Carbon Emission Model
The actual model of carbon emissions is shown in Eq. (25).
where EIP,f, Ebuy,f represent the actual carbon emissions of IP and electricity purchases, respectively. Eto,f denotes the actual carbon emissions of the system, while
3.3 Ladder Carbon Emissions Trading Model
The ladder carbon emissions trading model is shown in Eq. (26).
where EIP,t is the IP mechanism quota.
The LCT mechanism divides CO2 emissions into multiple intervals, where a larger interval corresponds to a higher CT price, resulting in an increase in the cost of the system [22]. The expression of carbon transaction cost is shown in Eq. (27).
where CC represents the stepped carbon transaction cost; β is the initial carbon price; c is the range of the carbon emission interval; α is the growth rate of price.
The load includes power load, heat load and cooling load, and the heat and cooling energy exhibit system inertia and temperature lag [23]. At the same time, cooling load and heat load can also participate in DR to achieve the optimal allocation of energy.
According to the electricity price, the load can be divided into shiftable load (SL) and curtailable load (CL).
SL refers to the load that can be adjusted by power consumers according to electricity price fluctuations, adapting to load demand by changing working hours.
where
CL refers to the load that the power consumption object determines whether to cut according to the electricity price.
where et,j represents the elasticity coefficient of the load at t with respect to the price at j; ECL(t,j) is the price demand elasticity coefficient of CL.
Replaceable load refers to the load that can be replaced by different types of energy [24]. In IP systems, electricity is preferred when prices are low, whereas heat or cooling energy is used when electricity prices are high, thereby optimizing energy use and improving economic efficiency.
where
The range of maximum replaceable load is
where
The electric, heat and cooling loads optimized by DR are shown in Eqs. (36)–(38).
where
5 Optimal Configuration Model of IP Multi-Energy Storage Considering CT and DR
Considering the optimal operation model of DR in the cooling, heat and electric IP, the optimal co-production plan of supply and demand is formulated by introducing a variety of energy storage, energy conversion devices and multi-energy complementary characteristics. The optimization model uses a mixed integer linear programming method to maximize the annual net income to achieve optimal scheduling and benefit maximization of the system.
where R is the average annual net income; Rsale is the profit of IP sales; Cin is the construction cost of multi-energy storage investment; Cop represents the operation and maintenance cost of IP; Cgrid represents the expense of buying electricity from the external power grid; CGB is the power generation operation cost of GB; Cc denotes the cost associated with carbon trading; T is the whole life cycle, which is 20 years.
where Rsale,e is the profit of selling electricity for IP; Rsale,h is the profit of IP selling heat; Rsale,c is the profit of IP cooling selling.
where Cin_e is the investment and construction cost of ES; Cin_h is the investment and construction cost of HS; Cin_c is the investment and construction cost of CS.
where Cop_IP is the operation and maintenance cost of IP.
In addition to the constraints of IP equipment operation, the electric-gas-heat-cooling IP model also needs to meet the balance constraints, which are
To evaluate the effectiveness of the LCT mechanism and DR in the optimal allocation of electric, heat and cooling energy storage capacity within IP, this study focuses on an IP located in the northern region. The analysis is based on a 24-h operational cycle, with each unit operation lasting 1 h.
In this IP system, time-sharing electric, heat, cooling prices as shown in Fig. 2.
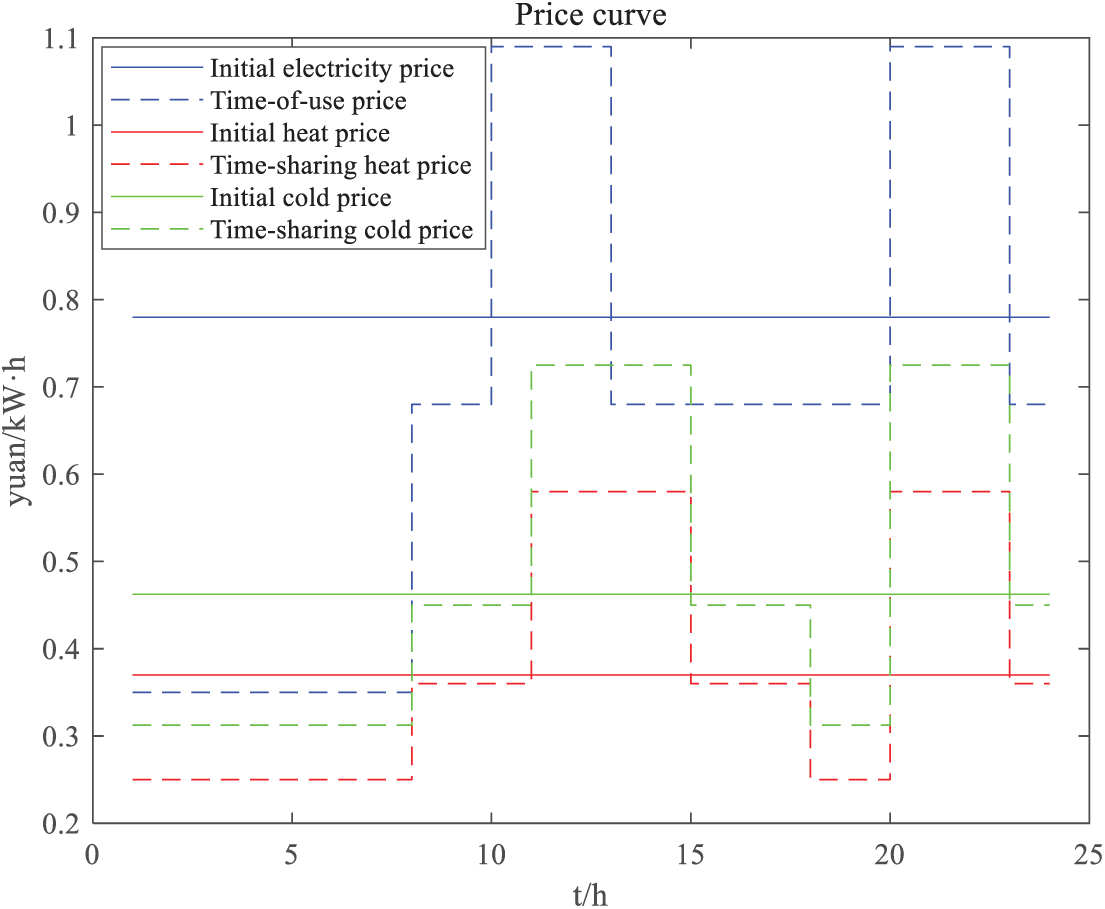
Figure 2: Time-sharing electricity, heat and cooling prices
The typical daily electricity, heat and cooling forecast load is shown in Fig. 3.
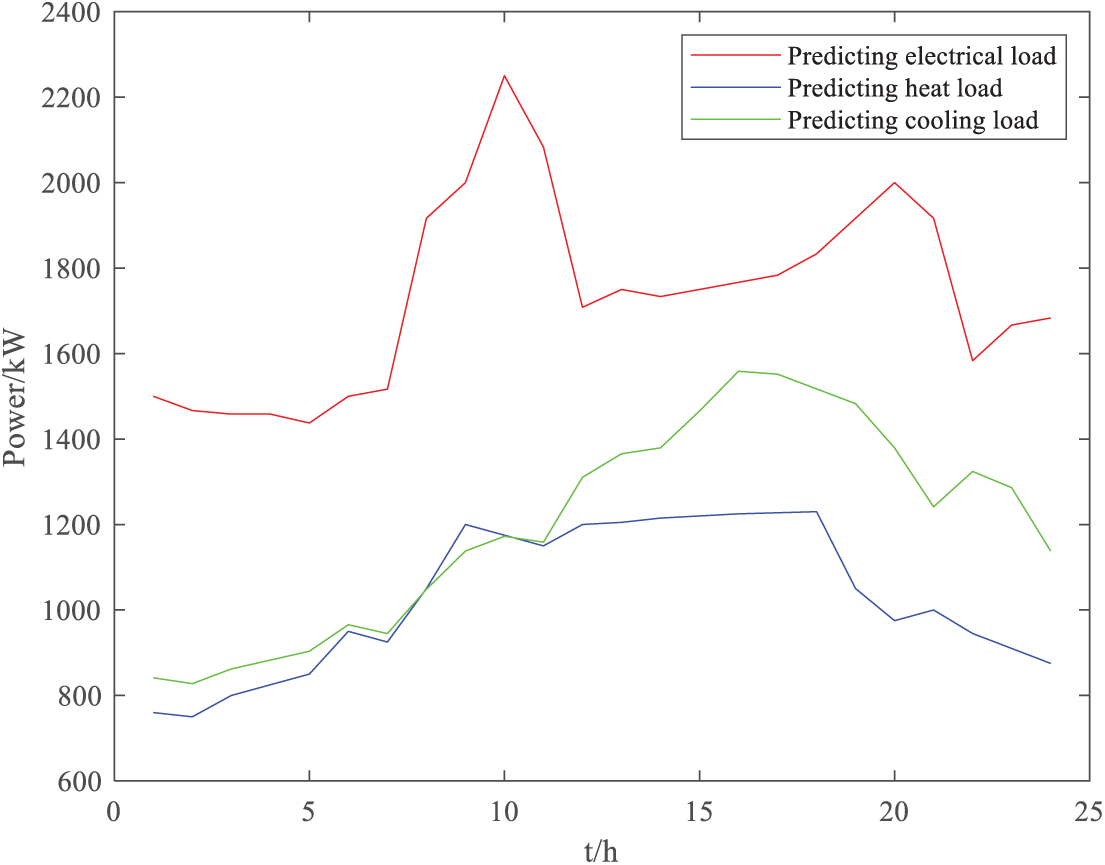
Figure 3: Forecasting power
Fig. 4 illustrates the forecasted output of WT and PV.

Figure 4: Forecasting load
The system solution process is shown in Fig. 5.

Figure 5: Solution process
In order to verify the rationality of the optimal configuration model of electric heat and cooling storage in IP considering stepped CT and DR, the following three scenarios are compared and analyzed.
Scenario 1: Optimal configuration of electricity-heat-cooling energy storage capacity in IP considering traditional CT and DR.
Scenario 2: Only the optimal configuration of electricity-heat-cooling energy storage capacity in the LCT IP is considered, and DR is not considered.
Scenario 3: Optimal configuration of electricity-heat-cooling energy storage capacity in IP considering LCT and DR.
The optimized electricity, heat and cooling loads are shown in Fig. 6a–c. The CL strategy optimizes the operation by reducing the demand for electricity during the peak electricity price period; the SL strategy redistributes the electricity load originally in the high price range to the low price range; the RL strategy realizes the cross-energy conversion scheduling of different forms of energy in the peak-valley electricity price period through the coordinated scheduling of multi-energy flow of electric, heat and cooling.
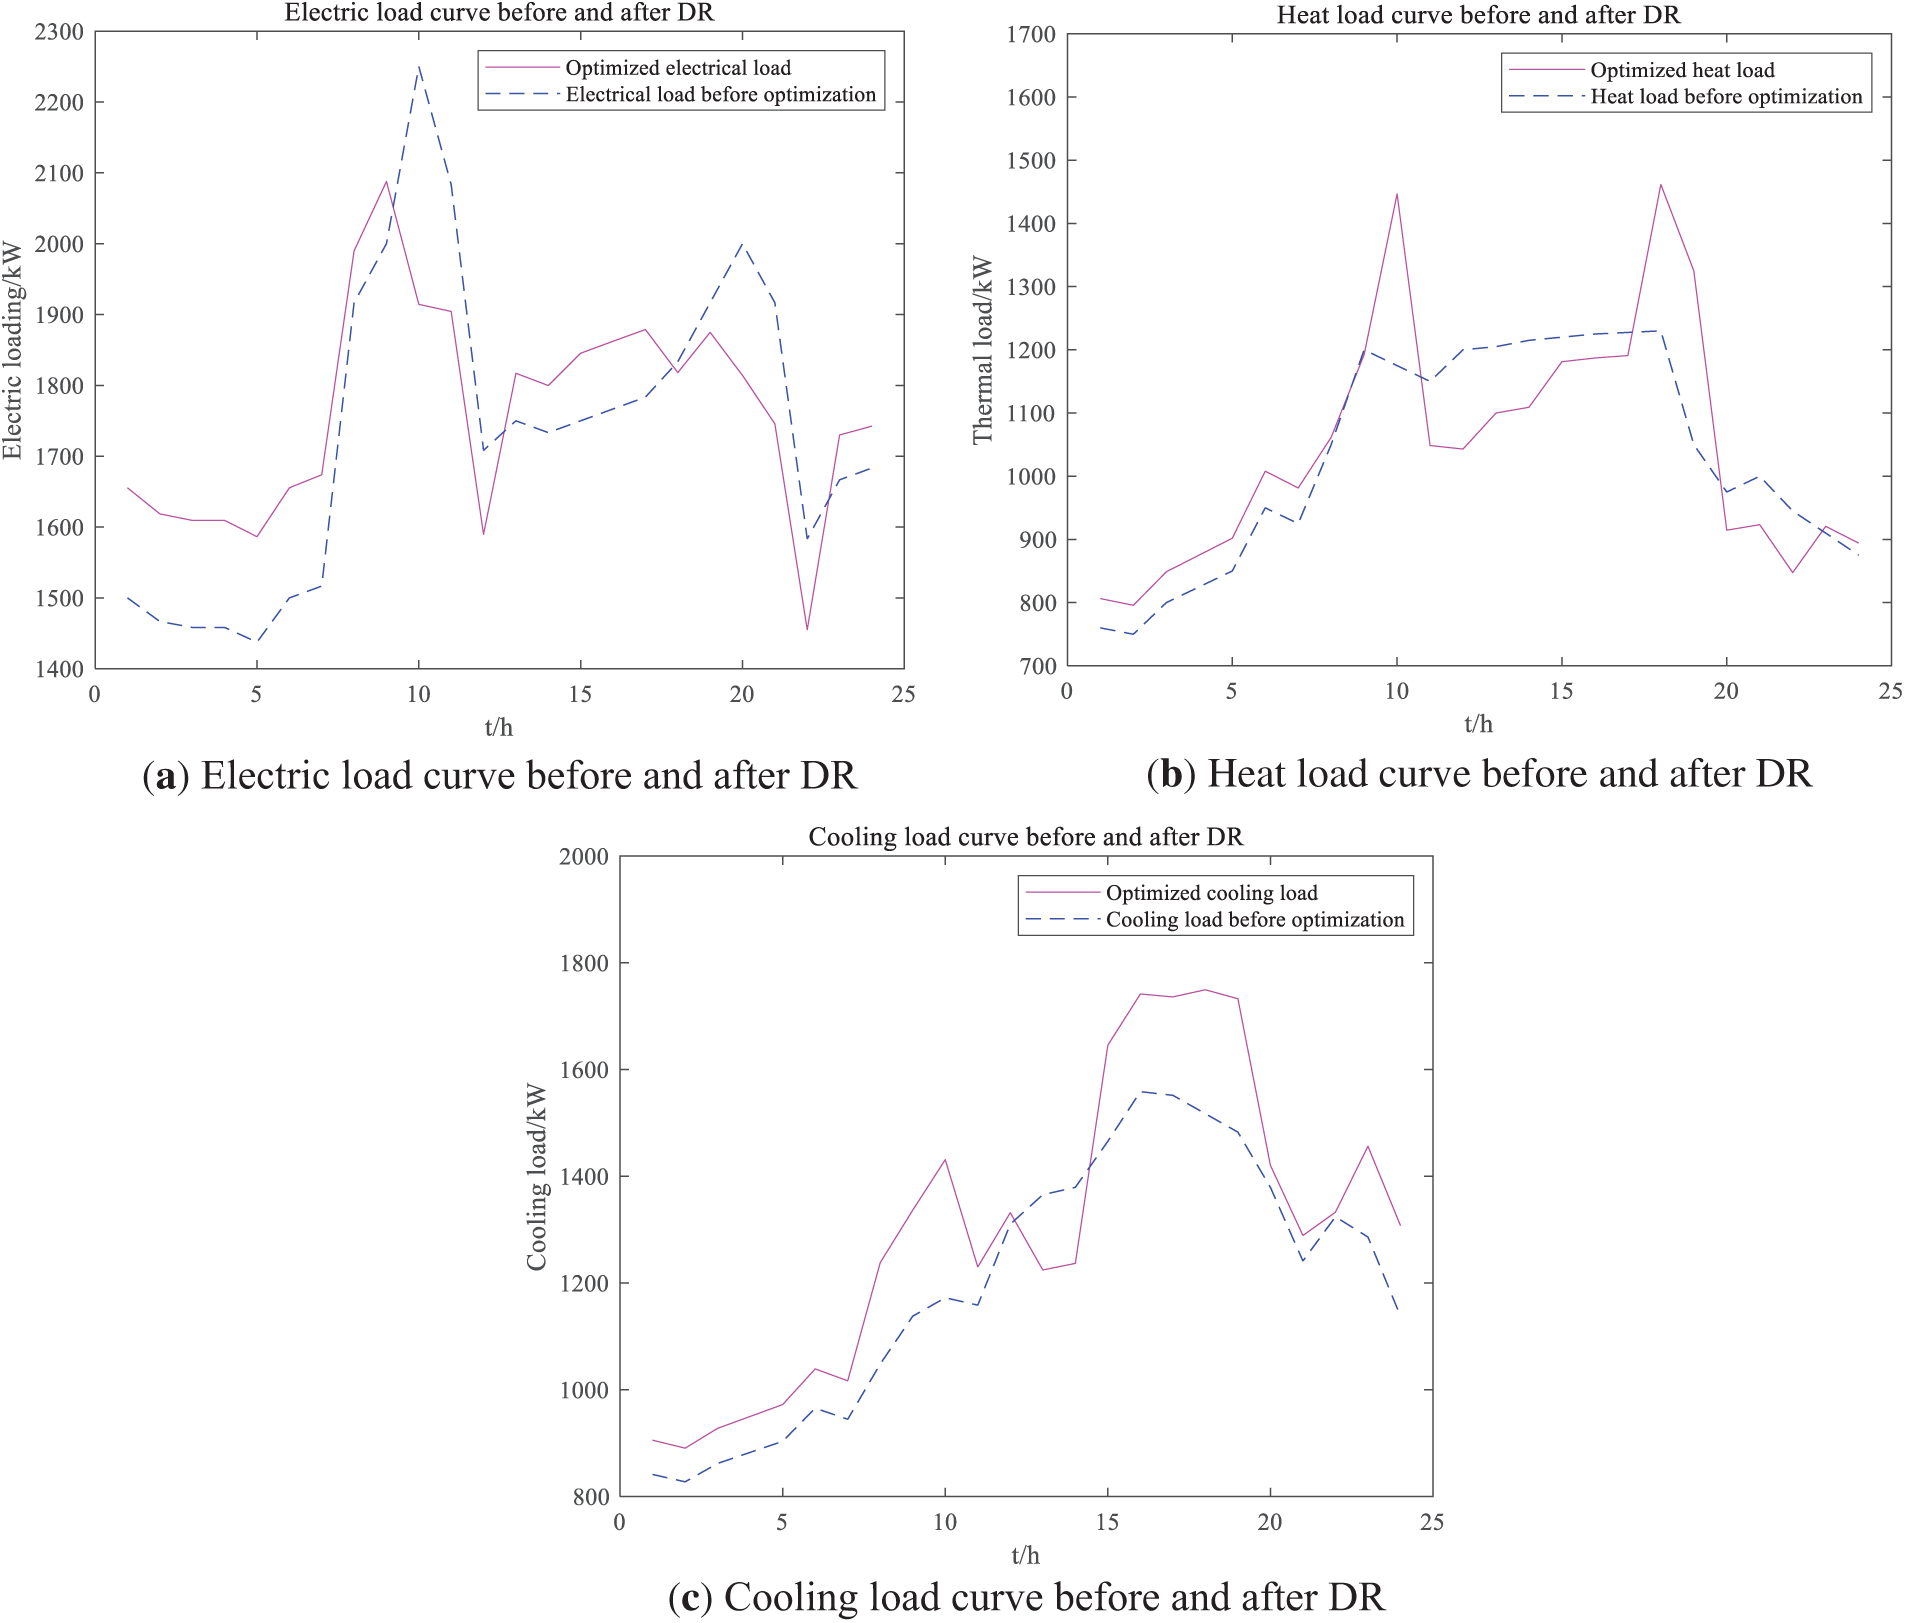
Figure 6: Load before and after DR
The electric, heat and cooling power balance results of scenario 3 are shown in Fig. 7a–c. It is evident that the electric load is managed through a combination of purchasing power from the superior grid and stable power generation from the GT, along with intermittent contributions from the WT and PV. Additionally, the ES system regulates the charge and discharge process to accommodate fluctuations in the electric load. The heat load is mainly provided by heat sources like HE, GB, and EB, with the HS heat storage system used for peak shaving and valley filling, effectively managing fluctuations in heat demand. Cooling is primarily supplied by AC and AR units, with CS and other equipment offering additional support. Adjustments are made through the CS absorption and desorption cooling processes to manage peak cooling loads. The coordinated operation of the multi-energy system ensures a dynamic balance between electrical, heating, and cooling loads, highlighting the efficiency and stability of the multi-energy complementary approach in handling load variations.

Figure 7: power balance results in Scenario 3
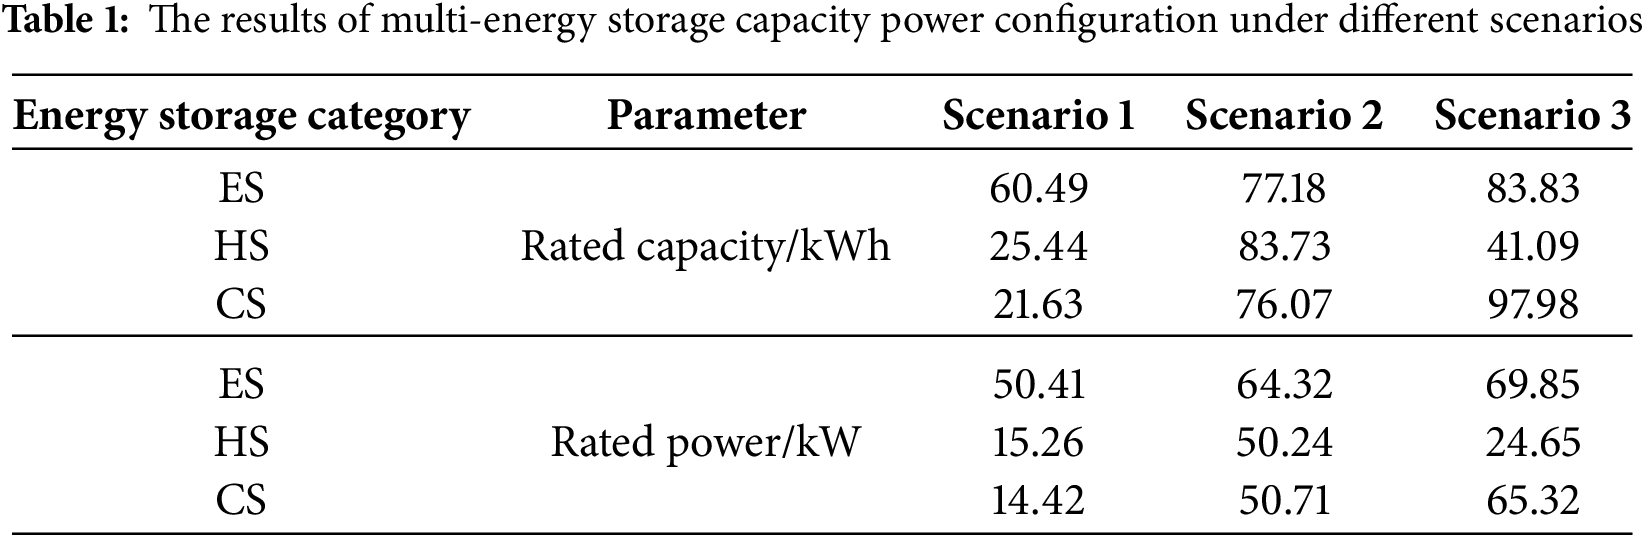
The results of multiple energy storage capacity power configurations in different scenarios are shown in Table 1. From the energy storage configuration results of the three scenarios, the rated capacity and power of ES, HS and CS in scenario 1 are all at a low level, indicating that the DR strategy reduces the dependence on the energy storage scale by flexibly scheduling the load. In scenario 2, the energy storage parameters are significantly improved, the ES capacity increases to 77.18 kWh, and the HS power reaches 50.24 kWh, indicating that the CT pressure drives a larger energy storage capacity to reduce fossil energy consumption and carbon emissions; scenario 3 is further optimized. The ES capacity reaches 83.83 kWh, the CS capacity rises to 97.98 kWh, and the power grows synchronously. It reflects that the energy storage system needs to take into account the flexibility of load regulation and low-carbon constraints under the coordination of the two, by expanding the capacity to cover the peak demand and reducing the carbon cost. The capacity of HS in scenario 3 is 41.09 kWh, and the power is 24.65 kW, which is lower than that in scenario 2. It may be because DR reduces the fluctuation of heat load and reduces the dependence on heat storage. The whole shows that multi-objective coordination needs to balance the economy, flexibility and low-carbon of energy storage, and scenario 3 achieves higher system efficiency through comprehensive optimization.
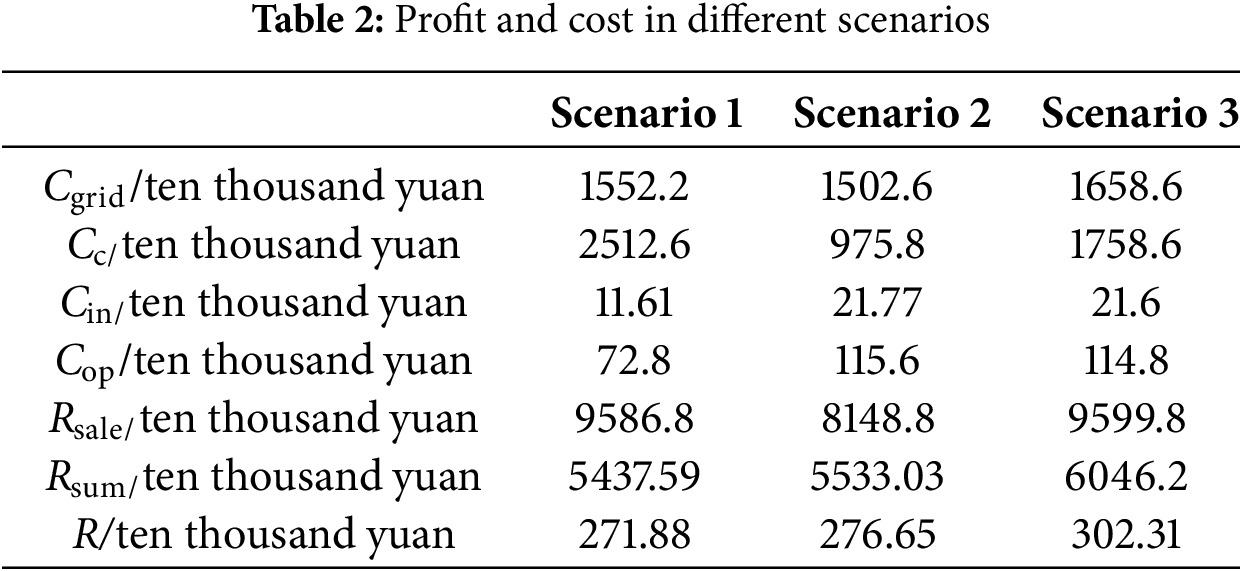
The profits and costs under different scenarios are shown in Table 2. From the economic comparison of the three scenarios, when only the DR strategy is considered in scenario 1, the cost of purchasing electricity from the superior reaches 15,522,000 yuan, and the carbon transaction cost is as high as 25,126,000 yuan, which is 3.3% and 157.5% higher than scenario 2, respectively. In scenario 2, the carbon transaction cost is greatly reduced to 9.758 million yuan through the ladder CT mechanism, a decrease of 61.2%, but the investment cost of energy storage rises to 217,700 yuan, an increase of 87.5% compared with scenario 1, and the electricity sales revenue is reduced by 15.0% due to insufficient flexibility. After the combination of DR and ladder CT in scenario 3, although the cost of purchasing electricity further increased to 16.586 million yuan, the cost of CT was controlled at 17.586 million yuan, which was 30.0% lower than that in scenario 1, and the electricity sales revenue was achieved by optimizing the energy storage configuration. 95,998 million yuan, reaching the highest of the three, an increase of 17.8% compared with scenario 2. From the perspective of long-term benefits, the total net income of scenario 3 in 20 years is 60.462 million yuan, with an average annual net income of 3.0231 million yuan, which is 11.2% and 9.3% higher than that of scenario 1 and scenario 2, respectively, which verifies the comprehensive advantages of multi-objective collaboration. Although the operation and maintenance cost of scenario 3 is 1.148 million yuan, which is 57.7% higher than that of scenario 1, it offsets the cost pressure by flexibly dispatching energy storage and energy sales, and finally achieves the balance of carbon cost, economy and system flexibility.
This paper presents an energy storage optimization strategy for IP that integrates LCT and DR. The strategy addresses various constraints associated with power generation units and energy storage systems, aiming to maximize the annual net profit. The proposed model optimizes the configuration of energy storage for electricity, heat and cooling within the IP, while factoring in the effects of DR and LCT. The findings derived from simulations of specific case studies are summarized as follows:
(i) DR directs users to shift loads and actively reduce peak loads through electricity price signals, while also promoting the flexible conversion of electricity, heat and cooling energy on the user side. This facilitates the dual optimization of the system’s economic costs and low-carbon objectives.
(ii) By establishing initial carbon emission quotas and implementing market-driven emission reduction incentives through stepped carbon pricing, LCT mechanism enhances carbon emission reduction efforts. It supports the low-carbon transformation process via quota constraints and dynamic marginal cost adjustments, simultaneously optimizing system operating costs.
(iii) In comparison to traditional electricity-heat-cooling combined supply systems, this approach increases the average annual net income of the IP while achieving a lightweight, low-carbon, and high-efficiency energy system through combined electricity, heat, and cooling supply.
Acknowledgement: Not applicable.
Funding Statement: This research was funded by Science and Technology Projects from State Grid Corporation of China, (Research on Adaptive Balance Optimization and Simulation Technology of Industrial community Energy System with High Proportion of Distributed Energy, No.: 5100-202355752A-3-4-SY).
Author Contributions: Research Concept and Design: Jingshuai Pang, Songcen Wang, Hongyin Chen; Data Collection: Xiaoqiang Jia, Yi Guo; Analysis and Interpretation of Results: Ling Cheng, Xinhe Zhang, Jianfeng Li; Manuscript Preparation Draft: Jingshuai Pang, Hongyin Chen. All authors reviewed the results and approved the final version of the manuscript.
Availability of Data and Materials: The authors confirm that the data supporting the findings of this study are available within the article.
Ethics Approval: Not applicable.
Conflicts of Interest: The authors declare no conflicts of interest to report regarding the present study.
Nomenclature
| IP | Industrial park |
| LCT | Laddered carbon trading |
| DR | Demand response |
| CT | Carbon trading |
| CCHP | Combined cooling, heating and power |
| LE | Low-carbon economic |
| WT | Wind turbine |
| GB | Gas boiler |
| WHB | Waste heat boiler |
| GT | Gas turbine |
| EB | Electric boiler |
| AC | Air conditioner |
| AR | Absorption refrigerator |
| HE | Heat exchanger |
| ES | Energy storage |
| HS | Heat energy storage |
| CS | Cooling energy storage |
References
1. Ozturk M, Dincer I. A comprehensive review on power-to-gas with hydrogen options for cleaner applications. Int J Hydrogen Energy. 2021;46(62):31511–22. doi:10.1016/j.ijhydene.2021.07.066. [Google Scholar] [CrossRef]
2. Mallapaty S. How China could be carbon neutral by mid-century. Nature. 2020;586(7830):482–3. doi:10.1038/d41586-020-02927-9. [Google Scholar] [PubMed] [CrossRef]
3. Zhang Y, Sun P, Ji X, Yang M, Ye P. Low-carbon economic dispatch of integrated energy systems considering full-process carbon emission tracking and low carbon demand response. IEEE Trans Netw Sci Eng. 2024;11(6):5417–31. doi:10.1109/TNSE.2024.3420771. [Google Scholar] [CrossRef]
4. Jia Y, Lyu X, Xie P, Xu Z, Chen M. A novel retrospect-inspired regime for microgrid real-time energy scheduling with heterogeneous sources. IEEE Trans Smart Grid. 2020;11(6):4614–25. doi:10.1109/TSG.2020.2999383. [Google Scholar] [CrossRef]
5. Bui VH, Hussain A, Im YH, Kim HM. An internal trading strategy for optimal energy management of combined cooling, heat and power in building microgrids. Appl Energy. 2019;239(12):536–48. doi:10.1016/j.apenergy.2019.01.160. [Google Scholar] [CrossRef]
6. Xu Z, Han G, Liu L, Martínez-García M, Wang Z. Multi-energy scheduling of an industrial integrated energy system by reinforcement learning-based differential evolution. IEEE Trans Green Commun Netw. 2021;5(3):1077–90. doi:10.1109/TGCN.2021.3061789. [Google Scholar] [CrossRef]
7. Luo Y, Hao H, Yang D, Yin Z, Zhou B. Optimal operation strategy of combined heat and power system considering demand response and household thermal inertia. IEEE Trans Consum Electron. 2023;69(3):366–76. doi:10.1109/TCE.2023.3250276. [Google Scholar] [CrossRef]
8. Jiang AH, Qian CF, Huang YY, Cai XM, Xu JN. The day-ahead economic dispatch of the energy hub for wind power accommodation considering hydrogen storage and price-based demand response. Distrib Util. 2022;39(3):82–91. (In Chinese). doi:10.19421/j.cnki.1006-6357.2022.03.012. [Google Scholar] [CrossRef]
9. Shao C, Ding Y, Wang J, Song Y. Modeling and integration of flexible demand in heat and electricity integrated energy system. IEEE Trans Sustain Energy. 2017;9(1):361–70. doi:10.1109/TSTE.2017.2731786. [Google Scholar] [CrossRef]
10. Zhang G, Liang J, Li F, Xie C, Han L, Zhang Y. Low-carbon scheduling model of electricity-gas-heat integrated energy system considering ladder-type carbon trading mechanism, vehicles charging, and multimode utilization of hydrogen. IEEE Access. 2024;12:132926–38. doi:10.1109/access.2024.3442778. [Google Scholar] [CrossRef]
11. Zhang X, Liu X, Zhong J, Gao W. Electricity-gas-integrated energy planning based on reward and penalty ladder-type carbon trading cost. IET Gener Trans Dist. 2019;13(23):5263–70. doi:10.1049/iet-gtd.2019.0666. [Google Scholar] [CrossRef]
12. Xiao Y, Qian B, Ou J, Lin W, Hu H, Lin X, et al. Optimized scheduling of integrated energy systems considering electric vehicles and carbon emission trading. IEEE Access. 2025;13:74147–62. doi:10.1109/access.2025.3563994. [Google Scholar] [CrossRef]
13. Chen X, McElroy MB, Kang C. Integrated energy systems for higher wind penetration in China: formulation, implementation, and impacts. IEEE Trans Power Syst. 2018;33(2):1309–19. doi:10.1109/TPWRS.2017.2736943. [Google Scholar] [CrossRef]
14. Li Q, He M, Tang X, Lee WJ, Zhang Z. Capacity configuration in integrated energy production unit considering ladder-type carbon trading under CCER quota. IEEE Trans Ind Appl. 2024;61(1):884–94. doi:10.1109/TIA.2024.3481188. [Google Scholar] [CrossRef]
15. Zhang C, Liu L, Cheng H, Liu D, Zhang J, Li G. Frequency-constrained co-planning of generation and energy storage with high-penetration renewable energy. J Mod Power Syst Clean Energy. 2021;9(4):760–75. doi:10.35833/mpce.2020.000743. [Google Scholar] [CrossRef]
16. Zhang C, Cheng H, Liu L, Zhang H, Zhang X, Li G. Coordination planning of wind farm, energy storage and transmission network with high-penetration renewable energy. Int J Electr Power Energy Syst. 2020;120:105944. doi:10.1016/j.ijepes.2020.105944. [Google Scholar] [CrossRef]
17. Harsh P, Das D. Optimal coordination strategy of demand response and electric vehicle aggregators for the energy management of reconfigured grid-connected microgrid. Renew Sustain Energy Rev. 2022;160:112251. doi:10.1016/j.rser.2022.112251. [Google Scholar] [CrossRef]
18. Cui Y, Zeng P, Zhong WZ, Cui WL, Zhao YT. Low-carbon economic dispatch of electricity-gas-heat integrated energy system based on ladder-type carbon trading. Electr Power Autom Equip. 2021;41(3):10–7. (In Chinese). doi:10.16081/j.epae.202011030. [Google Scholar] [CrossRef]
19. Chen X, Cao X, Huang Q, Huang H. Optimized operation of park integrated energy system with source-load flexible response based on comprehensive evaluation index. Energy Eng. 2024;121(11):3437–60. doi:10.32604/ee.2024.053464. [Google Scholar] [CrossRef]
20. Knap V, Chaudhary SK, Stroe DI, Swierczynski M, Craciun BI, Teodorescu R. Sizing of an energy storage system for grid inertial response and primary frequency reserve. IEEE Trans Power Syst. 2016;31(5):3447–56. doi:10.1109/tpwrs.2015.2503565. [Google Scholar] [CrossRef]
21. Yao M, He D, Zhang J, Yang P, Zhang X, Zhang X. Bilevel optimal scheduling of island integrated energy system considering multifactor pricing. Energy Eng. 2025;122(1):349–78. doi:10.32604/ee.2024.057676. [Google Scholar] [CrossRef]
22. Wan T, Tao Y, Qiu J, Lai S. Distributed energy and carbon emission right trading in local energy systems considering the emission obligation on demand side. IEEE Syst J. 2023;17(4):6292–301. doi:10.1109/JSYST.2023.3298889. [Google Scholar] [CrossRef]
23. Li J, Zhong J, Wang K, Luo Y, Han Q, Tan J. Research on multi-objective optimization model of industrial microgrid considering demand response technology and user satisfaction. Energy Eng. 2023;120(4):869–84. doi:10.32604/ee.2023.021320. [Google Scholar] [CrossRef]
24. Tang J, Liu J, Sun T, Kang H, Hao X. Multi-time-scale optimal scheduling of integrated energy system considering demand response. IEEE Access. 2023;11:135891–904. doi:10.1109/access.2023.3335242. [Google Scholar] [CrossRef]
Cite This Article
 Copyright © 2026 The Author(s). Published by Tech Science Press.
This work is licensed under a Creative Commons Attribution 4.0 International License , which permits unrestricted use, distribution, and reproduction in any medium, provided the original work is properly cited.
 Downloads
 Citation Tools