
 Login
Login Register
 Submit a Paper
 Propose a Special lssue
 Open Access
ARTICLE
Hybrid Optimal Load Transfer for New Distribution Networks Coordinating Island Operation and Network Reconfiguration
Nanjing Power Supply Company, State Grid Jiangsu Electric Power Co., Ltd., Nanjing, China
* Corresponding Author: Zhan Lv. Email:
(This article belongs to the Special Issue: Digital and Intelligent Planning and Operation Technologies for Flexible Distribution Network)
Energy Engineering 2026, 123(11), 11 https://doi.org/10.32604/ee.2026.075769
Received 07 November 2025; Accepted 13 January 2026; Issue published 24 September 2026
 View Full Text
 Download PDF
Abstract
To fully utilize the diverse source-grid-load-storage flexible resources integrated in new distribution networks, this paper proposes an optimal load transfer strategy that coordinates distributed generator island operation with network reconfiguration. Following a fault event, the strategy prioritizes the black-start capability of distributed generators and establishes island operation model to maximize and locally restore critical loads while respecting island operational constraints. To solve this model, the actual topology of the new distribution network is abstracted as a tree structure, and an improved Kruskal algorithm is employed to derive the minimum spanning tree, achieving optimal island partition for black-start distributed generators. Subsequently, for the residual network not included in the islands, a network reconfiguration model is formulated by considering multiple objectives including load loss minimization, network loss reduction, and switching operation optimization. Notably, to address the common limitations of existing methods in solving such complex, large-scale, and nonlinear optimization problems, the caterpillar fungus optimizer algorithm is adopted to efficiently and rapidly solve the proposed model. Finally, the effectiveness and superiority of the proposed load transfer strategy are validated using modified IEEE 33-bus and IEEE 123-bus test systems as representative new distribution networks. The comparative results demonstrate not only the performance advantages of the proposed strategy but also its practical applicability to distribution systems of different scales and complexities, offering a significant contribution to the field of reliability of power supply in the distribution network.Keywords
To achieve the global carbon emission goal, the construction of new distribution networks is accelerating worldwide [1]. With the high-penetration integration of renewable power generation and various types of flexible resources [2], distribution networks have become increasingly complex and expansive in structure, posing significant challenges to their safe and economic operation [3]. Load transfer refers to the process of reliably and preferentially restoring power to critical loads after a distribution network fault by operating switches and optimizing the network topology, while also striving to meet the power demands of other affected loads as much as possible [4]. New distribution networks are expected to be low-carbon, clean, safe, reliable, efficient, and economical [5], with load transfer technology being a core enabler for achieving these goals. Therefore, it is necessary to research how to leverage the characteristics of various flexible source-grid-load-storage resources to participate in load transfer, thereby enhancing the power supply reliability of the distribution network [6].
In terms of the current research on optimal load transfer for distribution networks, tie lines are utilized in [7] to balance power loads across different areas of the distribution network, transferring loads from deficient feeder zones to zones with surplus supply capacity, achieving mutual power support between adjacent sections. The potential of high-voltage distribution networks is explored in [8], where network reconfiguration and load transfer are implemented in sectionalized distribution networks to improve overall power supply reliability. In [9], novel principles are proposed for switch operations during load transfer. The principles analyze the impact of switch operation sequences on transfer strategies to effectively control transfer risks. In [10], the regulatory role of energy storage, along with the network reconfiguration, is both considered to develop a coordinated load transfer method. Smart soft switches are studied in [11] to replace traditional tie switches, enabling flexible control of line power and ensuring safe load transfer. The control effect of step-voltage regulators (SVRs) is taken into account in [12], and the probabilistic distribution of voltage is utilized to optimize the output voltage of SVRs for achieving load transfer in distribution networks.
The aforementioned studies demonstrate considerable practical value in load transfer. However, they primarily focus on distribution network topology reconfiguration and fail to fully exploit the potential of flexible resources. The IEEE 1547-2004 standard expands the specifications for interconnecting distributed generators (DGs) with power systems, leveraging the island operation capability of DGs that can serve as black-start sources to ensure power supply to outage loads [13]. Various DGs in new distribution networks, such as micro turbines (MTs), energy storage batteries (ESBs), and diesel engines (DEs), possess black-start capabilities, contributing to stable power supply after distribution network faults [14]. Meanwhile, flexible loads are widely present as adjustable resources in new distribution networks, which can be regulated during fault conditions [15].
To construct and solve the models of optimal load transfer, common methods include mathematical programming, heuristic algorithm, and artificial intelligence. For mathematical programming, load transfer models based on mixed-integer second-order cone programming and mixed-integer linear programming are proposed in [16,17], respectively. These methods indicate high performances, but directly solvable models are difficult to construct due to the increasing complexity of distribution networks. For heuristic algorithms, heuristic rules are developed in [18] to operate corresponding tie switches for load transfer. In [19], binary particle swarm optimization algorithm is proposed to solve the load transfer model, but is prone to local optima. For artificial intelligence methods, an optimal load transfer strategy is developed in [20] based on deep reinforcement learning. In [21], hybrid reinforcement learning is employed to enhance the optimization performance of intelligent agents but sacrifices some optimality. In summary, among existing methods, traditional solving techniques struggle to adapt to large-scale, nonlinear, and complex distribution network models. Commonly used heuristic methods require further improvement in solving efficiency, while artificial intelligence methods often sacrifice a certain level of solution accuracy. Consequently, there is a need to balance optimization effectiveness with solving efficiency. It is essential to meet the real-time requirements of modern power systems while ensuring optimization performance, thereby adapting to large-scale load transfer in new distribution networks, reducing outage durations, and safeguarding customer power supply.
In summary, to address the research gaps in exploiting potential of novel distribution networks, this study considers various new resources and establishes a load transfer model coordinating island operation and network reconfiguration. The framework of the proposed load transfer strategy is shown in Fig. 1. During a distribution network fault, an improved Kruskal algorithm is first used to partition islands for DGs with Island operation capabilities, in order to prioritize the restoration of power supply for critical loads. Afterwards, a network reconfiguration model is established for the remaining network, while a novel caterpillar fungus optimizer (CFO) algorithm is employed to solve the proposed model, achieving power supply for the remaining loads. Finally, a modified IEEE 33-bus system and IEEE 123-bus test systems are adopted as representative new distribution network cases to simulate fault scenarios, validating the effectiveness and real-time performance of the proposed load transfer model for power supply restoration.
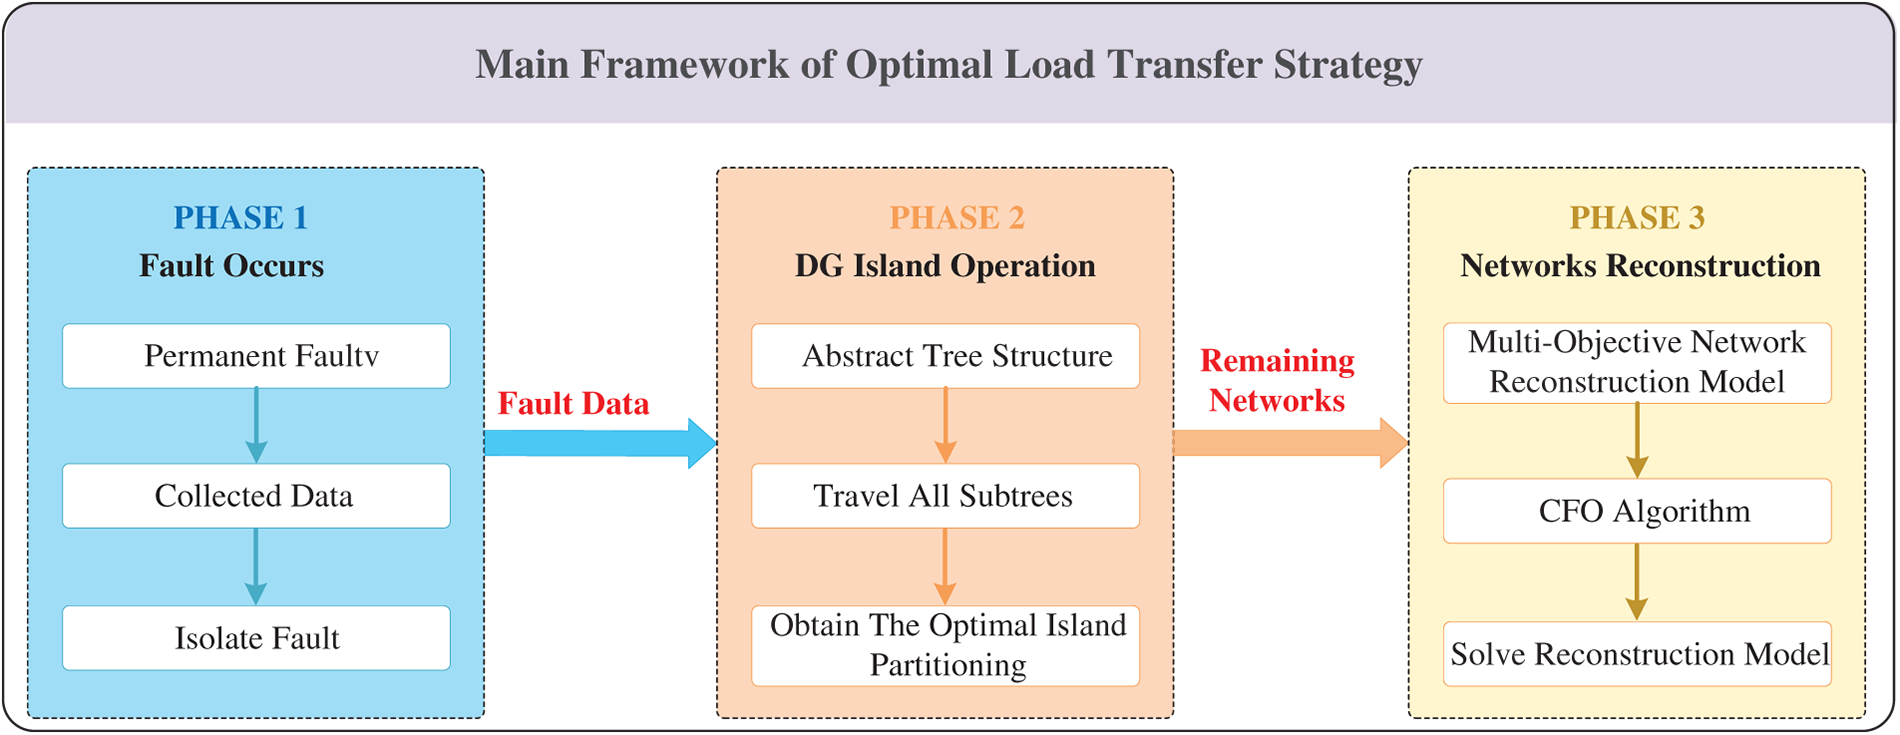
Figure 1: Main framework of proposed load transfer strategy.
The major contributions of this study are summarized as follows:
(1) A novel hybrid load transfer framework is proposed for distribution networks to maximize reliable power supply to loads by coordinating stages of distributed power generation island operation and network reconfiguration. The black-start capability of distributed generation is considered to prioritize the restoration of important load power supply. By combining the two stages, power supply reliability can be greatly improved.
(2) An optimal island partitioning method of distribution networks is developed based on improved Kruskal algorithm for black-start distributed power sources. The actual topology is abstracted as a tree structure in the method to solve the minimum spanning tree problem, achieving optimal island partitioning of those black-start distributed sources and effectively restoring important loads.
(3) A novel multi-objective network reconfiguration model is established considering system operating with islands of distributed sources, along with an efficient solution method namely CFO algorithm. For the remaining networks that are not included in the island, the network model comprehensively considers the minimum load loss, network loss reduction, and switching operation.
2 Island Operation Strategy for New Distribution Networks Considering Flexible Resources
2.1 Mathematical Model of DGs Output Characteristics
2.1.1 Mathematical Model of Distributed Photovoltaic Output Characteristics
The output power of photovoltaic (PV) systems depends on their module area and real-time irradiance, as presented in equations below [22]:
where
2.1.2 Mathematical Model of Common Controllable Distributed Generators Output Characteristics
MTs and DEs must satisfy power constraints and ramp rate constraints, expressed as follows:
where
ESBs must satisfy charging/discharging constraints and energy constraints, as shown below:
where
2.2 Mathematical Model of Load Power Characteristic
This paper analyzes load characteristics from the perspectives of importance and controllability.
• Load importance: Due to their different characteristics, the consequences of power interruption vary among loads. Loads are generally classified into three levels based on the severity of interruption consequences: first-class load, second-class load, third-class load. Higher-level loads cause more adverse consequences in terms of personal safety and economic losses during outages. Therefore, they should be prioritized during load transfer to ensure power supply [23].
• Load controllability: Based on participation in demand response, loads can be categorized into non-controllable loads and flexible loads. Non-controllable loads are fixed loads in the power system and cannot be regulated. Flexible loads can be actively adjusted according to power demand and can participate in load transfer as adjustable resources in emergencies. The constraints are as follows [24]:
2.3 Island Partitioning for New Distribution Networks Based on Improved Kruskal Algorithm
2.3.1 Principles of Island Partitioning
This paper considers the following four principles for island partitioning:
• Priority for important loads. Based on load importance levels, different weights are assigned to first-class load, second-class load, third-class load to ensure that load with higher weight are restored first during load transfer.
• Full utilization of dg capacity. When partitioning islands, the load allocated to DG should match its capacity, ensuring the safe operation of the DGs while minimizing outage load.
• Minimum network losses. Given the limited capacity of DGs, network losses need to be reduced during island operation to provide sustained and maximum power supply.
• Limited switching operations. To extend switch lifespan and ensure operational safety, frequent switch operations should be avoided, and the number of switching actions should be minimized.
2.3.2 Mathematical Model of Island Partitioning
Using DGs as the power source for load buses within islands, the objective function comprehensively considers restoring power to important loads and the electrical distance between DGs and load buses:
where
The constraints that need to be satisfied include:
• Island power constraint
To ensure island security, the adjustable capacity of the DG should be greater than the total load within the island, constrained as follows:
where
• Island power flow constraints
Active and reactive power flow constraints are as follows:
where
• Security operation constraints
Including line capacity constraints, power transmission constraints, and bus voltage constraints are as follows:
where
For the line thermal capacity constraints, this paper further evaluates the load-carrying capacity of the lines:
Firstly, based on the thermal equilibrium equation of the line, the thermal capacity of line
where
Subsequently, the remaining capacity of line
where
Finally, the safety margin of the line
where
• Network topology constraint
The partitioned islands must remain radial without forming loops:
where
2.3.3 Island Partitioning Algorithm Based on Improved Kruskal Algorithm
Distribution networks are designed with a closed-loop structure but operate in an open-loop mode, resulting in a radial topology. Therefore, the actual topology can be abstracted into a tree with the system power source as the root and loads as leaf buses. Additionally, buses with DGs are treated as leaf buses with power source characteristics, without altering the system structure. Fig. 2 shows the actual topology of a typical new distribution network, and its abstraction into a tree connection diagram is shown in Fig. 3. As can be seen, the tree in Fig. 3 is divided into 5 layers according to the power flow direction. The hierarchy and directionality of the tree simulate the sequence of bus load transfer, ensuring orderly transfer. The tree formed by the connection graph is defined as:
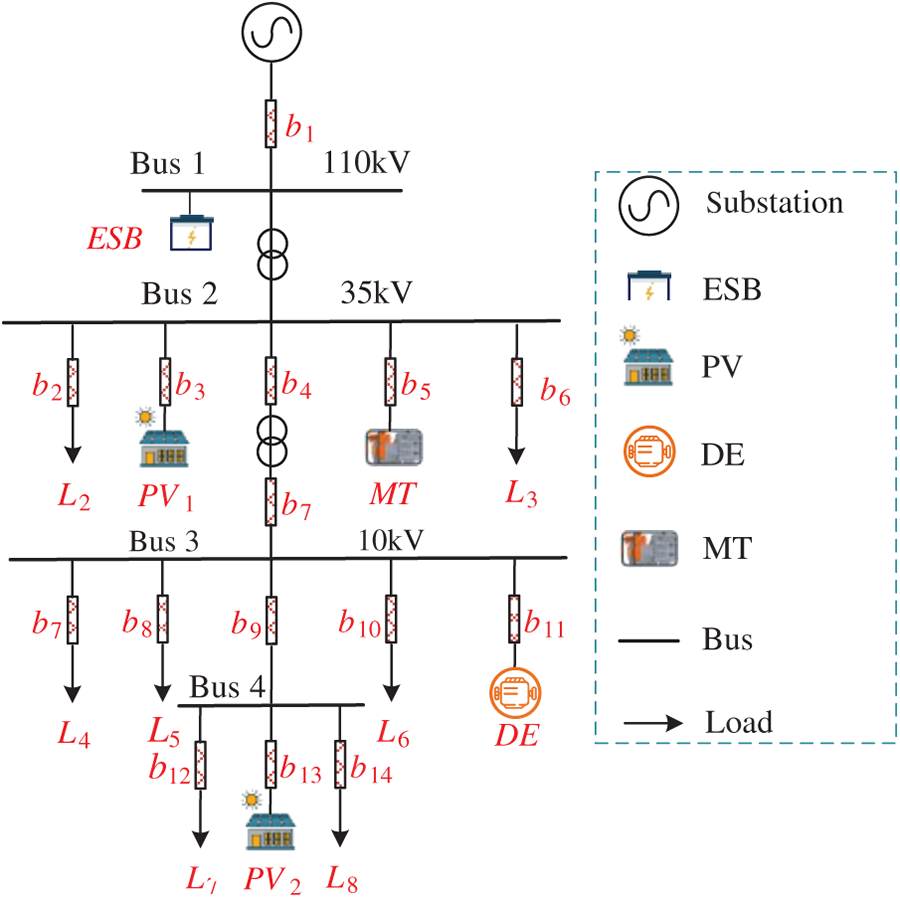
Figure 2: Typical topology of new distribution network.
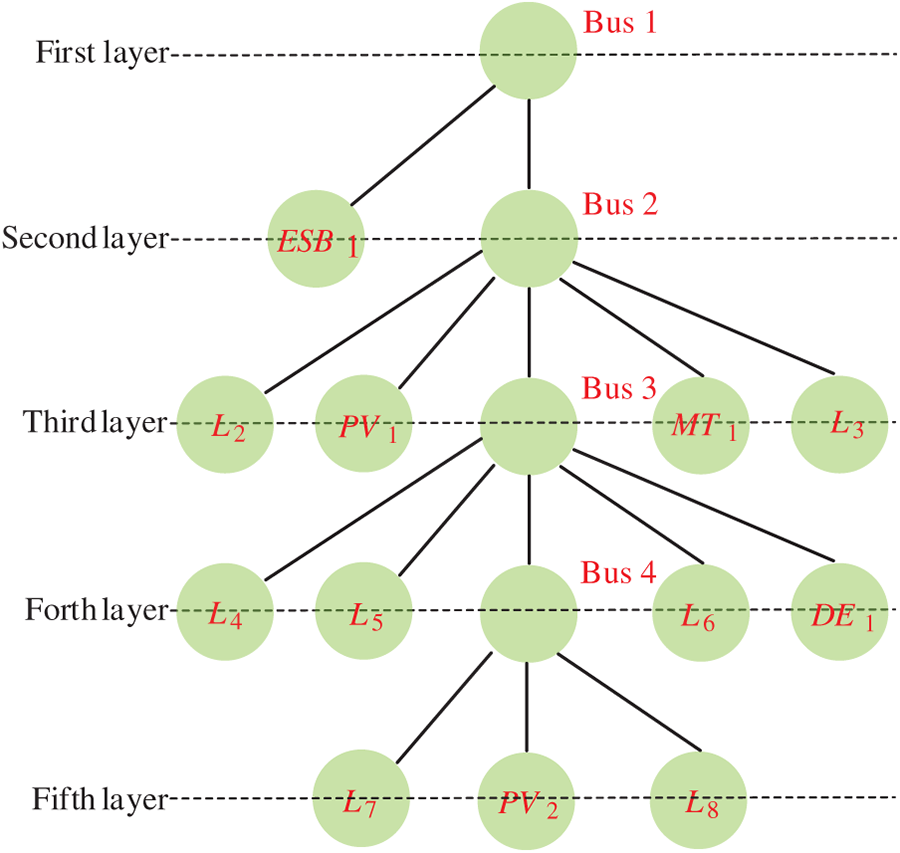
Figure 3: Connection diagram of new distribution network.
Traversing all edge combinations of tree
where
The Kruskal algorithm is a search algorithm that employs a greedy strategy to construct the minimum spanning tree of a connected graph. It is particularly suitable for finding the minimum spanning tree of relatively sparse connected graphs. The algorithmic principle is driven by starting from an initial state and making decisions based on the current local optimum, aiming to achieve the steepest ascent or descent of the objective function while satisfying constraint equations. Specifically, the algorithm iteratively selects the shortest edge from the candidate set and adds it to the vertex and edge sets of the selected subgraph until all nodes are traversed.
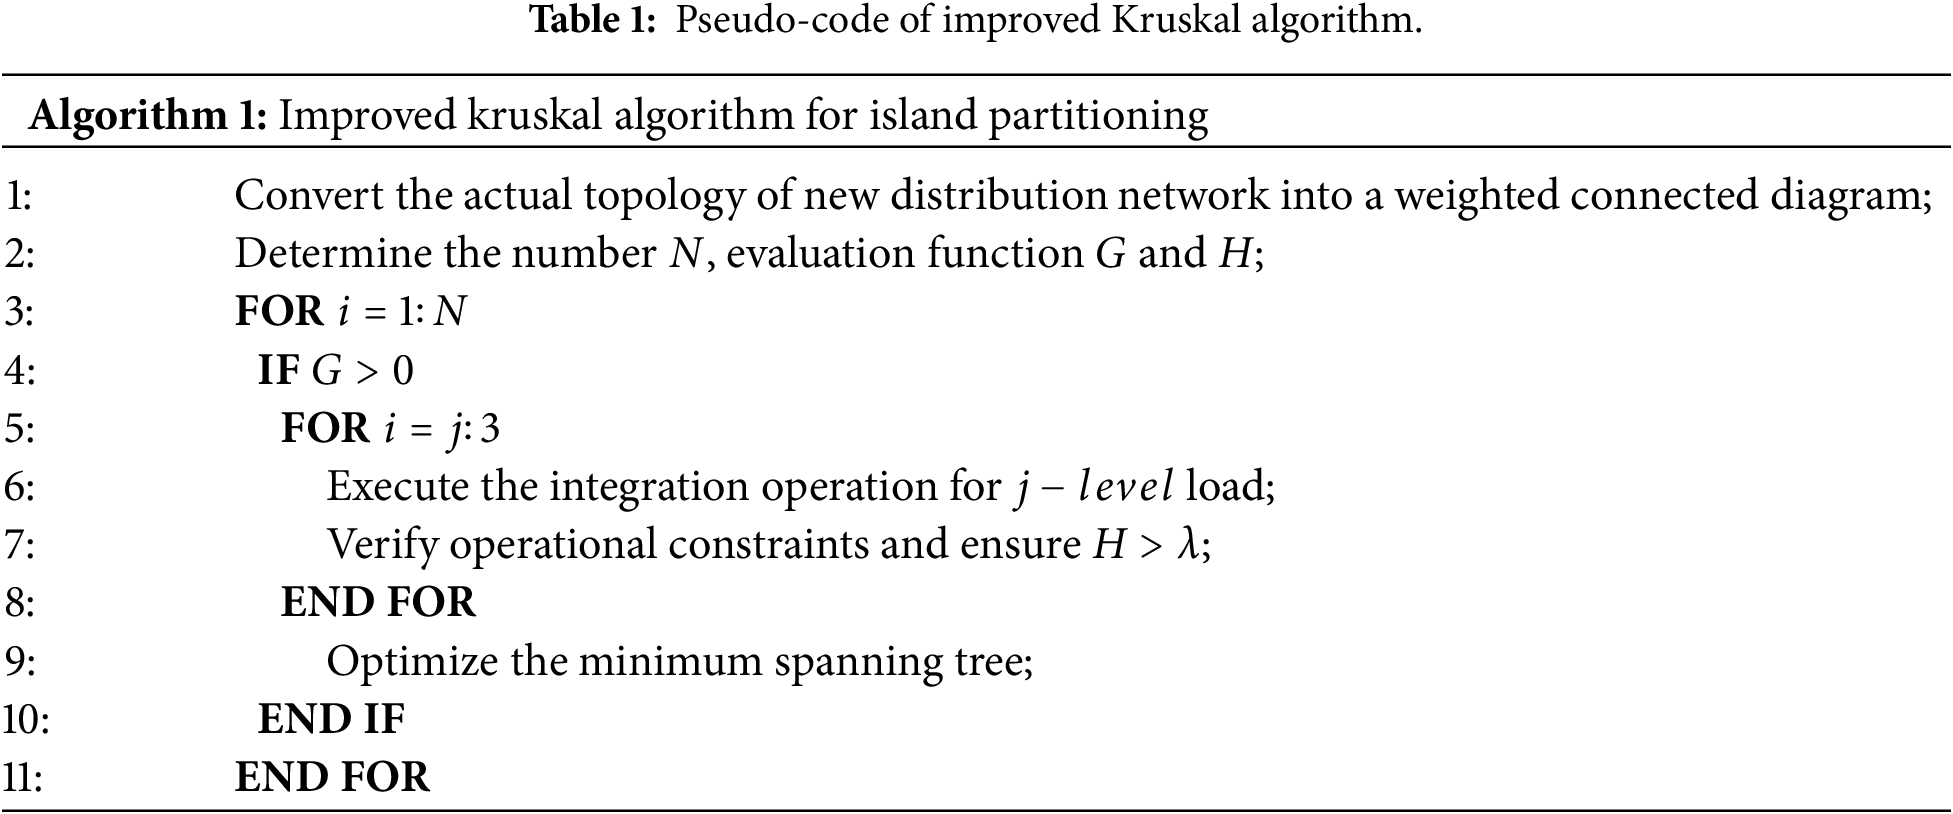
However, the traditional Kruskal algorithm cannot guarantee the uniqueness of the solution and various operational constraints of the distribution network must be considered during the search process. Therefore, corresponding modifications to the Kruskal’s algorithm are imperative. This involves resetting the search starting point, modifying search conditions and order, adding constraint checks, etc., to perform island partitioning for the new distribution network [25]. The algorithm flow is as follows:
• Input the distribution network topology, system parameters, and load sizes, correct DGs with black-start capability, convert the actual topology into a tree connection graph, and calculate the weights of all edges.
• After connecting each DG to its adjacent bus, link those buses not directly connected to any DG bus to the nearest DG-connected bus based on minimum edge weight in ascending order of bus numbers. This forms initial islands, each consisting of several buses and one DG only.
• Define the evaluation function
• Define the evaluation function
• Verify that the island partition scheme satisfies all constraints of the island model, including network power flow constraints Eqs. (15) and (16), security constraints Eqs. (17)–(23), network topology constraint Eq. (24), distributed generator constraints Eqs. (2)–(10), and flexible load constraints Eqs. (11) and (12).
• When the connection graph completes the above steps, if there are still buses not connected to any load, delete them. The optimized
For an explicit illustration, the pseudo-code of improved Kruskal algorithm for island partitioning is provided in Table 1.
3 Network Reconfiguration for New Distribution Networks Based on CFO
3.1 Network Reconfiguration Model for New Distribution Networks
Following a fault in the distribution network, island partitioning is first performed to leverage the black-start capability of DGs and prioritize restoration of critical loads. For remaining buses, network reconfiguration methods are employed—connecting buses to the main grid via tie switches—enabling the main grid to supply residual loads and ensure continuous service. The objectives of network reconfiguration encompass: minimizing load curtailment, reducing network losses, and limiting switch operations, as detailed below:
where
The constraints include network power flow constraints Eqs. (15) and (16), security constraints Eqs. (17)–(23), network topology constraint Eq. (24), distributed generator constraints Eqs. (2)–(10), and flexible load constraints Eqs. (11) and (12).
3.2 Solving the Network Reconfiguration Model Based on CFO
CFO is a novel intelligent optimization approach inspired by the parasitic mechanisms of caterpillar fungus, designed for rapid resolution of complex nonlinear optimization problems [27]. The natural host of caterpillar fungus is the Hepialus larvae. The host experiences infection when caterpillar fungus ascospores germinate to form branched bud tubes that penetrate the host’s body and propagate mycelium. During host selection, caterpillar fungus emulates a stochastic search mechanism, dynamically adjusting exploration pathways in response to environmental variations. This dual-directional search exhibits multifactor-driven characteristics—modeled as the wave advance operator (horizontally) and spiral rising operator (vertically), mimicking the spatial host-seeking behavior of caterpillar fungus.
When modeling the exploration mechanism of caterpillar fungus, three modeling principles are introduced. First, each ascospore capsule produces only one ascospore, and each ascospore can infect only one host larva. Successful parasitism requires two attempted infections per caterpillar fungus individual, capturing behavioral stochasticity. The total number of infected larvae remains constant, imposing dynamic population constraints.
• Search operators
During the exploratory phase, caterpillar fungus individuals are ranked in descending order based on initial fitness values. They randomly select exploration directions, with equal probability allocated to horizontal and vertical orientations to ensure omnidirectional exploration.
Horizontally, the algorithm exhibits undulatory propulsion, simulating the natural horizontal diffusion behavior of caterpillar fungus. The search trajectory features nonlinear and periodic oscillatory characteristics, enabling wide-area optimization—this mechanism is termed the wave advance operator, defined as follows:
where
where
Vertically, the caterpillar fungus exhibits spiral ascent exploration, described by the spiral rising operator as follows:
where
where
• Larva parasitism
During parasitic stage, caterpillar fungus exhibits strategic selection between re-parasitism and optimal parasitism, facilitating convergence toward higher parasitic success rates.
Re-parasitism mechanism: While maintaining parasitic association with the same host larva, the latter may be re-infected by a caterpillar fungus individual possessing superior fitness values. This mechanism enhances parasitic reliability, described as follows:
where
Optimal parasitism: Unlike re-parasitism, optimal parasitism mainly occurs when a caterpillar fungus encounters an already parasitized larva. The caterpillar fungus tends to choose the best growth environment, described as:
where
3.2.2 Network Reconfiguration Model Solving Process
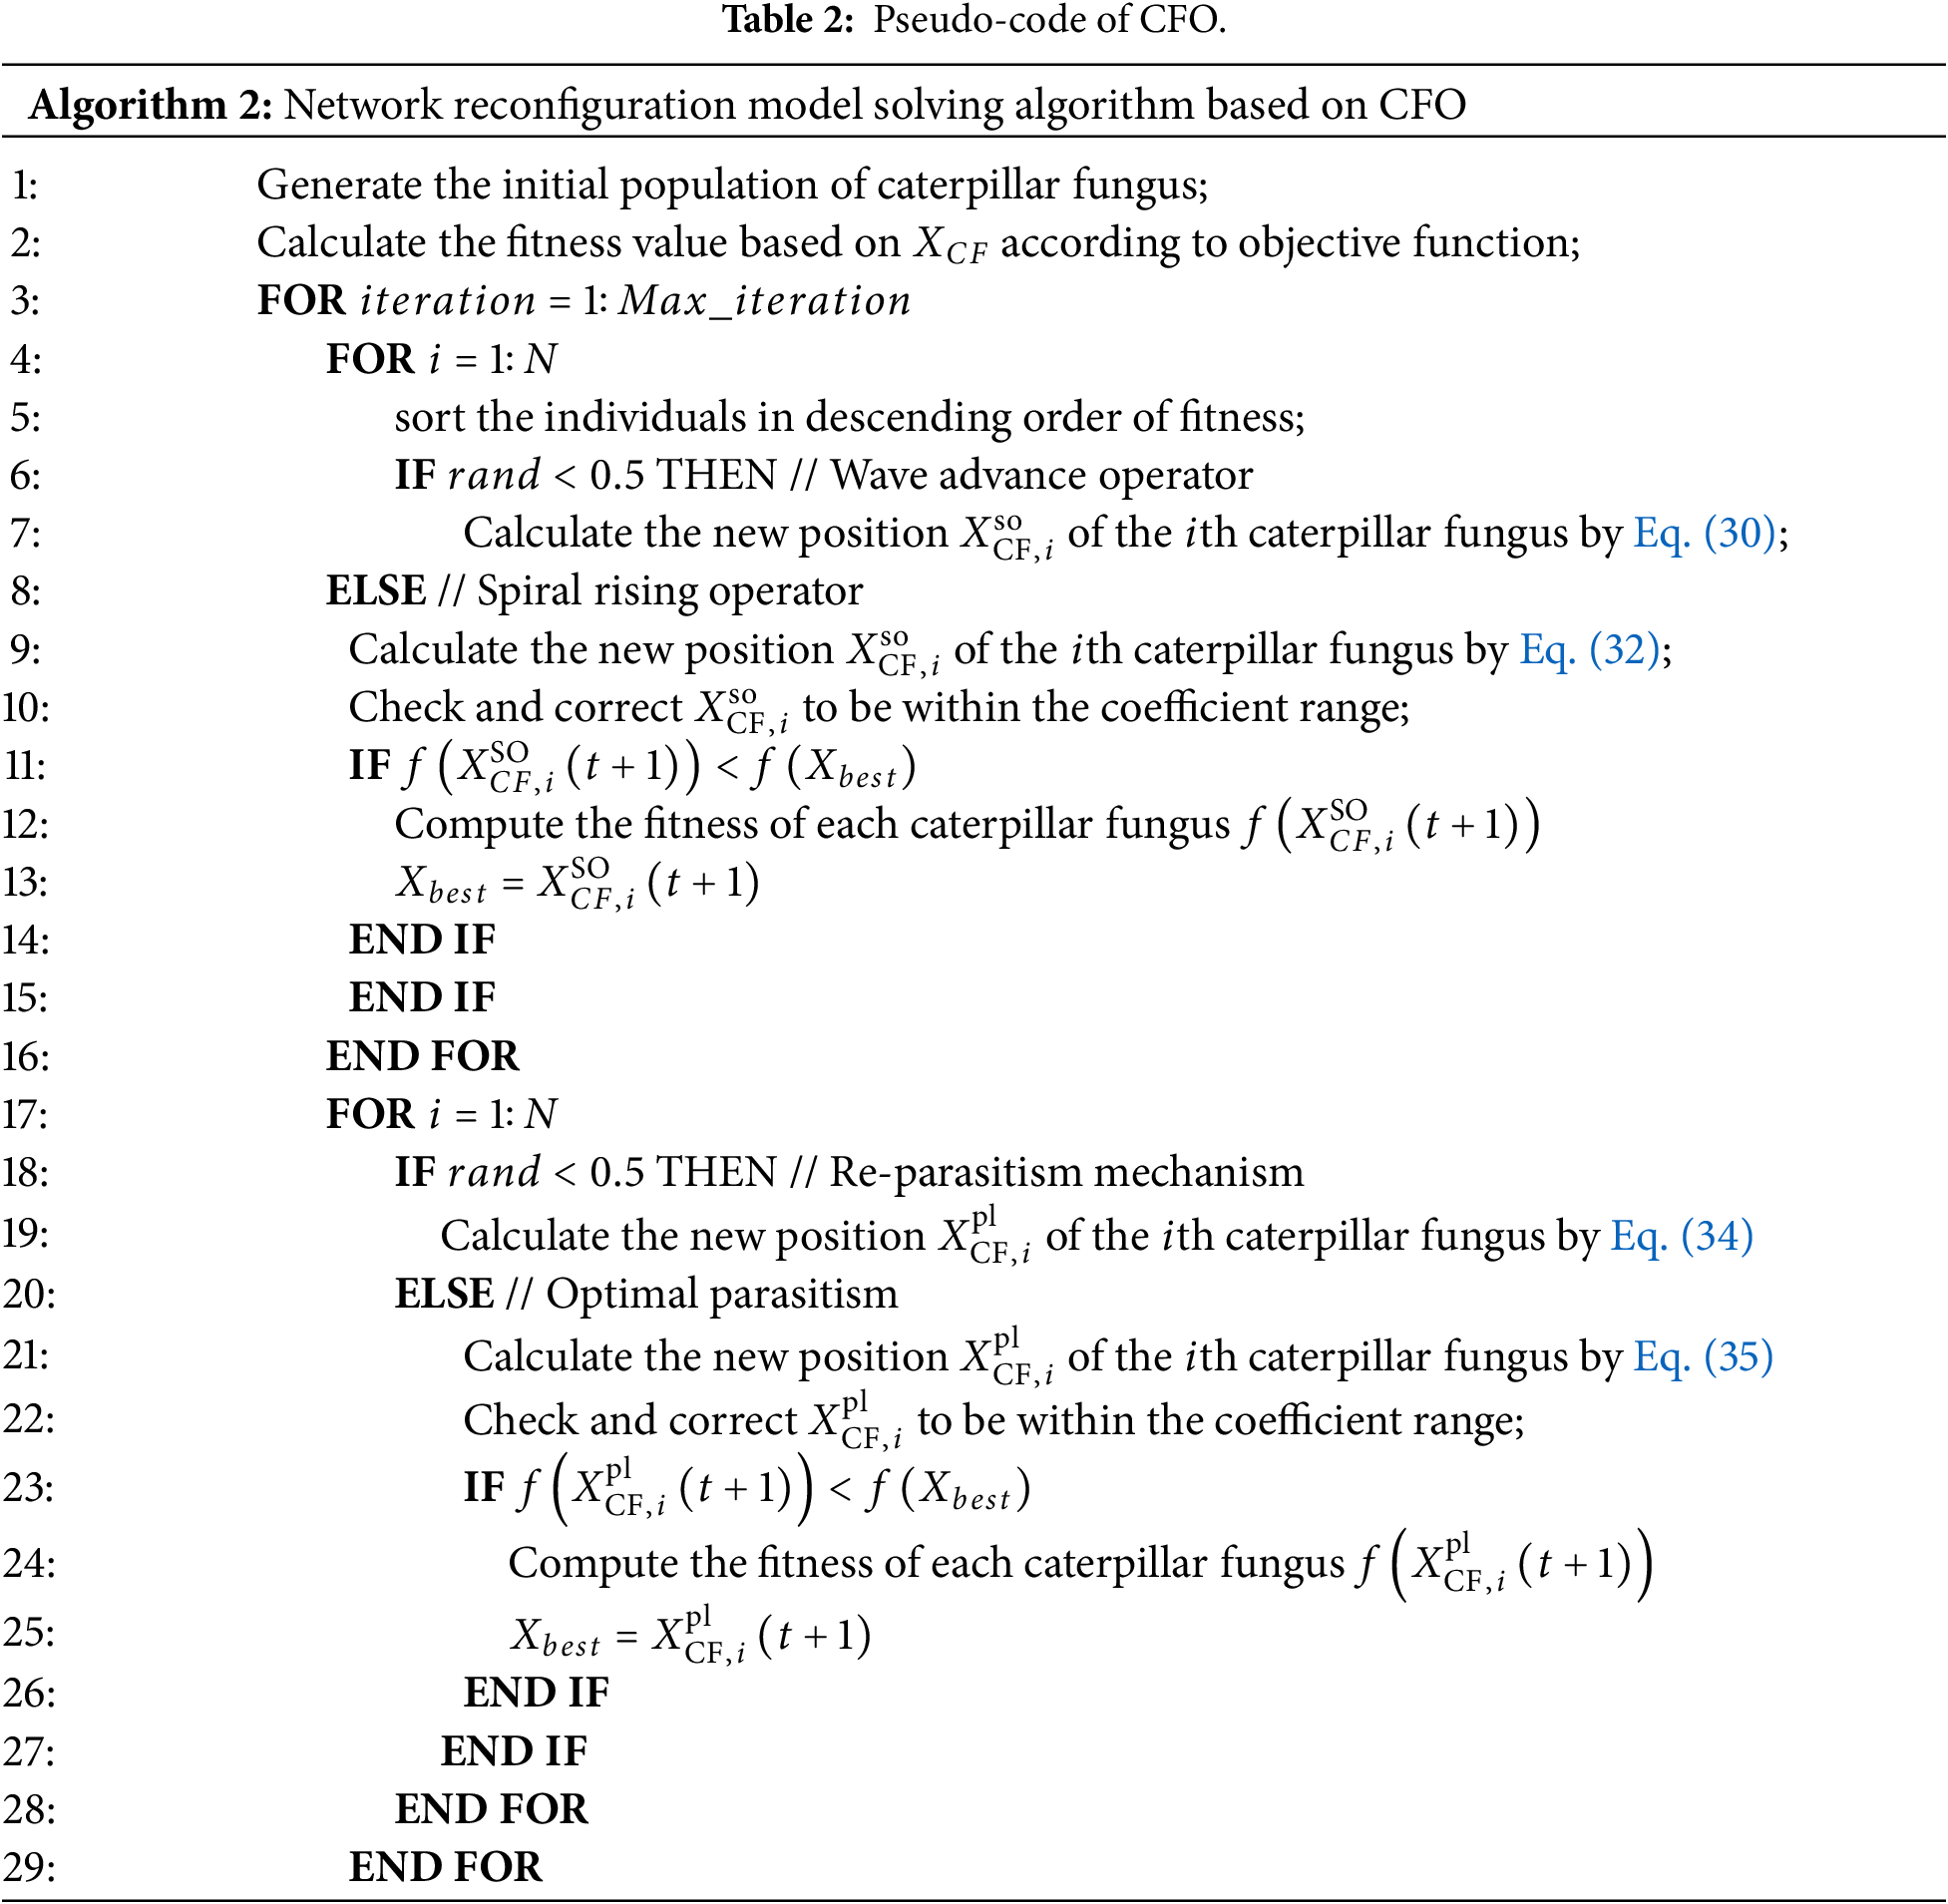
The process of solving the new distribution network reconfiguration model based on the caterpillar fungus optimizer is as follows:
• Generate the initial population of caterpillar fungus using the distribution network topology and switch set as control variables.
• Calculate the initial power flow of the network. Compute the initial fitness of the caterpillar fungus population based on the objective function, and sort the individuals in descending order of fitness.
• The caterpillar fungus population explores hosts according to the wave advance operator and spiral rising operator, updates their positions, and records the best individual and the best result in the current generation. The best individual represents the optimal network reconfiguration strategy, and the best result includes the lost load, number of switching operations, and network losses.
• The caterpillar fungus performs parasitism behavior, update their parasitic positions until the maximum number of iterations is reached, and output the optimal network reconfiguration strategy.
For an explicit illustration, the pseudo-code of CFO for network reconfiguration model solving is provided in Table 2.
The flowchart of the proposed load transfer method is shown in Fig. 4.
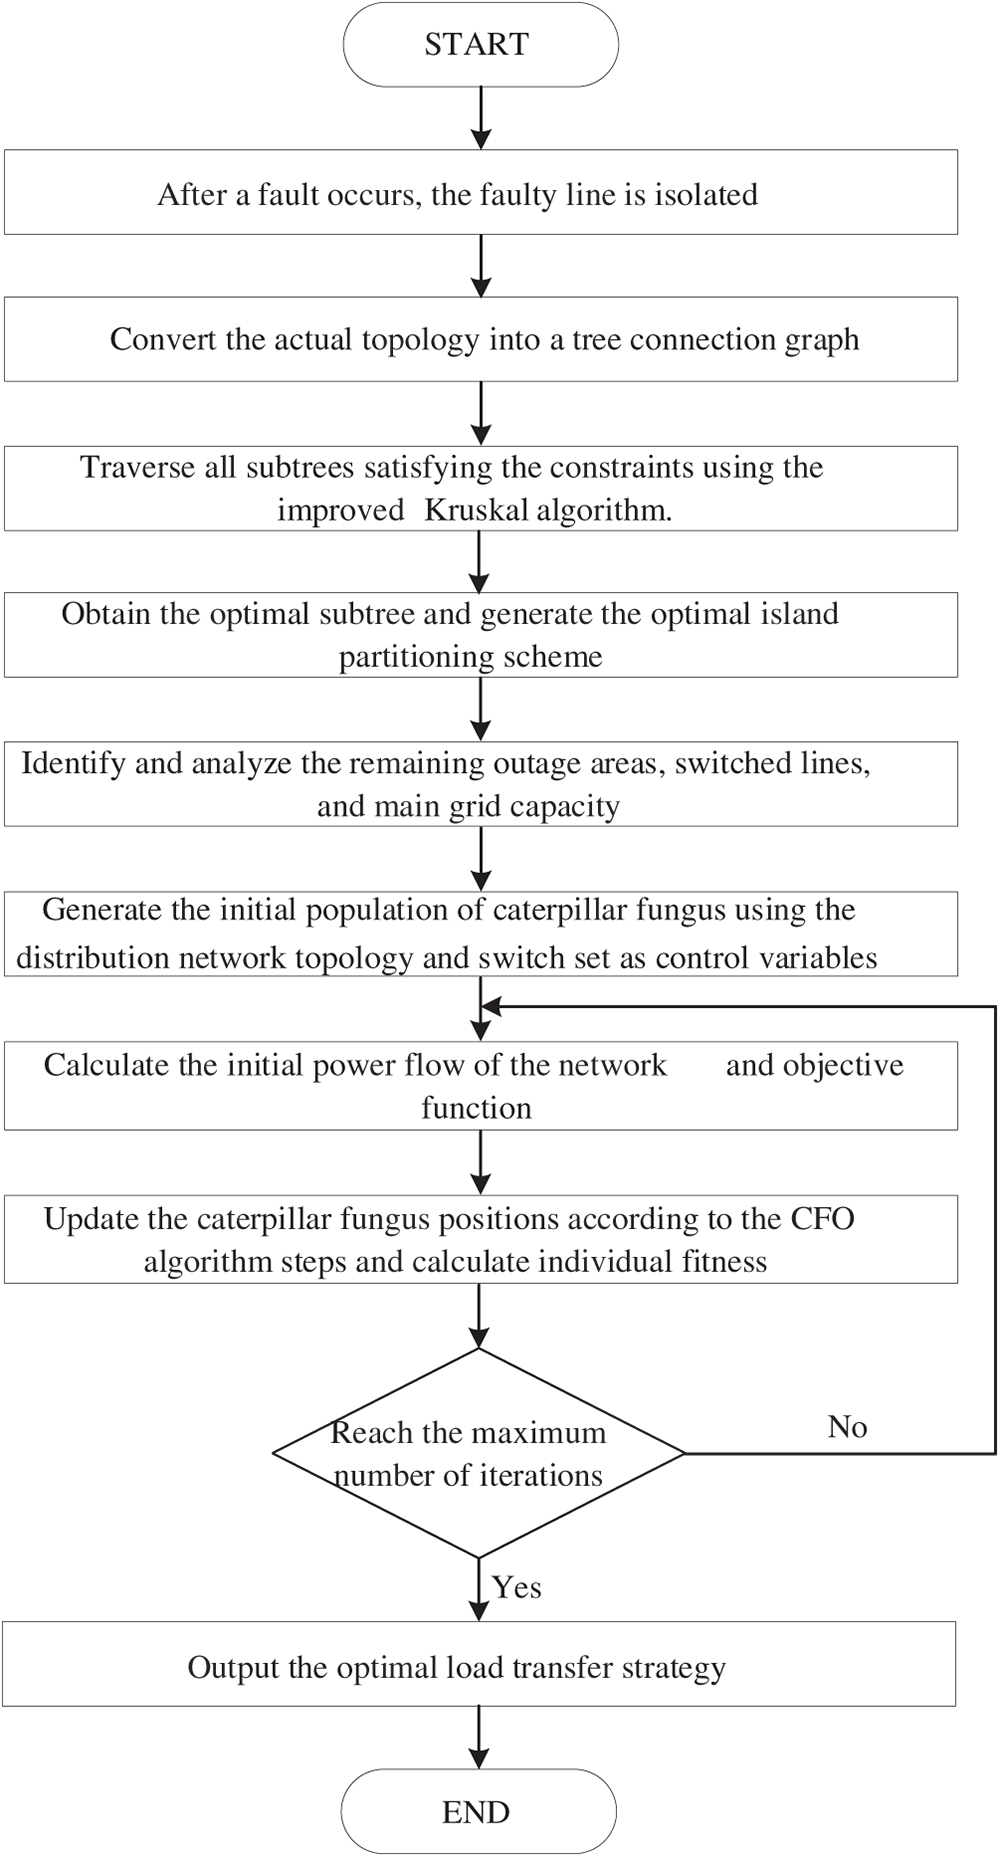
Figure 4: Flowchart of the proposed load transfer method.
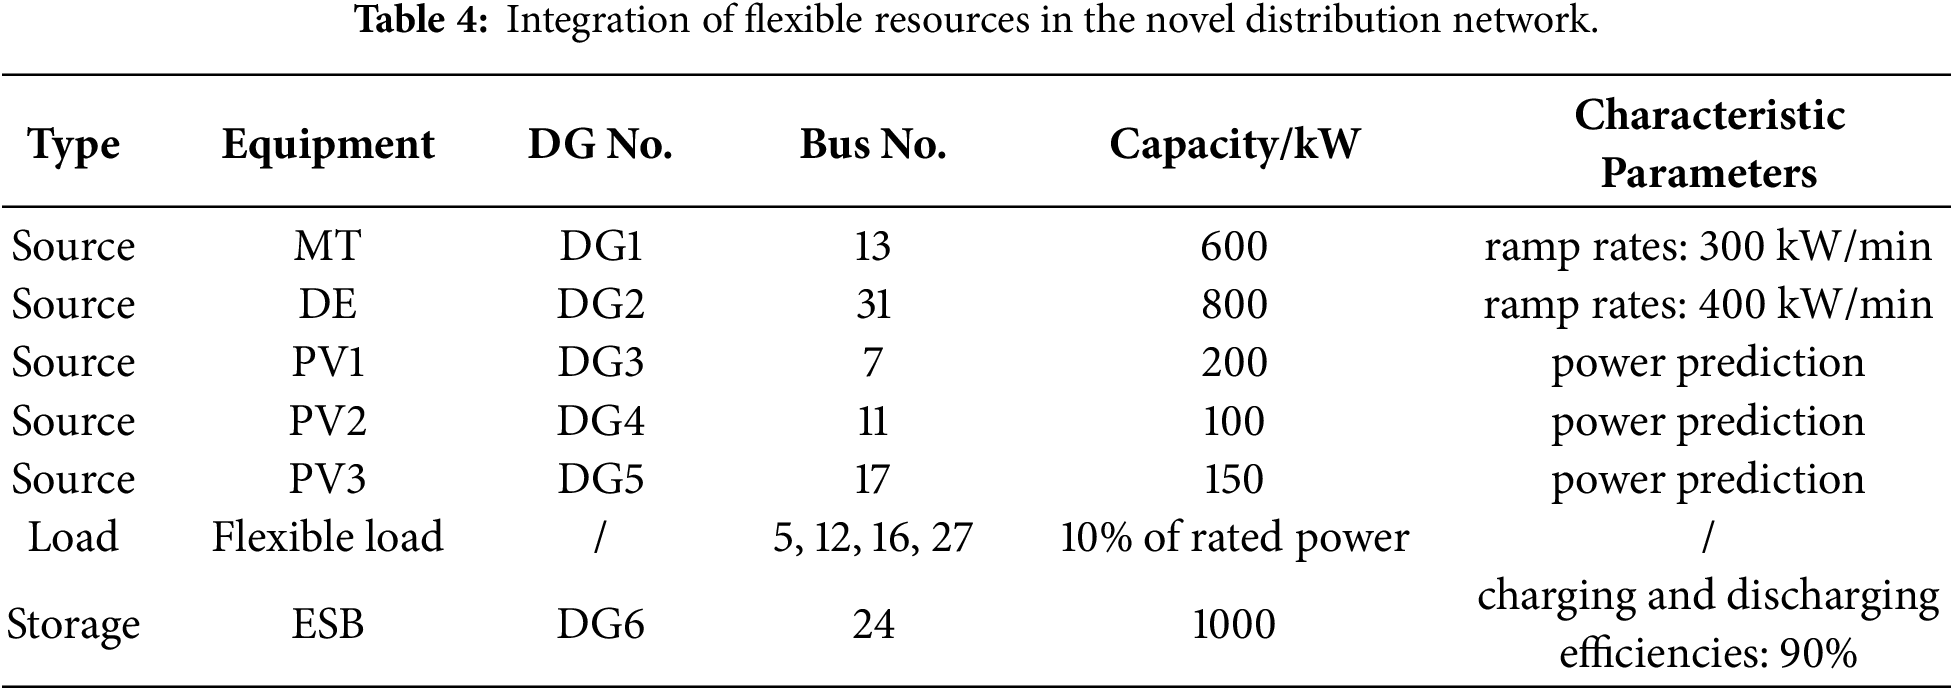
The modified IEEE 33-bus system is utilized in this study as the novel distribution network system to verify the proposed optimal load transfer method. The system structure is shown in Fig. 5, with a rated voltage of 12.66 kV. The total active load and reactive power of the 33 buses are 3715 kW and 2300 kVar, respectively. The load classes and corresponding weights of each bus are listed in Table 3. The system consists of 37 power branches equipped with sectionalizing switches. The dashed lines represent tie lines, whose initial state is open, while all other switches are closed. The new distribution network integrates various distributed energy sources and adjustable power resources, where the initial state of charge of the distributed energy resource is set at full capacity. Three distributed PV systems are connected at buses 7, 11, and 17. The MT, the ESB, and the DE are connected at buses 13, 24, and 31, respectively. The integration details of adjustable power resources in the new distribution network are provided in Table 4.
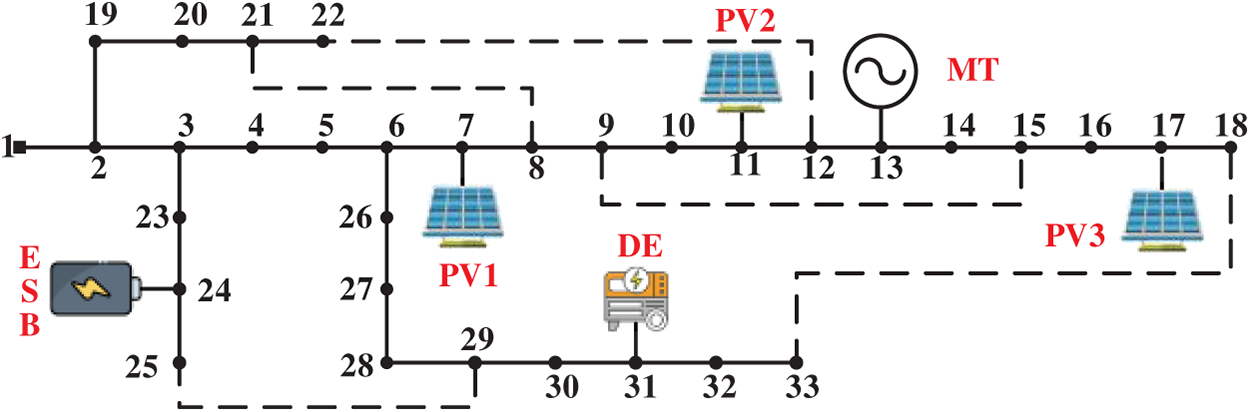
Figure 5: Structure of new distribution network test system.

To cover two typical scenarios of distributed PV power generation (power peak and valley), fault occurrence is configurated at 12:00 and 21:00. For each fault scenario, two cases are considered including single-line fault (at branch 27–28) and simultaneous multi-line faults (at branches 8–9 and 20–21). After a fault occurs, the protection device first disconnects the faulty branch(es) to isolate the fault, resulting in power loss at downstream buses. During load transfer, island partitioning is performed according to the method explained in Section 2.3 to prioritize the restoration of critical loads. After separating the fault and islanded areas, the remaining network is reconfigured based on the model in Section 3.1 and solved using the CFO algorithm described in Section 3.2 to obtain the optimized network topology. The population size and maximum number of iterations for the CFO algorithm are set to 30 and 100, respectively.
4.2.1 Effectiveness Analysis of Load Transfer Strategy
Under the two fault scenarios, the Island partitioning results are shown in Table 5. When a fault occurs on branch 27–28 at 12:00, using the MT, DE, and ESB as black-start sources, three islands are formed. Island 1 contains 8 load buses (buses 11 to 18), island 2 contains 6 load buses (buses 28 to 33), and island 3 contains 3 load buses (buses 23 to 25), with total loads of 655, 800, and 930 kW, respectively. Since PVs are at its output peak at this time, it works together with the black-start sources to supply the islands. Therefore, the restored load in island 1 (which includes PV2 and PV3) exceeds the capacity of the MT alone, fully utilizing the available power. The total loads in the other two islands are close to, but do not exceed, the capacity of their respective black-start sources.
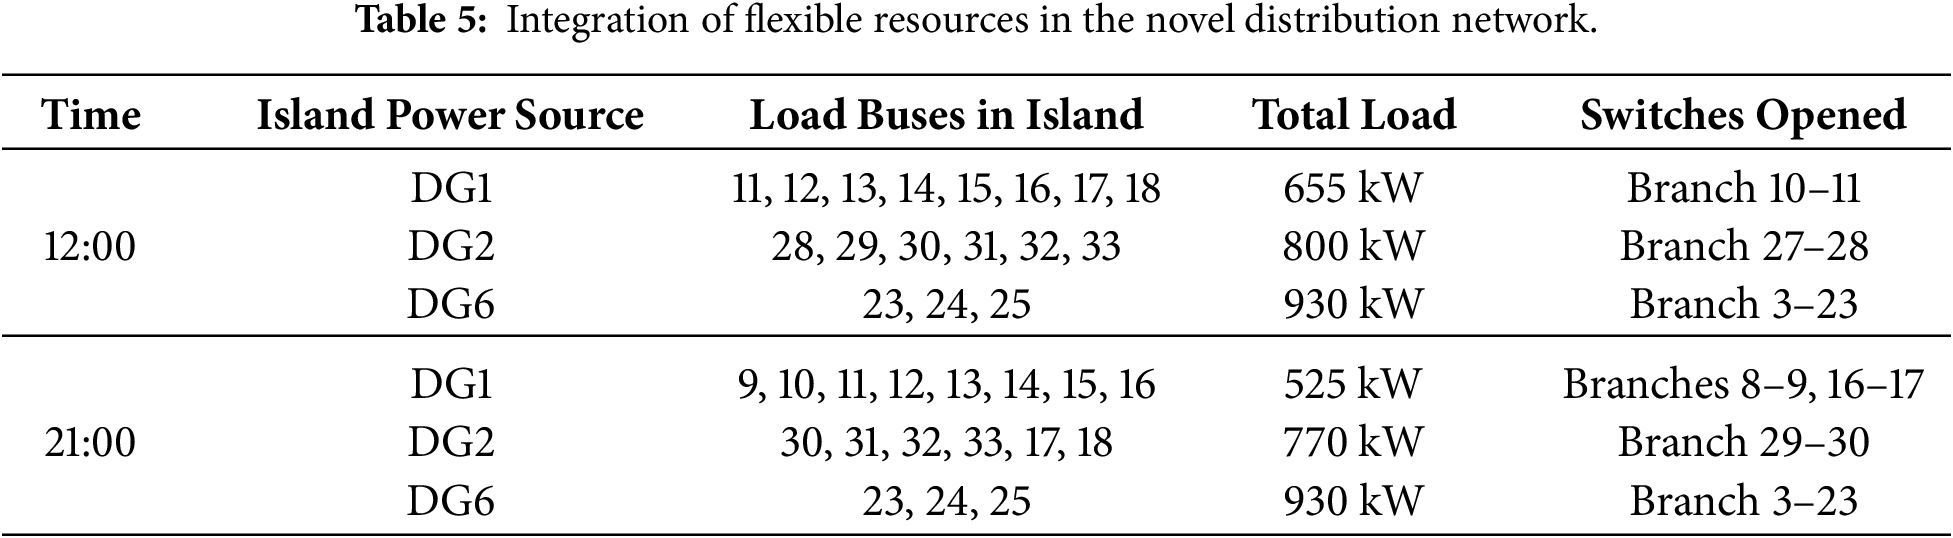
When simultaneous faults occur on branches 8–9 and 20–21 at 21:00, three islands are also formed. Island 1 contains 8 load buses (buses 9 to 16), island 2 contains 6 load buses (buses 30 to 33 and buses 17 to 18), and island 3 contains 3 load buses (buses 23 to 25), with total loads of 525, 770, and 930 kW, respectively. Since PVs output is negligible at this time, only the black-start sources provide power. To restore more load while ensuring operational security, the total load of each island is slightly less than the source capacity.
After island partitioning, the remaining network is reconfigured. The network reconfiguration status before and after reconfiguration is shown in Table 6. For the fault at 12:00, the network losses before and after reconfiguration are 83.4608 and 59.6767 kW, respectively, reduced by 23.7841 kW. For the fault at 21:00, the network losses before and after reconfiguration are 44.4177 and 21.2718 kW, respectively, reduced by 23.1459 kW, improving the economy of the network. After island partitioning, the remaining network has only 16 buses under both fault scenarios. The voltage distribution of the remaining network before and after reconfiguration is shown in Fig. 6. It can be seen that after network reconfiguration, the voltage magnitudes of buses with low voltage are raised. The minimum voltage magnitude increases from 0.9346 to 0.9610 p.u. for Fault 1, and from 0.9607 to 0.9824 p.u. for Fault 2, improving the power supply quality.
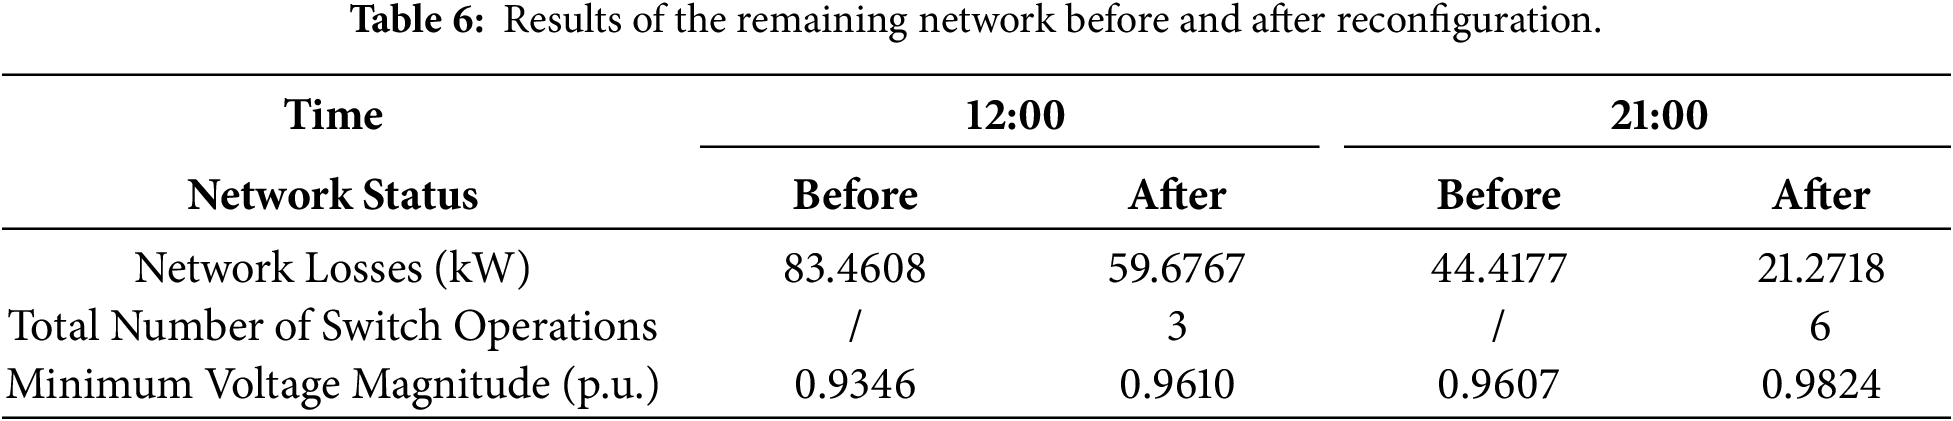
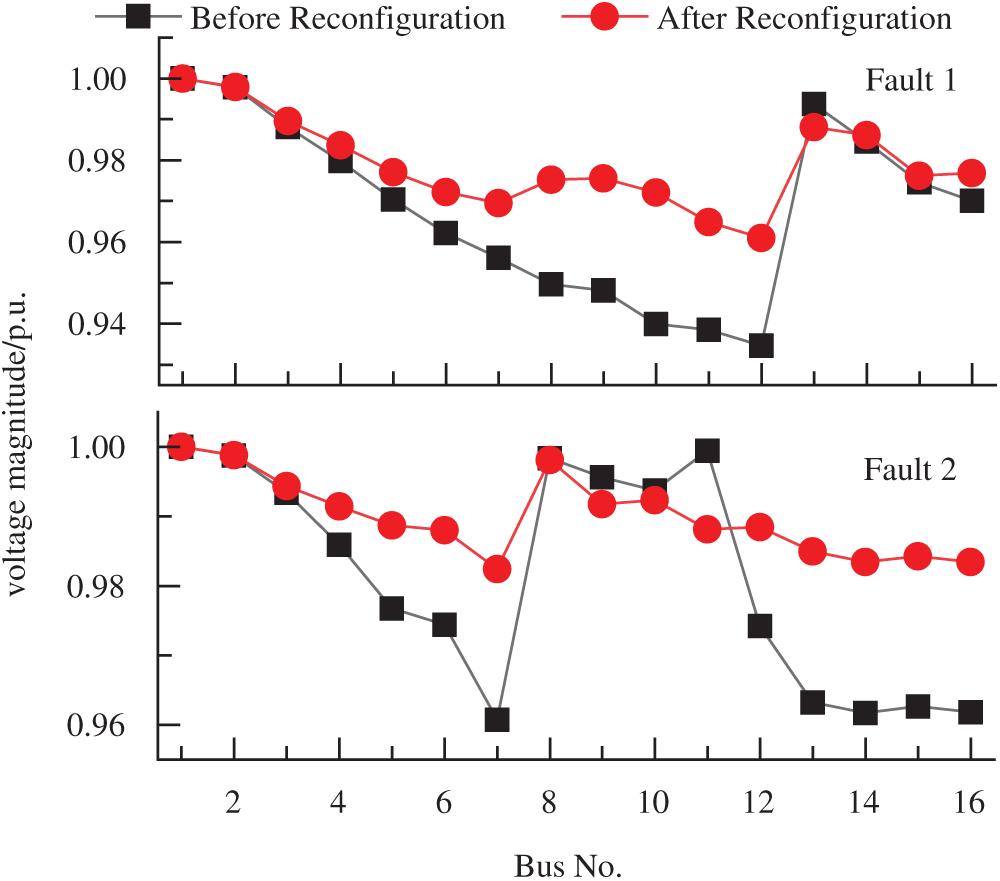
Figure 6: Voltage distribution before and after remaining network reconfiguration.
The final network topology after executing the load transfer strategy is shown in Fig. 7. The load transfer strategy varies depending on the fault time and fault branches. For Fault 1, a total of 3 switching operations are performed: opening branches 10–11, 3–23, and 27–28. For Fault 2, a total of 6 switching operations are performed: opening branches 8–9, 16–17, 3–23, and 29–30, and closing tie switches between buses 8–21 and 18–33.
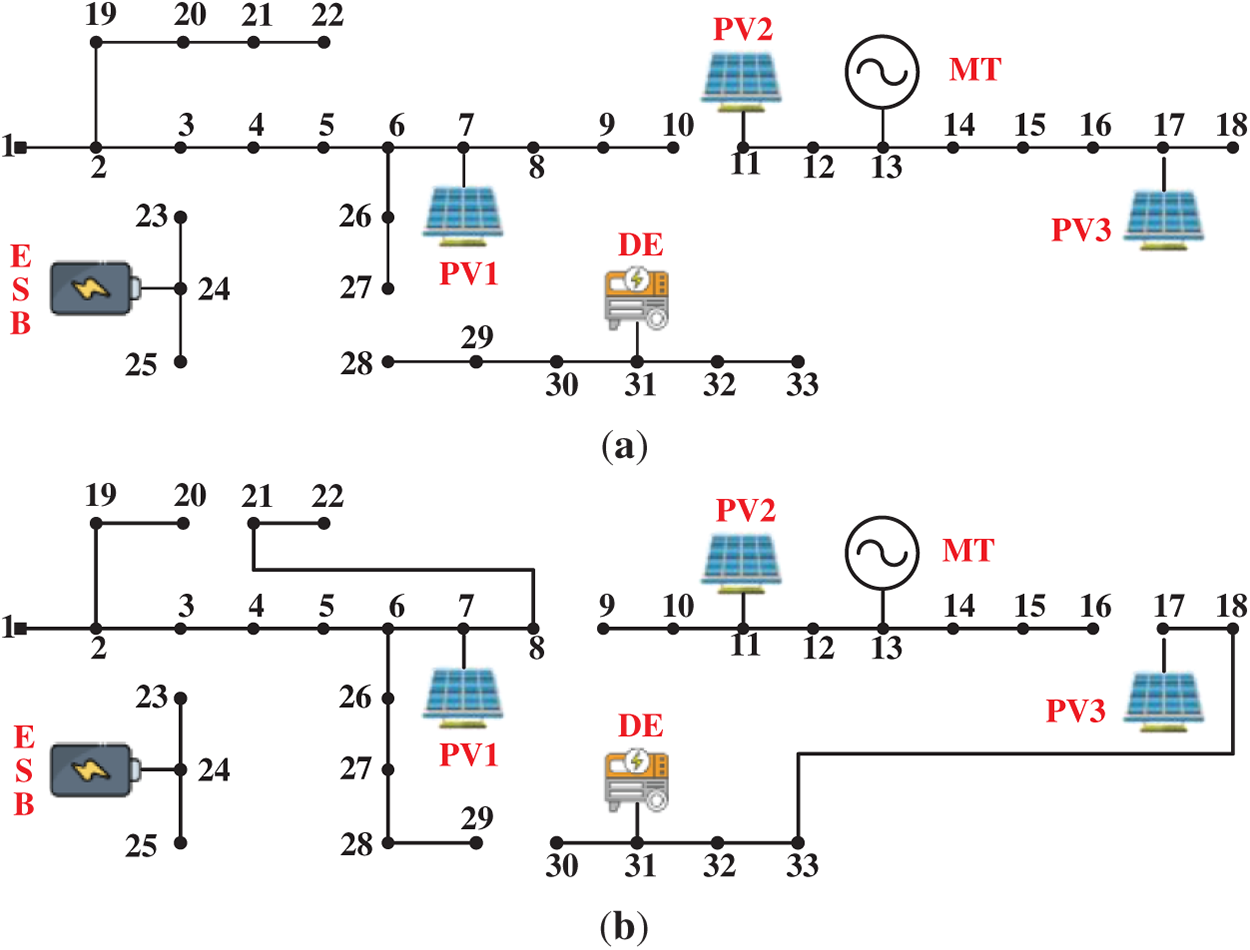
Figure 7: Topology of the new distribution network after load transfer. (a) Fault 1; (b) Fault 2.
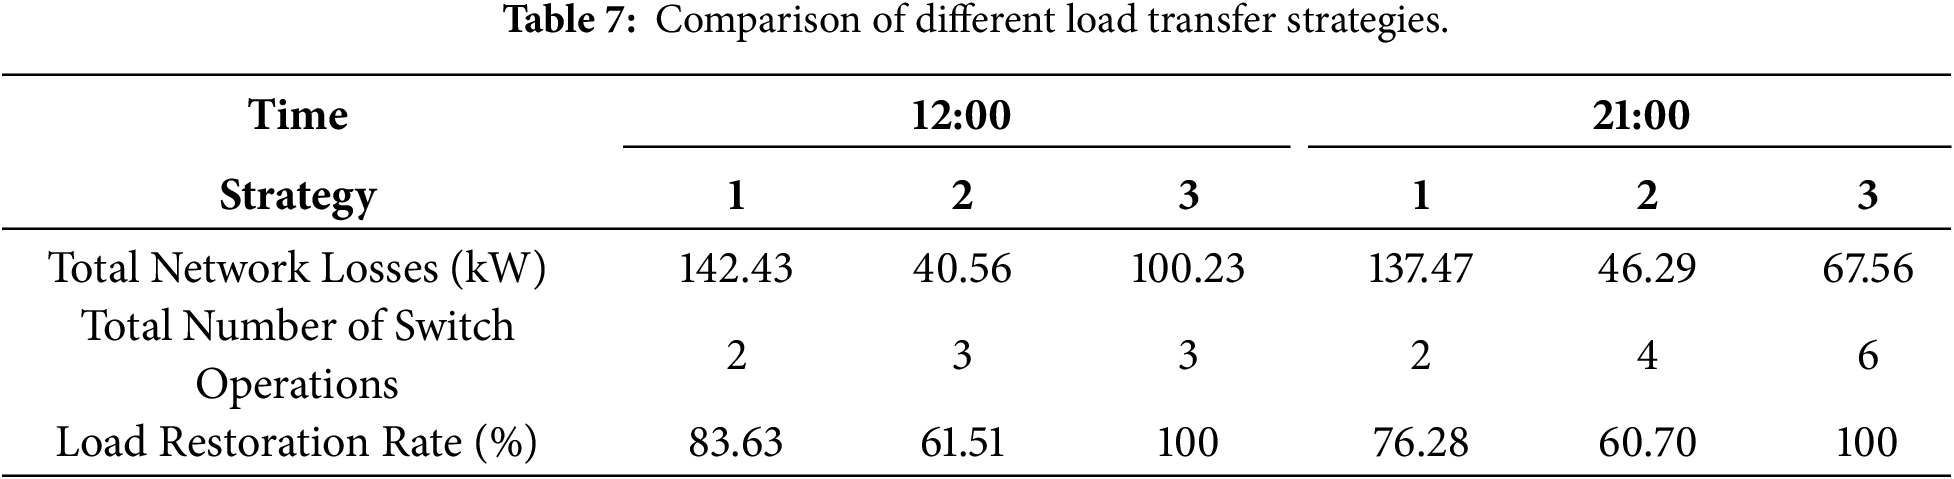
To further demonstrate the superiority of the proposed load transfer strategy, two scenarios are set up for comparison. Strategy 1: A load transfer strategy that does not consider the Island operation capability of black-start sources in the new distribution network, performing network reconfiguration directly after a fault. Strategy 2: A load transfer strategy that implement only island partitioning without subsequent network reconfiguration. These are compared with the proposed Strategy 3 (integrated island partitioning and network reconfiguration). The load restoration is shown in Table 7. It can be seen that strategy 1, which performs network reconfiguration directly, treats the distribution network as a whole for power supply, resulting in higher total network losses. It can restore most loads but still leaves some loads de-energized. Strategy 2, which only performs Island partitioning, has smaller island networks and lower network losses, but a large number of loads remain outage. The proposed load transfer strategy (Strategy 3) combines island partitioning and network reconfiguration, achieving restoration of all loads in the network with relatively low losses. This hybrid approach ensures reliable power supply while validating its effectiveness and operational superiority contrast with standalone strategies. Moreover, in the proposed method, the total system losses for Fault 1 and Fault 2 are 100.23 and 67.56 kW, respectively, while the losses after reconfiguring the remaining network are 59.6767 and 21.2718 kW, respectively. It can be observed that the total system losses exceed the losses of the remaining network, which is due to the power losses also incurred in the islanded systems.
4.2.2 Performance Analysis of CFO-Based Solution for Network Reconfiguration
To validate the superiority of CFO in solving the network reconfiguration model, it is compared with commonly used heuristic algorithms: genetic algorithm (GA), particle swarm optimization (PSO), and whale optimization algorithm (WOA). Taking the solution of the remaining network reconfiguration model under fault 1 as an example, all algorithms are iterated 100 times. Fig. 8 shows the fitness curves of the four heuristic algorithms versus the number of iterations. It can be seen that, thanks to the unique optimization mechanism of the CFO, it can quickly approach the optimal solution, does not fall into local optima, has small solving error, and good optimization effect. The other three algorithms are prone to falling into local optima when faced with complex nonlinear optimization models, and their solving errors are also larger. In terms of solving time, the solving times for CFO, GA, PSO, and WOA are 8.62 s, 21.35 s, 17.59 s, and 19.48 s, respectively. The CFO reduces the solving time and greatly improves solving efficiency. Therefore, the CFO demonstrates good performance in both optimality and solving efficiency for the network reconfiguration model proposed in this paper.
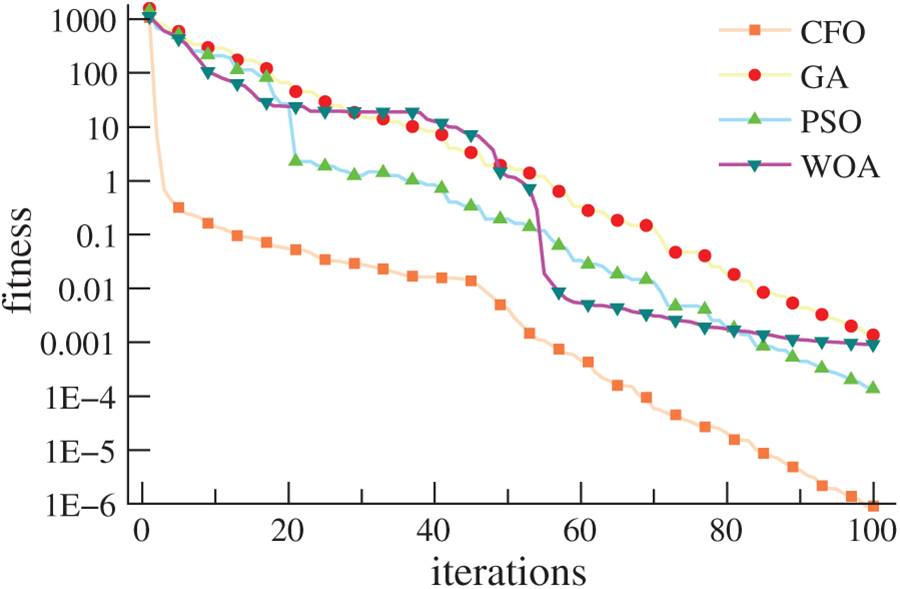
Figure 8: Performance comparison of four heuristic algorithms.
4.2.3 Adaptability Test for Large-Scale New-Type Distribution Networks
To demonstrate the applicability of the proposed load transfer technology to large-scale new distribution networks, further tests were conducted using the modified IEEE 123-bus system. The system was configured with five tie lines and integrated with 20 PVs, 4 MTs, 4 MTs, and 4 ESBs. 20 flexible load buses were also set. One hundred single-line fault scenarios were randomly generated, and real-time PVs output values were randomly sampled within 10% to 100% of the rated PVs capacity. Real-time load transfer was performed using the three aforementioned strategies, and the average values of relevant metrics over the 100 cases are presented in Table 8. The optimal solutions and total computation times obtained by the four heuristic algorithms for solving the 100 network reconfiguration models are shown in Fig. 9.
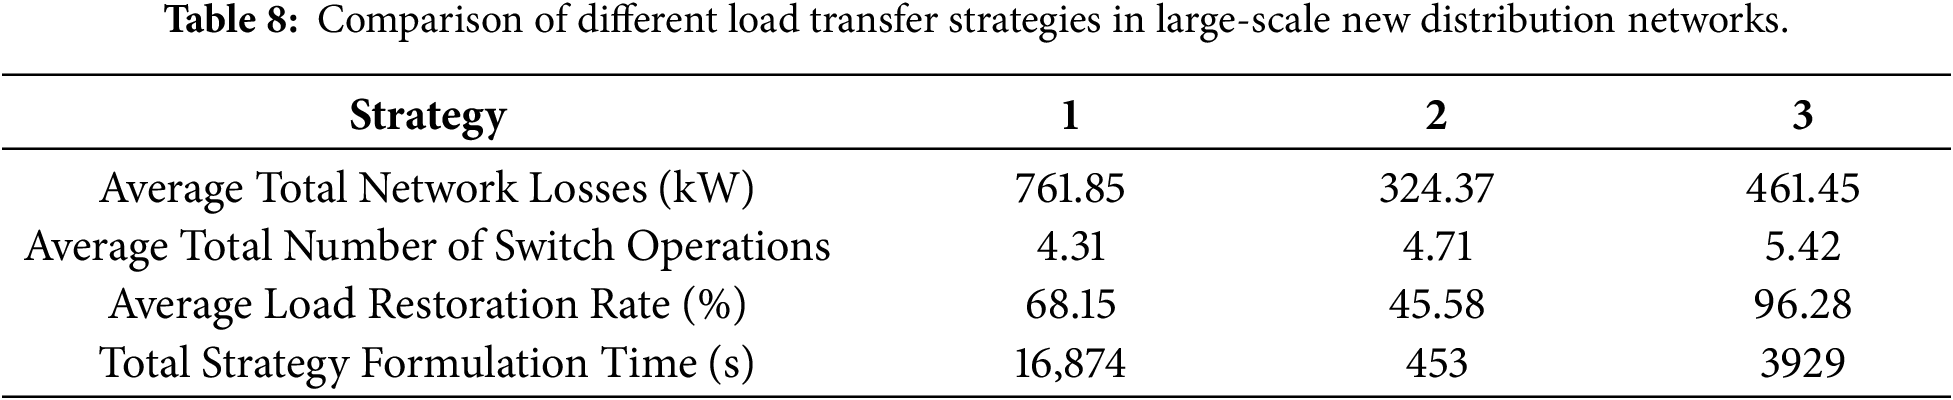
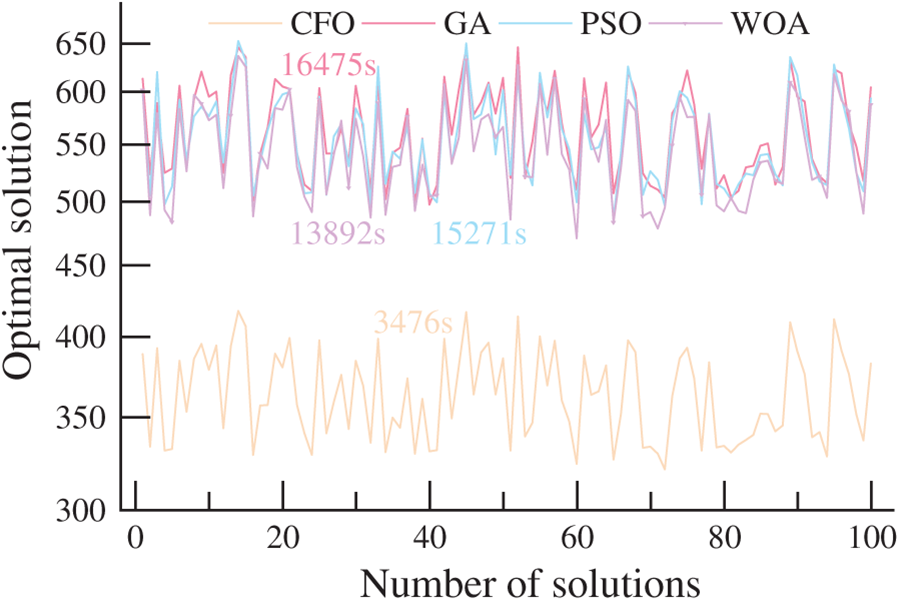
Figure 9: Real-Time optimization solutions of four heuristic algorithms in large-scale new distribution networks.
It can be observed that in large-scale new distribution systems, relying solely on either network reconfiguration or island partitioning would result in a significant amount of outage load. Although the proposed method increases the number of switching operations, it achieves an average load recovery rate of 96.28%, ensuring high-quality and highly reliable power supply with relatively low network losses. Furthermore, directly performing network reconfiguration, due to the complexity and scale of the model, required an average solving time of 168.74 s per case. In contrast, the proposed method, which performs reconfiguration on the remaining network after rapid island partitioning, reduces model complexity and significantly accelerates the solving efficiency, requiring only 39.29 s on average to provide a transfer strategy. Additionally, when dealing with the large-scale nonlinear model, the CFO algorithm spent an average of 34.76 s to solve one reconfiguration model and achieved a smaller objective function value compared to the other algorithms. This indicates that CFO can effectively escape local optima and converge to the optimal solution with a relatively fast iteration speed. The other common heuristic algorithms were prone to getting trapped in local optima and had slower iteration speeds, requiring average solving times of 164.75, 152.71, and 138.92 s per model while yielding larger objective function values. Compared to CFO, these solutions were non-optimal and exhibited poorer performance, making them unsuitable for large-scale nonlinear models.
Considering that the DGs in new distribution networks possess the capability of black-start, this paper proposes an optimal load transfer method for the new distribution network. The method incorporates the islanded operation of DGs and the reconfiguration of the remaining network. Experiential studies were conducted based on a modified IEEE 33-bus system, leading to the following conclusions:
(1) The improved Kruskal algorithm is developed to achieve optimal island partitioning for black-start power sources of distributed generators. The algorithm can better prioritize the restoration of power supply for critical loads.
(2) Compared to conventional heuristic algorithms, the proposed CFO algorithm demonstrates superior performance in escaping local optima and rapidly solving complex nonlinear models of network reconfiguration.
(3) In contrast to standalone methods that consider merely islanded operation or network reconfiguration, the proposed combined load transfer method can better ensure reliable power supply for various flexible loads. The proposed method can also achieve improved economic operation results during load transfer in new distribution networks.
Future research will further consider the complex characteristics of new distribution networks, including three-phase unbalance, meshed operation, and practical protection constraints.
Acknowledgement: We would like to express our gratitude to all members of the research group for their hard work.
Funding Statement: This work was supported by the Incubation Project of the State Grid Jiangsu Electric Power Co., Ltd. (JF2025017, Research and Development of an Emergency Load Transfer System for Multi-Scenario and Multi-Type Loads in Distribution Networks).
Author Contributions: The authors confirm contribution to the paper as follows: research concept and design: Zhan Lv, Lan Lan, Zijian Hu; data collection: Honghua Xu, Hong Zhu; analysis and interpretation of results: Zhan Lv, Zijian Hu, Jiehua Hou; manuscript preparation draft: Zhan Lv, Lan Lan. All authors reviewed and approved the final version of the manuscript.
Availability of Data and Materials: The authors confirm that the data supporting the findings of this study are available within the article.
Ethics Approval: Not applicable.
Conflicts of Interest: The authors declare no conflicts of interest.
References
1. Yang H, Deshmukh R, Suh S. Global transcontinental power pools for low-carbon electricity. Nat Commun. 2023;14(1):8350. doi:10.1038/s41467-023-43723-z. [Google Scholar] [PubMed] [CrossRef]
2. Gao Y, Ai Q, Yousif M, Wang X. Source-load-storage consistency collaborative optimization control of flexible DC distribution network considering multi-energy complementarity. Int J Electr Power Energy Syst. 2019;107(1):273–81. doi:10.1016/j.ijepes.2018.11.033. [Google Scholar] [CrossRef]
3. Rathore A, Patidar NP. Optimal sizing and allocation of renewable based distribution generation with gravity energy storage considering stochastic nature using particle swarm optimization in radial distribution network. J Energy Storage. 2021;35(1):102282. doi:10.1016/j.est.2021.102282. [Google Scholar] [CrossRef]
4. Ghasemi S, Mohammadi M, Moshtagh J. A new look-ahead restoration of critical loads in the distribution networks during blackout with considering load curve of critical loads. Electr Power Syst Res. 2021;191(2):106873. doi:10.1016/j.epsr.2020.106873. [Google Scholar] [CrossRef]
5. Wang R, Ji H, Li P, Yu H, Zhao J, Zhao L, et al. Multi-resource dynamic coordinated planning of flexible distribution network. Nat Commun. 2024;15(1):4576. doi:10.1038/s41467-024-48862-5. [Google Scholar] [PubMed] [CrossRef]
6. Li Y, Wang D. Whole-line fault analysis method for unbalanced distribution networks with inverter interfaced distributed generators. IET Gener Transm Distrib. 2022;16(15):3016–26. doi:10.1049/gtd2.12493. [Google Scholar] [CrossRef]
7. Li H, Yan J, Liu Y. A link-path model-based load-transfer optimization strategy for urban high-voltage distribution power system. IEEE Access. 2020;8:3728–37. doi:10.1109/ACCESS.2019.2960297. [Google Scholar] [CrossRef]
8. Li Z, Zhang Y, Aqeel Ashraf M. Optimization design of reconfiguration algorithm for high voltage power distribution network based on ant colony algorithm. Open Phys. 2018;16(1):1094–106. doi:10.1515/phys-2018-0130. [Google Scholar] [CrossRef]
9. Oh JY, Oh S, Lee GS, Yoon YT, Jo S. Sequential control of individual switches for real-time distribution network reconfiguration using deep reinforcement learning. IEEE Trans Smart Grid. 2025;16(5):3666–83. doi:10.1109/TSG.2025.3580063. [Google Scholar] [CrossRef]
10. Monteiro RVA, Bonaldo JP, Da Silva RF, Bretas AS. Electric distribution network reconfiguration optimized for PV distributed generation and energy storage. Electr Power Syst Res. 2020;184(3):106319. doi:10.1016/j.epsr.2020.106319. [Google Scholar] [CrossRef]
11. Bai L, Jiang T, Li F, Chen H, Li X. Distributed energy storage planning in soft open point based active distribution networks incorporating network reconfiguration and DG reactive power capability. Appl Energy. 2018;210(2):1082–91. doi:10.1016/j.apenergy.2017.07.004. [Google Scholar] [CrossRef]
12. Hanashiro R, Tsuji T, Moriuchi E, Fujita N, Ishibashi K. Network reconfiguration method considering probabilistic operation of SVR in a distribution system. IEEJ Trans Electr Electron Eng. 2025;10(2):70223. doi:10.1002/tee.70223. [Google Scholar] [CrossRef]
13. Basso TS, DeBlasio R. IEEE 1547 series of standards: interconnection issues. IEEE Trans Power Electron. 2004;19(5):1159–62. doi:10.1109/TPEL.2004.834000. [Google Scholar] [CrossRef]
14. Zhao Y, Zhang T, Sun L, Zhao X, Tong L, Wang L, et al. Energy storage for black start services: a review. Int J Miner Metall Mater. 2022;29(4):691–704. doi:10.1007/s12613-022-2445-0. [Google Scholar] [CrossRef]
15. Ma L, Hui H, Wang S, Song Y. Coordinated optimization of power-communication coupling networks for dispatching large-scale flexible loads to provide operating reserve. Appl Energy. 2024;359(1):122705. doi:10.1016/j.apenergy.2024.122705. [Google Scholar] [CrossRef]
16. Li Y, Xiao J, Chen C, Tan Y, Cao Y. Service restoration model with mixed-integer second-order cone programming for distribution network with distributed generations. IEEE Trans Smart Grid. 2019;10(4):4138–50. doi:10.1109/TSG.2018.2850358. [Google Scholar] [CrossRef]
17. Wan D, Zhao M, Yi Z, Jiang F, Guo Q, Zhou Q. Mixed-integer second-order cone programming method for active distribution network. Front Energy Res. 2023;11:1259445. doi:10.3389/fenrg.2023.1259445. [Google Scholar] [CrossRef]
18. Chen C, Wu Y, Cao Y, Liu S, Tan Q, Wang W. Intending island service restoration method with topology-powered directional traversal considering the uncertainty of distributed generations. Front Energy Res. 2021;9:762491. doi:10.3389/fenrg.2021.762491. [Google Scholar] [CrossRef]
19. Rodríguez-Montañés M, Rosendo-Macías JA, Gómez-Expósito A. A systematic approach to service restoration in distribution networks. Electr Power Syst Res. 2020;189(6):106539. doi:10.1016/j.epsr.2020.106539. [Google Scholar] [CrossRef]
20. Huang Y, Li G, Chen C, Bian Y, Qian T, Bie Z. Resilient distribution networks by microgrid formation using deep reinforcement learning. IEEE Trans Smart Grid. 2022;13(6):4918–30. doi:10.1109/TSG.2022.3179593. [Google Scholar] [CrossRef]
21. Si R, Chen S, Zhang J, Xu J, Zhang L. A multi-agent reinforcement learning method for distribution system restoration considering dynamic network reconfiguration. Appl Energy. 2024;372(7):123625. doi:10.1016/j.apenergy.2024.123625. [Google Scholar] [CrossRef]
22. Yang X, Li L, Fu J, Han Y, Li Z. Two-stage power restoration in interconnected and islanded distribution networks. J Shanghai Univ Electr Power. 2024;40:58–65. (In Chinese). [Google Scholar]
23. AlOwaifeer M, AlMuhaini M. Load priority modeling for smart service restoration. Can J Electr Comput Eng. 2017;40(3):217–28. doi:10.1109/cjece.2017.2705174. [Google Scholar] [CrossRef]
24. Cheng LL, Luo ZJ, Li Q, Zhang NY, Li YR, Zang HX. Real-time stochastic dispatch method for active distribution network using fuzzy neural network pre-decision. Autom Electr Power Syst. 2025;49(19):75–85. (In Chinese). doi:10.7500/AEPS20250213005. [Google Scholar] [CrossRef]
25. Feng XP, Song XH, Liang Y, Meng XL. Islanding method based on minimum spanning tree and improved genetic algorithm for distribution system with DGs. High Volt Eng. 2015;41(10):3470–8. (In Chinese). doi:10.13336/j.1003-6520.hve.2015.10.039. [Google Scholar] [CrossRef]
26. Lu D, Li W, Zhang L, Fu Q, Jiao Q, Wang K. Multi-objective optimization and reconstruction of distribution networks with distributed power sources based on an improved BPSO algorithm. Energies. 2024;17(19):4877. doi:10.3390/en17194877. [Google Scholar] [CrossRef]
27. Yang B, Liang B, Zhou S, Qian Y, Zheng R, Shu H, et al. A novel bio-inspired caterpillar fungus (Ophiocordyceps sinensis) optimizer for SOFC parameter identification via GRNN. Renew Energy. 2026;256(6):123995. doi:10.1016/j.renene.2025.123995. [Google Scholar] [CrossRef]
Cite This Article
 Copyright © 2026 The Author(s). Published by Tech Science Press.
This work is licensed under a Creative Commons Attribution 4.0 International License , which permits unrestricted use, distribution, and reproduction in any medium, provided the original work is properly cited.
 Downloads
 Citation Tools
