
 Login
Login Register
 Submit a Paper
 Propose a Special lssue
 Open Access
ARTICLE
Topology Optimization and Heat Transfer Characteristics of Microchannel Heat Sink
College of Locomotive and Rolling Stock Engineering, Dalian Jiaotong University, Dalian, China
* Corresponding Author: Bo Cai. Email:
Energy Engineering 2026, 123(11), 4 https://doi.org/10.32604/ee.2026.083149
Received 30 March 2026; Accepted 25 May 2026; Issue published 24 September 2026
 View Full Text
 Download PDF
Abstract
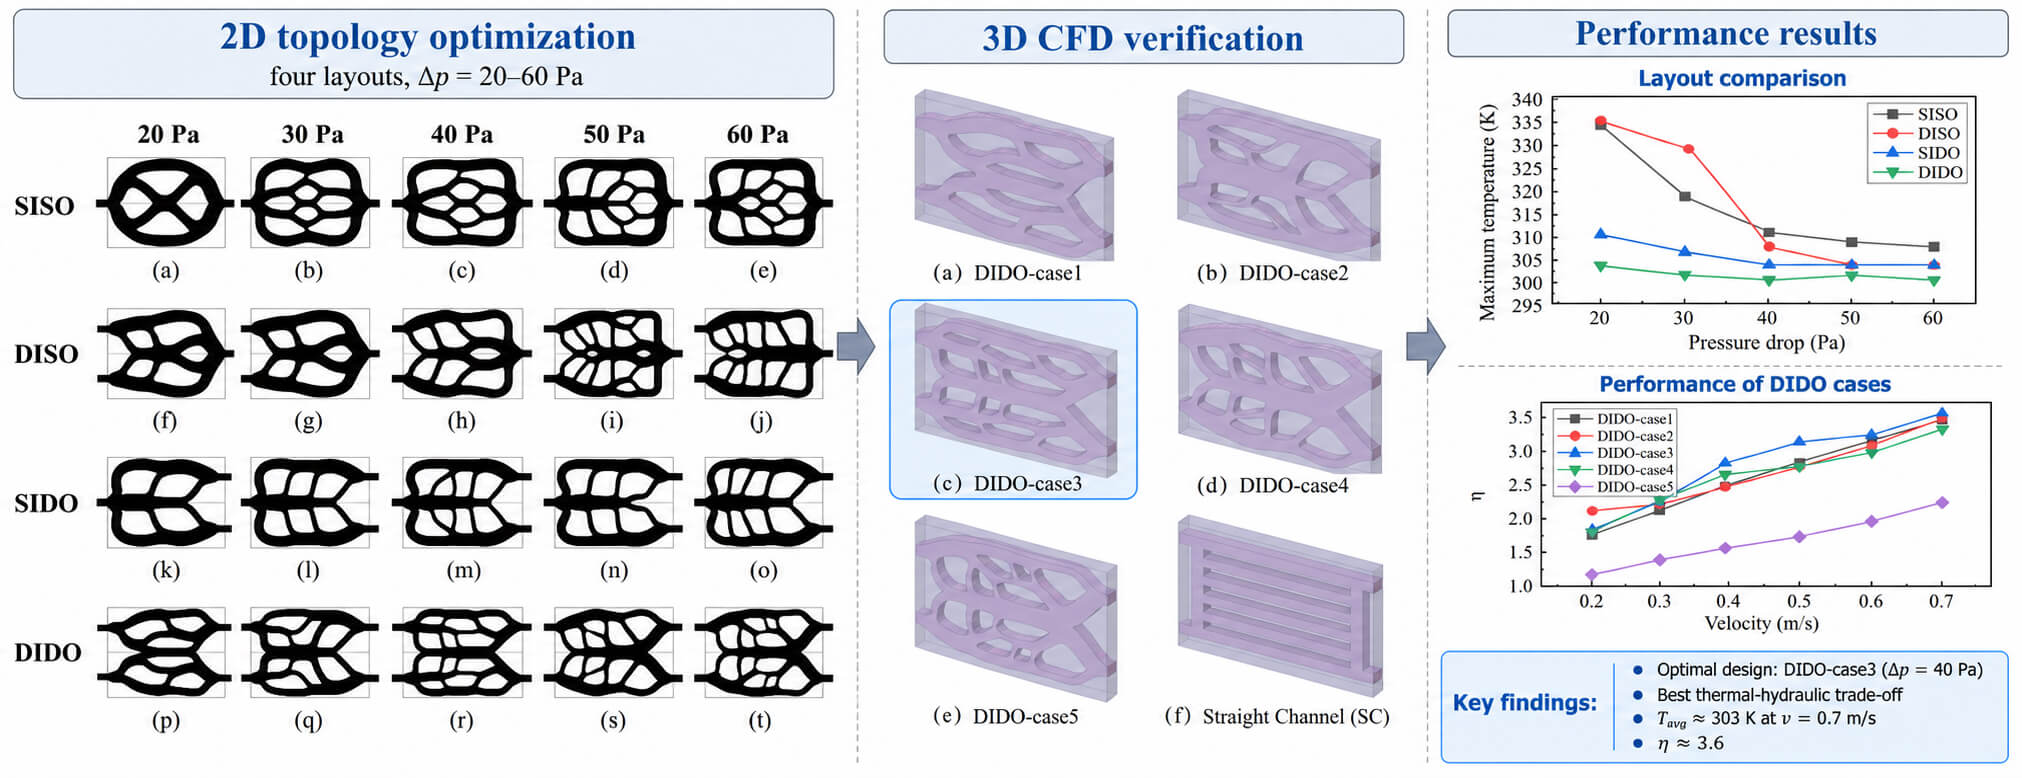
Aiming at the high heat flux heat dissipation requirements of high-power electronic devices, this paper adopts the topology optimization method, with the dual goals of minimizing the average temperature and flow power dissipation, including single inlet single outlet (SISO), single inlet double outlet (SIDO), double inlet single outlet (DISO) and double inlet double outlet (DIDO), four flow channel layout design domains 6 mm2 × 8 mm2 are used to optimize the structure and study the heat transfer characteristics. The results show that with the increase of pressure drop, the optimized flow channel presents the characteristics of multi-stage bifurcation evolution, and the heat transfer effect is significantly improved; Among them, the heat dissipation performance and temperature uniformity of the DIDO layout. Further, the topological configuration and heat dissipation performance of DIDO under different pressure drops (20~60 Pa) are analyzed, and the pressure drop, temperature, Nusselt number and heat transfer enhancement factor are compared based on CFD. The results show that when the inlet velocity is 0.7 m/s, the weighted average temperature of the DIDO model decreases to 303 K (the simulated temperature of the three-dimensional model), the comprehensive heat transfer factor is higher than 2.8, and the weighted average pressure drop is about 35% compared with that of the straight channel. The comprehensive trade off shows that the comprehensive heat transfer performance of the DIDO topology with a pressure drop of 40 Pa is the best. This paper verifies the significant advantages of topology optimization method in the design of microchannel radiators, and provides a new idea for high-power electronic devices with high efficiency and low resistance.Graphic Abstract
Keywords
Supplementary Material
Supplementary Material FileWith the rising power density of chips, the local heat flow density can reach more than 1000 W/cm2 [1]. Single-phase flow heat dissipation is becoming more and more difficult to meet the actual demand due to insufficient heat transfer capacity. Especially in critical equipment or systems, high temperatures can directly lead to instantaneous failure of components, thus threatening the stability and safety of the entire system [2]. Chip cooling to wind natural cooling, forced air cooling and non-embedded microchannel liquid cooling, these heat dissipation occupies more space, thermal resistance, low cooling efficiency, difficult to match with the higher heat flow density chip cooling [3]. Among them, microchannel liquid-cooled heat dissipation has become a research hotspot in the field of heat dissipation for high-power electronic devices due to its compact structure, high heat transfer coefficient, and guaranteed flow heat transfer uniformity, which significantly improves the heat transfer efficiency [4]. However, the structure of flat microchannels limits the further improvement of its cooling performance.
In order to break through this performance bottleneck, many scholars have carried out a lot of research on the structural optimization of microchannel radiators. Topology optimization methods have received extensive attention due to their ability to achieve optimal material placement within a given design space. In order to significantly improve the cooling performance of fluid-solid coupled conjugate heat transfer structures, it is necessary to simultaneously design and optimize the distribution as well as the flow characteristics of the fluid and solid materials [5]. Tang et al. [6] redesigned the radiator assembly of a single-phase immersion cooling system using topology optimization methodology, which significantly improved the heat dissipation efficiency. Christensen and Alexandersen [7] proposed a gradient-based topology optimization framework for the design of heat sinks embedded in phase change materials (PCM). Based on the variable density method, Palumbo et al. [8] aimed to minimize temperature inhomogeneity and adopted projection technology to reduce the transition region of grayscale units, breaking the limitation that traditional microchannel heat sinks rely on designers’ experience. Yu et al. [9] proposed a co-optimization algorithm to simultaneously optimize the coolant channel morphology and heat source distribution. Calculations show that the topology can significantly temperature. Lu et al. [10] proposed a liquid cooling plate design strategy that combines a multi-layer manifold microchannel architecture and topology optimization, which improves the thermal performance by 18.16% compared to straight-through microchannels; and the pressure drop is 13.48% compared to the microchannel liquid distribution network. Liu et al. [11] designed a heater liquid cooling channel by multi-objective topology optimization, and the optimized flow channel with uniform temperature, average temperature drop over 10°C, and pressure drop comparable to parallel flow channel. Zhang et al. [12] introduced a reduced order model to simplify the physical quantities to state the number of variables, and further reduced the computational scale by using Gauss-Seidel iterative algorithm to achieve a similar configuration to that of a high efficiency heat sink through fewer design variables. Yang et al. [13] used the enhanced heat transfer rate as the objective function, and the pressure drop as the constraint for optimization. The results show that the optimized structure outperforms the design under a variety of operating conditions.
In addition, researchers have improved topology optimization methods from different angles. Yang and Huang [14] imposed boundary control in the objective function and introduced hyperbolic tangent projection to effectively reduce the gray transition region of the optimized design. Sun et al. [15] developed an integrated framework to optimize the cooling channels through topology optimization and proposed a scaling strategy to approximate the high-velocity turbulent heat transfer by adopting a low-speed laminar model. Wang et al. [16] innovatively proposed a multi-objective topology optimization model based on the epsilon constraint algorithm. Jiang et al. [17] compared the thermal performance of four internal runner design schemes at different coolant flow rates through finite element simulation with the objectives of maximizing heat transfer and minimizing flow power consumption. Wei et al. [18] added artificial forces to the Navier-Stokes equations to impose a no-slip boundary condition to achieve the optimal fluid-solid material configuration that minimizes power dissipation. configuration. Zhou et al. [19] optimized the coupled temperature and flow fields of the imitation snowflake heat sink topology to improve the heat transfer efficiency while minimizing the pressure drop. Xu et al. [20] improved the prediction ability of structural boundaries by introducing an improved penalized mean squared error function, thereby enabling more accurate prediction of the topological configurations of heat dissipation structures. Ma et al. [21] proposed a multi-objective topology optimization method for the design of cooling components in precision gear grinding machines. The results showed that the optimized serpentine channel exhibited significantly superior heat transfer capacity compared to the conventional structure, while the pressure drop was reduced by 2–3 times.
Although the above studies have fully demonstrated the potential of topology optimization in microchannel heat dissipation design, through systematic combing, it can be found that there are still the following three obvious gaps in the existing work:
(1) The comparison of import and export layouts is not systematic: most studies only focus on single or two layouts [11,19], and have not systematically compared the four layouts of SISO, SIDO, DISO, and DIDO in the same design domain.
(2) The impact of pressure drop constraints on topological evolution lacks wide-range gradient analysis: most of the previous studies optimize within narrow intervals (such as 10–30 Pa), giving a single optimal configuration [16,18]. The continuous evolution of bifurcation number and level in the 20–60 Pa channel was not revealed.
(3) The two-dimensional optimization results lack three-dimensional verification and comprehensive evaluation: most studies stop at the two-dimensional temperature field and flow field distribution, do not carry out three-dimensional CFD simulation, and rarely use dimensionless indicators such as heat transfer enhancement factor
Based on the above gaps, this paper aims to maximize heat transfer and minimize power dissipation, and optimizes the topology of microchannel radiators with four layouts of 6 mm2 × 8 mm2. Under the constraint of 20–60 Pa (interval 10 Pa), the evolution law of the topological morphology of the flow channels is systematically analyzed, and the temperature and temperature uniformity of different layouts are quantitatively compared. Then, the DIDO layout with the best comprehensive performance is selected, and its two-dimensional configuration is converted into a three-dimensional model. The pressure drop, temperature, Nusselt number and heat transfer enhancement factor are analyzed by comparing with the straight channel with CFD. Note: This paper uses the same inlet flow rate (rather than the same total flow rate or pumping power) for layout comparison, aiming to reveal the impact of layout form on channel evolution and temperature control ability under unit inlet flow rate. Dimensionless indicators such as
The core contribution of this paper is that it is the first time to systematically compare the topology optimization results of SISO, SIDO, DISO, and DIDO in the same design domain, which fills the gap in this research; The quantitative evolution law of bifurcation number and level with increasing pressure drop in the wide pressure drop range of 20–60 Pa is revealed; A joint analysis framework of “two-dimensional topology optimization-three-dimensional CFD verification-comprehensive heat transfer factor evaluation” is established, which provides a reusable square and engineering reference for the high-efficiency and low-resistance design of microchannel radiators.
2 Topology Optimization Modeling and Heat Transfer Characteristic Research Method of Microchannel Heat Sink
In this chapter, topology optimization is carried out for the two-dimensional fluid-solid conjugate heat transfer model. The design domain is equivalent to porous media, and the boundary is set as adiabatic and non-slip [22,23]. For solving complexity, the following assumptions are made: (1) Two-dimensional steady-state incompressible laminar flow; (2) Introduce the design variable
At this time, the inertia effect can be ignored, and the two-dimensional steady-state model can reasonably capture the topological evolution trend of the flow channel. Ignoring the influence of temperature on physical properties (viscosity thermal conductivity) will lead to quantitative deviation but simplify the calculation and ensure that the relative ranking of structural optimization is effective. The Brinkman penalty model can accurately characterize the equivalent flow resistance of porous media and is suitable for topological iteration. The overall hypothesis has full applicability in comparing the heat transfer performance of different layouts and the evolution law of flow channels.
2.1 Topological Method Parameter Setting and Governing Equation
Conservation equation
Momentum conservation equation
In the formula,
Volumetric force
Energy equation
Fluid heat transfer
Solid heat transfer
In the formula,
The heat-producing coefficient
The objective function of heat transfer enhancement is defined as follows:
Set the minimum average temperature
Heat exchanger design needs to take into account both heat transfer performance and flow performance [24]: the former takes the bottom average temperature
In order to ensure the manufacturability of the microchannel topology optimization results, the volume ratio
2.2 Topological Structure Material Interpolation
The liquid material in this paper is water, and the solid material is steel. The specific parameters are shown in Table 1.

A penalty parameter
In the above formulas, the penalty parameter
Taking SISO as an example, Fig. 1a is topologically inadequate; Fig. 1b shows the edge burr phenomenon; Fig. 1c is a gray-scale unit phenomenon.
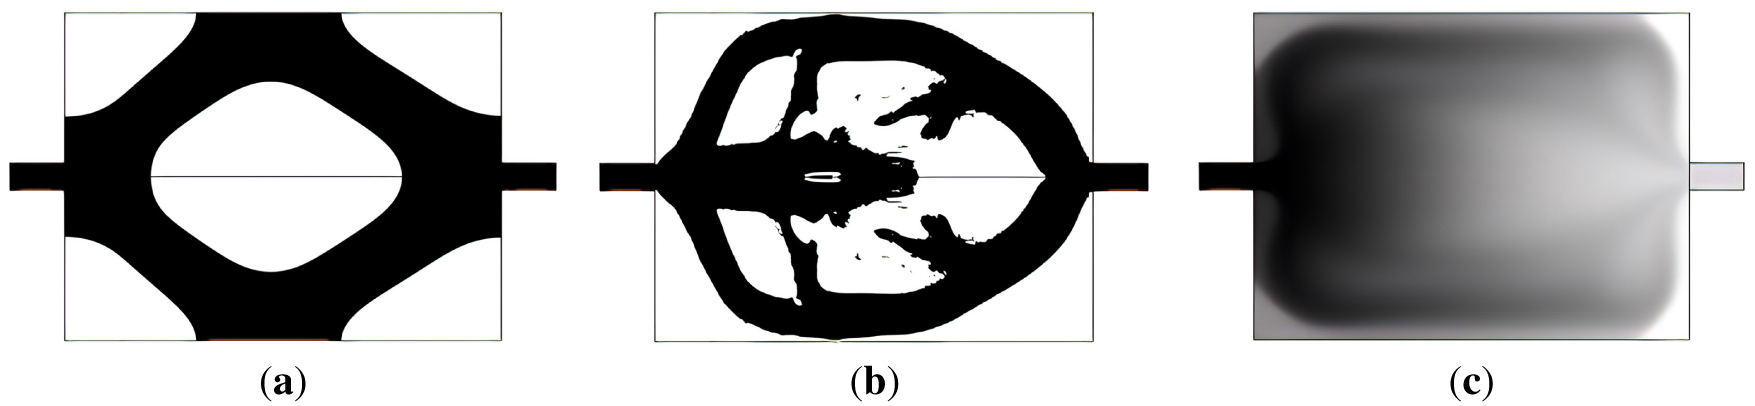
Figure 1: Topology failure case. (a) Topologically inadequate. (b) Edge burr phenomenon. (c) Gray level unit.
2.3 Two-Dimensional Geometric Model of Microchannel Heat Sink
In order to systematically study the influence of inlet and outlet layout on the flow and heat transfer performance of microchannel radiators, the three-dimensional fluid-solid conjugate heat transfer problem is simplified into a two-dimensional plane model. The design domain is rectangular, and the geometric parameters are shown in Table 2: length L1 = 8 mm, width L2 = 6 mm, inlet and outlet channel width L3 = 0.5 mm, length L4 = 1.0 mm, and the subsequent 3D modeling reference height is given (heat exchanger height 0.7 mm, inlet and outlet height 0.5 mm). The two-dimensional model only considers the channel layout in the x-y plane.

Fig. 2 shows two-dimensional design domain models for four different layouts, defined as: Fig. 2a SISO: single entry (left boundary center), single exit (right boundary center); Fig. 2b DISO: double entry (left boundary symmetrical), single exit (right boundary center); Fig. 2c SIDO: single entry (left boundary center), double exit (right boundary symmetric); Fig. 2d DIDO: double entry (left boundary symmetry), double exit (right boundary symmetry).
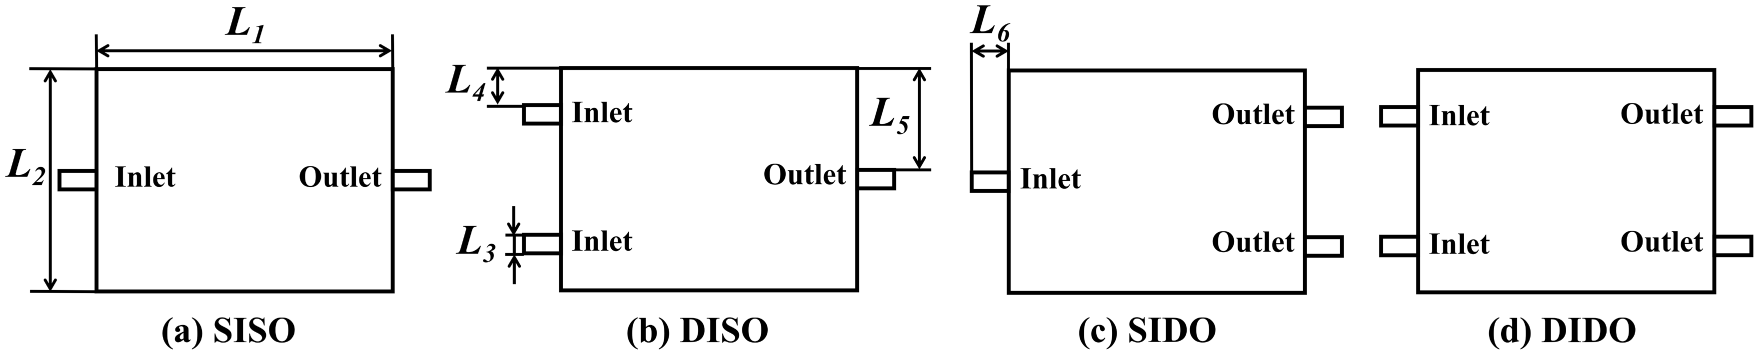
Figure 2: Two-dimensional geometry of microchannel heat sink.
All inlet and outlet channels are 0.5 mm wide and 1.0 mm long to ensure uniform flow in and out of the design area. The interior of the design domain is the fluid-structure coupling region to be optimized, and the optimal flow channel configuration is generated through topology optimization. The two-dimensional design domain provides a unified geometric constraint. By comparing the four layouts, the influence of the number of inlets and outlets on the optimized flow channel structure and heat transfer performance can be systematically revealed.
2.4 Parameters and Independence Verification of Surface Mesh
The two-dimensional model surface mesh parameters are shown in Table 3. (taking the SISO-case3 structure as an example).

In order to ensure the reliability of the numerical results, the two-dimensional surface mesh independence verification is carried out. Four sets of grids with different scales are selected to calculate the temperature difference between inlet and outlet.
As shown in Table 4, with the number of grids, the temperature difference between inlet and outlet gradually tends to be stable. When the number of grids is reduced from 1.4212 × 10⁴ to 1.96 × 10⁴, the change of temperature difference is only 0.6% (less than 1%), which can be considered as grid independence. Therefore, the subsequent calculation uses 1.96 × 10⁴ grids (because the graph is relatively regular, there are a large number of integer ten grids).

2.5 Topology Optimization Solution Method
In this simulation, the MMA solver [28,29] (movement limit 0.1, convergence tolerance 10−4) is used, which has high convergence efficiency and fast approximates the 0–1 discrete optimal solution with convex approximation iteration; It has strong ability to deal with constraints, adapts to the optimization of coupled flow-thermal fields, and has good numerical stability, which is suitable for large-scale grid model calculations. The two-dimensional model in this section is a pressure inlet and outlet, which is convenient for setting different constraint pressure drops. In this paper, the inlet temperature is uniformly set to 293.15 K. The process is as follows (taking the SISO layout as an example):
Fig. 3 shows the topological evolution process of the SISO structure with different iterative steps, Fig. 3a is the initial state flow channel; Fig. 3b is the topological flow channel at step 20; Fig. 3c is the topological channel at step 40; Fig. 3d is the topological flow channel at step 60; Fig. 3e is the topological flow channel at step 80; Fig. 3f is the final topological channel. The initial state is all empty; At 20 steps, the solid-liquid separation, the main channel appears; After 40 steps, the main channel is basically clear; The final topology is obtained at 100 steps. (After the topological flow channel is clear and almost unchanged and stops the iteration, the maximum iteration is 100 steps).

Figure 3: Iterative process of topology optimization.
In order to avoid the mesh dependence and gray cell phenomenon in topology optimization, this study uses density filtering technology to solve the stable and clear topological structure of Helmholtz partial differential equations [30]. The formula is as follows:
where
2.6 Modeling and Solving Method of Heat Transfer Characteristics of Microchannel Heat Sink
In order to evaluate the flow and heat transfer performance of microchannels, several dimensionless characteristic quantities and analytical parameters are introduced to carry out quantitative evaluation. Among them, the straight microchannel hydraulic diameter at the inlet of the microchannel:
Topological Channel Hydraulic Diameter:
where
The formula for calculating the pressure drop at the inlet and outlet of the microchannel is:
The formula for calculating the pumping power is:
In the formula,
Formula for coefficients:
The formula for calculating the total thermal resistance of microchannels:
where
Convective heat transfer coefficient formula:
In the equation,
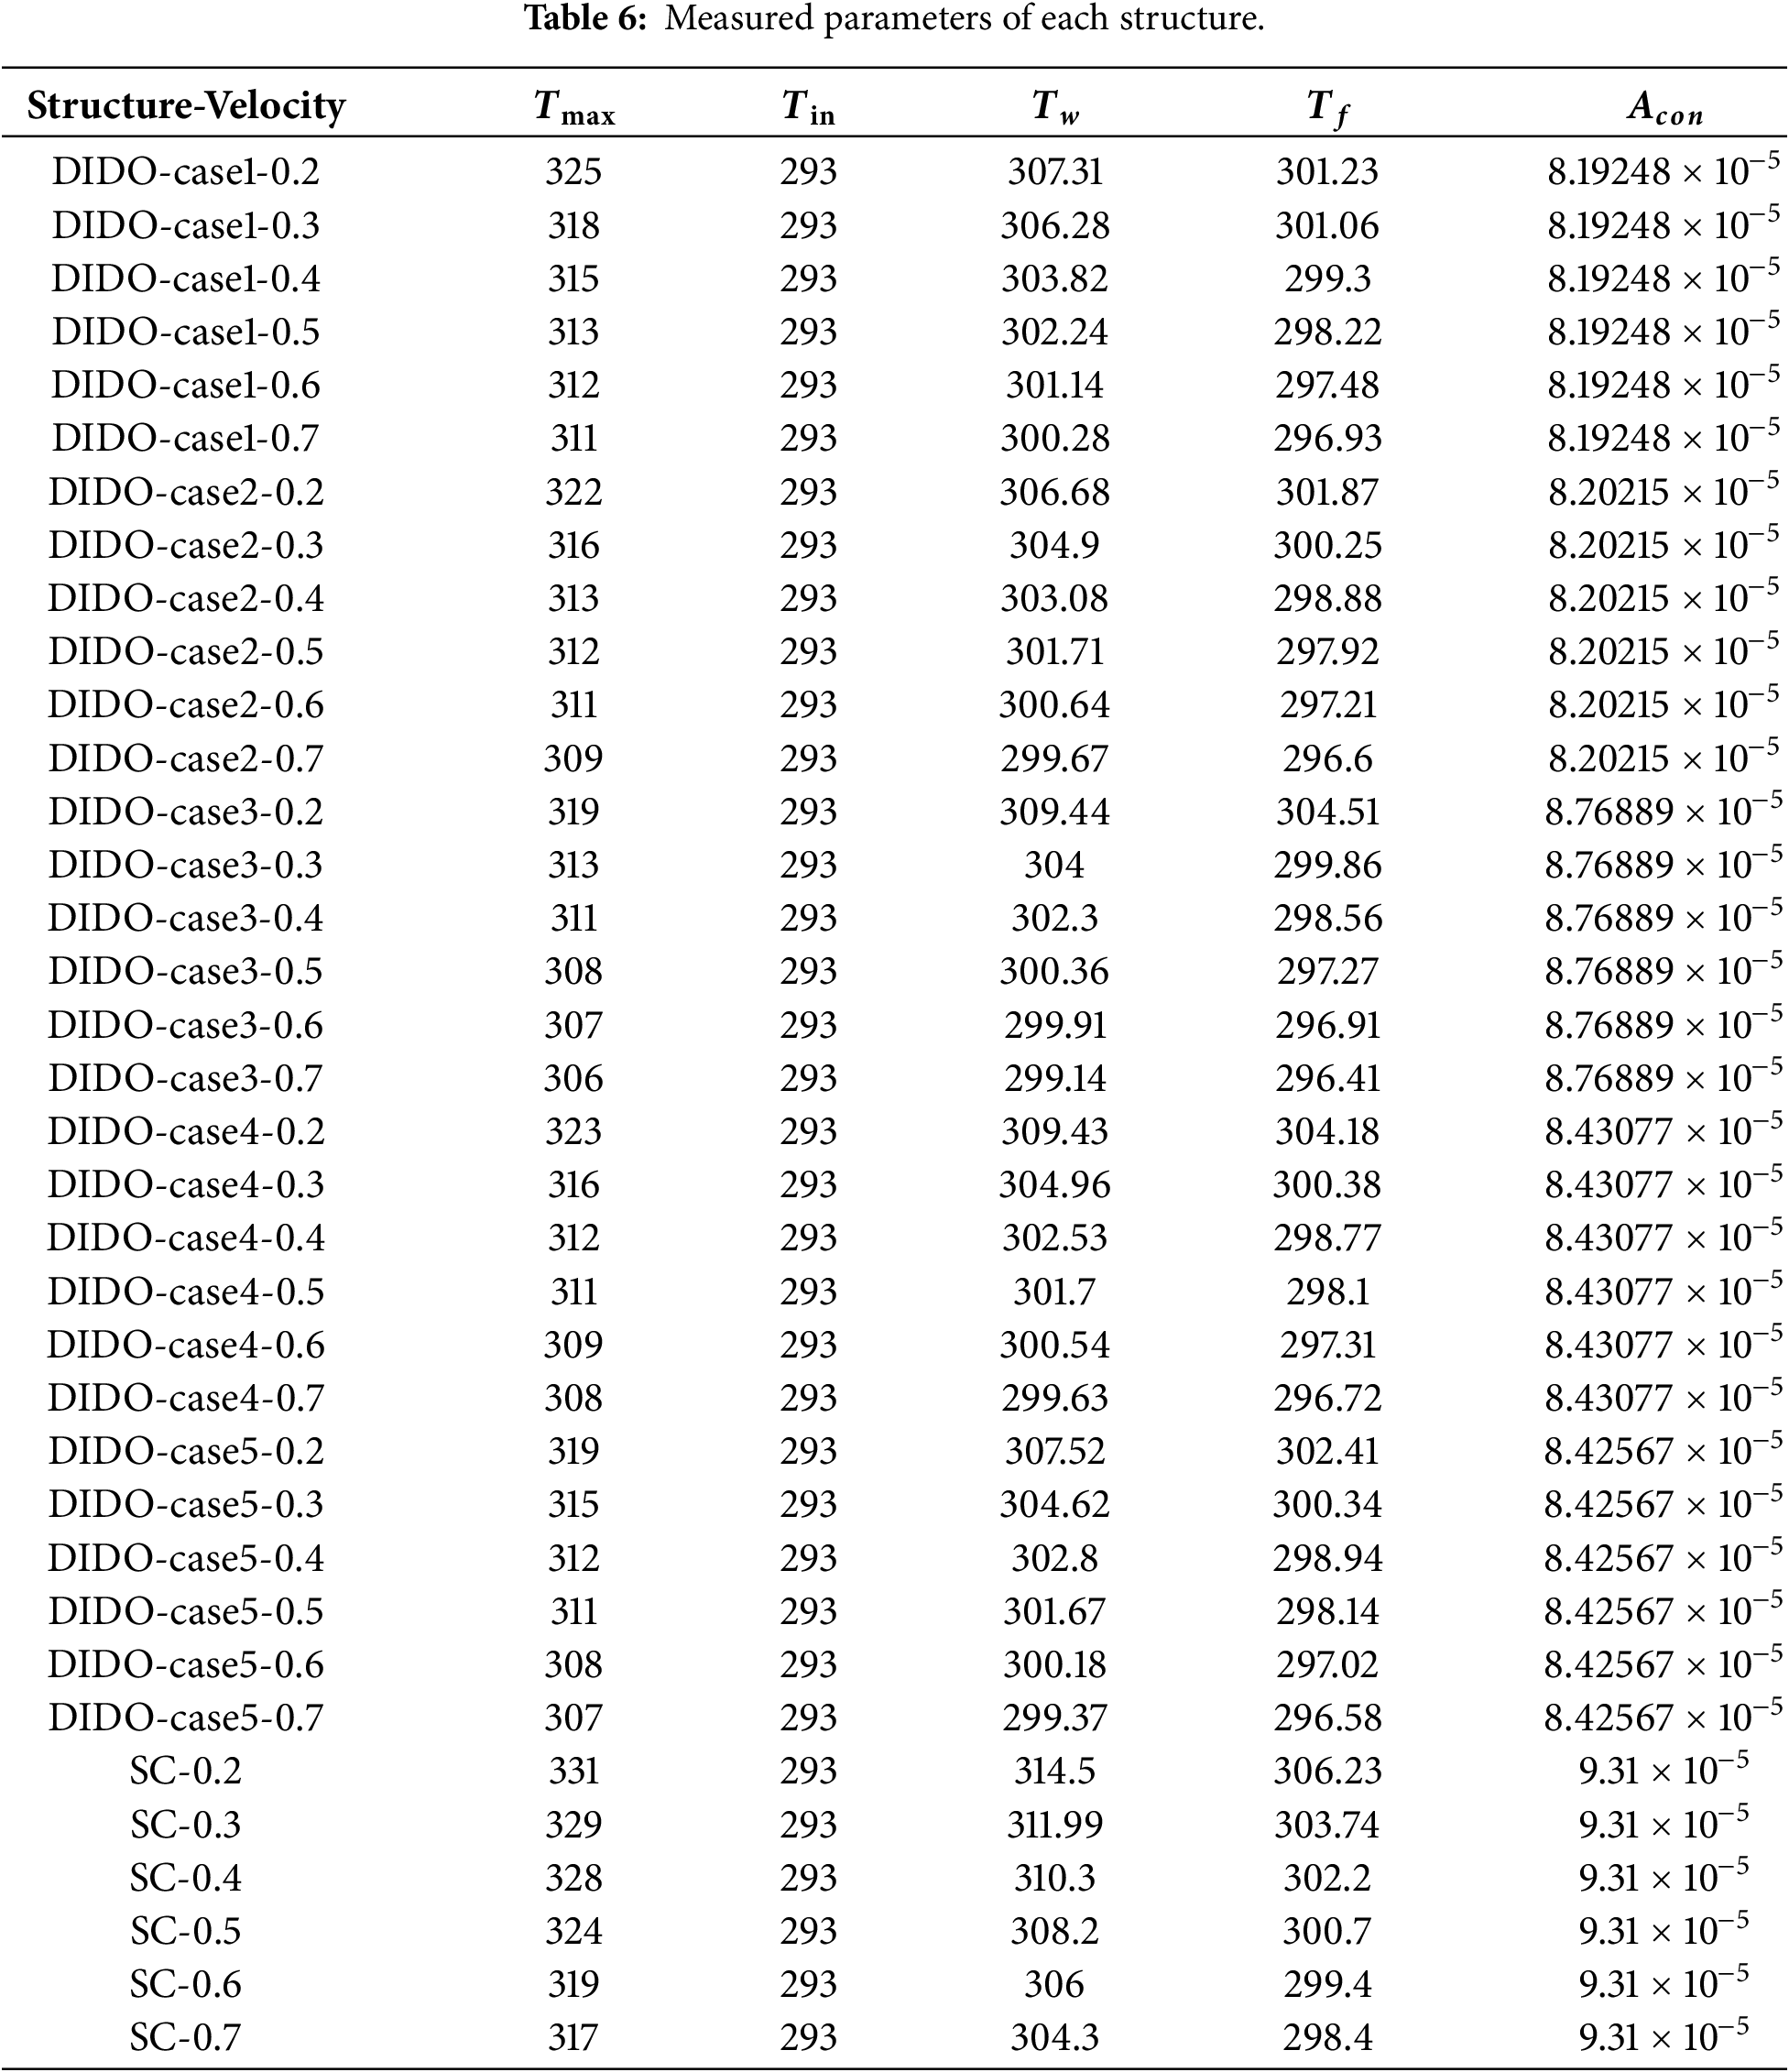
The formula for calculating the average Nusselt number:
In order to further compare and analyze the flow and heat transfer characteristics of microchannel heat sinks with different structures, the heat transfer enhancement factor
3.1 Analysis of Geometrical Topology Results of Microchannel Heat Sink
To investigate the impact of voltage drop on the topology, topology optimization was performed for four layouts at 20–60 Pa (10 Pa apart), and the results are summarized in Fig. 4. The rows in the Fig. 4 are SISO, DISO, SIDO, and DIDO from top to bottom, and the corresponding pressure drop from left to right in each column increases from 20 to 60 Pa.
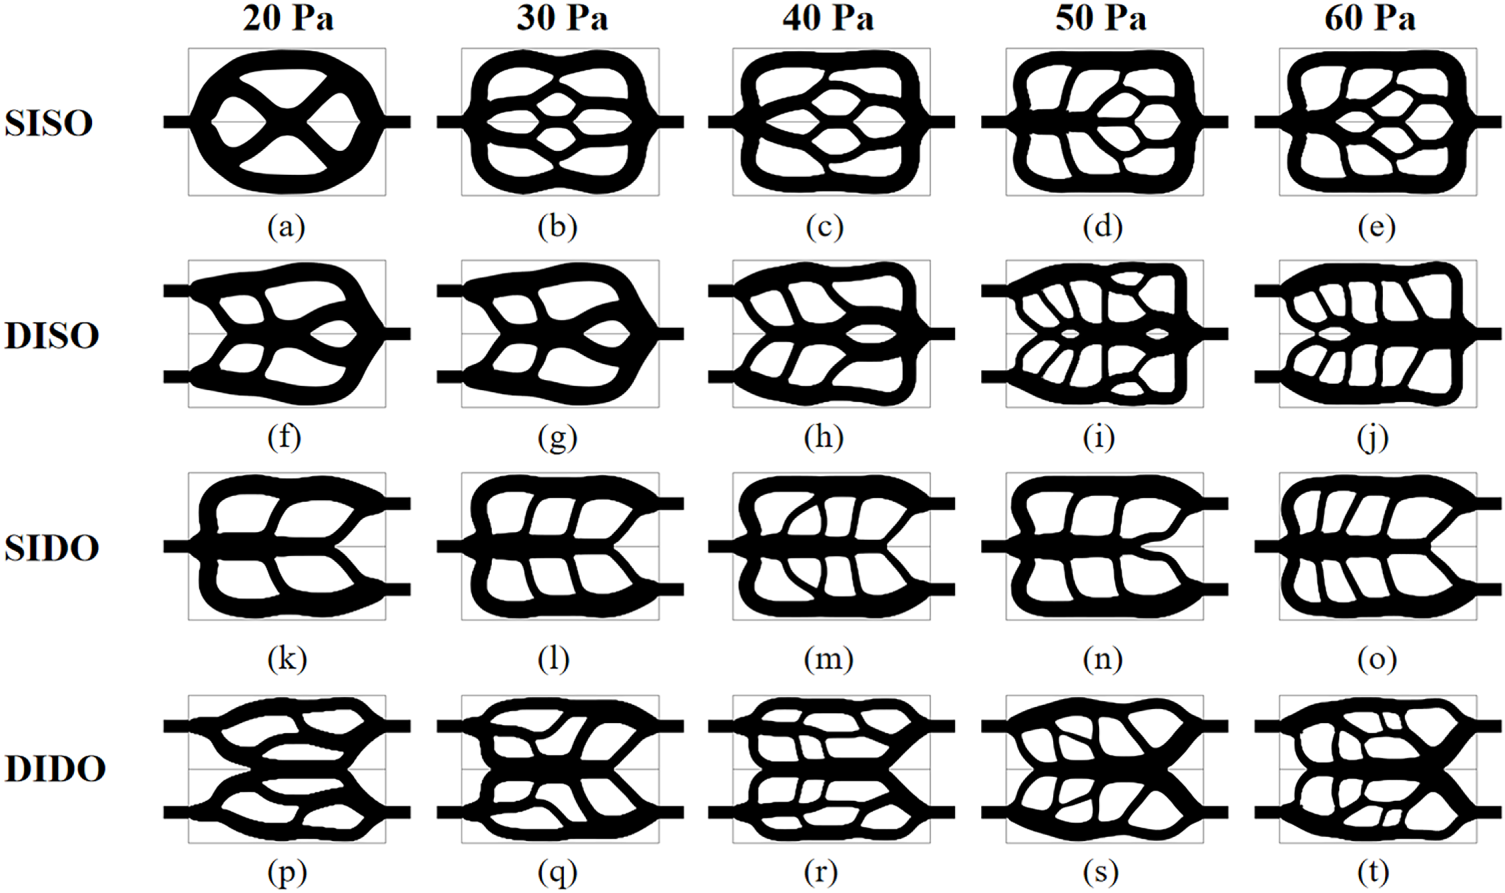
Figure 4: Topological flow channels with different structures.
Fig. 4 shows topological runners of different layouts, Fig. 4a topological runners of the SISO structure under 20 Pa constraints; Fig. 4b a topological flow channel of the SISO structure under a 30 Pa constraint; Fig. 4c a topological flow channel of the SISO structure under 40 Pa constraints; Fig. 4d a topological flow channel of the SISO structure under a 50 Pa constraint; Fig. 4e a topological flow channel of the SISO structure under a 60 Pa constraint; Fig. 4f a topological flow channel of the DISO structure under a 20 Pa constraint; Fig. 4g a topological flow channel of the DISO structure under a 30 Pa constraint; Fig. 4h a topological flow channel of the DISO structure under 40 Pa constraints; Fig. 4i a topological flow channel for the DISO structure under a 50 Pa constraint; Fig. 4j a topological flow channel of the DISO structure under a 60 Pa constraint; Fig. 4k is the topological flow channel of the SIDO structure under the constraint of 20 Pa; Fig. 4l is the topological flow channel of the SIDO structure under the constraint of 30 Pa; Fig. 4m is the topological flow channel of the SIDO structure under the constraint of 40 Pa; Fig. 4n is a topological flow channel of the SIDO structure under a 50 Pa constraint; Fig. 4o is a topological flow channel of the SIDO structure under the constraint of 60 Pa; Fig. 4p is the topological flow channel of the DIDO structure under the 20 Pa constraint; Fig. 4q is the topological flow channel of the DIDO structure under the constraint of 30 Pa; Fig. 4r is the topological flow channel of the DIDO structure under the constraint of 40 Pa; Fig. 4s is the topological flow channel of the DIDO structure under the constraint of 50 Pa; Fig. 4t is the topological channel of the DIDO structure under the constraint of 60 Pa. With the increase of pressure drop, the number of flow channels, bifurcation level and spatial density are significant. This phenomenon is that the objective function aims to minimize the weighted combination between fluid power dissipation and the average temperature of the heat sink, and the pressure drop constraint directly limits the energy required for the fluid to pass through the design domain. At low pressure drop (20 Pa), the algorithm tends to generate a few main flow channels for resistance, but it is difficult to effectively cover the heat source, resulting in local heat accumulation; When the pressure rises to 40–60 Pa, the topological flow channels show obvious changes. The number of flow channels increases, the bifurcation level expands, and the heat transfer area between the fluid and the solid wall increases accordingly. At the same time, the flow coverage in the heat source area is more uniform. This shows that the pressure drop, as a design constraint, has a significant regulatory effect on the final configuration of the topological channel.
Fig. 5 is a temperature cloud diagram of the SISO structure, and Fig. 5a is a temperature distribution diagram of the SISO structure at a pressure drop of 20 Pa; Fig. 5b a temperature profile of the SISO structure at a pressure drop of 30 Pa; Fig. 5c a temperature profile of the SISO structure at a pressure drop of 40 Pa; Fig. 5d a temperature profile of the SISO structure at a pressure drop of 50 Pa; Fig. 5e is a temperature profile of the SISO structure at a pressure drop of 60 Pa. The temperature distributions under different constraints are shown. When the pressure drop rises from 20 to 60 Pa, the temperature distribution of the flow channel shows a regular evolution: the temperature drops from 334 to 307 K, with a decrease of 27 K; The high temperature area is significantly reduced, the temperature gradient tends to be flat, and the overall uniformity is significantly improved. Under the low pressure (20 Pa) condition, there is a large area of concentrated high temperature area on the heating surface, and the heat accumulation is serious. When the pressure drop reaches 60 Pa, the temperature distribution on the heating surface is more uniform, and there is no obvious hot spot. Constrained pressure drop lifting drives the flow rate and flow rate of the fluid to increase, and strengthens the convective heat transfer intensity, so that the heat is carried out of the heating domain more efficiently; At the same time, topology optimization under high pressure generates more fine branch channels, which expands the heat transfer area between fluid and solid, and further improves heat dissipation capacity.
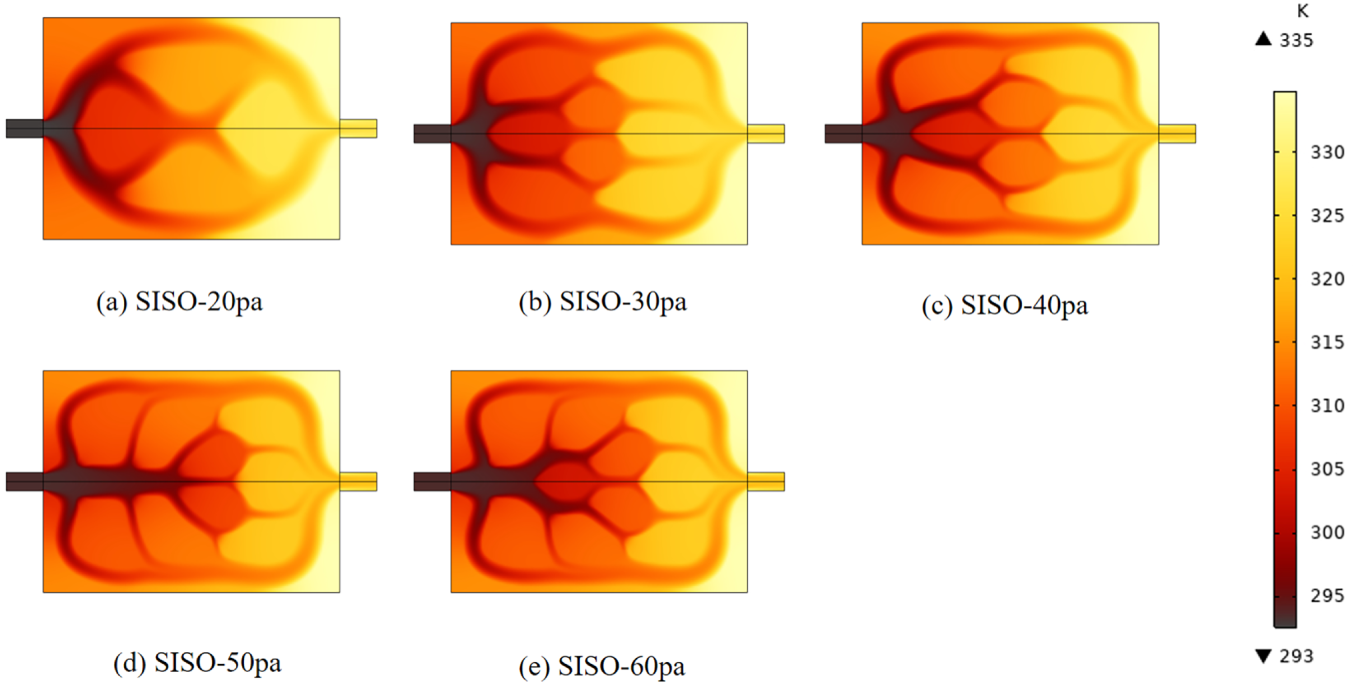
Figure 5: Topological temperature cloud diagram of SISO structure under different constrained pressure drops.
Fig. 6 shows the variation of microchannel heat sink temperature with constrained pressure drop. (The two-dimensional model in COMSOL is not a pseudo-model, and the temperature can only be used for comparison.) With the increase of pressure drop, the temperature of each model shows a downward trend. In addition, there are significant differences in heat dissipation performance between different layouts, and with the increase in the number of entrances and exits, the temperature drop is more obvious. Among them, the DIDO structure shows the best heat dissipation effect under various pressure drop conditions. The reason is that the increase in the number of entrances and exits changes the flow distribution of the flow channel network. Taking SISO as an example, all the cooling medium needs to flow in through a single inlet, and the flow rate of the fluid at the end of the flow channel is easy to form a local stagnation area, resulting in heat accumulation. In the DISO layout, the cooling medium flows in from both sides at the same time, forming a symmetrical shunt inside the heat sink, and then passes through two outlets. This layout directly increases the total inlet flow rate, so that more cooling media participate in the heat transfer process. In addition, symmetrical shunt makes the flow distribution more uniform in the flow channel network, avoiding the appearance of heat transfer dead zone. Under the action of the above mechanism, the DIDO structure can make full use of the heat transfer potential of the cooling medium, which shows the significant advantages of the multi-inlet and multi-outlet layout in enhancing heat dissipation.
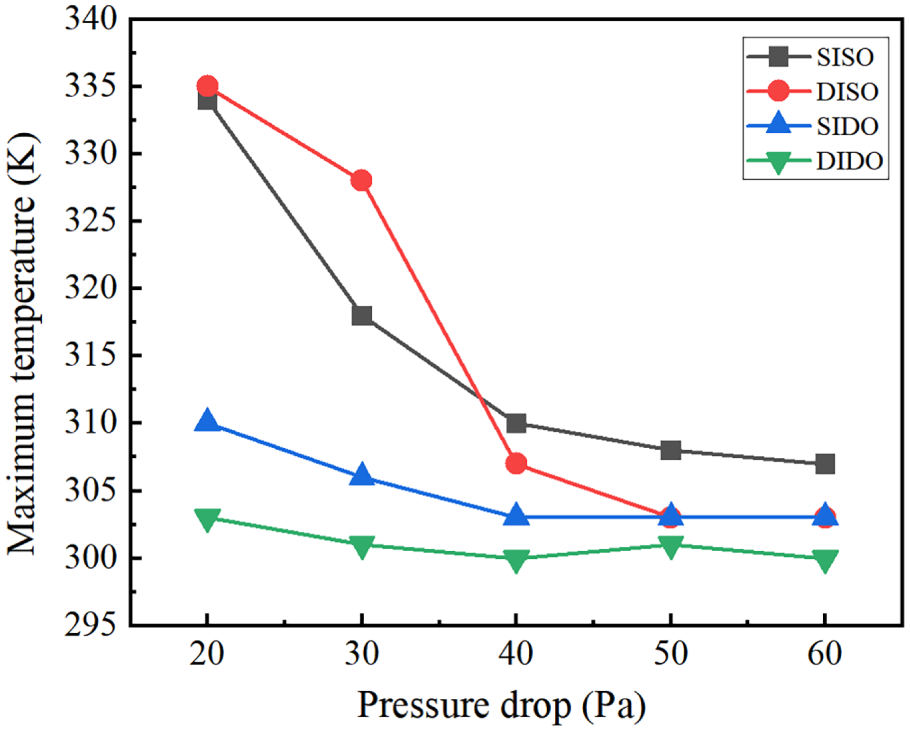
Figure 6: Variation of microchannel heat sink temperature with confined pressure drop.
3.2 DIDO Topology under Different Pressure Drop Conditions
In order to verify the heat dissipation effect of different structural layouts, this chapter simulates the three-dimensional model and makes the following assumptions: (1) Solid thermal conductivity is not affected by material batch and temperature; (2) The thermal conductivity and viscosity of the fluid are not affected by temperature and purity; (3) The heat source power is constant; (4) The inlet flow rate is not affected by pump fluctuations. The main potential errors include: the pressure drop is too high: the viscosity of water increases with the increase of temperature, and the constant inlet viscosity will increase the simulated pressure drop; The heat transfer coefficient is underestimated: the viscosity decrease in the real high temperature region is conducive to convection, and the Nusselt number will be underestimated in the constant physical property model; Flow distribution bias: Ignoring heat-flow coupling in multi-inlet layouts may overestimate flow symmetry. The above errors do not affect the qualitative law, but will change the quantitative prediction accuracy. The purpose of this paper is to explore the topological evolution of flow channel layouts. The results are mainly used for the relative performance ranking among different layouts (SISO/DIDO, etc.), but not for the accurate prediction of absolute temperature values.
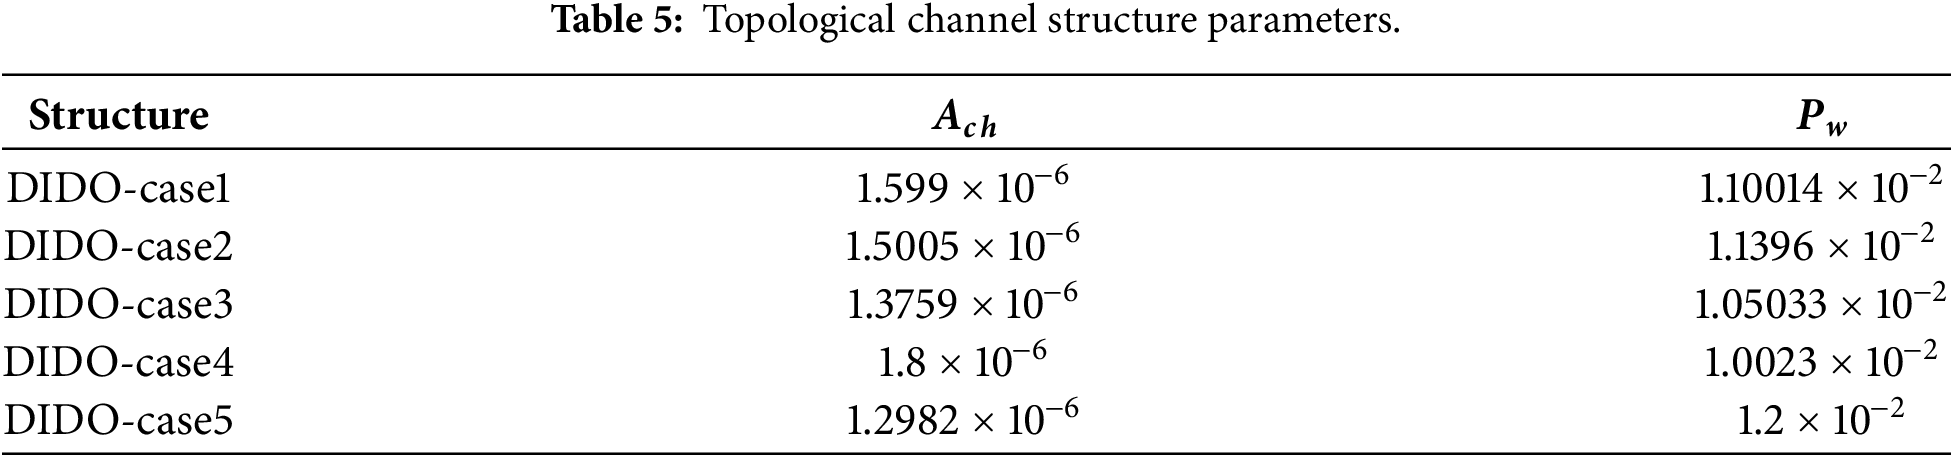
The simulation model is constructed based on CFD, the height of the model is 0.7 mm, the height of the entrance and exit is 0.5 mm; In the following, the topology optimization of DIDO heat sink structure under different constrained pressure drops is studied, where the pressure drops are 20 Pa (DIDO-case1), 30 Pa (DIDO-case2), 40 Pa (DIDO-case3), 50 Pa (DIDO-case4) and 60 Pa (DIDO-case5), and the straight channel is introduced for comparison.
As shown in Fig. 7, Fig. 7a is a three-dimensional structure diagram of DIDO-case1; Fig. 7b is a DIDO-case2 three-dimensional structure map; Fig. 7c is a DIDO-case3 three-dimensional structure diagram; Fig. 7d is a DIDO-case4 three-dimensional structure map; Fig. 7e is a DIDO-case5 three-dimensional structure map; Fig. 7f 3-D structure diagram of SC. Under the low pressure constraint condition, the size of the main channel is larger and the number of branches is smaller; With the pressure drop, the diameter of the main channel decreases relatively, and the number of branches increases accordingly. In addition, the flow domain volume of the straight channel as a control is almost the same as that of the topologically optimized channel.
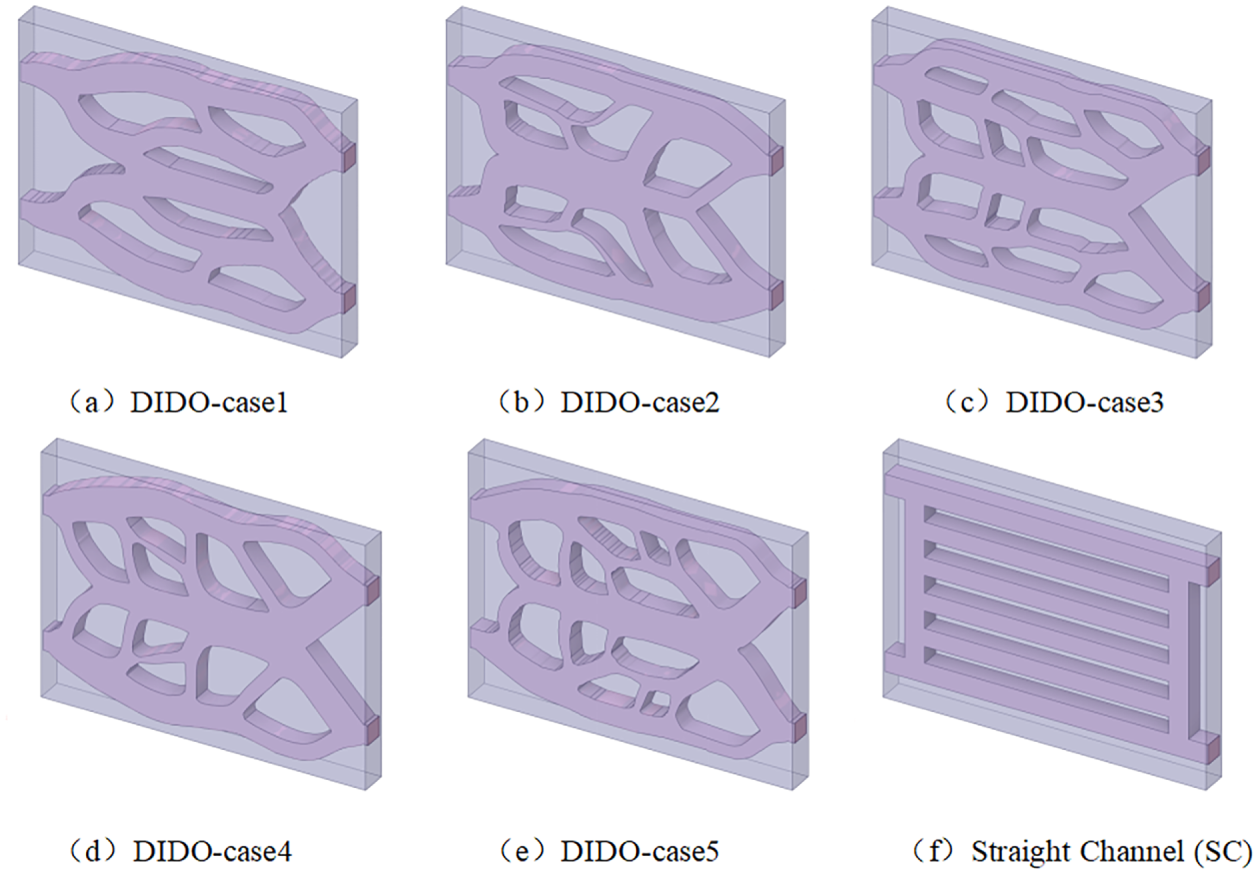
Figure 7: DIDO heat sink topology and straight channel structure under different constrained pressure drops.
3.3 Volume Grid Independence Verification
Grid independence verification is the key to ensure the reliability of CFD results. Taking DIDO-case1 as an example, Table 7 compares the inlet and outlet temperature difference and pressure drop at 0.2 m/s for 4 sets of grid numbers.
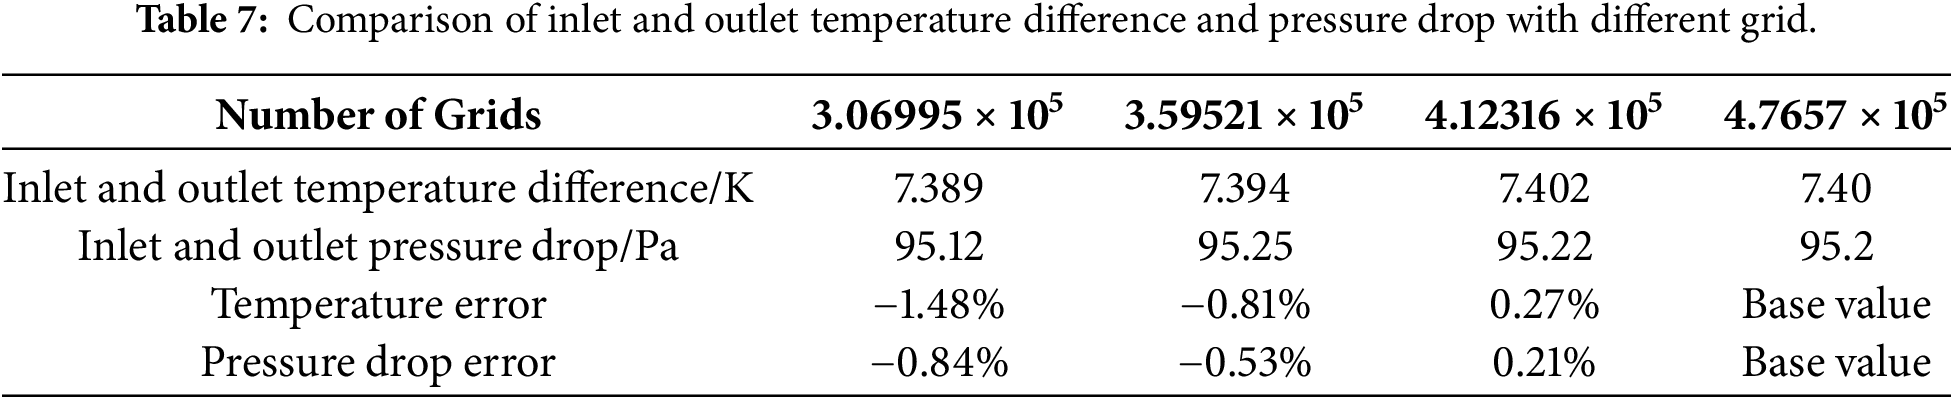
The number of grids was 3.07 × 10⁵, 3.6 × 10⁵, 4.12 × 10⁵, 4.77 × 10⁵, respectively. With the increase of the number, the temperature difference and pressure drop in the numerical simulation tend to be stable. When the number of grids increases from 4.12 × 10⁵ to 4.77 × 10⁵, the temperature difference and pressure drop change 0.27% and 0.21%, respectively, and are lower than 1%. It is considered that the number of grids in this study is required for grids.
In order to evaluate the influence of input parameter fluctuations on heat transfer performance, the convective heat transfer coefficient
A sensitivity coefficient
where
Table 8 takes the DIDO-case3 structure as an example. It can be seen that among the three parameters analyzed, the sensitivity coefficient of the inlet flow rate (0.82) shows that the convective heat transfer performance has the most fluctuation in the flow rate. This result accords with the basic physical law of convective heat transfer: the flow velocity directly affects the thickness of the boundary layer and the intensity of the fluid disturbance, and then significantly changes the wall heat transfer capacity. A 10% flow rate can increase

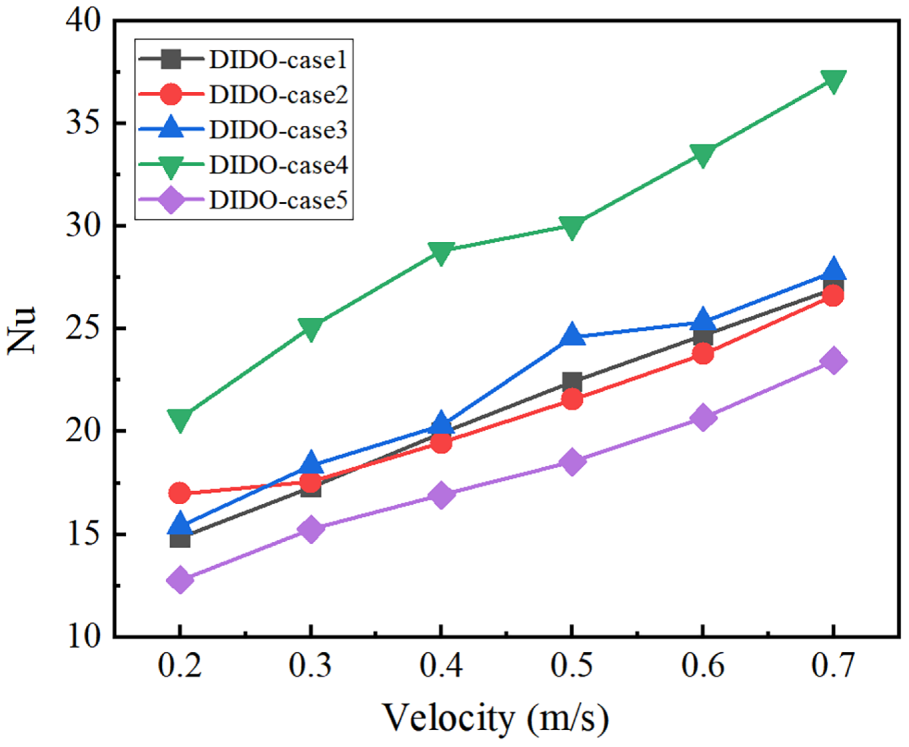
Figure 8: Nu curve of microchannel heat sink.
Taken together, the DIDO-case3 configuration can maintain stable heat transfer performance within a reasonable range of parameter fluctuations. However, considering the high sensitivity of the inlet flow rate, in the design and control of the actual thermal management system, priority should be given to ensuring the stability of the flow supply to ensure that the radiator works in a high-efficiency range.
3.5 Validation of Numerical Methods
Considering that the three-dimensional effect has a certain impact on the conclusions of this study, but not a decisive impact. The two-dimensional model is responsible for structural optimization, and the three-dimensional model is responsible for performance verification, so the three-dimensional effect will not mislead the direction of topology optimization, but will affect the absolute value output by the two-dimensional model alone. Therefore, in order to further verify the effectiveness of the numerical model, the rectangular microchannel heat sink model studied in literature [33] is established, and its geometric parameters and working conditions are consistent with those in literature. The numerical simulation results of the temperature and pressure drop of the microchannel heat sink are compared with the literature results, as shown in Fig. 9.
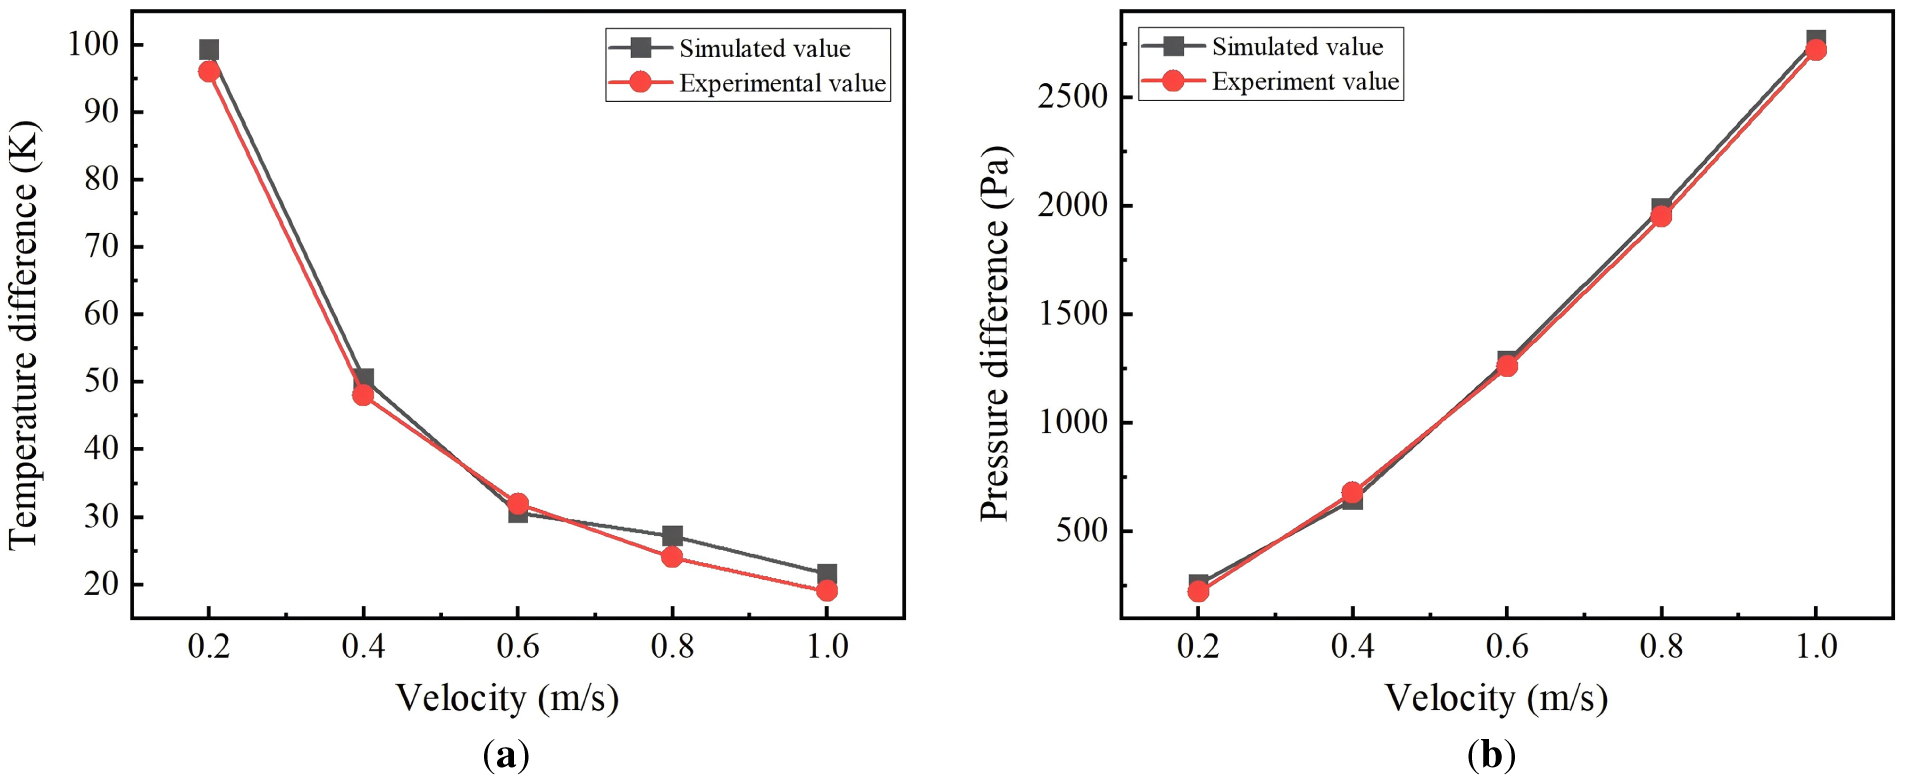
Figure 9: Comparison between numerical simulation and literature results. (a) Comparison of measurement and simulation of inlet-outlet temperature difference. (b) Comparison of measurement and simulation of inlet-outlet pressure difference.
Fig. 9a shows the comparison between the measured and simulated inlet-outlet temperature difference, and Fig. 9b shows the comparison between the measured and simulated inlet-outlet pressure difference. When the flow velocity increases from 0.2 to 1.0 m/s, the experimentally measured temperature difference significantly decreases from 96 to 19 K, while the simulated temperature difference drops from 99 to 21 K. Overall, the experimental temperature values are slightly lower than the simulated results, with a maximum relative deviation of approximately 3.0% between the two. Meanwhile, as the flow velocity increases, the experimental pressure drop rises from 220 to 2720 Pa, and the simulated pressure drop increases from 258 to 2765 Pa. The experimental and simulated pressure drop data are generally comparable, showing consistent trends, with the maximum relative error controlled within 5%.
The deviation is due to factors such as the loss along the experimental pipeline and measurement errors, which fully verifies the accuracy of the numerical model to predict the flow characteristics, and provides a reliable basis for subsequent CFD simulation.
3.6 Comparative Analysis of Heat Transfer
In order to comprehensively evaluate the flow and heat transfer performance of different topological optimization structures, CFD simulations of multiple topological microchannel models under the inlet flow velocity of 0.2–0.7 m/s are carried out in this paper, and the straight channel is compared. In order to visually present the distribution of the flow field and temperature field, the parameters such as temperature, pressure drop, and velocity trace are compared respectively (the following temperatures are three-dimensional simulation results).
Fig. 10a is a pictorial temperature cloud diagram of the DIDO-case1 structure at a flow rate of 0.4 m/s; Fig. 10b a pictorial temperature cloud map of the DIDO-case2 structure at a flow rate of 0.4 m/s; Fig. 10c a pictorial temperature cloud map of the DIDO-case3 structure at a flow rate of 0.4 m/s; Fig. 10d a pictorial temperature cloud map of the DIDO-case4 structure at a flow rate of 0.4 m/s; Fig. 10e a pictorial temperature cloud map of the DIDO-case5 structure at a flow rate of 0.4 m/s; Fig. 10f Picture temperature cloud map of the SC structure at a flow rate of 0.4 m/s. It can be seen that the temperature around the flow channel has dropped significantly, and the heat dissipation effect has improved significantly when the number of branches increases. The temperature of the topological channel is significantly lower than that of the parallel channel (328 K), and the temperature distribution is more uniform. The high temperature area is only concentrated in the outlet part, and there is no large-scale continuous high temperature zone; There is a temperature gradient rising along the flow direction in the parallel channel, and an obvious high temperature core area is formed at the outlet. The topology optimization flow channel expands the heat transfer area between the fluid and the solid by generating a tree-like branch structure. At the same time, the tortuous arrangement of the flow channel enhances the fluid disturbance, improves the convective heat transfer intensity, and enables the heat to be carried out of the heating domain more efficiently. Effectively suppress temperature gradients to achieve better temperature uniformity. The parallel flow channel is limited by the straight structure, the fluid disturbance is weak, the heat transfer area is limited, and the heat accumulation along the flow direction leads to a sharp increase in the temperature at the outlet, resulting in local overheating.
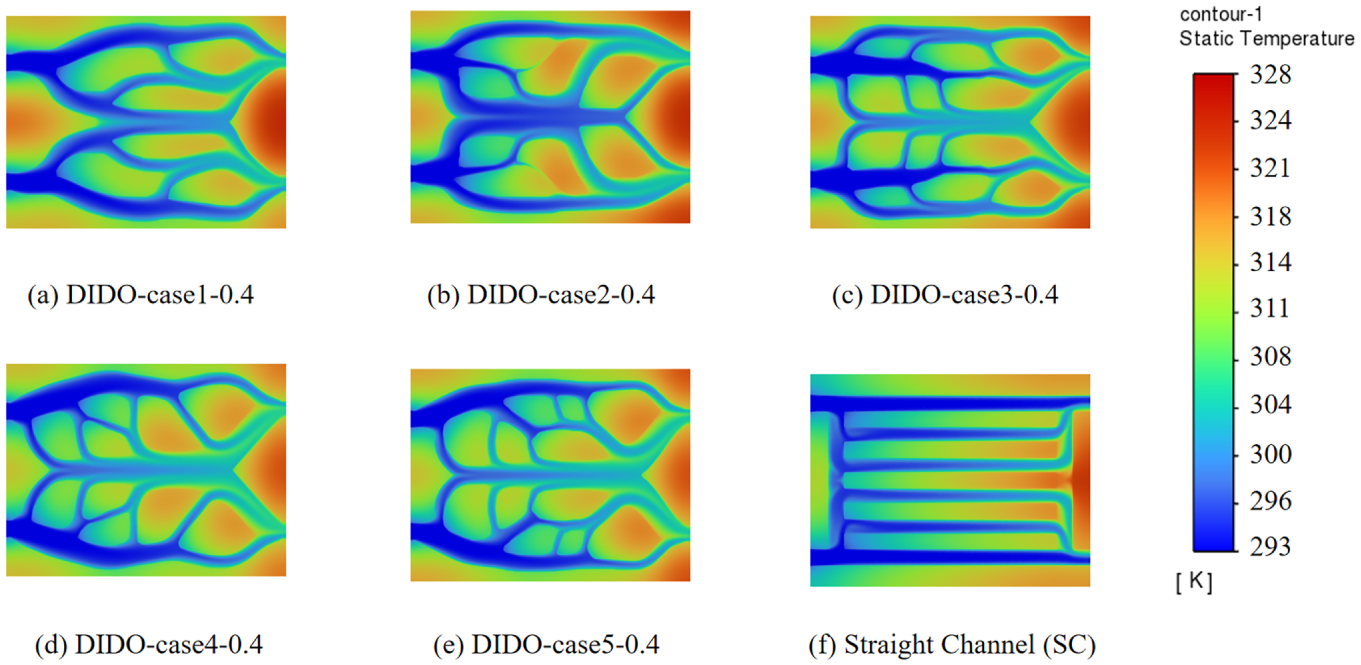
Figure 10: Temperature distribution of DIDO heat sink topology under different pressure drops.
Fig. 11 is the change curve of DIDO heat sink topology temperature with flow velocity under different pressure drops. The temperature of each topology optimization model and straight channel model shows a linear downward trend with the increase of inlet flow velocity, and the cooling range of topology optimization model is significantly better than that of straight channel. Under the same flow rate, the temperature of the straight channel is always, reaching 331 K at 0.2 m/s, and maintaining at 317 K at 0.7 m/s. The temperature of the topology optimization model is obviously lower, and gradually with the increase of the confinement pressure, DIDO-case3 performs the best, and the temperature drops to 306 K at the flow rate of 0.7 m/s.
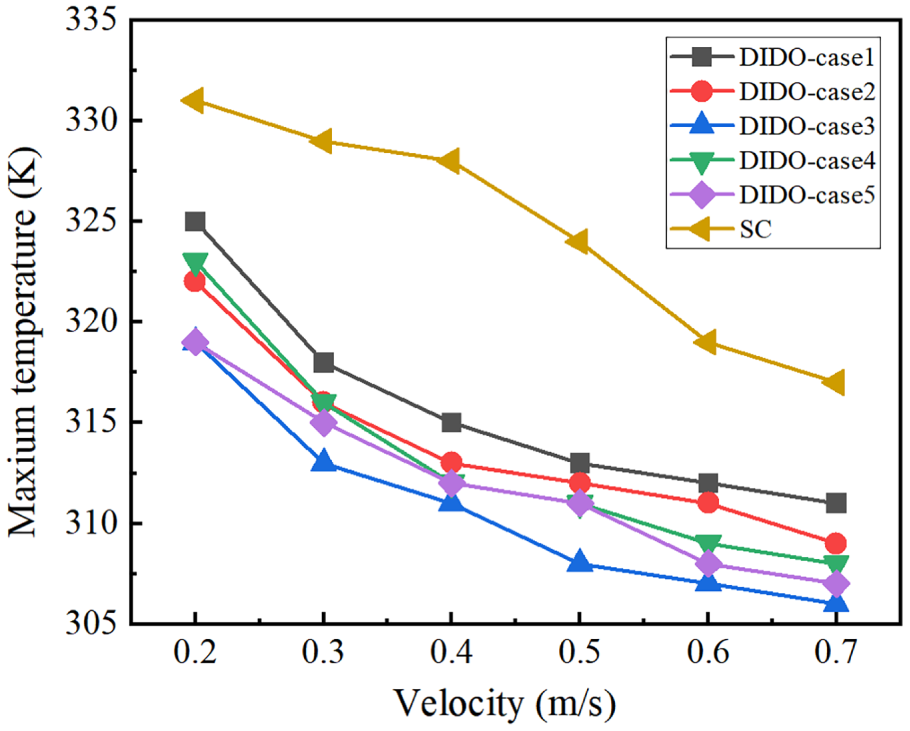
Figure 11: Variation of topological temperature of DIDO heat sink with velocity at different pressure drops.
Fig. 12 is the relationship curve between the weighted average temperature and the flow rate under different constrained pressure drops. In the figure, the weighted average temperature decreases with the increase of the flow rate under each working condition, and the decrease is more significant in the low flow rate range (0.2~0.4 m/s). The SC (straight channel) model is about 318 K when the flow rate is 0.2 m/s, and it decreases to about 308 K when the flow rate is 0.7 m/s, so the heat dissipation efficiency is low. The weighted average temperature of the topology optimization model is obviously lower, and gradually decreases to 302.8 K with the increase of the constrained pressure drop.
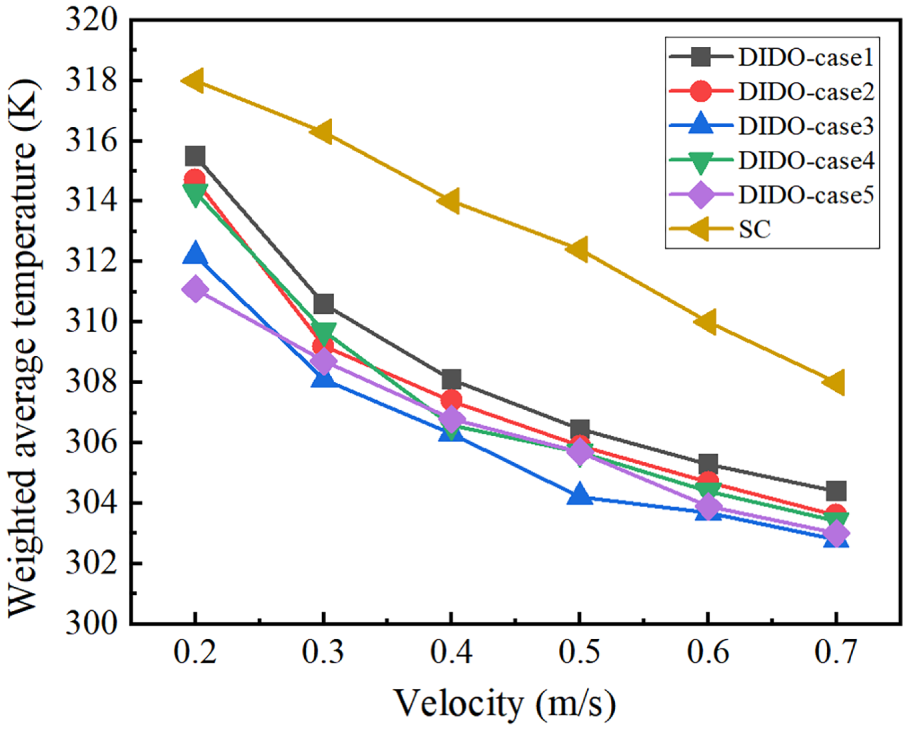
Figure 12: Variation of topologically weighted temperature of DIDO heat sink with velocity at different pressure drops.
The above changes are due to the synergistic enhancement of flow and heat transfer by topological optimization structure, complex flow channels enhance fluid disturbance and mixing, thermal boundary layer, and improve convective heat transfer efficiency; The optimization of the constrained pressure drop further regulates the flow field distribution and makes the heat transfer more uniform. The increase in flow rate takes away more heat by increasing fluid flow and intensifying disturbance, highlighting the advantages of topologically optimized microchannels in terms of overall temperature levels.
Fig. 13a is a static pressure cloud diagram of the DIDO-case1 structure at 0.4 m/s; Fig. 13b a static pressure cloud map of the DIDO-case2 structure at 0.4 m/s; Fig. 13c The static pressure cloud map of the DIDO-case3 structure at 0.4 m/s; Fig. 13d is the static pressure cloud map of the DIDO-case4 structure at 0.4 m/s; Fig. 13e a static pressure cloud map of the DIDO-case5 structure at 0.4 m/s; Fig. 13f is the static pressure cloud map of the SC structure at 0.4 m/s. (The pressure drop is not a weighted average pressure drop. The former focuses on local extreme cases, pointing out the pressure residence at the entrance and the change of the pressure gradient at the bifurcation, and qualitatively explaining the characteristics of the flow field (the static pressure of each structure is within the yield limit of solid materials (about 200 MPa)); the latter provides a macro index representing the overall performance, which is used to compare the flow resistance of different topological structures and straight channels.) As shown in the figure, the static pressure distribution of the topological flow channel presents the characteristics of gradual from the inlet to the outlet, and there is a local pressure gradient change at the bifurcation of the flow channel; While the parallel channel shows a uniform decline along the flow direction, and the pressure difference between the inlet and outlet is relatively concentrated. From the numerical comparison point of view, the parallel flow channel forms a high pressure residence at the entrance, and the outlet pressure value is low, and the overall pressure drop characteristic is “uniform attenuation along the way”. In contrast, although the pressure concentration in the inlet of the topological flow channel also occurs, the pressure field distribution becomes more dispersed with the flow of the fluid to the fine branches. The topological structure can generate the equivalent flow velocity of the main channel, the cross-section area of the flow, and the loss along the path by generating tree branches; Although the design of the fine shunt channel has a local flow resistance, it has significantly improved the average flow rate of the overall flow channel, and finally achieved the optimization effect of “low pressure drop”. The pressure drop of the parallel flow channel is significantly higher than that of the topological structure because of the single flow channel, high flow velocity and large resistance along the flow channel.
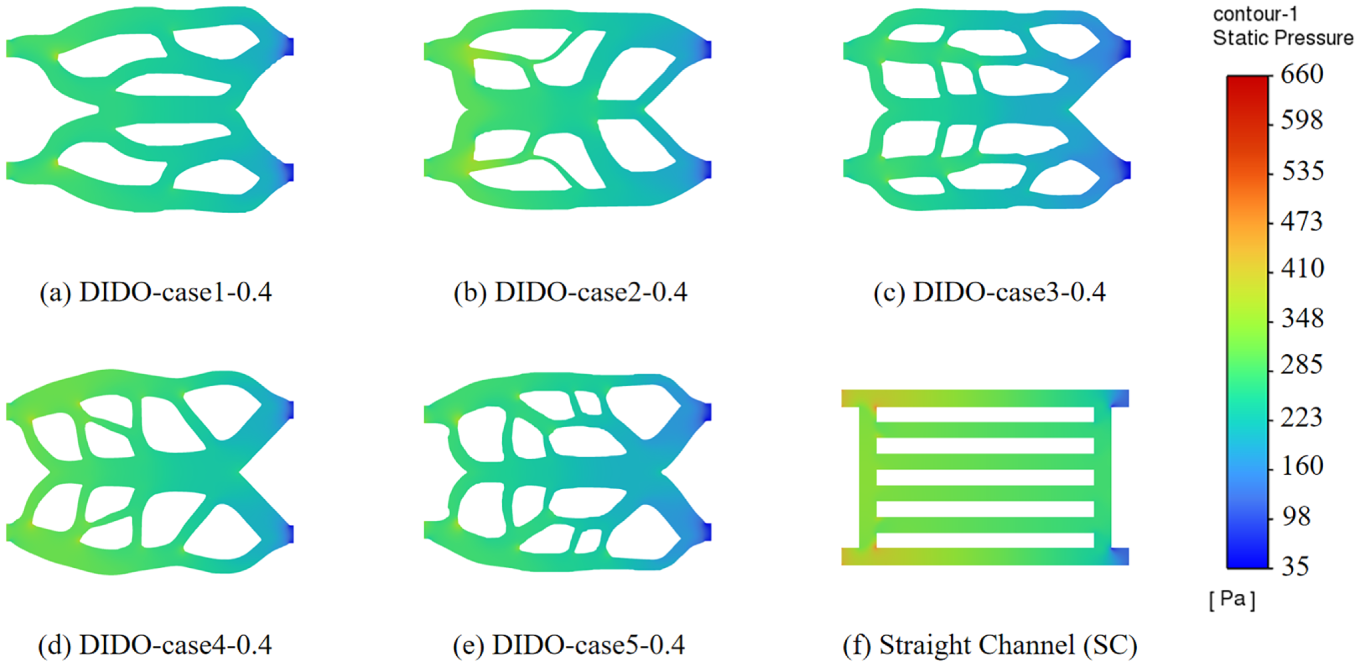
Figure 13: Microchannel heat sink pressure distribution under typical operating conditions.
As shown in Fig. 14, under different pressure drop conditions, the weighted pressure drop of the dual-inlet and dual-outlet (DIDO) microchannel heat sink topology shows a clear change law with the flow rate, which reflects the macro characteristics of pressure drop changes. The pressure drops of all models show a linear upward trend with the inlet velocity. Among them, the SC configuration has the most significant pressure drop growth rate, and its weighted pressure drop is always at the same flow rate. When the flow rate reaches 0.7 m/s, the inlet and outlet pressure drop of the straight channel is 437.6 Pa. In contrast, the pressure drop of the topology optimization model is significantly lower, showing good flow drag reduction characteristics. Among them, the case1 structure has the lowest pressure drop, which is 312.3 Pa, which is 125.3 Pa higher than that of the straight channel; The pressure drop levels of case2, case3 and case4 structures were similar, all decreased by about 110 Pa; However, the case5 structure has a relatively small pressure drop of 377 Pa, and the effect is slightly inferior to other topological models. This indicates that the flow resistance regulates the structure of the flow channel. Although the shape of the straight channel is simple, the superposition effect of viscous resistance and local resistance along the channel is stronger; By reconstructing the flow channel, the topology optimization structure improves the heat transfer and optimizes the flow field distribution, which effectively improves the flow resistance.
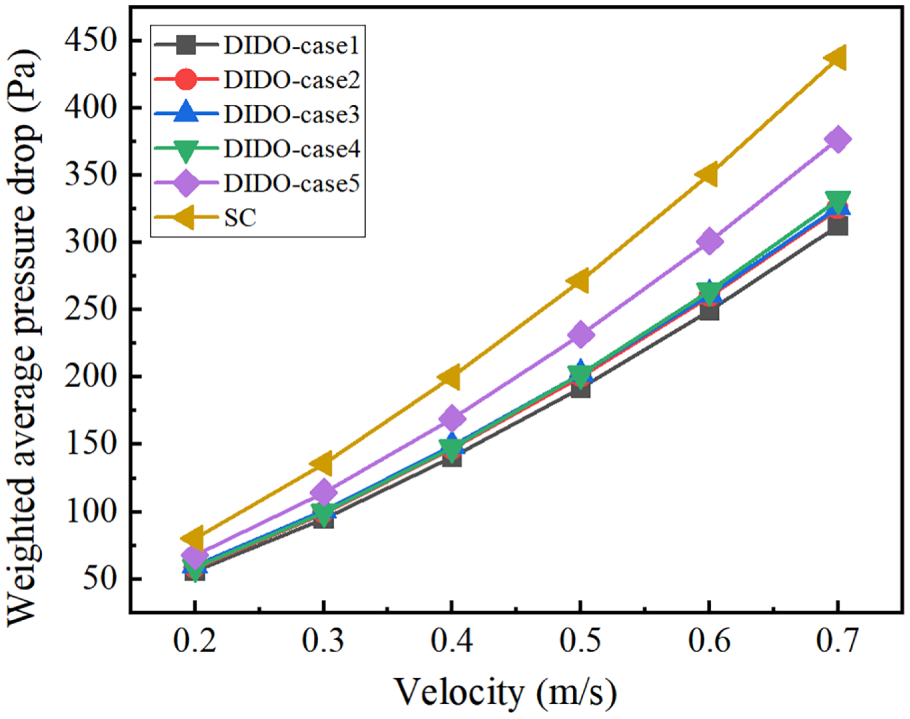
Figure 14: Variation of topology-weighted pressure drop with velocity of DIDO heat sink under different pressure drops.
Fig. 15a is a cloud diagram of the velocity trace of DIDO-case1 at 0.4 m/s; Fig. 15b a cloud map of the velocity trace of DIDO-case2 at 0.4 m/s; Fig. 15c is the velocity trace cloud map of DIDO-case3 at 0.4 m/s; Fig. 15d is the velocity trace cloud map of DIDO-case4 at 0.4 m/s; Fig. 15e a cloud map of the velocity trace of DIDO-case5 at 0.4 m/s; Fig. 15f is the velocity trace cloud map of SC at 0.4 m/s. The velocity trace distribution of different structures at the same flow velocity is shown. When the velocity is 0.4 m/s, the local velocity of SC can be enlarged to about 0.7 m/s, the velocity distribution is uniform and straight, and the local high-speed region is only formed at the corner of the inlet and outlet, and there is no obvious velocity classification disturbance; The flow velocity in the topological channel is also as high as 0.6 m/s, and the flow velocity is distributed in a tree shape: the flow velocity is concentrated at the entrance, and the fluid is dispersed to each branch after multi-stage bifurcation. The flow velocity gradient is gentle, and there is no large-scale high-speed retention area. DIDO-case4 structure has a more uniform flow velocity dispersion and a lower peak flow velocity; DIDO-case3 structure has a more coherent flow velocity distribution, maintains a higher level of flow velocity, and has better pressure drop control. According to the boundary layer theory, the thickness of the thermal boundary layer decreases and the convective heat transfer coefficient increases due to the flow velocity. The periodic acceleration-deceleration of the flow velocity is one of the mechanisms of enhancing heat transfer in topological flow channels; At the same time, according to the law of conservation, in the stable flow state of the fluid, the flow rate through any cross section is constant. When there is a cross-section catastrophe in the topologically formed flow channel, the flow rate will inevitably increase to the continuity equation-through the local high-speed flow thermal boundary layer, Enhance fluid disturbance, thereby improving the overall heat transfer efficiency.
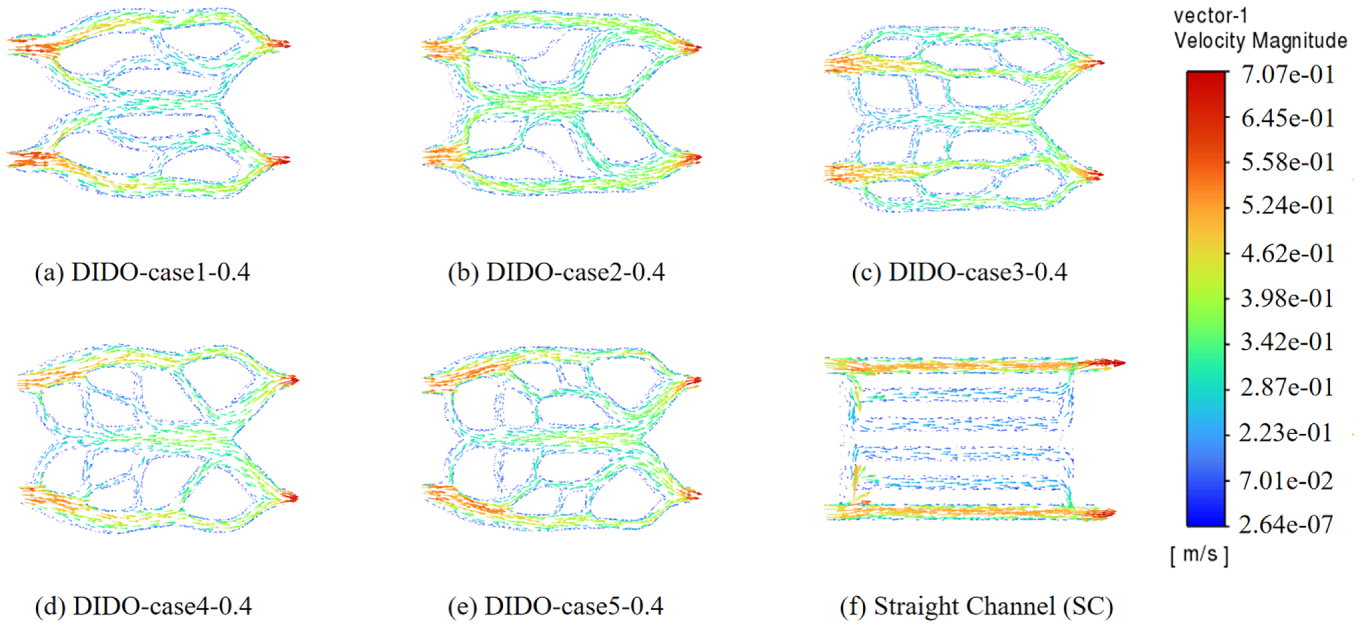
Figure 15: Velocity trace distribution of microchannel heat sink under typical operating conditions.
According to the thermal resistance R curve of the microchannel heat sink in Fig. 16, the thermal resistance of all structures shows a decreasing trend with the increase of the flow rate, and the decline is more significant in the low flow rate range (0.2–0.4 m/s), and the high flow rate range (0.5–0.7 m/s). The decline rate slows down. Compared with different structures, the SC model shows thermal resistance in the full flow range, which is about 4.95 K/W at 0.2 m/s, and still maintains 3.1 K/W at 0.7 m/s, and the heat dissipation performance is the worst. In the DIDO model, the thermal resistance is gradually optimized with the topology, and the performance of DIDO-case3 is the best: the thermal resistance decreases to about 1.65 K/W at 0.7 m/s, which is about 46.8% compared with the SC model at the same flow rate. The increase in flow rate strengthens the convective heat transfer coefficient, so that the heat is carried by the fluid more efficiently, resulting in thermal resistance; The topology optimization channel expands the heat transfer area and enhances the cooling requirements of flow density electronic devices.
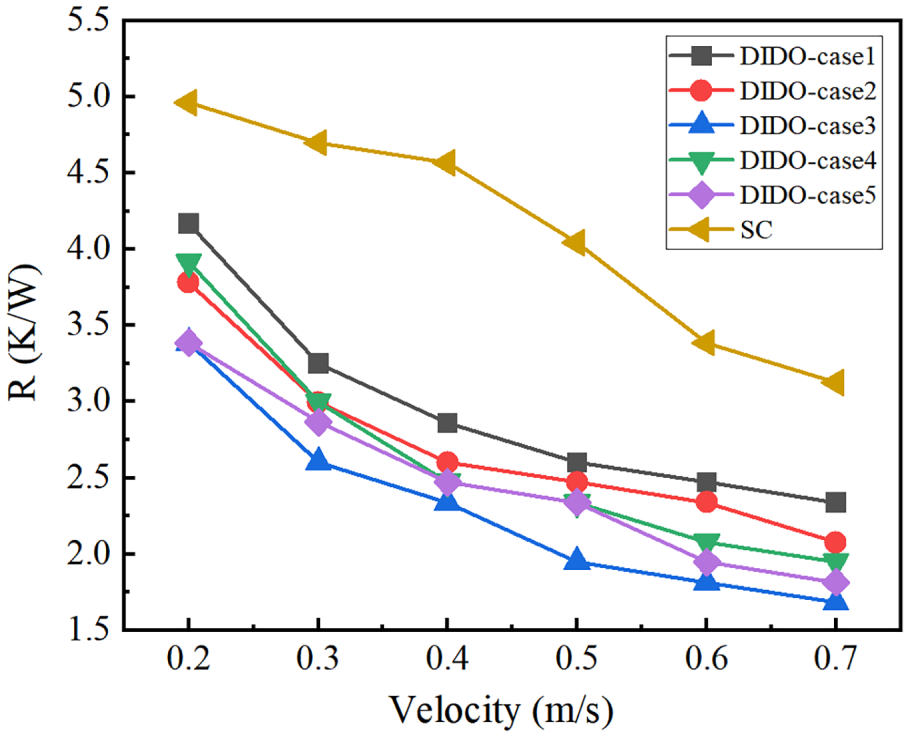
Figure 16: R curve of microchannel heat sink thermal resistance.
Fig. 8 shows the Nusselt number curve of the microchannel heat sink. The Nusselt number of each structure increases with the increase of flow velocity, and the increase range is more significant in the high flow velocity range (0.5~0.7 m/s), indicating that the increase of flow velocity can effectively enhance the convective heat transfer intensity. The Nusselt number of DIDO-case4 structure is about 20.5 at 0.2 m/s and 36.7 at 0.7 m/s, the heat transfer performance is the best; the Nusselt number of DIDO-case4 structure is about 20.5 at 0.2 m/s, and the Nusselt number of DIDO-case4 structure is about 36.7 at 0.7 m/s. The Nusselt number of DIDO-case5 is the lowest, about 12.5 at 0.2 m/s, and about 23.5 at 0.7 m/s, and the heat dissipation capacity is relatively weak. The Nusselt numbers of DIDO-case1, case2 and case3 have similar growth trends, and DIDO-case3 is about 28 at 0.7 m/s, second only to DIDO-case4. As the flow velocity increases, the boundary layer becomes thinner, the convective heat transfer coefficient increases significantly, and then the Nusselt number increases. The topology of DIDO-case4 expands the heat transfer area between the fluid and the solid by generating a finer branch channel, and at the same time enhances the fluid disturbance and mixing, and enhances the thermal boundary layer. Therefore, it shows better heat transfer performance in the whole flow rate range.
As shown in Fig. 17, the relationship between heat transfer enhancement factor and velocity, the
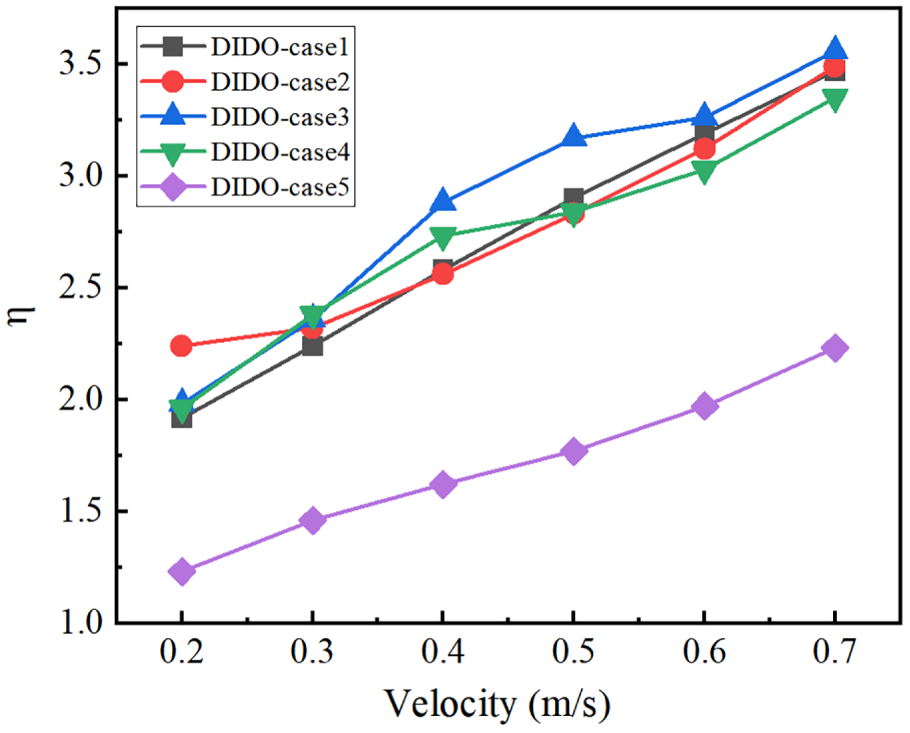
Figure 17: Relationship between heat transfer enhancement factor and velocity.
In order to meet the heat dissipation requirements of high-power electronic devices, topology optimization is used to study the geometric design and heat transfer characteristics of the microchannel heat sink. After numerical analysis and simulation verification, the following new discoveries and conclusions are obtained:
(1) The regulation mechanism of constrained pressure drop on topological configuration is revealed: as the pressure drop increases from 20 to 60 Pa, the flow channel changes from simple to complex, and the number and level of bifurcations. Its essence is a game between flow power consumption penalty and average temperature minimization-the power consumption penalty is dominant under low voltage reduction, and the algorithm tends to generate a single channel with large cross-section, but it cannot effectively invade the thermal boundary layer. The thermal boundary layer at the exit section is too thick, and the local High temperature up to 334 K; When the pressure drop rises to 40–60 Pa, the power consumption constraint is relaxed, and the optimization algorithm introduces cross-section catastrophe and high-frequency bifurcation, so that the thermal boundary layer is repeatedly reset after the bifurcation node, and the convective heat transfer coefficient is significantly improved. The results showed that the bottom temperature decreased from 334 to 307 K, with a decrease of 27 K. This finding fills in the research blank of quantitative evolution law of bifurcation level of flow channel under wide pressure drop gradient.
(2) The essence of heat transfer enhancement realized by DIDO configuration through regulating flow symmetry and pressure difference driving force is clarified. In the comparison of the four layouts, DIDO showed the best heat dissipation performance and temperature uniformity at each pressure drop, and its temperature was about 30 K higher than that of SISO. Velocity-pressure field coupling analysis shows that its advantage is not only due to the total flow rate, but also lies in the unique “central hedge stagnation” and “reverse pressure gradient cancellation” effects: the long-distance unidirectional flow in SISO leads to serious pressure attenuation along the way, and the end The flow rate is lower than 0.1 m/s, forming a large-area heat transfer dead zone; In the DIDO symmetrical layout, the inflow from both sides forms a counter-stagnation surface at the center, and the effective viscous bottom layer and thermal boundary layer. The dual-outlet design shortens the effective flow distance of a single flow channel and the resistance along the path, realizes the uniform distribution of flow rate and the peak value of local heat transfer coefficient.
(3) A multi-objective trade off criterion based on the heat transfer enhancement factor is established, and the nonlinear law between heat transfer enhancement and flow resistance is revealed: pure pursuit of heat transfer area expansion will lead to a decrease in
(4) Constructed and verified the closed-loop framework for forward design of microchannel radiators of “2D topology optimization-3D CFD reconstruction-dimensionless comprehensive evaluation”, and quantitatively evaluated the predictive fidelity of the 2D simplified model for 3D laminar heat transfer for the first time. The results show that the weighted average temperature of DIDO-case 3 decreases to 303 K at 0.7 m/s flow rate, the comprehensive heat transfer factor is above 2.8, and the weighted average pressure drop is nearly 35% compared with that of the straight channel. By weighing the pressure drop and temperature comprehensively, it is determined that the DIDO topology with a constrained pressure drop of 40 Pa has comprehensive heat transfer performance. This study provides a theoretical basis for high-efficiency and low-resistivity thermal management of high-power electronic devices.
Acknowledgement: We sincerely thank our supervisor for the meticulous guidance and valuable suggestions during topic selection, experiments, and paper writing. We are grateful to our senior and junior lab mates for their help and encouragement in our research. Special thanks go to our family for their constant understanding, support, and silent dedication.
Funding Statement: The authors received no specific funding for this study.
Author Contributions: Study conception and design: Bo Cai, Song Jin; data collection: Lei Hua, Jiaqi Zhang; analysis and interpretation of results: Bo Cai, Song Jin; draft manuscript preparation: Bo Cai, Song Jin. All authors reviewed and approved the final version of the manuscript.
Availability of Data and Materials: The authors confirm that the data supporting the findings of this study are available within the Supplementary Materials.
Ethics Approval: Not applicable.
Conflicts of Interest: The authors declare no conflicts of interest.
Supplementary Materials: The supplementary material is available online at https://www.techscience.com/doi/10.32604/ee.2026.083149/s1.
References
1. Deng Y, Zhang M, Jiang Y, Liu J. Two-stage multichannel liquid-metal cooling system for thermal management of high-heat-flux-density chip array. Energy Convers Manag. 2022;259(7589):115591. doi:10.1016/j.enconman.2022.115591. [Google Scholar] [CrossRef]
2. Cui H, Zhang Q, Bo Y, Bai P, Wang M, Zhang C, et al. Flexible microfluidic electrocaloric cooling capillary tube with giant specific device cooling power density. Joule. 2022;6(1):258–68. doi:10.1016/j.joule.2021.12.010. [Google Scholar] [CrossRef]
3. Wang H, Hu K, Cheng M, Lu Z. Additive manufacturing of liquid-cooled ceramic heat sinks: an experimental and numerical study. Chin J Mech Eng Addit Manuf Front. 2023;2(4):100100. doi:10.1016/j.cjmeam.2023.100100. [Google Scholar] [CrossRef]
4. Yuan Y, Chen L, Yang Q, Ke H, Gu L, Tao WQ. Multi-fidelity topology optimization of flow boiling heat transfer in microchannels. Int J Heat Mass Transf. 2025;239(5):126585. doi:10.1016/j.ijheatmasstransfer.2024.126585. [Google Scholar] [CrossRef]
5. Qiu J, Zhou J, Zhao Q, Qin H, Chen X. Numerical investigation of flow boiling characteristics in cobweb-shaped microchannel heat sink. Case Stud Therm Eng. 2021;28(2):101677. doi:10.1016/j.csite.2021.101677. [Google Scholar] [CrossRef]
6. Tang S, Wang J, Song Z, Li W, Cheng J, Fan X. The study of a novel topology-optimized heat sink for single-phase immersion cooling in data centers. Therm Sci Eng Prog. 2026;71:104550. doi:10.1016/j.tsep.2026.104550. [Google Scholar] [CrossRef]
7. Christensen MBM, Alexandersen J. Topology optimisation of heat sinks embedded with phase-change material for minimising temperature oscillations. Computation. 2026;14(1):23. doi:10.3390/computation14010023. [Google Scholar] [CrossRef]
8. Palumbo J, Tayyara O, Amon CH, Chandra S. Topologically optimized mini-channel heat sinks for reduced temperature non-uniformity. Int J Heat Mass Transf. 2023;214:124421. doi:10.1016/j.ijheatmasstransfer.2023.124421. [Google Scholar] [CrossRef]
9. Yu P, Zhang W, Wang H, Wang Z, Xiao G, Du Y, et al. Topology optimization of flow and heat transfer in coolant channels considering porous multi-heat source. Int Commun Heat Mass Transf. 2024;152(2):107285. doi:10.1016/j.icheatmasstransfer.2024.107285. [Google Scholar] [CrossRef]
10. Lu R, Li B, Xie C, Chen J, Li X, Liu Q, et al. Topology optimization design and verification of the multi-layer manifold microchannel liquid cooled plate structure. Appl Therm Eng. 2025;279:128094. doi:10.1016/j.applthermaleng.2025.128094. [Google Scholar] [CrossRef]
11. Liu S, Xu H, Chen M, Xiang Z, Zhao M. Multi-objective topology optimization of a liquid-cooled microchannel for high power positive thermal coefficient heater with irregular design domain. Int J Heat Mass Transf. 2025;238:126422. doi:10.1016/j.ijheatmasstransfer.2024.126422. [Google Scholar] [CrossRef]
12. Zhang K, Liu H, Du F, Chen X, Li B, Hong J. MMC-based heat sink topology optimization design for natural convection problems. Int J Therm Sci. 2023;192(3):108376. doi:10.1016/j.ijthermalsci.2023.108376. [Google Scholar] [CrossRef]
13. Yang Q, Chen L, Ke H, Gu L, Zheng X, Li S, et al. Multi-layer topology optimization of dual-fluid convective heat transfer in printed circuit heat exchangers. Appl Therm Eng. 2024;257:124434. doi:10.1016/j.applthermaleng.2024.124434. [Google Scholar] [CrossRef]
14. Yang Z, Huang X. An acoustic cloaking design based on topology optimization. J Acoust Soc Am. 2022;152(6):3510–21. doi:10.1121/10.0016493. [Google Scholar] [PubMed] [CrossRef]
15. Sun Y, Dastidar AG, Agazzi A, Le Goff R, Alexandersen J. Topology optimisation of conformal cooling channels in injection moulding: a scaling strategy for forced convection in high Reynolds number flows. Struct Multidiscip Optim. 2025;68(8):156. doi:10.1007/s00158-025-04067-y. [Google Scholar] [CrossRef]
16. Wang J, Melideo D, Liu X, Desideri U. Comparative study on topology optimization of microchannel heat sink by using different multi-objective algorithms and objective functions. Appl Therm Eng. 2024;252:123606. doi:10.1016/j.applthermaleng.2024.123606. [Google Scholar] [CrossRef]
17. Jiang T, Ding X, Liu H, Zhang Z. Design of water-cooled incineration grate heat dissipation structure based on multi-objective topology optimization. Struct Multidiscip Optim. 2025;68(9):180. doi:10.1007/s00158-025-04121-9. [Google Scholar] [CrossRef]
18. Wei P, Jiang Z, Xu W, Liu Z, Deng Y, Pan M. Topology optimization for steady-state navier-stokes flow based on parameterized level set based method. Comput Model Eng Sci. 2023;136(1):593–619. doi:10.32604/cmes.2023.023978. [Google Scholar] [CrossRef]
19. Zhou T, Li P, Lan X, Shao X, Liu H, Xie J, et al. A novel design of biomimetic snowflake heat sink by topology optimization verified by experiments. Int J Heat Fluid Flow. 2025;116(2):109909. doi:10.1016/j.ijheatfluidflow.2025.109909. [Google Scholar] [CrossRef]
20. Xu Q, Duan Z, Yan H, Geng D, Du H, Yan J, et al. Deep learning-driven topology optimization for heat dissipation of integrated electrical components using dual temperature gradient learning and MMC method. Int J Mech Mater Des. 2024;20(2):291–316. doi:10.1007/s10999-023-09676-3. [Google Scholar] [CrossRef]
21. Ma C, Hu J, Li M, Deng X, Yang J, He J, et al. Multi-objective topology optimization for cooling element of precision gear grinding machine tool. Int Commun Heat Mass Transf. 2025;160(7):108356. doi:10.1016/j.icheatmasstransfer.2024.108356. [Google Scholar] [CrossRef]
22. Chen D, Hasegawa Y. Level-set based topology optimization in conjugate heat transfer with large solid-to-fluid thermal conductivity ratios. Appl Therm Eng. 2025;279:127626. doi:10.1016/j.applthermaleng.2025.127626. [Google Scholar] [CrossRef]
23. Lum LYX, Wong TN, Ho JY, Leong KC. Three-dimensional topology-optimized structures for enhanced low-temperature thermal energy storage. Appl Energy. 2024;362:123001. doi:10.1016/j.apenergy.2024.123001. [Google Scholar] [CrossRef]
24. Xuan W, Xu C, Qian C, Wang J, Jiang Z, Ma R, et al. Numerical simulation and thermodynamic test analysis of plate heat exchanger based on topology optimization. Appl Therm Eng. 2024;255(6):123882. doi:10.1016/j.applthermaleng.2024.123882. [Google Scholar] [CrossRef]
25. Kikuchi Y, Yaji K, Fujita K, Saito T, Ushijima K. Homogenization-based optimal design of non-uniform lattice heat sinks: comparative study on cell structures. Case Stud Therm Eng. 2026;81(4):108029. doi:10.1016/j.csite.2026.108029. [Google Scholar] [CrossRef]
26. Silva RF, Coelho PG, Conde FM, Santos BR, Oliveira JP. Minimizing the maximum von Mises stress of elastic continuum structures using topology optimization and additively manufactured functionally graded materials. Comput Struct. 2024;301(24):107469. doi:10.1016/j.compstruc.2024.107469. [Google Scholar] [CrossRef]
27. Duan Z, Xie G, Li X. Topology optimization design of scramjet structures with forced convective heat transfer on unstructured meshes. J Therm Sci Eng Appl. 2023;15(1):011011. doi:10.1115/1.4055608. [Google Scholar] [CrossRef]
28. Feppon F. Density-based topology optimization with the Null Space Optimizer: a tutorial and a comparison. Struct Multidiscip Optim. 2024;67(1):4. doi:10.1007/s00158-023-03710-w. [Google Scholar] [CrossRef]
29. Hu X, Li Z, Bao R, Chen W, Wang H. An adaptive method of moving asymptotes for topology optimization based on the trust region. Comput Methods Appl Mech Eng. 2022;393:114202. doi:10.1016/j.cma.2021.114202. [Google Scholar] [CrossRef]
30. Ding S, Huang Y, Cui X, Fan Y. An improved integrated framework based nodal density variable and Voronoi polygon for FE-based topology optimization. Comput Struct. 2024;292(2):107244. doi:10.1016/j.compstruc.2023.107244. [Google Scholar] [CrossRef]
31. Hao G, Jin J, Zhong C. Topology optimization and material selection of cooling fin structure in submarine data center. J Phys Conf Ser. 2022;2247(1):012007. doi:10.1088/1742-6596/2247/1/012007. [Google Scholar] [CrossRef]
32. Shi Q, Song C, Pan W, Lei Y. Flow and heat transfer characteristics and comprehensive evaluation of asymmetric plate heat exchangers for centralized heat supply. Appl Therm Eng. 2024;257(1):124306. doi:10.1016/j.applthermaleng.2024.124306. [Google Scholar] [CrossRef]
33. Cai B, Hu P, Li Y, Chen B, Cai H. Numerical analysis of flow heat transfer characteristics and optimization of double-layered microchannel heat sinks with different structures. Case Stud Therm Eng. 2025;72(13–14):106370. doi:10.1016/j.csite.2025.106370. [Google Scholar] [CrossRef]
Cite This Article
 Copyright © 2026 The Author(s). Published by Tech Science Press.
This work is licensed under a Creative Commons Attribution 4.0 International License , which permits unrestricted use, distribution, and reproduction in any medium, provided the original work is properly cited.
 Downloads
 Citation Tools
