
 Login
Login Register
 Submit a Paper
 Propose a Special lssue
 Open Access
ARTICLE
Analysis of Airflow Distribution in Class 100 and Class 1000 Semiconductor Cleanrooms with a Shared Return Air Chamber
1 Department of Refrigeration, Air Conditioning and Energy Engineering, National Chin-Yi University of Technology, Taichung, Taiwan
2 Graduate Institute of Precision Manufacturing, National Chin-Yi University of Technology, Taichung, Taiwan
3 Stokes Laboratories, Bernal Institute, School of Engineering, University of Limerick, Limerick, Ireland
* Corresponding Author: Indra Permana. Email:
(This article belongs to the Special Issue: Innovative Strategies for Energy-Efficient Buildings in a Sustainable Future)
Energy Engineering 2026, 123(11), 20 https://doi.org/10.32604/ee.2026.085663
Received 15 May 2026; Accepted 02 July 2026; Issue published 24 September 2026
 View Full Text
 Download PDF
Abstract
Semiconductor cleanrooms require stable airflow distribution to control airborne contamination, maintain pressure balance, and protect process-critical zones. However, cleanroom performance is not determined only by cleanliness classification or supply airflow rate; the interaction between raised floor design, FFU velocity, and return airflow distribution can strongly influence recirculation and airflow uniformity. This study evaluates the airflow performance of a semiconductor cleanroom consisting of Class 100 and Class 1000 zones using field measurements and computational fluid dynamics (CFD) simulation. Field measurements of particle concentration, airflow velocity, temperature, and relative humidity were conducted under as-built conditions. The measured air velocities were used for CFD model validation, while the temperature, relative humidity, and particle-count results were used to verify stable environmental operation and the intended cleanliness conditions. A three-dimensional CFD model was then developed to analyze airflow behavior, pressure distribution, and recirculation patterns. Two design parameters were investigated: raised floor height and FFU supply velocity. The results show that raised floor height has a significant influence on underfloor return airflow and vertical airflow stability. Insufficient floor height restricts return airflow and increases the risk of local recirculation, while an optimized raised floor configuration improves airflow uniformity in the clean zone. Increasing FFU velocity strengthens downward airflow, but excessive velocity may increase local turbulence and energy consumption. Overall, the optimized configuration improved airflow distribution and reduced recirculation risk in process-critical areas. The findings indicate that semiconductor cleanroom performance should be improved not only by increasing airflow rate, but also by optimizing airflow paths and raised floor design to balance contamination control and energy-efficient operation.Keywords
Semiconductor manufacturing requires strict contamination control because airborne particles can directly affect process stability, product quality, and manufacturing yield [1]. As device dimensions continue to decrease, the demand for cleaner and more stable production environments has become increasingly important [2]. Cleanrooms are therefore designed to control particle concentration, airflow direction, pressure difference, temperature, and relative humidity. Among these parameters, airflow distribution plays a major role because it governs particle transport, dilution, and removal from the process area [3].
Cleanroom cleanliness is commonly classified based on airborne particle concentration according to ISO 14644-1 [4]. In semiconductor facilities, high-cleanliness areas such as ISO Class 5 and ISO Class 6 are often maintained using ceiling-mounted fan filter units (FFUs) combined with High-Efficiency Particulate Air (HEPA) or Ultra-Low Particulate Air (ULPA) filtration [5]. The supplied clean air is expected to move vertically downward through the working zone and return through a raised floor or return air path. This airflow pattern helps reduce particle residence time and prevents contaminated air from spreading into critical zones [6].
Recent studies have shown that cleanroom performance is not determined only by the air change rate or supply airflow volume [7]. Airflow uniformity, flow direction, pressure balance, and the position of return air paths are also critical factors [8]. Poor airflow distribution can create recirculation zones, stagnant regions, and local turbulence, which may increase the risk of particle accumulation [9]. Therefore, simply increasing the supply airflow rate may not always improve contamination control. It may also increase fan energy consumption and reduce the overall energy efficiency of the cleanroom system [10,11].
The raised floor is another important design factor in vertical unidirectional cleanrooms. It acts as the return air pathway and affects pressure distribution below the cleanroom floor [12]. An insufficient raised floor height may restrict return airflow and generate non-uniform pressure fields [13]. In contrast, an appropriate floor height can support smoother airflow discharge, reduce flow resistance, and improve vertical airflow stability [14]. However, the relationship between raised floor height, FFU velocity, and airflow uniformity is still not fully clarified, especially in actual semiconductor cleanrooms with multiple cleanliness zones [15].
Field measurements provide reliable baseline information for validating simulation models and evaluating potential energy-saving strategies [16]. Particle count, airflow velocity, temperature, and humidity measurements provide direct evidence of cleanroom performance under actual conditions [17]. However, field measurements are usually limited to selected points and cannot fully describe the complete airflow structure inside the cleanroom. Computational Fluid Dynamics (CFD) can overcome this limitation by visualizing airflow patterns, pressure fields, and potential recirculation zones throughout the entire domain [18]. Recent studies have increasingly integrated CFD airflow analysis with field measurements and energy simulations to assess both environmental performance and energy-saving potential [19,20].
Previous studies have investigated cleanroom airflow using numerical simulation, experimental measurement, or combined approaches [21–23]. These studies confirmed that FFU arrangement, inlet velocity, return air design, and internal layout can significantly influence airflow stability and particle removal [24]. However, previous studies have generally examined FFU arrangement, supply velocity, return-air design, airflow distribution, or particle transport as separate factors. Comparatively limited attention has been given to the combined influence of raised-floor height and FFU supply velocity in dual-zone semiconductor cleanrooms where different cleanliness classes are connected through a shared return-air chamber. This configuration may affect underfloor airflow resistance, pressure balance, airflow directionality, and local recirculation between the two zones.
The novelty of the present study lies in applying a field-validated CFD model to an actual semiconductor cleanroom consisting of ISO Class 5 and ISO Class 6 zones with a shared return-air chamber. The effects of raised-floor height and FFU supply velocity are systematically evaluated in terms of airflow distribution, pressure fields, turbulence intensity, and local recirculation. The corresponding FFU power and energy consumption are also estimated to connect airflow performance with energy use. The findings provide practical guidance for evaluating raised-floor dimensions and FFU operating conditions according to cleanroom airflow-control and energy requirements.
The investigated facility is a semiconductor cleanroom designed to support high-precision manufacturing processes. As shown in Fig. 1, the cleanroom consists of two controlled zones with different cleanliness levels: Class 100, equivalent to ISO Class 5, and Class 1000, equivalent to ISO Class 6. These two zones are arranged on opposite sides of a shared return air chamber, forming a dual-zone cleanroom configuration with a common return airflow path.
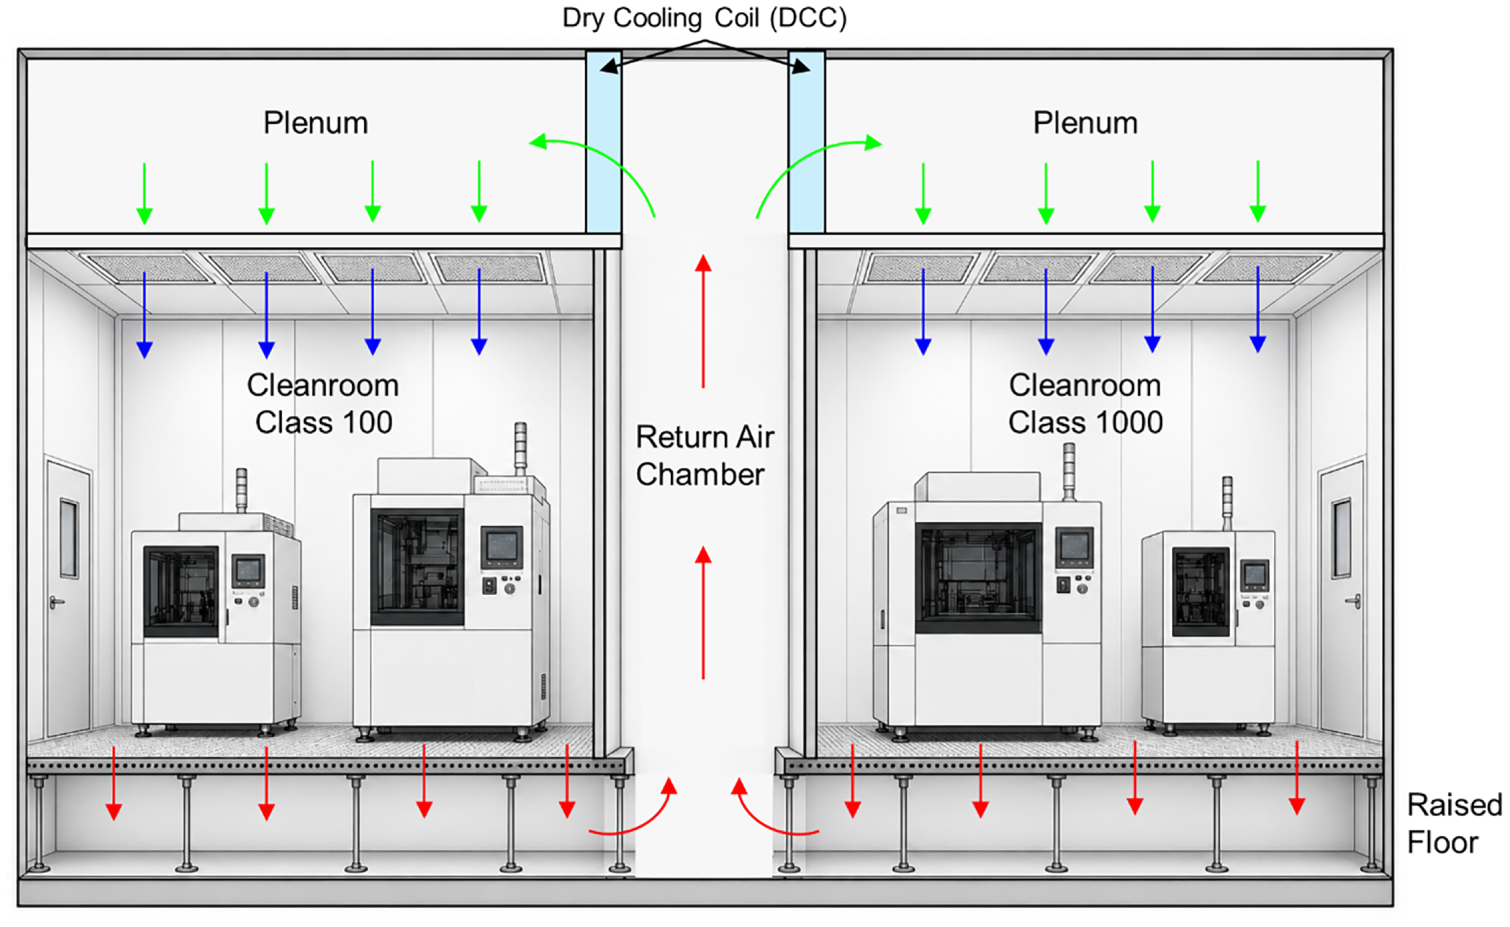
Figure 1: Section-view schematic of cleanroom airflow supplied by ceiling-mounted FFUs. Blue arrows: supply air; red arrows: return air; green arrows: recirculated cooled air.
Clean air is supplied from ceiling-mounted fan filter units, which act as the final air delivery and filtration components. Each FFU is equipped with a HEPA filter rated at 99.99% efficiency for particles ≥0.3 µm. In the Class 100 zone, the FFUs are designed to provide a higher average supply velocity to maintain stable downward unidirectional airflow. In contrast, the Class 1000 zone operates at a lower supply velocity because of its less stringent particle control requirement. After entering the cleanroom, the supplied air moves downward through the working zone, passes through the perforated raised floor, and is collected by the shared return air chamber located between the two zones.
The raised floor consists of perforated tiles with a 50% open area ratio and functions as the return airflow pathway. This configuration allows air from both cleanliness zones to return through the same chamber. Therefore, the airflow interaction between the Class 100 and Class 1000 zones becomes an important design issue. Improper airflow balance may cause non-uniform pressure distribution, local recirculation, or unstable vertical airflow. For this reason, the present study focuses on evaluating how raised floor height and FFU supply velocity affect airflow distribution in this shared-return cleanroom configuration.
Field measurements were conducted under unoccupied as-built conditions to evaluate the actual performance of the semiconductor cleanroom and to provide input data for CFD model validation. The measured parameters included airborne particle concentration, FFU supply airflow rate, air velocity, temperature, and relative humidity. The instruments used for the field measurements are listed in Table 1.
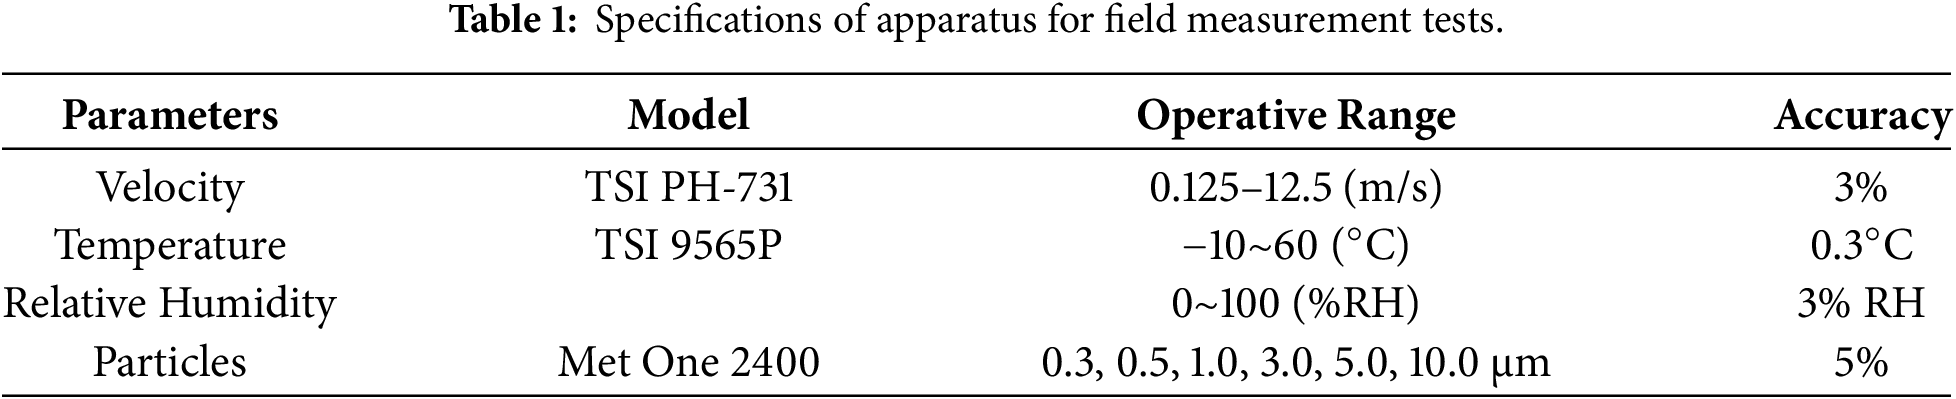
Airborne particle concentration was measured to verify whether each cleanroom zone complied with the target cleanliness classification. The particle count test was conducted in accordance with ISO 14644-1:2015. A calibrated Met One 2400 portable optical particle counter was used to measure particle concentrations at six particle size channels: 0.3, 0.5, 1.0, 3.0, 5.0, and 10.0 µm. The number and location of sampling points were determined based on the total cleanroom floor area following ISO 14644-1:2015.
The FFU supply airflow rate was measured under as-built operating conditions using an airflow capture hood. The measured air volume flow rate was used to calculate the corresponding supply air velocity and to define the inlet boundary conditions for the CFD simulation. For a standard FFU outlet area of 0.6 m × 1.2 m, equivalent to 0.72 m2, a measured flow rate of 1296 m3/h corresponds to an average supply velocity of approximately 0.5 m/s.
Temperature and relative humidity were measured to confirm that the cleanroom was operating under stable environmental conditions during the field test. Before measurement, the cleanroom system was operated under automatic temperature and humidity control for at least 24 h to ensure stable conditions. Measurements were taken at a height of 1.2 m above the raised floor, representing the typical working-zone height.
A three-dimensional Computational Fluid Dynamics (CFD) model was developed using ANSYS Fluent 2020 R2 to further analyze the airflow behavior inside the semiconductor cleanroom. The simulation was conducted to complement the field measurements because point-based measurement data can verify local conditions but cannot fully describe the overall airflow structure in the cleanroom. Through CFD, the airflow pattern, velocity distribution, pressure field, and possible recirculation regions can be visualized throughout the entire simulation domain.
The CFD geometry was constructed based on architectural drawings, field measurement information, and HVAC system design data. As shown in Fig. 2a, the model represents a dual-zone semiconductor cleanroom consisting of a Class 100 zone, equivalent to ISO Class 5, and a Class 1000 zone, equivalent to ISO Class 6. The two zones are separated by an internal partition wall and connected through a central shared return air chamber. This configuration allows return air from both cleanliness zones to be collected through the same return pathway. Therefore, airflow interaction between the two zones becomes an important factor affecting pressure balance, vertical airflow stability, and possible recirculation behavior.
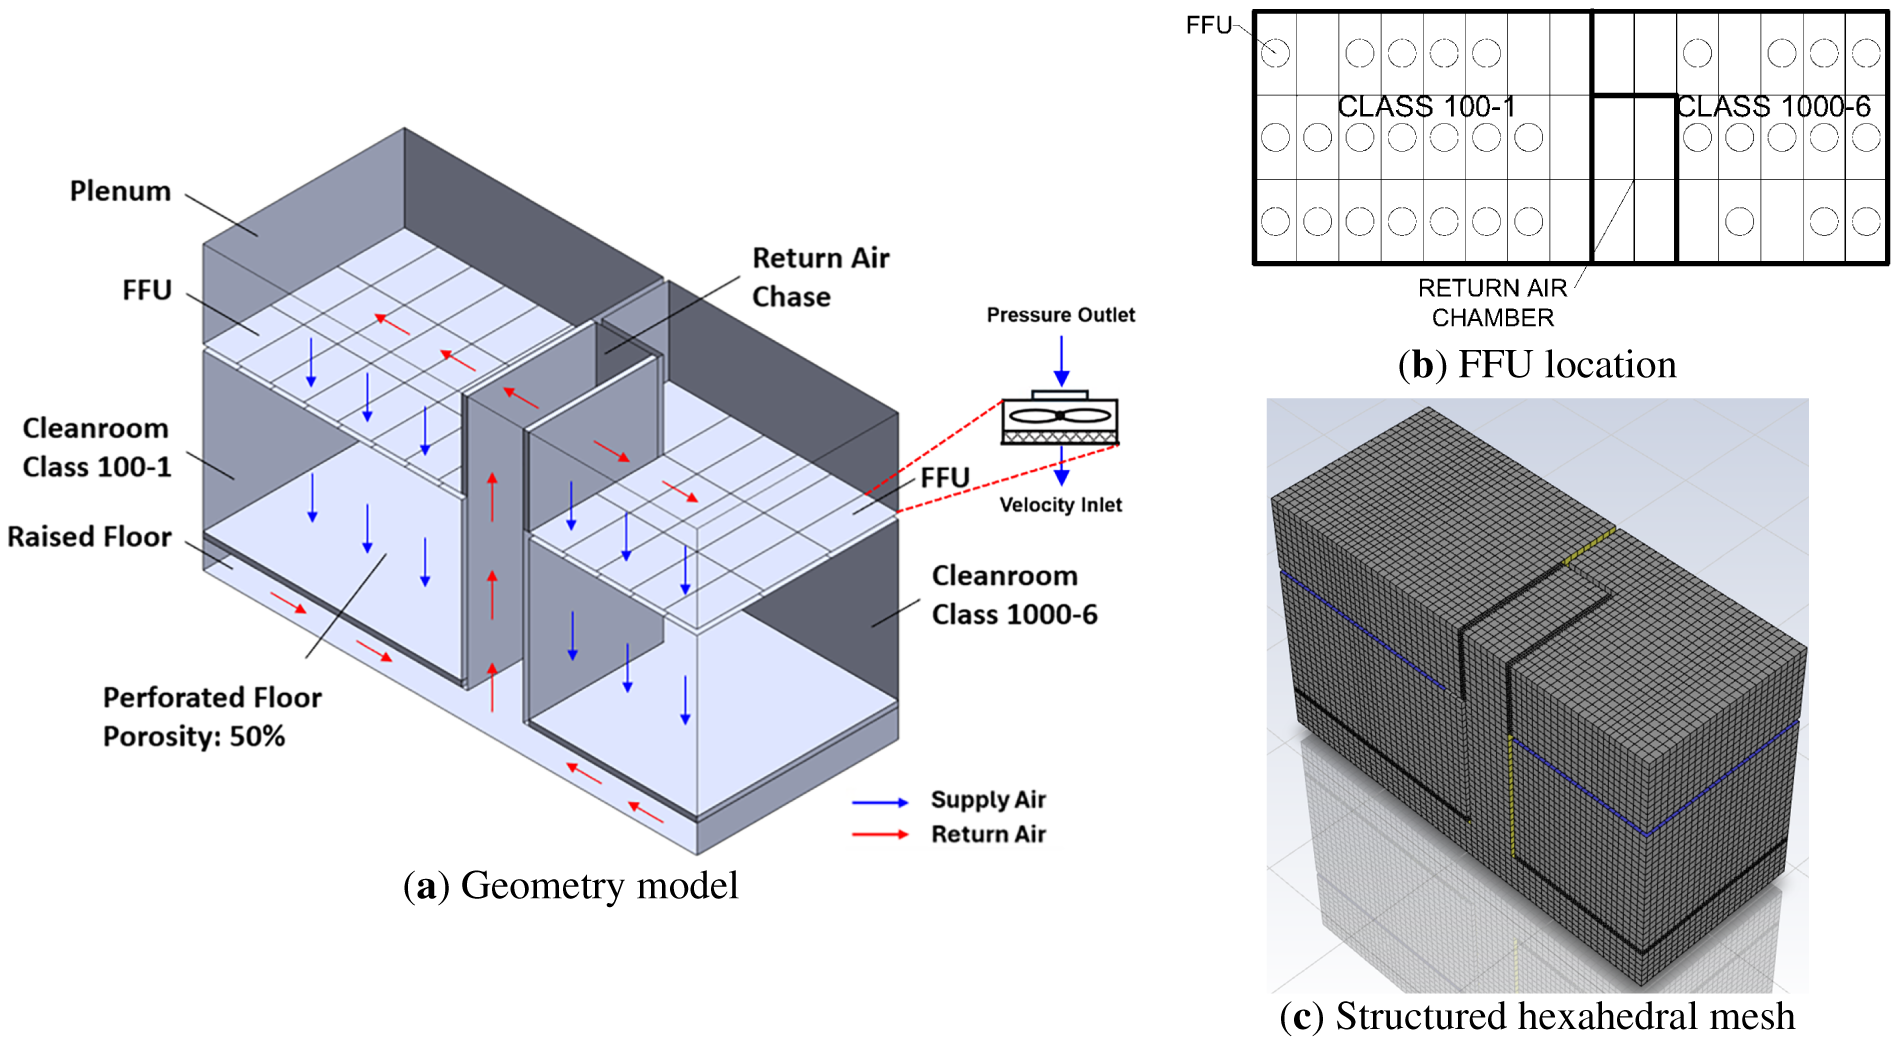
Figure 2: Three-dimensional CFD geometry and mesh model of the semiconductor cleanroom.
Clean air was supplied from ceiling-mounted fan filter units (FFUs), which were modeled as velocity inlet boundaries, as shown in Fig. 2b. The FFU was represented using two separate boundary surfaces because the internal fan structure was not explicitly included in the computational domain. The lower discharge surface of each FFU, facing the cleanroom, was defined as a velocity inlet with supply velocities of 0.3, 0.4, and 0.5 m/s. The upper suction surface of the FFU, connected to the ceiling plenum, was defined as a pressure outlet with a gauge pressure of 20 Pa. Thus, the return air flows through the perforated raised floor, rises through the shared return-air chase, enters the ceiling plenum, and leaves the computational domain through the pressure-outlet surfaces located on the suction side of the FFUs. This treatment represents the recirculating airflow through the FFUs without explicitly modeling the fan blades and internal FFU components.
The computational domain was discretized using a structured hexahedral mesh, as shown in Fig. 2c. This mesh type was selected because the cleanroom geometry is mainly rectangular, which allows good cell alignment along the vertical airflow direction and the underfloor return airflow path. The hexahedral mesh also provides better numerical stability and lower numerical diffusion for airflow simulations compared with highly irregular mesh structures. Local mesh refinement was applied near the FFU supply openings, perforated raised floor, partition wall, and shared return air chamber to improve the prediction of local airflow behavior.
The airflow was assumed to be steady-state and incompressible. The RNG k–ε turbulence model was selected to represent the turbulent airflow behavior inside the cleanroom. This model was used because cleanroom airflow can be affected by flow interaction around partitions, walls, equipment zones, and perforated floor openings. The RNG k–ε model is also commonly applied for indoor airflow and ventilation studies where recirculation and local turbulence may occur. Since the simulation was conducted under as-built unoccupied conditions, no internal heat sources, process equipment heat loads, or personnel loads were included in the model.
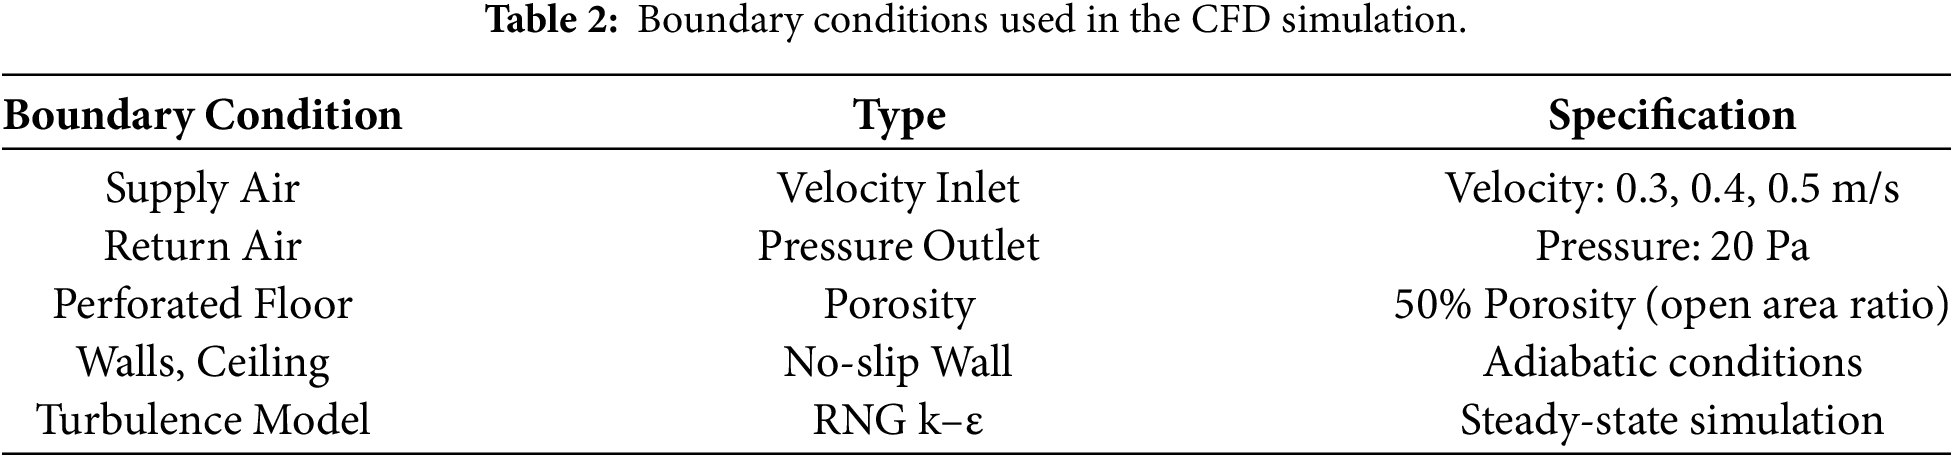
All wall surfaces, ceilings, and non-perforated floor areas were defined as no-slip and adiabatic boundaries. The no-slip condition assumes zero air velocity at solid surfaces, while the adiabatic assumption neglects heat transfer through the wall surfaces. These assumptions are appropriate for the present study because the main focus was airflow distribution and pressure behavior under stable cleanroom operating conditions. The boundary conditions used in the CFD simulation are summarized in Table 2.
To ensure the numerical reliability of the CFD model, a grid independence test and turbulence model validation were conducted before the case simulations. These evaluations were performed to confirm that the predicted airflow field was not strongly influenced by mesh resolution or turbulence model selection.
For the grid independence test, three mesh densities were generated using the same cleanroom geometry: a coarse mesh with 162,578 elements, a medium mesh with 375,384 elements, and a fine mesh with 1,233,881 elements. The same boundary conditions were applied to all mesh cases to ensure a consistent comparison. Simulated air velocity values were extracted at ten measurement points corresponding to the field measurement locations. The simulated values were then compared with the measured air velocities obtained under as-built conditions. The percentage error between the CFD results and field measurements was calculated using the Eq. (1).
where
2.5 FFU Power and Energy Consumption Estimation
The electrical power consumption of the FFUs was estimated to evaluate the energy implications of the investigated supply-air velocities. Each FFU had nominal dimensions of 1.2 m × 0.6 m, corresponding to a supply area of 0.72 m2. Based on the manufacturer’s specifications [25], the external static pressure was taken as 160 Pa. The overall FFU efficiency (η) was assumed to be 45%, based on the rated airflow, static pressure, and electrical power characteristics of the installed unit. The airflow rate supplied by one FFU was calculated using Eq. (2), where
The electrical power consumption of one FFU was estimated as Eq. (3), where
The annual electrical energy consumption was estimated using Eq. (4), where
The study focuses on understanding how raised floor height and supply airflow velocity influence airflow uniformity, pressure distribution, and local recirculation behavior in two clean zones. The cleanrooms share a common return air chase, a configuration that poses potential risks for non-uniform airflow and turbulence if not properly designed. The simulation case study was divided into two parts.
In Case A, the raised floor height varied from 400 to 600 mm and 800 mm, while the FFU supply velocity was fixed at 0.3 m/s. It should be noted that changing the raised floor height did not change the occupied cleanroom volume above the raised floor. The process-zone floor area and working-zone height were kept constant in all raised-floor cases. Therefore, the raised floor height variation mainly affected the return airflow resistance, underfloor pressure distribution, and vertical airflow stability rather than changing the occupied cleanroom volume.
In Case B, the FFU supply velocity varied from 0.3 to 0.4 m/s and 0.5 m/s using the optimal raised floor height obtained from Case A. This case was conducted to evaluate the influence of supply airflow rate on airflow strength, directional stability, pressure distribution, and possible local recirculation.
This section presents the simulation-based evaluation of airflow behavior in the semiconductor cleanroom, integrating numerical findings with engineering insights to assess how structural and operational parameters influence ventilation performance. The investigation is structured into three analytical phases: (1) a grid independence and turbulence model evaluation, ensuring the credibility and convergence of the CFD framework; (2) Case A, which explores the raised floor height in shaping airflow uniformity; and (3) Case B, which examines how varying supply air velocity influences vertical flow distribution, and pressurization dynamics.
3.1 Grid Test and Turbulence Model Evaluation
To evaluate the reliability of the CFD model, the simulated airflow velocity was compared with field measurement data at ten measurement points located at a height of 1.2 m above the raised floor, as shown in Fig. 3a. These points were selected to represent the working-zone airflow distribution in both cleanroom zones and to provide validation data for the numerical model.
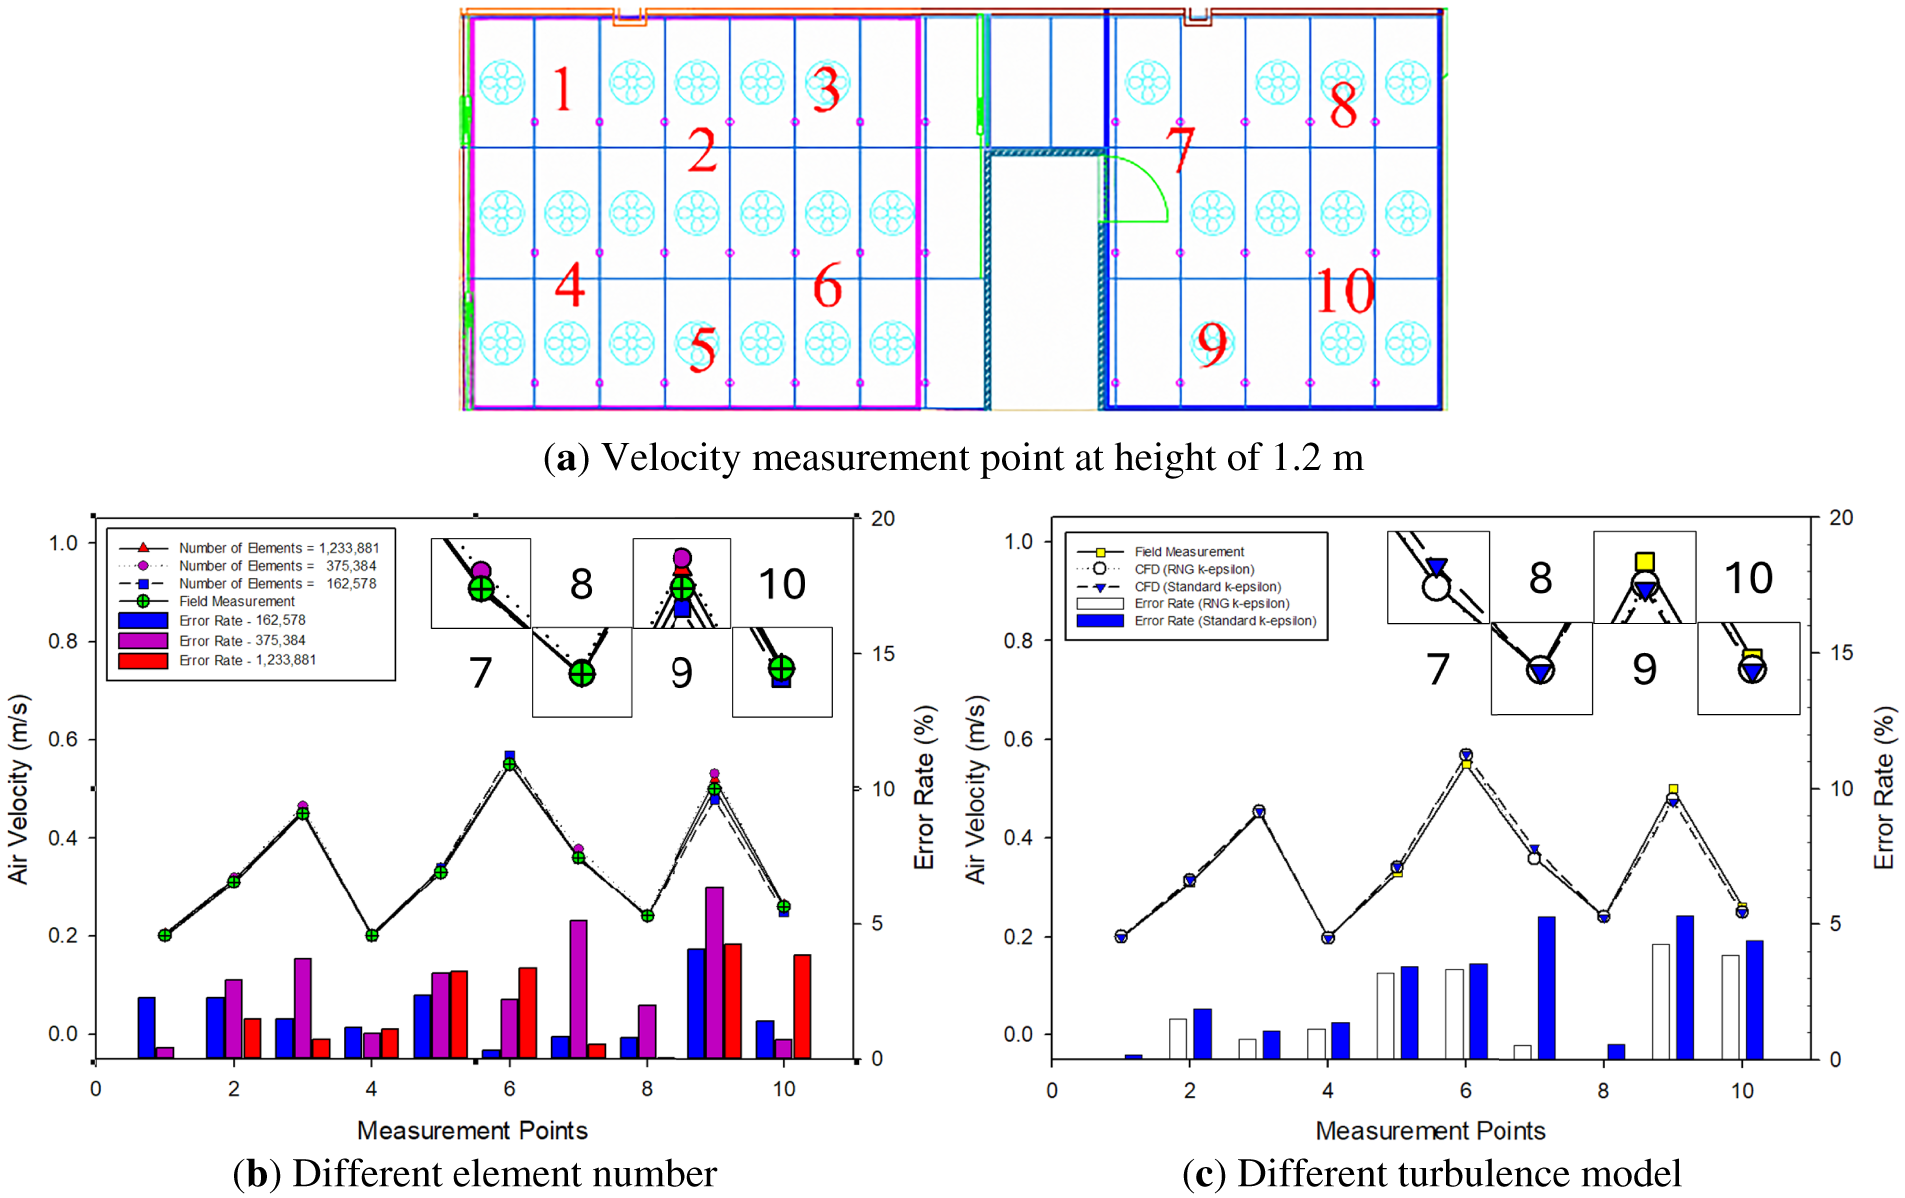
Figure 3: Grid independence and turbulence model validation results.
A grid independence test was first conducted to examine the influence of mesh density on the simulation results. Three different grid resolutions were generated: coarse (162,578 elements), medium (375,384 elements), and fine (1,233,881 elements). Fig. 3b compares simulated air velocity at 10 measurement points and field measurements obtained during the as-built condition. The chart includes both the velocity values (primary Y-axis) and the corresponding error rates (secondary Y-axis) at each point. Across all mesh densities, the CFD results follow the same trend as the measured data, with higher velocities recorded at Points 3, 6, and 9. The fine mesh slightly improves alignment with the measured values at critical points but requires significantly more computational resources. The bar chart below the velocity lines indicates the local error percentage between simulated and measured data. Based on this evaluation, the fine-density mesh (1,233,881 elements) was selected for all subsequent simulations in this study. It offers a reliable representation of airflow characteristics, even though computational demand is not high.
In addition to mesh sensitivity, a comparison of the turbulence model was performed to assess its influence on simulation accuracy. Two commonly used models for cleanroom airflow analysis were tested using the fine-density mesh (1,233,881 elements). RNG k-ε model and Standard k-ε model. Fig. 3c illustrates the velocity comparison at 10 measurement points and the corresponding local error rates of each turbulence model. The velocity trends generated by both models align closely with field measurements, indicating reasonable predictive capability. The RNG k-ε model (white bars) consistently delivers lower error rates across most points, particularly at Points 1, 7, and 8. In contrast, the Standard k-ε model (blue bars) exhibits higher error rates, exceeding 5% at multiple locations. Notably, point 7 shows better agreement with field data using the RNG k-ε model, as highlighted in the zoomed-in view. While both models produce acceptable results, the RNG k-ε model demonstrates improved accuracy in predicting local air velocities and is more suitable for capturing flow behavior in regions influenced by obstructions or recirculation. Therefore, the RNG k-ε turbulence model was selected for all further simulations in the semiconductor cleanroom study.
Fig. 4 presents the measured temperature, relative humidity, and airborne particle concentrations at the monitoring points in the Class 100 and Class 1000 cleanrooms. The temperature in the Class 100 cleanroom ranged from approximately 20.3°C to 20.5°C, while the Class 1000 cleanroom showed slightly higher values of approximately 20.6°C–21.0°C. Relative humidity remained relatively stable in both areas, ranging from about 45% to 49%, indicating that the environmental conditions were well controlled during the measurements. The limited spatial variation in temperature and relative humidity also supports the assumption of stable and nearly isothermal operating conditions used in the CFD analysis.
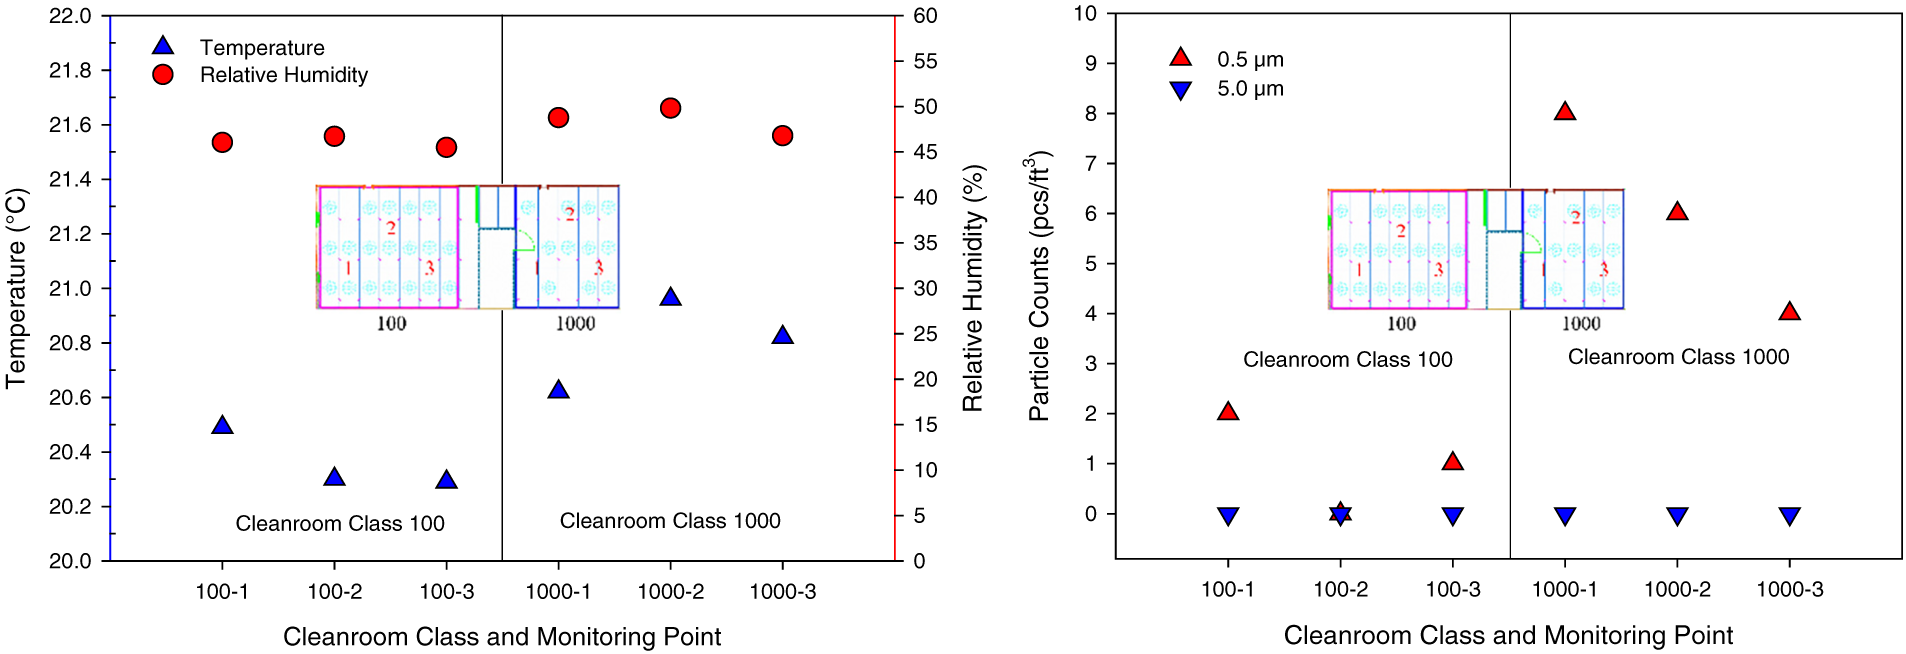
Figure 4: Measurement results of temperature, relative humidity, and particle counts.
For airborne particles, the concentration of 0.5 μm particles in the Class 100 cleanroom was very low, ranging from approximately 0 to 2 particles/ft3. In comparison, the Class 1000 cleanroom exhibited higher concentrations of approximately 4–8 particles/ft3, which is consistent with the lower cleanliness requirement of this zone. Among the Class 1000 monitoring points, the highest concentration was observed at point 1000-1, followed by a gradual decrease toward point 1000-3, suggesting some spatial variation in particle distribution. In contrast, 5.0 μm particles were not detected at any monitoring point in either cleanroom. Overall, the results demonstrate stable thermal conditions and a clear difference in particle cleanliness between the two cleanroom classes.
3.3 Case A—Raised Floor Height Evaluation
Case A evaluates the influence of raised floor height on airflow distribution in Class 100 and Class 1000 cleanroom zones. Three raised floor heights were investigated: 400, 600, and 800 mm. The FFU supply velocity was fixed at 0.3 m/s to isolate the effect of raised floor height on vertical airflow behavior, underfloor return airflow, turbulent intensity, and local recirculation near the shared return air chamber. Fig. 5 shows the air velocity and turbulent intensity distributions under different raised floor heights. At a raised floor height of 400 mm, the limited underfloor space restricted the return airflow path and increased airflow resistance near the raised floor and return chamber. This condition produced stronger airflow deviation from the vertical direction and higher turbulent intensity inside the occupied cleanroom zone compared with the 600 and 800 mm cases. The turbulent intensity in the main cleanroom region was mostly low, but broader local regions increased to approximately 3%–6%, with higher values near the return path and upper return region. This indicates that insufficient raised floor height can disturb the downward airflow pattern and promote local mixing within the clean zone.
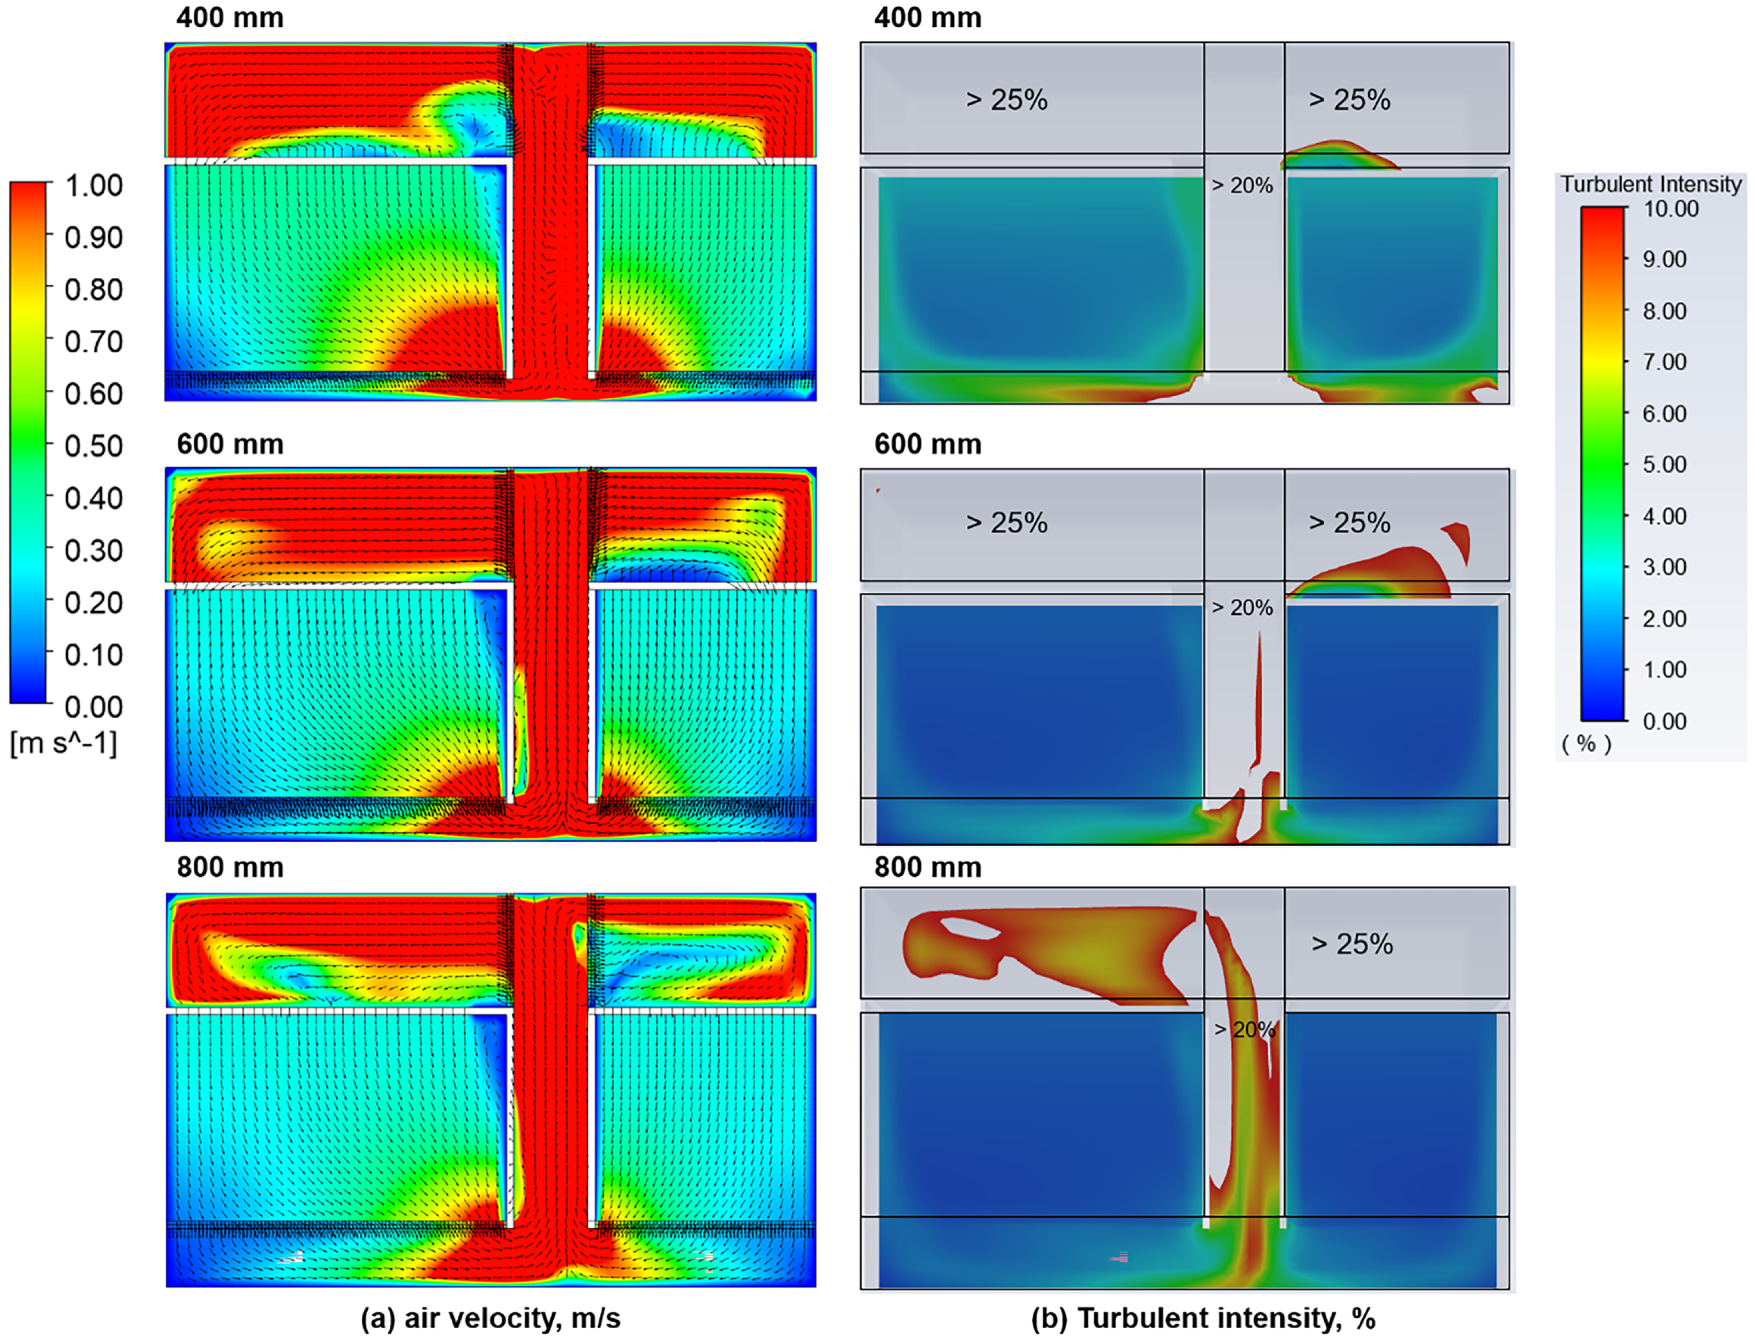
Figure 5: Air velocity and turbulent intensity distribution under different raised floor heights.
When the raised floor height was increased to 600 mm, the airflow distribution became more stable. The velocity vectors showed better vertical alignment in the working zone, and the return airflow beneath the raised floor became smoother. The turbulent intensity inside the occupied cleanroom zone was reduced and mostly remained within the low range, approximately 0%–2%. High-turbulence regions were mainly limited to the return path and upper plenum region, where airflow changed direction. This result indicates that the 600 mm raised floor provided sufficient underfloor space to reduce return airflow resistance and improve airflow stability in the cleanroom.
At 800 mm, the occupied cleanroom zone also maintained low turbulent intensity and stable downward airflow. Although the larger underfloor space further reduced airflow restriction, the improvement compared with the 600 mm case was limited. Local high-turbulence regions still appeared near the shared return chamber and upper return region, suggesting that increasing the raised floor height beyond a certain level does not proportionally improve the overall airflow structure. In practical design, an excessive raised floor height may also require greater construction space and design allowance.
Overall, the results show that raised floor height affects both airflow uniformity and turbulent intensity. The 400 mm case produced higher turbulent intensity inside the cleanroom and stronger local airflow deviation due to restricted return airflow. The 600 and 800 mm cases reduced turbulent intensity in the occupied cleanroom zone and improved return airflow stability. However, because the improvement from 600 to 800 mm was limited, the 600 mm raised floor height was selected as a practical and balanced configuration for the subsequent FFU velocity evaluation.
3.4 Case B—Supply Air Velocity Evaluation
Case B evaluates the influence of FFU supply velocity on airflow distribution and turbulent intensity in the semiconductor cleanroom. Based on the raised floor height selected from Case A, three FFU supply velocities were investigated: 0.3, 0.4, and 0.5 m/s. The purpose of this case was not to define a universal optimal velocity, but to clarify how different supply velocities affect downward airflow stability, return airflow behavior, and local turbulence under the present as-built cleanroom configuration. Fig. 6 shows the air velocity and turbulent intensity distributions under different FFU supply velocities. At 0.3 m/s, the downward airflow was relatively weak, and local airflow deviation was observed near the shared return air chamber and lower return region. The turbulent intensity in the occupied cleanroom zone remained generally low, but localized disturbance appeared near the return path where the airflow changed direction. This indicates that a lower FFU velocity may be suitable for less obstructed or lower-risk conditions, but it may provide weaker control of local airflow deviation.
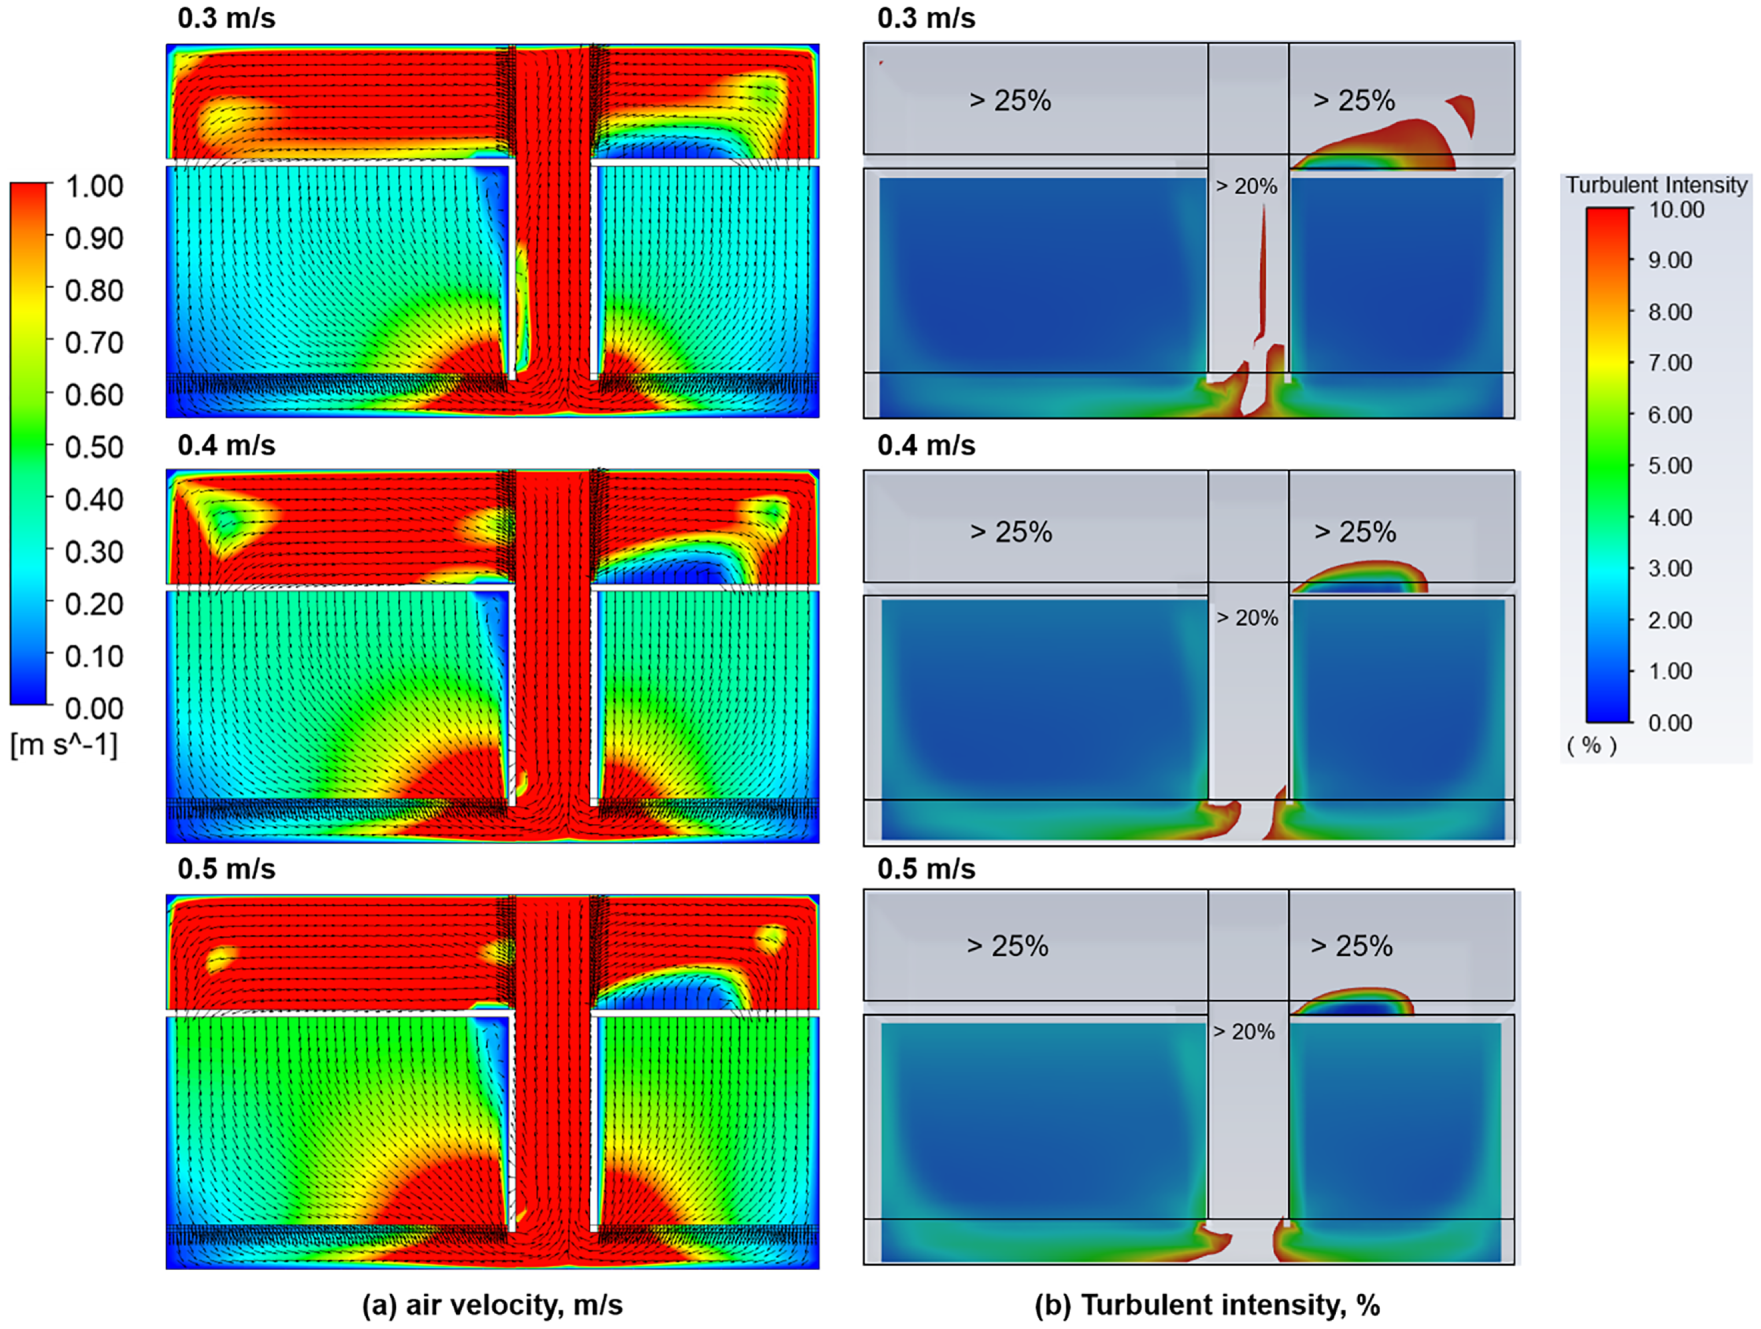
Figure 6: Air velocity and turbulent intensity distribution under different FFU supply velocities.
When the FFU supply velocity was increased to 0.4 m/s, the downward airflow became more stable and showed better vertical alignment in the working zone. The turbulent intensity in the main cleanroom region remained low, while higher turbulence was mainly confined to the return path and upper plenum area. This result suggests that an intermediate velocity can improve airflow directionality under the present unoccupied cleanroom configuration without causing strong turbulence in the occupied zone.
At 0.5 m/s, the downward airflow became stronger, but the improvement in airflow uniformity was not proportional to the increase in velocity. Some local regions near the lower return path and occupied zone showed slightly higher turbulent intensity, suggesting that excessive supply momentum may introduce additional local mixing. Therefore, increasing FFU velocity should be applied carefully because higher airflow rate may increase turbulence and fan energy consumption without necessarily improving contamination control.
Overall, the results indicate that FFU supply velocity should be selected according to the actual operating condition rather than treated as a universal fixed value. For an empty or less obstructed cleanroom, a lower or intermediate velocity may be sufficient. However, when process equipment, heat sources, personnel movement, or critical contamination sources are present, a higher velocity may be required to maintain stable downward airflow and protect the process zone. Therefore, the practical design implication is that the FFU velocity should be adjusted and verified based on site-specific cleanroom conditions using field measurement, smoke visualization, particle monitoring, or further CFD analysis.
Fig. 7 shows the pressure distribution under different FFU supply velocities. In general, all three cases show a similar pressure pattern, indicating that the overall pressure field is mainly governed by the shared return air chamber and raised floor configuration. The pressure remains relatively high in the lower region near the perforated raised floor and return airflow path, while lower pressure regions are observed near the upper cleanroom and ceiling plenum areas.
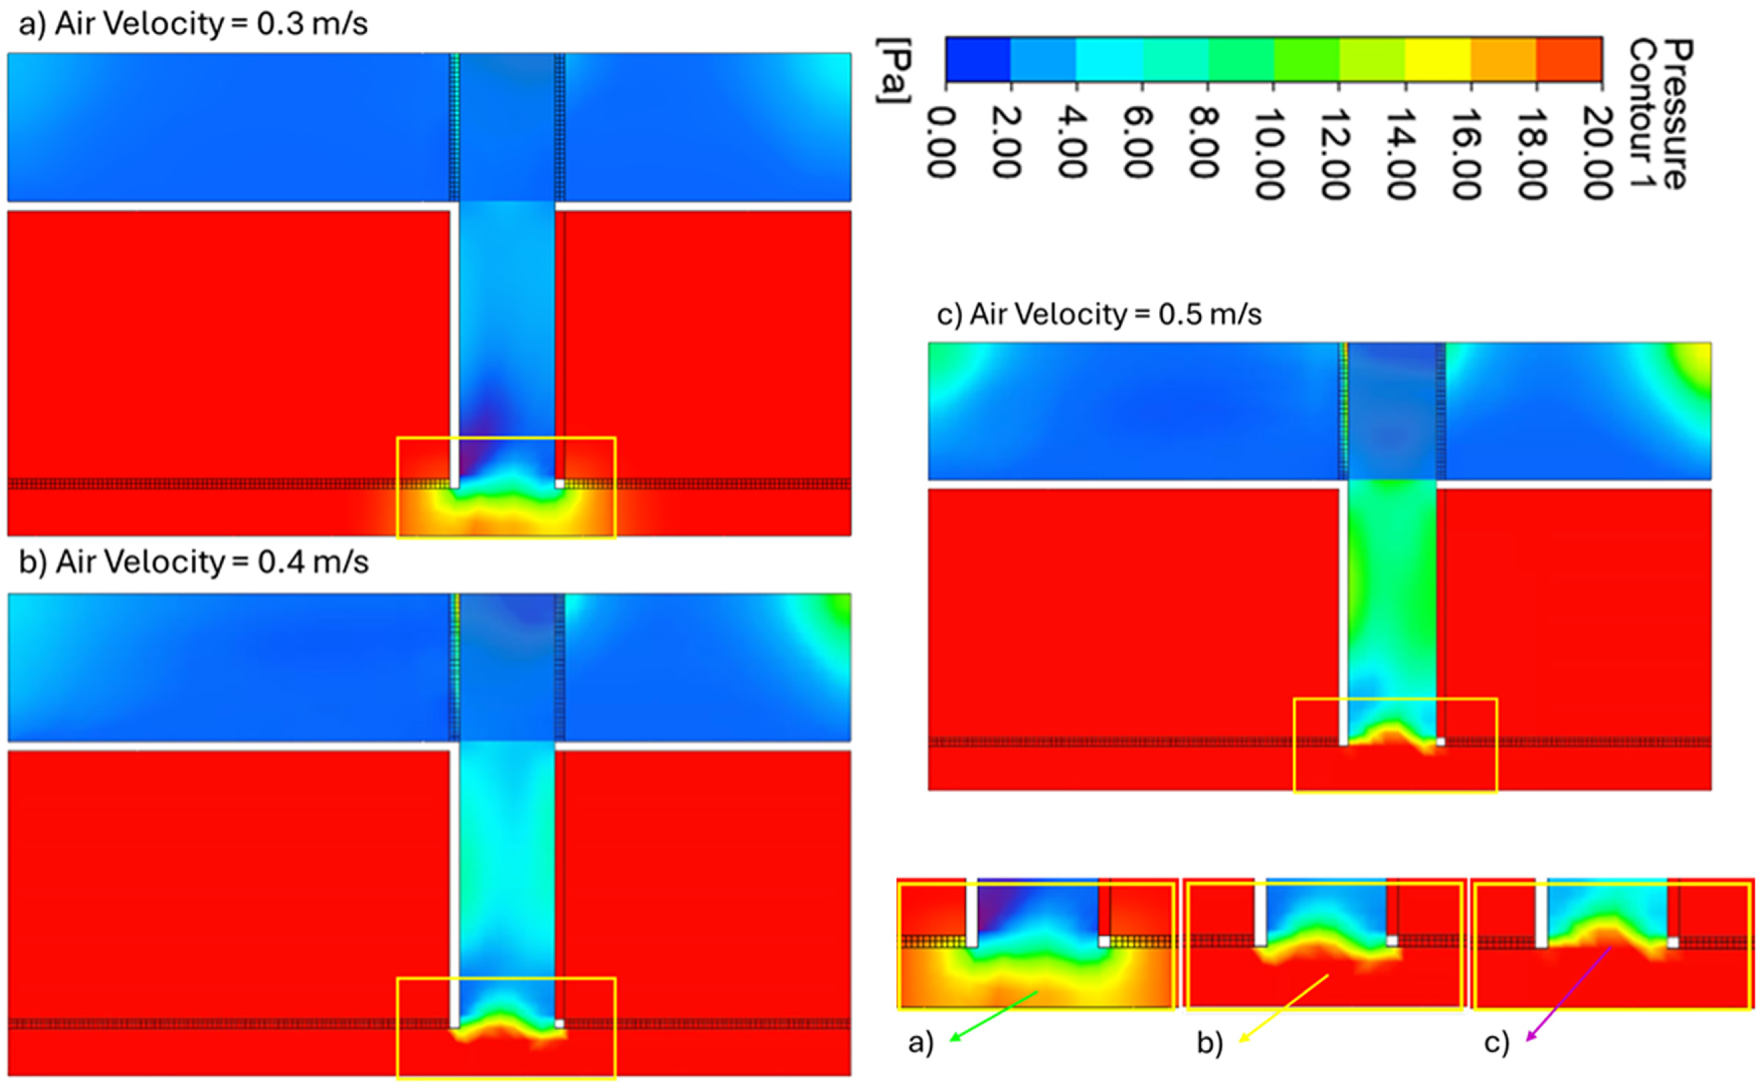
Figure 7: Pressure distribution under different FFU supply velocities.
At an FFU velocity of 0.3 m/s, the pressure gradient near the return air chamber is relatively weak. When the supply velocity increases to 0.4 m/s, the pressure magnitude near the raised floor and return air chamber becomes slightly higher, indicating stronger airflow movement toward the return path. A further increase to 0.5 m/s produces a similar pressure distribution, with only a marginal increase in pressure intensity.
The zoomed contour views highlight the pressure behavior beneath the raised floor and near the shared return air chamber. Although the pressure magnitude increases slightly with higher FFU velocity, the overall contour shape remains relatively stable. This indicates that changing the FFU supply velocity from 0.3 to 0.5 m/s does not significantly alter the pressure distribution pattern. Instead, the raised floor and shared return air chamber configuration play a stronger role in determining the pressure field.
Overall, the results suggest that increasing FFU velocity mainly strengthens airflow movement but does not substantially change the pressure distribution structure. Therefore, excessive increase in supply velocity may not provide significant additional benefits for pressure balance, while it may increase fan energy consumption. This supports the selection of an intermediate FFU velocity as a more balanced operating condition.
3.5 FFU Power and Energy Consumption
Table 3 presents the estimated airflow rate and electrical power consumption of the 31 FFUs under the low-, medium-, and high-velocity operating conditions. The power consumption was calculated using the average outlet velocity of each FFU, an external static pressure of 160 Pa, and an overall efficiency of 45%. The total FFU power increased from 2.60 kW under the low-velocity condition to 3.39 kW under the intermediate-velocity condition and 4.18 kW under the high-velocity condition. This trend indicates that increasing the FFU outlet velocity increases the airflow rate and the corresponding electrical power requirement.
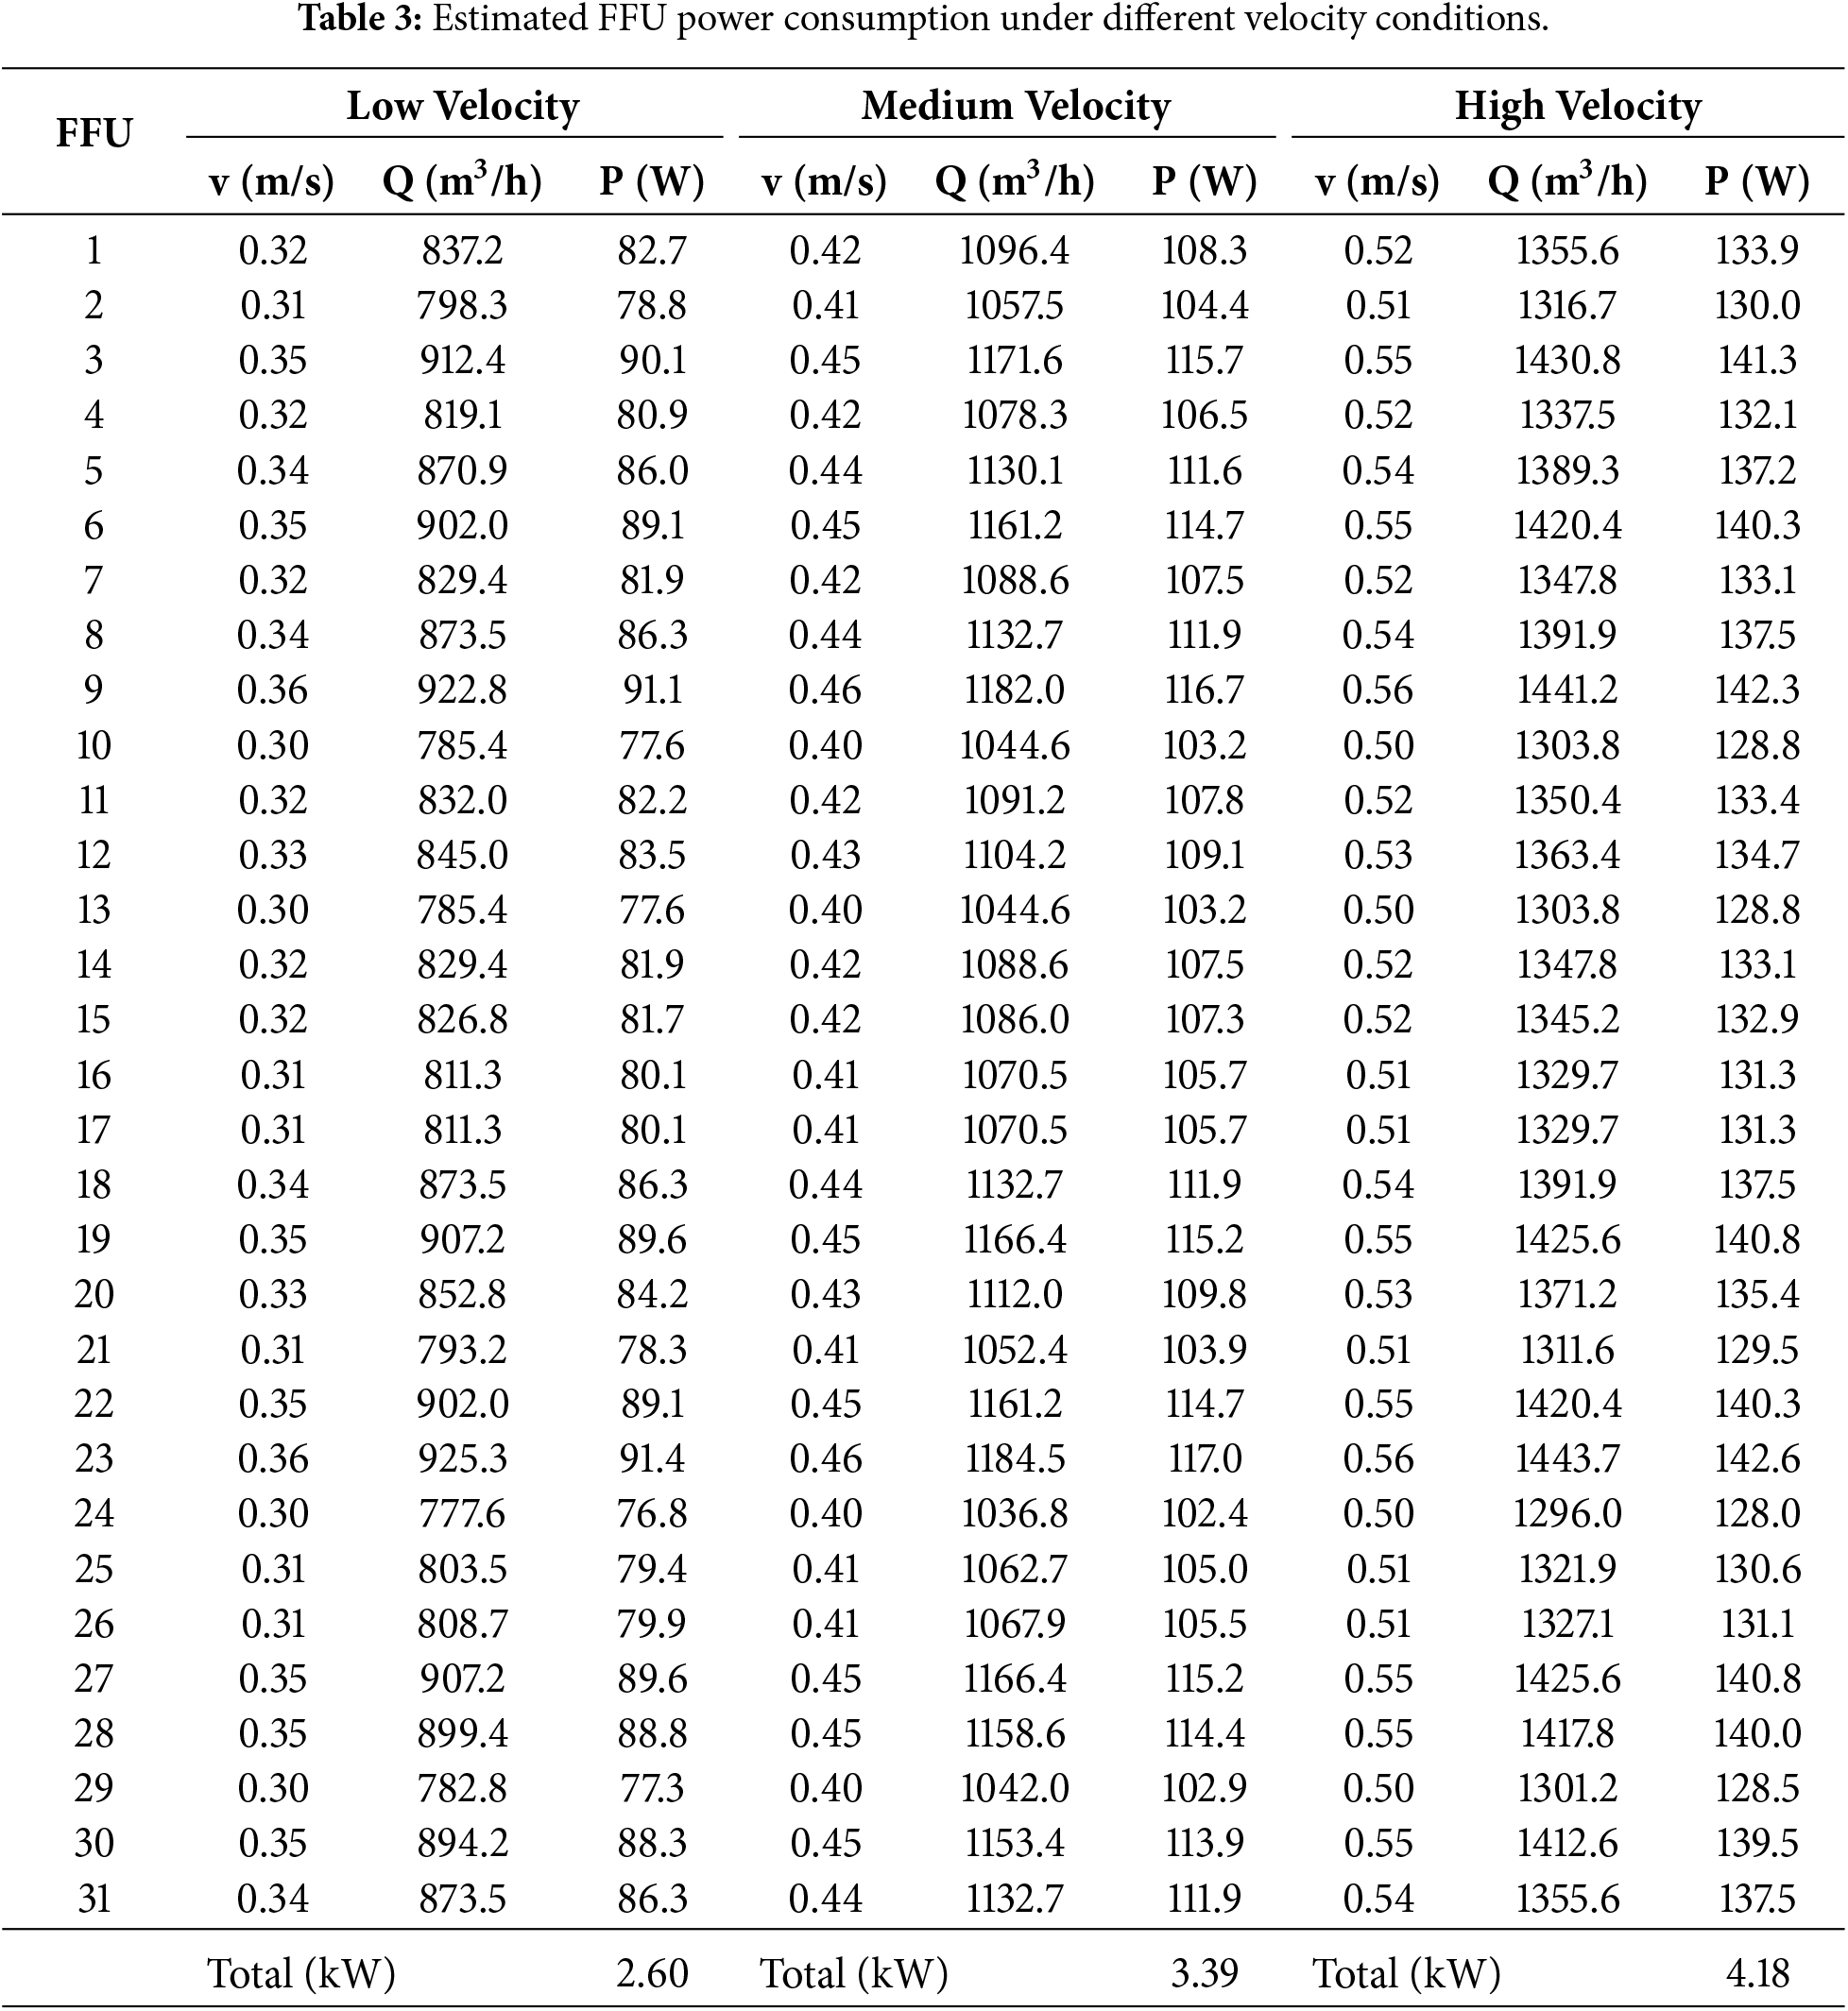
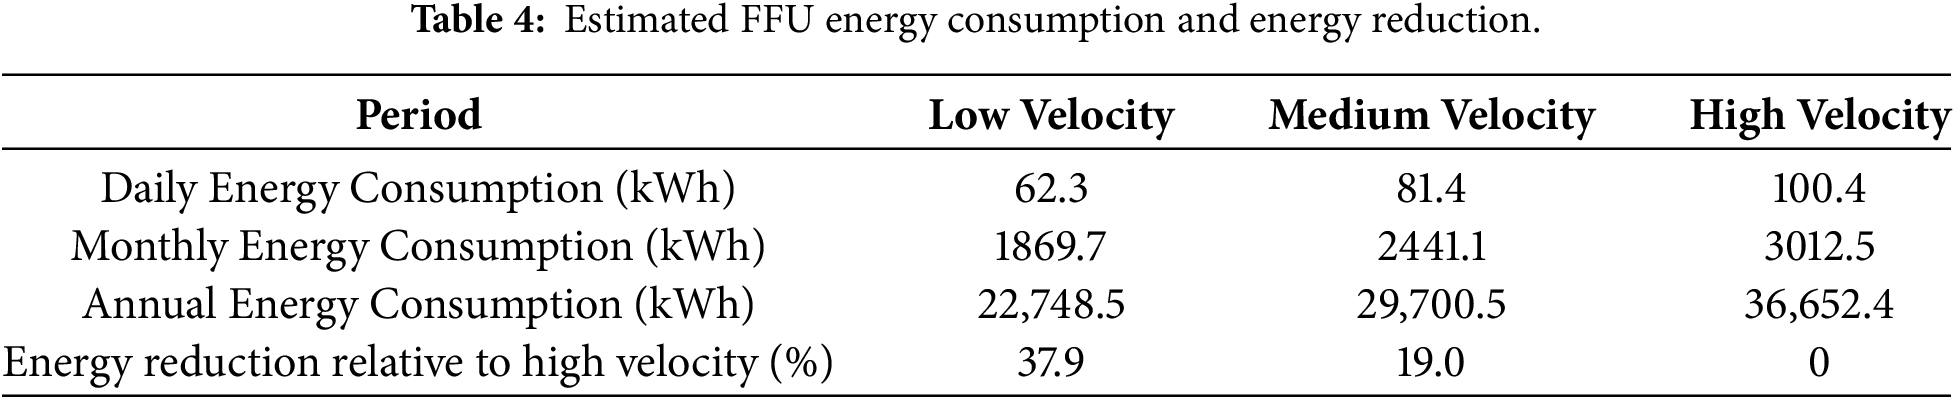
Table 4 summarizes the estimated daily, average monthly, and annual FFU energy consumption based on continuous operation. The annual energy consumption was estimated at 22,748.5 kWh for the low-velocity condition, 29,700.5 kWh for the intermediate-velocity condition, and 36,652.4 kWh for the high-velocity condition. Compared with the high-velocity condition, the low- and intermediate-velocity conditions reduced annual FFU energy consumption by approximately 37.9% and 19.0%, respectively.
3.6 Practical Design Implications
The results provide several practical implications for semiconductor cleanroom design and operation. The raised-floor height should be considered not only as a structural parameter but also as an airflow-control parameter. A limited raised-floor height, such as 400 mm, restricts the underfloor return-air pathway, increases airflow resistance, and produces higher turbulence intensity in the cleanroom. Increasing the raised-floor height to 600 mm reduces return-air resistance and improves airflow stability. However, the improvement from 600 to 800 mm was limited, indicating that excessive floor height may not provide proportional airflow benefits and may require additional construction space.
In addition, FFU supply velocity should not be selected only by increasing airflow rate. Although a higher FFU velocity strengthens downward airflow, it may also increase local turbulence and fan energy consumption. Therefore, the suitable FFU velocity should be determined according to the actual cleanroom operating condition, including equipment layout, heat load, personnel activity, obstruction, contamination-source location, and cleanliness requirement. For empty or less obstructed cleanrooms, a lower or intermediate velocity may be sufficient, while higher velocities may be required when process equipment or contamination sources are present.
From an energy perspective, reducing the FFU operating velocity can substantially decrease electricity consumption. In the present 31-FFU system, reducing the operating condition from the high-velocity case to the intermediate-velocity case lowered the estimated annual energy consumption by approximately 6951.9 kWh, equivalent to 19.0%. A further reduction to the low-velocity condition decreased annual energy consumption by approximately 13,903.9 kWh, corresponding to 37.9% relative to the high-velocity condition. These results indicate that a relatively small reduction in FFU velocity can produce considerable energy savings when applied across a large cleanroom system containing many continuously operating units. Similar HVAC studies have emphasized that operating strategies should balance energy reduction with the required environmental performance rather than being selected solely on the basis of minimum energy consumption [26]. Therefore, the appropriate FFU velocity should be determined by considering cleanliness requirements, process applications, equipment layout, contamination risk, and actual cleanroom operating conditions.
This study applied field-validated CFD analysis to evaluate the effects of raised-floor height and FFU supply velocity in a dual-zone semiconductor cleanroom with a shared return-air chamber. For the Raised Floor Analysis (Case A), three raised-floor heights, 400, 600, and 800 mm, were evaluated to assess their impact on airflow distribution and velocity uniformity throughout the cleanroom. At 400 mm, the restricted underfloor plenum limits return airflow distribution and causes local recirculation near the return chamber. Increasing the raised floor height to 600 mm improves underfloor airflow balance and promotes a more vertically aligned flow pattern in the clean zone. However, further increasing the height to 800 mm does not provide additional improvement and may introduce unnecessary plenum volume and local flow instability. Therefore, the 600 mm raised floor height provides the best balance between airflow uniformity, return airflow stability, and practical design efficiency.
For Case B, nominal FFU supply velocities of 0.3, 0.4, and 0.5 m/s were evaluated. Increasing the velocity strengthened the downward airflow, but the improvement in airflow uniformity was not proportional to the airflow increase. Higher velocity also produced greater local turbulence and increased estimated FFU energy consumption. For the 31-FFU system, the estimated annual energy consumption was 22,748.5 kWh under the low-velocity condition, 29,700.5 kWh under the medium-velocity condition, and 36,652.4 kWh under the high-velocity condition. The low- and medium-velocity cases therefore reduced estimated annual energy consumption by 37.9% and 19.0%, respectively, relative to the high-velocity cases.
These results demonstrate that reducing FFU velocity can provide substantial energy savings when applied across a large cleanroom system. However, the operating velocity should not be selected solely according to energy consumption, as cleanliness requirements, process conditions, equipment layout, contamination risk, and airflow stability must also be considered. Future research should extend the present analysis by incorporating particle transport, equipment and personnel obstructions, internal heat loads, additional raised-floor and perforation configurations, and direct measurement of FFU electrical power under occupied operating conditions. Such investigations would provide a more comprehensive assessment of the relationship between airflow performance, contamination control, and energy consumption in semiconductor cleanrooms.
Acknowledgement: None.
Funding Statement: The authors received no specific funding for this study.
Author Contributions: The authors confirm their contributions to the paper as follows: study conception and design: Indra Permana; data collection: Indra Permana and Zulvi Alfiqri Hidayatulloh; CFD modeling and validation: Indra Permana and Zulvi Alfiqri Hidayatulloh; analysis and interpretation of results: Indra Permana and Pramod Vishwakarma; manuscript preparation: Indra Permana; manuscript review and editing: Alya Penta Agharid and Pramod Vishwakarma. All authors reviewed and approved the final version of the manuscript.
Availability of Data and Materials: Data available on request from the authors.
Ethics Approval: Not applicable.
Conflicts of Interest: The authors declare no conflicts of interest.
References
1. Den W, Hu SC, Garza CM, Ali Zargar O. Review—Airborne molecular contamination: recent developments in the understanding and minimization for advanced semiconductor device manufacturing. ECS J Solid State Sci Technol. 2020;9(6):064003. doi:10.1149/2162-8777/aba080. [Google Scholar] [CrossRef]
2. Peng T, Kellens K, Tang R, Chen C, Chen G. Sustainability of additive manufacturing: an overview on its energy demand and environmental impact. Addit Manuf. 2018;21(6):694–704. doi:10.1016/j.addma.2018.04.022. [Google Scholar] [CrossRef]
3. Xu T. Characterization of minienvironments in a clean room: design characteristics and environmental performance. Build Environ. 2007;42(8):2993–3000. doi:10.1016/j.buildenv.2006.10.020. [Google Scholar] [CrossRef]
4. ISO 14644-1:2015. Cleanrooms and associated controlled environments: part 1: classification of air cleanliness by particle concentration. Geneva, Switzerland: International Organization for Standardization; 2015. [Google Scholar]
5. Chen XW, Li Z, Bao BC, Lin ZP. Experimental study on influence of resistance of HEPA/ULPA filter on energy and aerodynamic performance of fan filter unit (FFU). In: Proceedings of the 6th International Conference on Energy and Environment of Residential Buildings (ICEERB 2014); 2014 Nov 8–10; Zhengzhou, China. p. 16. doi:10.1049/cp.2014.1604. [Google Scholar] [CrossRef]
6. Khoo CY, Lee CC, Hu SC. An experimental study on the influences of air change rate and free area ratio of raised-floor on cleanroom particle concentrations. Build Environ. 2012;48:84–8. doi:10.1016/j.buildenv.2011.09.001. [Google Scholar] [CrossRef]
7. Whyte W, Whyte WM, Ward S, Agricola K. Ventilation effectiveness in cleanrooms and its relation to decay rate, recovery rate, and air change rate. Eur J Parenter Pharm Sci. 2018;23(4):126–34. doi:10.1080/14733315.2014.11684049. [Google Scholar] [CrossRef]
8. Cheng M, Liu GR, Cai KYLWJ, Lee EL. Approaches for improving airflow uniformity in unidirectional flow cleanrooms. Build Environ. 1998;34(3):275–84. doi:10.1016/S0360-1323(98)00028-6. [Google Scholar] [CrossRef]
9. Wang F, Permana I, Lee K, Rakshit D, Rosulindo PP. Improvement of airflow distribution and contamination control for a biotech cleanroom. Atmosphere. 2022;13(2):335. doi:10.3390/atmos13020335. [Google Scholar] [CrossRef]
10. Kircher K, Shi X, Patil S, Zhang KM. Cleanroom energy efficiency strategies: modeling and simulation. Energy Build. 2010;42(3):282–9. doi:10.1016/j.enbuild.2009.09.004. [Google Scholar] [CrossRef]
11. Chang L, Luo WJ, Permana I, Prasetyo BY, Agharid AP, Wang F. Energy-efficient air conditioning system with combined a ceiling fan for thermal comfort in an office. Energy. 2025;122(5):1771–87. doi:10.32604/ee.2025.062209. [Google Scholar] [CrossRef]
12. Xia Y, Bulinska A, Ma L, Toftum J, Bivolarova MP. Optimized air distribution for contaminant control in a cleanroom: a numerical study. E3S Web Conf. 2025;672(10):01010. doi:10.1051/e3sconf/202567201010. [Google Scholar] [CrossRef]
13. Huang Z, Zeng C, Wang Z, Lu J, Xiang Q, Huo X, et al. Optimizing vertical unidirectional airflow in cleanrooms: an integrated approach to floor perforation, plenum, and fan filter unit configurations. Atmosphere. 2025;16(6):632. doi:10.3390/atmos16060632. [Google Scholar] [CrossRef]
14. Tang C, Liang T, Vafai K. Dispersion of particles and airflow optimization for a semiconductor cleanroom. J Aerosol Sci. 2025;186(18):106570. doi:10.1016/j.jaerosci.2025.106570. [Google Scholar] [CrossRef]
15. Permana I, Agharid AP, Wang F. Performance improvement through CFD and field measurement in a unidirectional airflow cleanroom for wafer manufacture. J Build Eng. 2025;100:111715. doi:10.1016/j.jobe.2024.111715. [Google Scholar] [CrossRef]
16. Yang Z, Hao Y, Shi W, Shao X, Dong X, Cheng X, et al. Field test of pharmaceutical cleanroom cleanliness subject to multiple disturbance factors. J Build Eng. 2021;42(2):103083. doi:10.1016/j.jobe.2021.103083. [Google Scholar] [CrossRef]
17. ASHRAE. ASHRAE design guide for cleanrooms: fundamentals, systems, and performance. Atlanta, GA, USA: ASHRAE; 2017. [Google Scholar]
18. Permana I, Agharid AP, Singh N, Wang F. Full-scale evaluation of FFU configurations in an optical cleanroom injection molding for improving thermal performance and contaminant removal. Case Stud Therm Eng. 2024;61(4):105076. doi:10.1016/j.csite.2024.105076. [Google Scholar] [CrossRef]
19. Yao C, Seungjae L, Dongbin H, Taesung K. Numerical modelling on dispersion behavior of particulate contamination induced by a moving operator in a semiconductor cleanroom: a eulerian-eulerian method. J Build Eng. 2024;96(11):110409. doi:10.1016/j.jobe.2024.110409. [Google Scholar] [CrossRef]
20. Gupta V, Verma SK, Anand S, Gupta N, Anand Y. Evaluation of thermal comfort and energy usage for an enclosed cavity indifferent climatic zones of India. Energy Eng. 2021;118(5):1317–31. doi:10.32604/ee.2021.016732. [Google Scholar] [CrossRef]
21. Liu K, Hao M, Li B, Guan T, Chen S, Wang G, et al. Optimization on flow field in an operational cleanroom subject to kinematic component and structural parameters. J Build Eng. 2022;59(11):105152. doi:10.1016/j.jobe.2022.105152. [Google Scholar] [CrossRef]
22. Eslami J, Abbassi A, Saidi MH, Bahrami M. Effect of supply/exhaust diffuser configurations on the contaminant distribution in ultra clean environments: eulerian and Lagrangian approaches. Energy Build. 2016;127:648–57. doi:10.1016/j.enbuild.2016.06.028. [Google Scholar] [CrossRef]
23. Çoşgun A, Gündüztepe O. CFD-based Lagrangian multiphase analysis of particulate matter transport in an operating room environment. Processes. 2025;13(8):2507. doi:10.3390/pr13082507. [Google Scholar] [CrossRef]
24. Lin T, Ali Zargar O, Lee TC, Sabusap DL, Li JJ, Hu SC, et al. Flow analysis of a front opening unified pod (FOUP) subjected to different fan filter unit (FFU) coverage area in mini-environment. Int J Thermofluids. 2021;12(2):100124. doi:10.1016/j.ijft.2021.100124. [Google Scholar] [CrossRef]
25. Air Clean Deviser Taiwan (ACDT). FFU EC standard type [Internet]. [cited 2026 Jun 18]. Available from: https://www.acdt.com.tw/ffu-ec-standard-type. [Google Scholar]
26. Agharid AP, Permana I, Chang L, Luo YH, Wang F. Impact of duty cycling HVAC systems on thermal comfort, energy consumption, and operational costs. Energy. 2025;122(9):3839–66. doi:10.32604/ee.2025.068586. [Google Scholar] [CrossRef]
Cite This Article
 Copyright © 2026 The Author(s). Published by Tech Science Press.
This work is licensed under a Creative Commons Attribution 4.0 International License , which permits unrestricted use, distribution, and reproduction in any medium, provided the original work is properly cited.
 Downloads
 Citation Tools
